Article

An Operational Capacity Assessment Method for an Urban Low-Altitude Unmanned Aerial Vehicle Logistics Route Network

1
College of Civil Aviation, Nanjing University of Aeronautics and Astronautics, Nanjing 211106, China
2
National Key Laboratory of Air Traffic Flow Management, Nanjing University of Aeronautics and Astronautics, No. 29 General Avenue, Nanjing 211106, China
3
College of Mathematics, Nanjing University of Aeronautics and Astronautics, Nanjing 211106, China
*
Author to whom correspondence should be addressed.
Drones 2023, 7(9), 582; https://doi.org/10.3390/drones7090582
Submission received: 12 August 2023 / Revised: 1 September 2023 / Accepted: 12 September 2023 / Published: 15 September 2023
(This article belongs to the Section Innovative Urban Mobility)

Abstract

:
The Federal Aviation Administration introduced the concept of urban air mobility (UAM), a new three-dimensional transport system that operates with a fusion of manned/unmanned aerial vehicles on an urban or intercity scale. The rapid development of UAM has brought innovation and dynamism to many industries, especially in the field of logistics. Various types of unmanned aerial vehicles (UAVs) for use in transport logistics are being designed and produced. UAV logistics refers to the use of UAVs, usually carrying goods and parcels, to achieve route planning, identify risk perception, facilitate parcel delivery, and carry out other functions. This research provides a method for assessing the operational capacity of a UAV logistics route network. The concept of “logistics UAV route network operation capacity” is defined, and a bi-objective optimization model for assessing the route network’s operating capacity is developed. The first objective is to maximize the number of UAV logistics delivery plans that can be executed in a fixed operation time. The second objective is to minimize the total operational impedance value in a fixed operation time. To solve the bi-objective optimization model, the Non-dominated Sorting Genetic Algorithm-II (NSGA-II) is utilized. A UAV logistics route network with 62 nodes is developed to assess the rationale and validity of the proposed concept. The experiments show that with an increase in operation time, the route network’s optimal operational capacity gradually increases, the convergence speed of the algorithm slows down, and the optimization magnitude gradually reduces. Two key parameters—operational safety interval and flight speed—are further analyzed in the experiments. According to the experiments, as the safety interval increases, the route network’s average operational capacity steadily diminishes, as does its sensitivity to the safety interval. The average operational capacity steadily rose with the rise in flight speed, especially when the UAV logistics flight speed was between 10 m/s and 10.5 m/s. In that range, the operational capacity of the route network was substantially impacted by the flight speed.

1. Introduction

The increasing urban population has caused traffic congestion and environmental pollution to become increasingly serious, especially in mega-cities such as New York, Shanghai, and Tokyo. Traditional urban transport and facilities are becoming increasingly inadequate to meet the growing demand. In recent years, with the continuous improvements in science and technology, the development of urban transport has trended toward green, intelligent, and sustainable features. In 2018, the Federal Aviation Administration (FAA) proposed the urban air mobility (UAM) concept, based on the small aircraft transportation system (SATS) [1,2]. The development of UAM has been considered as an innovative solution to alleviate urban ground traffic congestion and improve transportation capacity.
Vertical takeoff and landing aircraft, such as electric vertical takeoff and landing (eVTOL) aircraft, rotor unmanned aerial vehicles (rotor UAVs), and helicopters, will be the leading examples of UAM. For specific application scenarios, different configurations of vertical takeoff and landing aircraft will be combined to operate in low-altitude urban airspace. In particular, the demand for UAV logistics is strong, and the market is vast. UAV logistics is a new type of transport that uses UAVs for package delivery.
Amazon Prime Air, Flytrex, UPS Flight Forward, and other services have begun to develop UAV logistics projects, one after another. Zipline has become a globally known company for scaling UAV logistics operations. Unlike companies such as Amazon, Zipline focuses on the delivery of medical supplies, especially in East Africa. To date, Zipline has successfully delivered blood packs to 21 hospitals within 75 km in Rwanda [3]. Meanwhile, DHL Express has partnered with EHang Command to propose a fully automated UAV logistics solution for the last mile of logistics delivery in China [4]. The MarketsandMarkets company predicts that the market for the use of UVA logistics in transportation will reach USD 17 billion by 2030 [5].

2. Related Works

(1)
Application of UAVs in logistics
UAVs were initially invented and produced as military products because of their flexibility, economy, and unmanned facility. The application of UAVs gradually expanded to civilian fields, including logistics, rescue operations, healthcare, and agriculture. UAVs display excellent advantages in addressing the last-mile delivery problem, especially in urban scenarios [6]. Pina-Pardo et al. pointed out that in addressing the traveling salesman problem, the application of UAVs could reduce delivery times by at least 20% [7]. However, due to the limitation of battery performance, the service range of UAVs is relatively limited. Coindreau et al. proposed a truck-and-UAV solution to expand the service range, which reduced delivery times by 34% compared to truck-only deliveries [8]. However, the implementation of UAV logistics as an innovative logistics model has some barriers and constraints. Sah et al. stated that regulations and threats to privacy and security are the key factors that constrain the implementation of delivery via UAVs [9]. Sandbrook raised concerns about the safety of UAV users’ data [10]. In addition, the emission problems, noise problems, and environmental issues brought about by UAV-logistics applications have been discussed [11,12,13].
(2)
Operation and management of UAV logistics
The rapid development of UAV logistics has raised the need for requirements for its management. The current research on the operational management of UAV logistics mainly includes path planning, airport landing and takeoff layout, delivery-mode design, and operational environment planning. For UAV logistics path planning, a collision free path planning algorithm based on the A* algorithm, was proposed by Shi et al. after taking into account the dynamic and random characteristics of the operation environment of UAV logistics. This algorithm achieved an average planning time of 19.45 s when the distribution demand was 5000, and the collision probability rose as the distribution demand continued to rise [14]. Duan et al. identified capacity limitation as the primary issue with the UAV logistics system, combined the memetic algorithm and variable neighborhood descent, proposed a logistics UAV path optimization method, and carried out simulation experiments based on real geographic environments to carry on the logistics UAV path planning for four logistics UAVs to fulfill 200 delivery demands [15]. Zhao et al. suggested a 3D logistics UAV path planning approach based on the APF–RRT* algorithm and contrasted it with the conventional RRT and RRT* algorithms, demonstrating that the proposed APF–RRT* algorithm performed at its best in terms of planning effect and planning time [16]. For logistics UAV landing and takeoff airport layout, based on actual geographic information for San Francisco, Shavarani et al. integrated the logistics costs associated with UAV takeoff and landing, charging, and UAV purchasing, and presented a logistics UAV takeoff and landing airport and charging station layout concept [17]. German et al. presented a small parcel delivery scheme utilizing eVTOL to deliver from a warehouse in Tracy, California, to the San Francisco Bay Area as a scenario, and presented a logistics UAV takeoff and landing field layout scheme with the goal of maximizing delivery demand [18]. Hong et al. established a mixed integer planning model for logistics UAV charging equipment layout by considering the influence of obstacles on the operation capability of logistics UAVs, and carried out a large-scale simulation experiment in Phoenix City to test the efficacy of the suggested model and methodology [19]. For logistics UAV delivery mode design, Brunner suggested a mode of delivering goods to customers’ balconies by logistics UAVs for the last mile of express transportation in urban areas, using GPS to assist logistics UAVs to reach the vicinity of delivery locations, and then using visual navigation equipment to lock the exact delivery location [20]. Li et al. developed a path optimization model for the collaborative delivery of vehicles and UAVs for emergency logistics delivery scenarios and experimentally demonstrated that the collaborative delivery model can effectively improve timeliness and customer satisfaction [21]. For logistics UAV operation environment planning scale operation, Li et al. proposed a logistics UAV route network planning approach based on improved cellular automata and the best-spanning tree algorithm. They also created a route network covering 378 distribution requirements [22]. Salleh et al. established three configurations of urban low-altitude route networks based on a regional scenario in Singapore for UAM development requirements [23].
(3)
Airspace capacity assessment
The rapid development of UAV logistics brings challenges to low-altitude airspace management. Considering the expected development tendency of large-scale and routine logistics UAV operations, an urban low-altitude airspace capacity assessment study is critical for ensuring the safe and efficient operation of logistics UAVs. The early airspace capacity assessment studies focused on runways and terminal areas, and mathematical modeling was adopted as the main research method. Bowen and Pearcy proposed a Poisson distribution-based airport runway arrival flow model with reference to ground traffic flow models, which provides a foundation for airport capacity assessment [24]. Janic and Tosic pioneered the establishment of a terminal area capacity assessment model [25]. Computer technology began to develop rapidly in the 20th century, which provided new ideas for airspace capacity assessment research. SIMMOD, RAMS, and TAAM software have been developed to simulate the operation of airports, sectors, and other airspace structures, further improving the reliability and precision of airspace capacity assessment [26,27]. In recent years, data mining and machine learning techniques have become prevalent, and intelligent algorithms have been applied to airspace capacity assessment research [28]. However, the urban low-altitude airspace environment is more complex, and existing airspace capacity assessment methods are difficult to apply directly to low-altitude airspace. Because the aircraft operating in the urban low-altitude airspace environment are mainly vertical takeoff and landing aircraft, such as rotary-wing UAVs, eVTOL, and helicopters, and the operation and management modes are innovative, the well-established capacity assessment models for sector or terminal area operation are not applicable. Meanwhile, UAM is still in the developmental stage, and there is limited operational data from real-world scenarios for research. The current low-altitude airspace capacity assessment is mostly based on the control variable approach for large-scale simulation trials [29,30,31] to explore the influence of airspace structure [32], route network structure [23], operation interval [33], CNS [34] and other factors on the low-altitude airspace capacity.
To sum up, some outcomes have been achieved with the development of UAM and logistics UAVs. However, there are relatively few studies on low-altitude airspace management for large-scale logistics UAV operations. This paper proposed a capacity assessment method for logistics UAV route networks. The aim is to provide a foundation for the future normalized logistics UAV operation and to ensure the safety and efficiency of logistics UAVs. This paper presents a research methodology that combines mathematical modeling and simulation verification. The definition of logistics UAV route network operation capacity for the logistics UAV scale operation scenario is proposed, and the logistics UAV operation mode in urban regions is clarified. A methodology for assessing the capacity to operate a logistics UAV route network is developed, taking safety, cost, and noise into account. The route network covering 62 nodes was built to support the simulation experiments. Through multiple groups of comparison experiments, the two key parameters of logistics UAV operation interval and flight speed are analyzed with the evolution rule of the route network operation capacity.

3. Methodologies

A logistics UAV operation mode has been identified in this study. The multiobjective optimization model for logistics UAV flight route network capacity assessment is established based on the new operation mode. This model integrates the impact of safety, cost, and noise on logistics UAV operation by establishing the impedance function.

3.1. Problem Description

The present route network operation capacity assessment method is oriented to the high frequency, short distance, and multi-cycle urban logistics transportation and distribution needs, considering safety, noise, and cost factors during the logistics UAV operation, aiming to realize the effective assessment of urban logistics UAV delivery network operation capacity. This paper constructs a logistics UAV delivery scenario with reference to the operation mode of the CaiBird post, as shown in Figure 1. CaiBird post is a new type of logistics service platform in China that co-operates with many logistics companies. CaiBird service stations are usually built in neighborhoods, and different logistics companies deliver packages to the stations, where customers can choose to pick up the packages or have them delivered to their homes.
The route network is equipped with 2 public delivery centers (O1, O2) and 10 delivery stations Di (i = 1, 2, …, 7), divided into 2 service communities (CA, CB). Logistics UAVs fly along the route to complete the delivery plan, which consists of multiple directed segments. Each delivery center and delivery station is linked to at least one fly-in segment and one fly-out segment. Considering the demand for transferring and returning goods in the actual logistics transportation, delivery stations and delivery centers are provided with shipping and receiving functions. In order to simplify the calculation, the suggested approach for determining the operational capacity of the route network assumes:
  • Logistics UAVs operate within the specified communities; cross-regional delivery is not allowed, and the public delivery center is at the boundary of each service community and can provide services for multiple community logistics UAVs;
  • All logistics UAVs must operate at a steady speed along a predetermined path in accordance with the delivery plan, keeping a specific safety interval and not allowing any route changes in the middle of the flight. They are all identical in kind and consistent in their performance parameter settings;
  • Logistics UAVs are allowed to land or skip through any public distribution center or delivery station, and the public delivery center or delivery station can only provide service for one logistics UAV at the same time;
  • Logistics UAVs are required to complete takeoff and landing within the specified time, beyond which the delivery plan cannot be executed;
  • Ignoring the effect of weather on logistics UAV operations.

3.2. Modeling

3.2.1. Objective Functions

The operational capability of the route network is specified as the maximum logistics UAVs that can be served by all vertiports (including public delivery centers and delivery stations) within the route network in fixed operation time. In addition, it is necessary to consider the impact of safety, cost, and noise factors on logistics UAV operation.
(1)
The First Objective
Based on the above operation scenario, the logistics UAVs fly according to the delivery plan. The delivery plan defines the beginning and end vertiports as well as the routes to be flown. Therefore, the number of logistics UAV sorties that can be serviced by the vertiports is defined as the number of delivery plans that can be executed. The first objective of the model is to maximize the number of logistics UAV delivery plans that can be executed in the fixed operation time, as shown in formula (1). In this paper, the fixed operation time is set to 30 s, 60 s, 90 s, and 120 s to analyze the difference in the capacity of the route network at different fixed operation times:
M a x N = k = 1 K f ( n k )
where N represents the operation capacity, namely the greatest number of logistics UAV delivery plans that can be executed. n k represents the delivery plans that are requested to be executed within a fixed operation time. f ( n k ) represents the logistics UAV delivery plan as a 0–1 variable, as shown in formula (2):
f ( n k ) = 1 , delivery   plan   k   is   executed 0 , delivery   plan   k   is   not   executed
(2)
The Second Objective
Referring to the concept of road traffic impedance, consider safety, cost, and noise factors and establish an impedance function for the route network operation. The safety factor is the malfunctioning of the logistics UAVs, which then crash to the ground and cause injuries to people on the ground. The causes of logistics UAV malfunctions include system failures, operational errors, bird strikes, etc. The cost factor refers to the expenses incurred during the logistics UAV operation process, which are mainly related to the flight time and package weight. The longer the flight time and the heavier the package, the higher the cost impedance. The noise factor is the sound produced by the interaction between the rotor rotation and the air during the logistics UAV operation, and the lower the flight altitude, the stronger the impact of flight noise. The second objective of the model is to minimize the total impedance value in fixed operation time, as shown in formula (3):
M i n C = ω risk k = 1 K f ( n k ) C risk k + ω noise k = 1 K f ( n k ) C noise k + ω cos t k = 1 K f ( n k ) C cos t k
where C represents the total operation impedance value of the route network, which includes the safety impedance C risk k , noise impedance C n o i s e k , and cost impedance C cos t k . ω r i s k , ω n o i s e , ω cos t are the weighting coefficients of safety impedance, noise impedance, cost impedance, and ω risk + ω n o i s e + ω cos t = 1 .
In order to realize the effective characterization of the logistics UAV operation environment, the ground environment is equally divided into rth grids, as shown in Figure 2:
(1)
Safety Impedance
The route network safety impedance is shown in formula (4):
C risk k = P c r a s h N p e o p l e F d i e
where safety impedance C risk k consists of three elements. P c r a s h represents the probability of logistics UAVs crashing in an accident. N p e o p l e represents the number of logistics UAVs that hit ground people after crashing. F d i e represents the probability that the ground people will die after being hit by a falling logistics UAV.
The number of people hit by logistics UAVs.
The number of people hit by logistics UAVs N p e o p l e is shown in formula (5):
N people = r = 1 n L i j r × ρ r × A
where L i j r represents the distance of the segment L i j in the grid r. n represents the total number of grids crossed by segment L i j . ρ r represents the ground population density of grid r; the calculation is shown in formula (6). A represents the ground area affected by the logistics UAV crash landing, as shown in formula (8):
ρ r = b B d b e ( 1 r r b 2 ) ρ avg
In formula (6), ρ avg represents the average population density. r r b represents the distance between the center point of building b and the grid r. B represents the set of all buildings. d b represents the delivery demand for building b, which is positively correlated with the size of the building; the calculation method is shown in formula (7):
d b = ε ( n b × F b )
In formula (7), ε represents the correlation coefficient. n b represents the number of grids occupied by building b. F b represents the floor height of building b.
A = w u a v × l u a v 2 + h u a v 2
In formula (8), w u a v represents the length of the logistics UAV wingspan. l u a v represents the length of logistics UAV fuselages. h u a v represents the height of logistics UAV fuselages.
The lethality rate after hitting people
F d i e represents the probability of ground people dying after being hit by a crashing logistics UAV, as shown in formula (9):
F d i e = 1 1 + α μ μ E 1 4 s
where E represents the logistics UAV impact kinetic energy, which is calculated as shown in formula (10). S represents the average sheltering factor of the route. α , μ represents fixed parameters in the model.
E = ( m u a v + m d e l i v e r y ) × v c r a s h 2 2
where m u a v represents logistics UAV unladen mass. m d e l i v e r y represents logistics UAV carry package quality. v c r a s h represents logistics UAV crash speed, as shown in formula (11):
v c r a s h = [ max ( v u a v , v w i n d ) ] + v vertical
where v u a v represents logistics UAV flight speed. v w i n d represents horizontal wind speed. v v e r t i c a l represents logistics UAV vertical crash speed.
(2)
Noise Impedance
The noise impedance of logistics UAV operations is proportional to population density and distance to logistics UAVs, as shown in formula (12):
C n o i s e k = r = 1 n g G f = 1 F g max [ 1 v u a v L i j r ρ g ( L 0 L C M F Y Δ L n o i s e f g ) , 0 ]
As shown in Figure 3, r represents the grid with the logistics UAV segment path. L i j r represents the distance of the segment L i j in the grid r. G is the set of gird g. Fg represents the floor of the building in grid g if there is no building F g = 1 . f represents the floor of the building. ρ g represents the population density in grid g; the calculation method is consistent with ρ r . L0 represents the logistics UAV initial noise value. LCMFY represents the people’s acceptable value of logistics UAS noise. Δ L n o i s e f g represents noise attenuation of the fth floor in grid g, as shown in formula (13) [35]:
Δ L n o i s e f g = 10 lg ( 1 4 π d f g 2 ) × ( 1 + 0.08 G g )
where Gg represents the logistics UAV noise barrier factor [36], which indicates the shielding effect of ground buildings and trees from logistics UAV noise. hfg represents the distance between logistics UAV and people affected by noise; the calculation method is shown in formula (14):
d f g = ( h u a v h p e o p l e ) 2 + Δ x r g 2 + Δ y r g 2
where h u a v represents the vertical distance of logistics UAV from the grid. h p e o p l e represents the vertical distance of people from the grid. Δ x r g represents the horizontal distance between grid r and grid g. Δ y r g represents the vertical distance between the grid r and the grid g.
(3)
Cost Impedance
The noise impedance of the route network is shown in formula (15):
C cos t k = r = 1 n L i j r v u a v × ε ( m d e l i v e r y ) × p p o w e r
where, p p o w e r represents logistics UAVs’ flight cost. ε ( m d e l i v e r y ) represents the penalty factor when the package mass carried by the logistics UAV is m d e l i v e r y ; the calculation method is shown in formula (16):
ε ( m d e l i v e r y ) = ε max 1 m max × m d e l i v e r y + 1
where ε max represents the upper limit of ε ( m d e l i v e r y ) . m max represents the upper limit of package mass.

3.2.2. Constraint Conditions

(1)
Takeoff
If the delivery plan k takes off from the vertiport O i is executed, namely f ( n k ) = 1 , logistics UAV must pass through any of the segments that fly away from the vertiport O i . If the delivery plan k from vertiport O i is not executed, namely f ( n k ) = 0 , logistics UAV must not pass through any of the segments that fly away from vertiport O i , as shown in formula (17):
f ( n k ) = x k i j ,   L i j L i o u t
where x k i j is a 0–1 variable, x k i j = 1 represents delivery plan k passes through the segment L i j and x k i j = 0 represents delivery plan k without passing through the segment L i j . L i o u t represents the set of segments that fly away from the vertiport O i .
(2)
Landing
If the delivery plan k landing at vertiport O j is executed, namely f ( n k ) = 1 , logistics UAV must pass through any of the segments that fly into vertiport O j . If the delivery plan k landing at vertiport O j is not executed, namely f ( n k ) = 0 , logistics UAV must not pass through any of the segments which fly into vertiport O j , as shown in formula (18):
f ( n k ) = x k i j ,   L i j L j i n
where L j i n represents the set of segments which fly into from vertiport O j .
(3)
Fly Across
In the scenario proposed in the paper, takeoff and landing services are available at any node of the route network. If the delivery plan k flies across the vertiport O z , namely not landing when arriving at the vertiport O z , flies across the vertiport O z , then continues to follow the fixed route, the logistics UAV must fly across one vertiport O z fly into segment and one vertiport O z fly away segment, as shown in formula (19):
x k i z = x k z j = 1 ,   fly   across O z 0 , not   fly   across O z ,   L i z L z i n , L z j L z o u t
where x k i z is a 0–1 variable, x k i z = 1 represents delivery plan k fly across segment L i z and x k i z = 0 represents delivery plan k not fly across segment L i z . x k z j is a 0–1 variable, x k z j = 1 represents delivery plan k fly across segment L z j and x k z j = 0 represents delivery plan k not fly across segment L z j . L z i n is the set of vertiport O z fly into segment, L z o u t is the set of vertiport O z fly away segment.
(4)
Safety Interval
The distance between the front and rear logistics UAV must be larger than the minimum safety interval. In this paper, the safety interval standard is maintained by setting the logistics UAV takeoff interval, as shown in formula (20):
| t k i t k i | T a i r r o u t e , k k
where t k i represents the takeoff time of delivery plan k. t k i represents the takeoff time of the delivery plan k . T a i r r o u t e represents the takeoff interval time between the two logistics UAVs, before and after.
(5)
Fly Across Time
The time of logistics UAV flying across the vertiport is calculated as formula (21):
t k j = t k i + t k i j
where t k j represents the time that logistics UAV flying across the vertiport O j . t k i j represents the time required for a logistics UAV to fly over segment L i j .
(6)
Load Limitation
The mass of logistics UAVs cannot exceed the upper limit of the takeoff mass after loading the package, as shown in formula (22):
m u a v + m d e l i v e r y m max
where m u a v represents the mass of logistics UAV without packages. m d e l i v e r y is the mass of the package. m max represents the upper limit of logistics UAV takeoff mass.
(7)
Flight Speed Limitation
Logistics UAV flight speed must be between the lower and upper flight speed limits, as shown in formula (23):
v min v u a v max ( v w i n d , v max )
where v u a v represents the logistics UAV flight speed. v min represents the lower limit of logistics UAV flight speed. v max represents the upper limit of logistics UAV flight speed. v w i n d represents wind speed.
(8)
Flight Distance Limitation
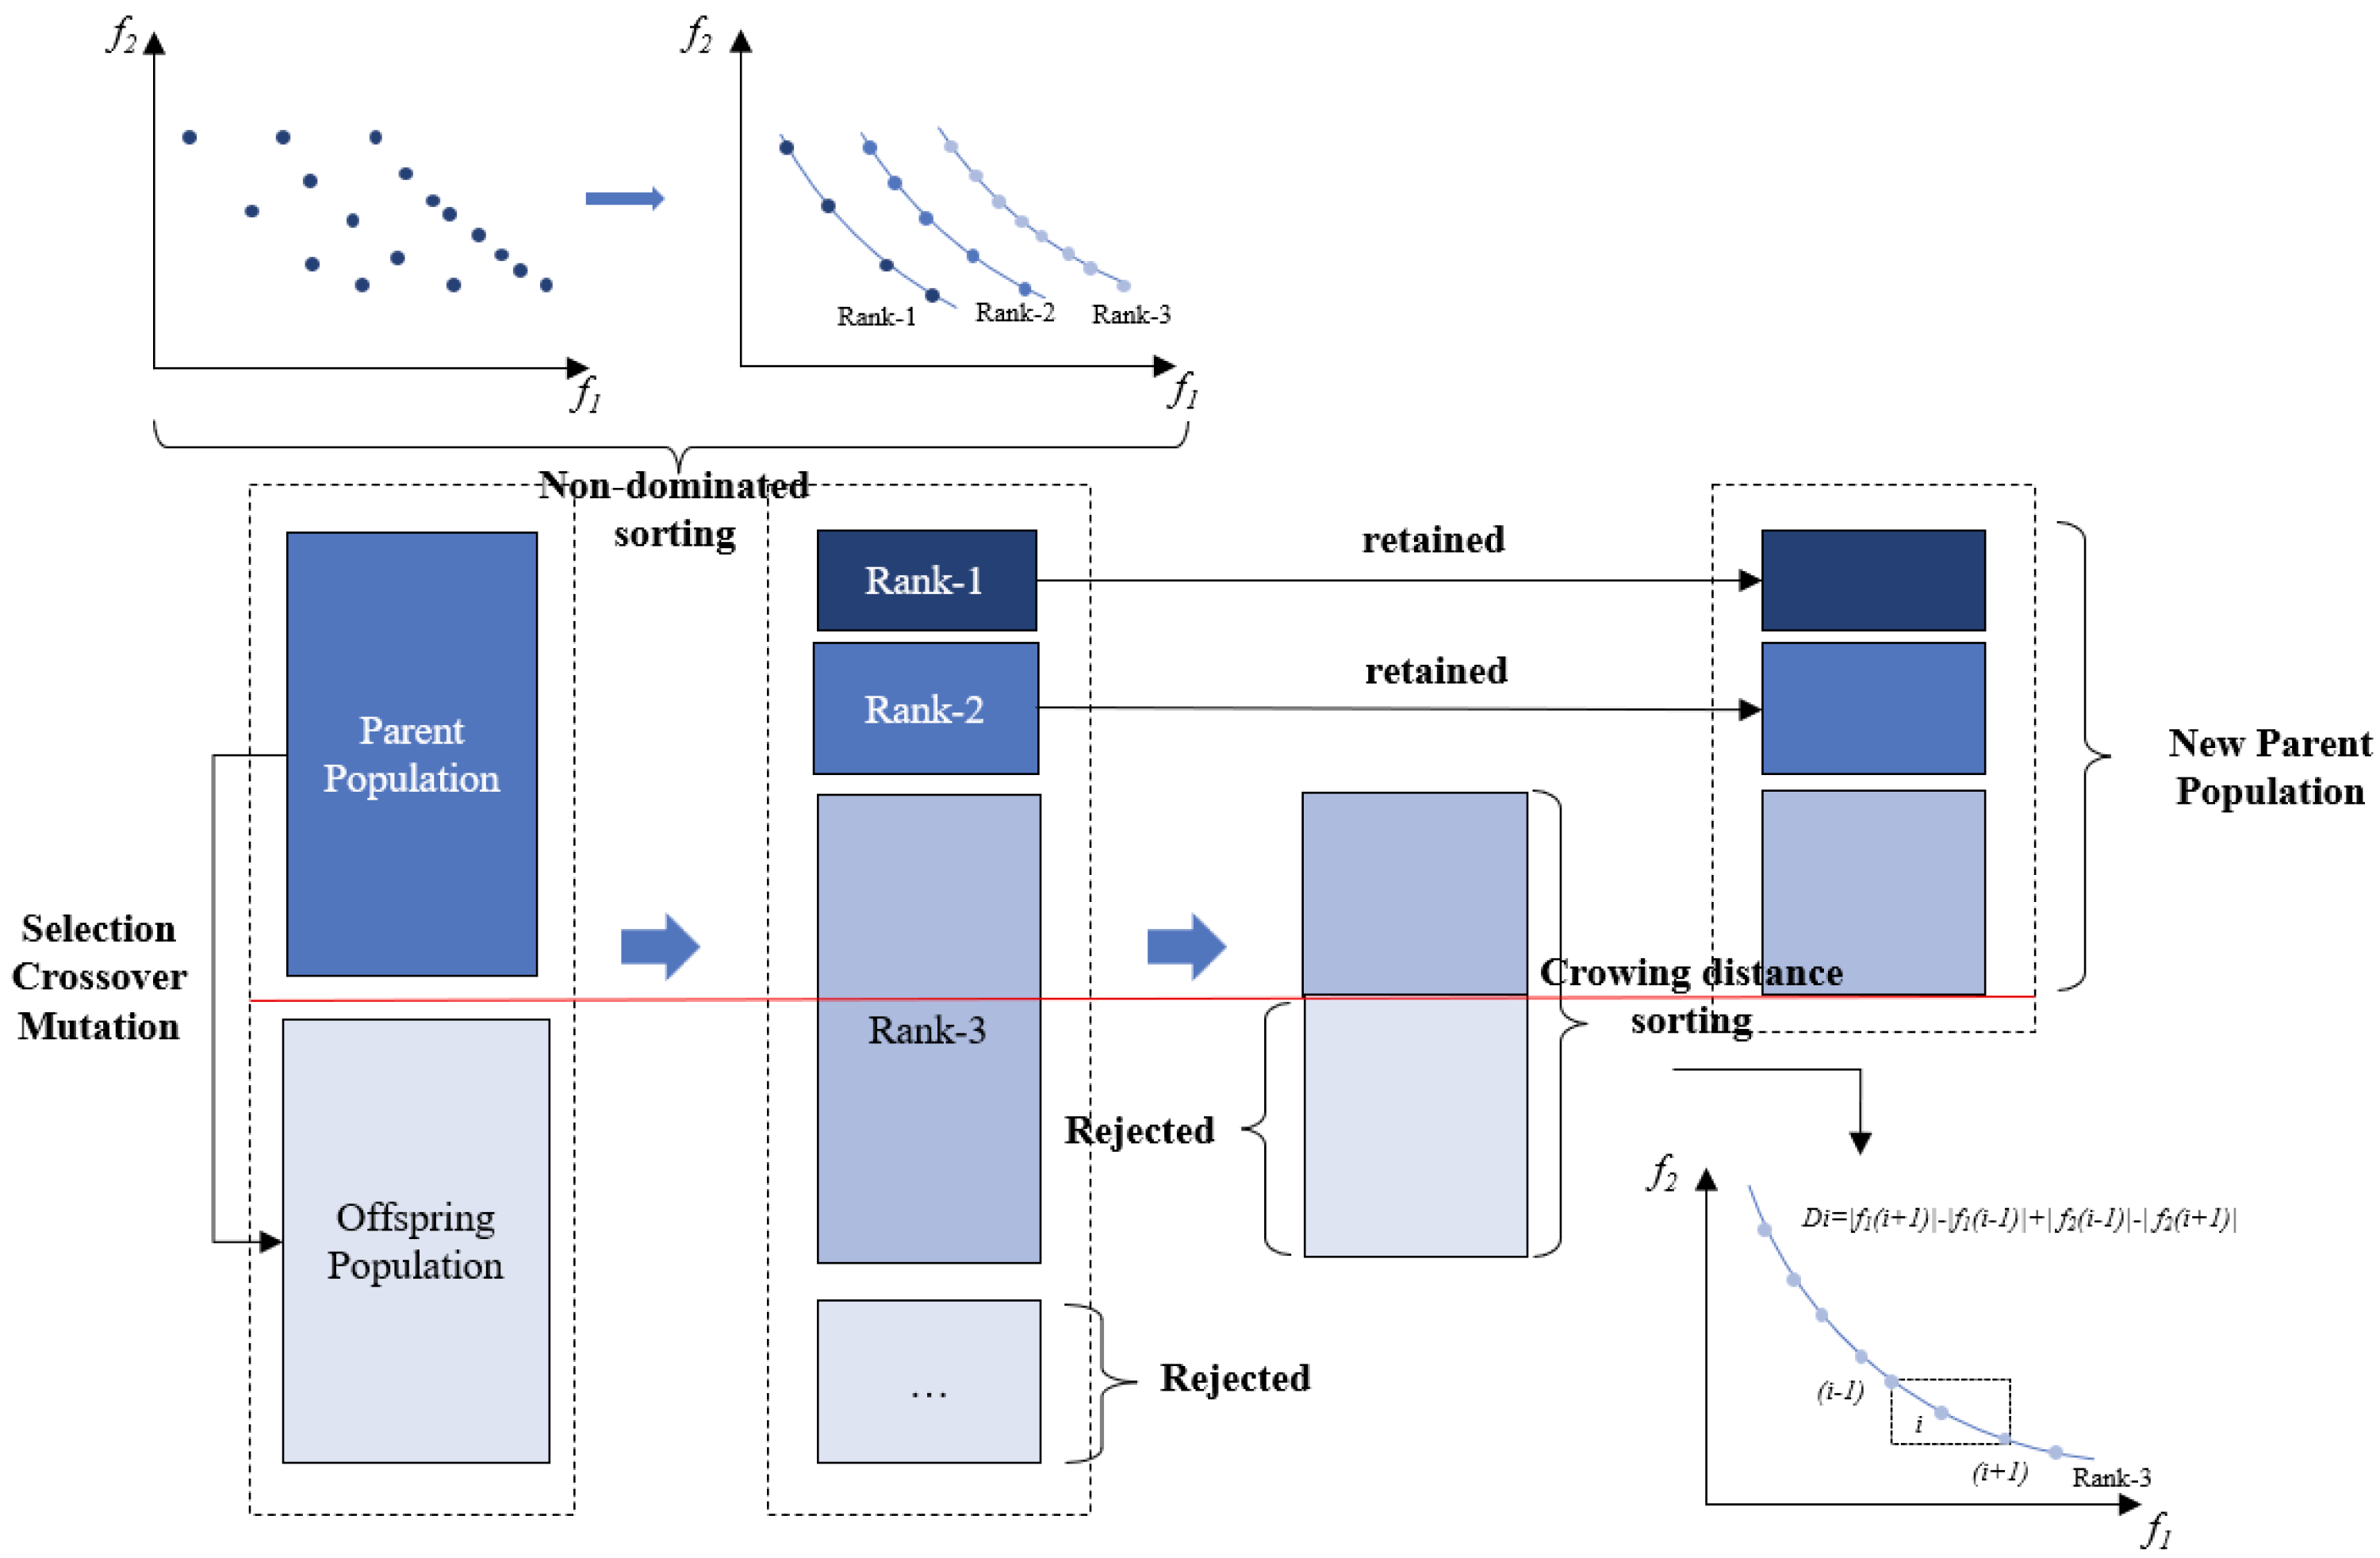
The total flight distance of logistics UAVs executing each delivery plan must be less than the flight distance limit, as shown in formula (24):
L i j L i j max
where L i j max represents the upper limit of logistics UAV flight distance.
The complete model is shown in formula (25):
M a x N = k = 1 K f ( n k ) M i n C = ω risk k = 1 K f ( n k ) C risk k + ω noise k = 1 K f ( n k ) C noise k + ω cos t k = 1 K f ( n k ) C cos t k s . t . C r i s k i j = P u a v N p e o p l e F d i e C n o i s e k = r = 1 n g G f = 1 F g max [ 1 v u a v L i j r ρ g ( L 0 L C M F Y Δ L n o i s e f g ) , 0 ] C cos t k = r = 1 n L i j r v u a v × ε ( m d e l i v e r y ) × p p o w e r f ( n k ) = x k i j ,   L i j L i o u t f ( n k ) = x k i j ,   L i j L j i n x k i z = x k z j = 1 ,   fly   across O z 0 , not   fly   across O z ,   L i z L z i n , L z j L z o u t | t k i t k i | T a i r r o u t e , k k t k j = t k i + t k i j m u a v + m d e l i v e r y m max v min v u a v max ( v w i n d , v max ) L i j L i j max
where f ( n k ) , x k i j , x k i j , x k i z , and x k z j are binary variables; C risk k , C noise k , and C cos t k are quantitative variables; and t k i , t k i , m u a v , m d e l i v e r y , and v u a v are quantitative variables.

4. Algorithm

The Non-dominated Sorting Genetic Algorithm-II (NGSA-II) algorithm is utilized to solve the proposed logistics UAV route network capacity assessment multiobjective model. The principles and execution of the NGSA-II algorithm are presented. NGSA-II is a typical heuristic algorithm with the advantages of fast convergence and high efficiency, which is widely used in solving multiobjective optimization problems. Compared with the NGSA algorithm, the NGSA-II algorithm has lower complexity. NSGA-II reduces the algorithm complexity from O (mN3) to O (mN2) by a non-dominated sorting method, where m is the number of objective functions and N is the population size. Meanwhile, NGSA-II uses crowding and crowding comparison operators instead of the fitness-sharing strategy that requires the specification of a sharing radius, which helps to maintain the diversity of the population [37]. Figure 4 illustrates the algorithm flow.
Non-dominance sorting is a stratification of all individuals in the population by the number of individuals that can be dominated. As shown in Figure 4, parent populations generate offspring populations through selection, crossover, and mutation. Then, all populations are to be stratified by a non-dominated sorting method. If the set of individuals cannot be dominated by other individuals, they are sorted into Rank 1, the Pareto frontier. If the set of individuals can be dominated by one individual, they are sorted into Rank 2, and so on. If 50% of the individuals (above the red line) are retained as the new parent population, Rank 1 and Rank 2 will be retained directly. Since some individuals in Rank 3 are outside the 50% range, Rank 3 is further reordered by calculating the crowding distance. Crowding distance is a standard for determining the degree of aggregation near individuals of the same rank. Large crowding distances indicate dense population distribution, which makes the algorithm readily reach local optimal solutions and allows for direct rejection.

NGSA-II Algorithm Genetic Mechanism Design

(1)
Coding
Generating K logistics UAV delivery plan serial numbers and randomizing them, as shown in Figure 5. Meanwhile, the route and package weight corresponding to each delivery plan is generated, as shown in Table 1.
(2)
Genetic Operations
The genetic operation in the NGSA-II algorithm is similar to the traditional Genetic Algorithm (GA) in that it takes three approaches to generate offspring populations, namely selection, crossover, and mutation. The roulette mechanism is adopted in this paper for the selection operation. When the delivery plan serial number is in crossover and mutation operation, the corresponding route and the package weight carried change in order with the serial number.
The crossover probability Pc and mutation probability Pm are the keys to determining the speed of convergence and stable performance of NSGA-II algorithms. This paper applies the adaptive adjustment mechanism of genetic operators to reduce the probability of good operators being selected for crossover and mutation and to increase the probability of poor operators being selected for crossover and mutation to ensure the gradual and stable improvement of the overall population level. The crossover probability Pc is calculated as formula (26). The mutation probability Pm is calculated as formula (27) [38]:
p c = 0 . 1 × ( 1 N r a n k ) × G ( R 1 ) × N + 0 . 9 ,   N r a n k < N a v g 1 ,   N r a n k N a v g
where N r a n k represents the value of the paired crossover operator with the smaller non-dominated rank. N a v g represents the average value of the current population’s individual non-dominance rank. G represents the current population iteration number. R represents the maximum value of the current population’s individual non-dominance rank. N represents the maximum number of iterations.
p m = 0 . 1 × ( N r a n k 1 ) × G ( R 1 ) × N ,   N r a n k < N a v g 0.1 ,   N r a n k N a v g
where N r a n k represents the non-dominated rank of the mutation operator.
The NGSA-II algorithm’s particular stages are as follows [Algorithm 1]:
Algorithm 1. NGSA-II Algorithm solving process [37]
Input :   The   maximum   amount   of   iterations   N max z
Output :   Final   population   Pareto   solution   set   N max
N = 0 ,   N = x 1 , x 2 , x 3 , , x n       // Generating an initial population with population size n
While  N N max
        C 1 = calCost 1 ( N )             // Calculating the objective function
        C 2 = calCost 2 ( N )
        N = nonDominatedSorting ( N , C 1 , C 2 )             // Non-dominance sorting
        N = crowdingDisSorting ( N )                   // Sorting by crowding distance
        N + 1 = N [ : z ]                   // Retaining the top  z individuals in N
        While len ( N + 1 ) < n
               x a , x b = rouletteChoice ( N )     // Select two individuals from the parent population
               P c = calCrossProb ( x a , x b )    // Calculating adaptive crossover probabilities
               P m = calMutateProb ( x a , x b )    // Calculating adaptive mutation probabilities
               x a , x b = geneticOperator ( x a , x b , P c , P m )
               N + 1 . append ( x a , x b )
        N = N + 1
End While
Return N max

5. Analysis

A logistics UAV route network based on real geographic information data is established. Comparative experiments are performed to analyze the result of logistics UAV route network capacity. Particular focus is placed on the impact of two key parameters, flight speed and safety interval, on the route network capacity.

5.1. Parameters Setting

(1)
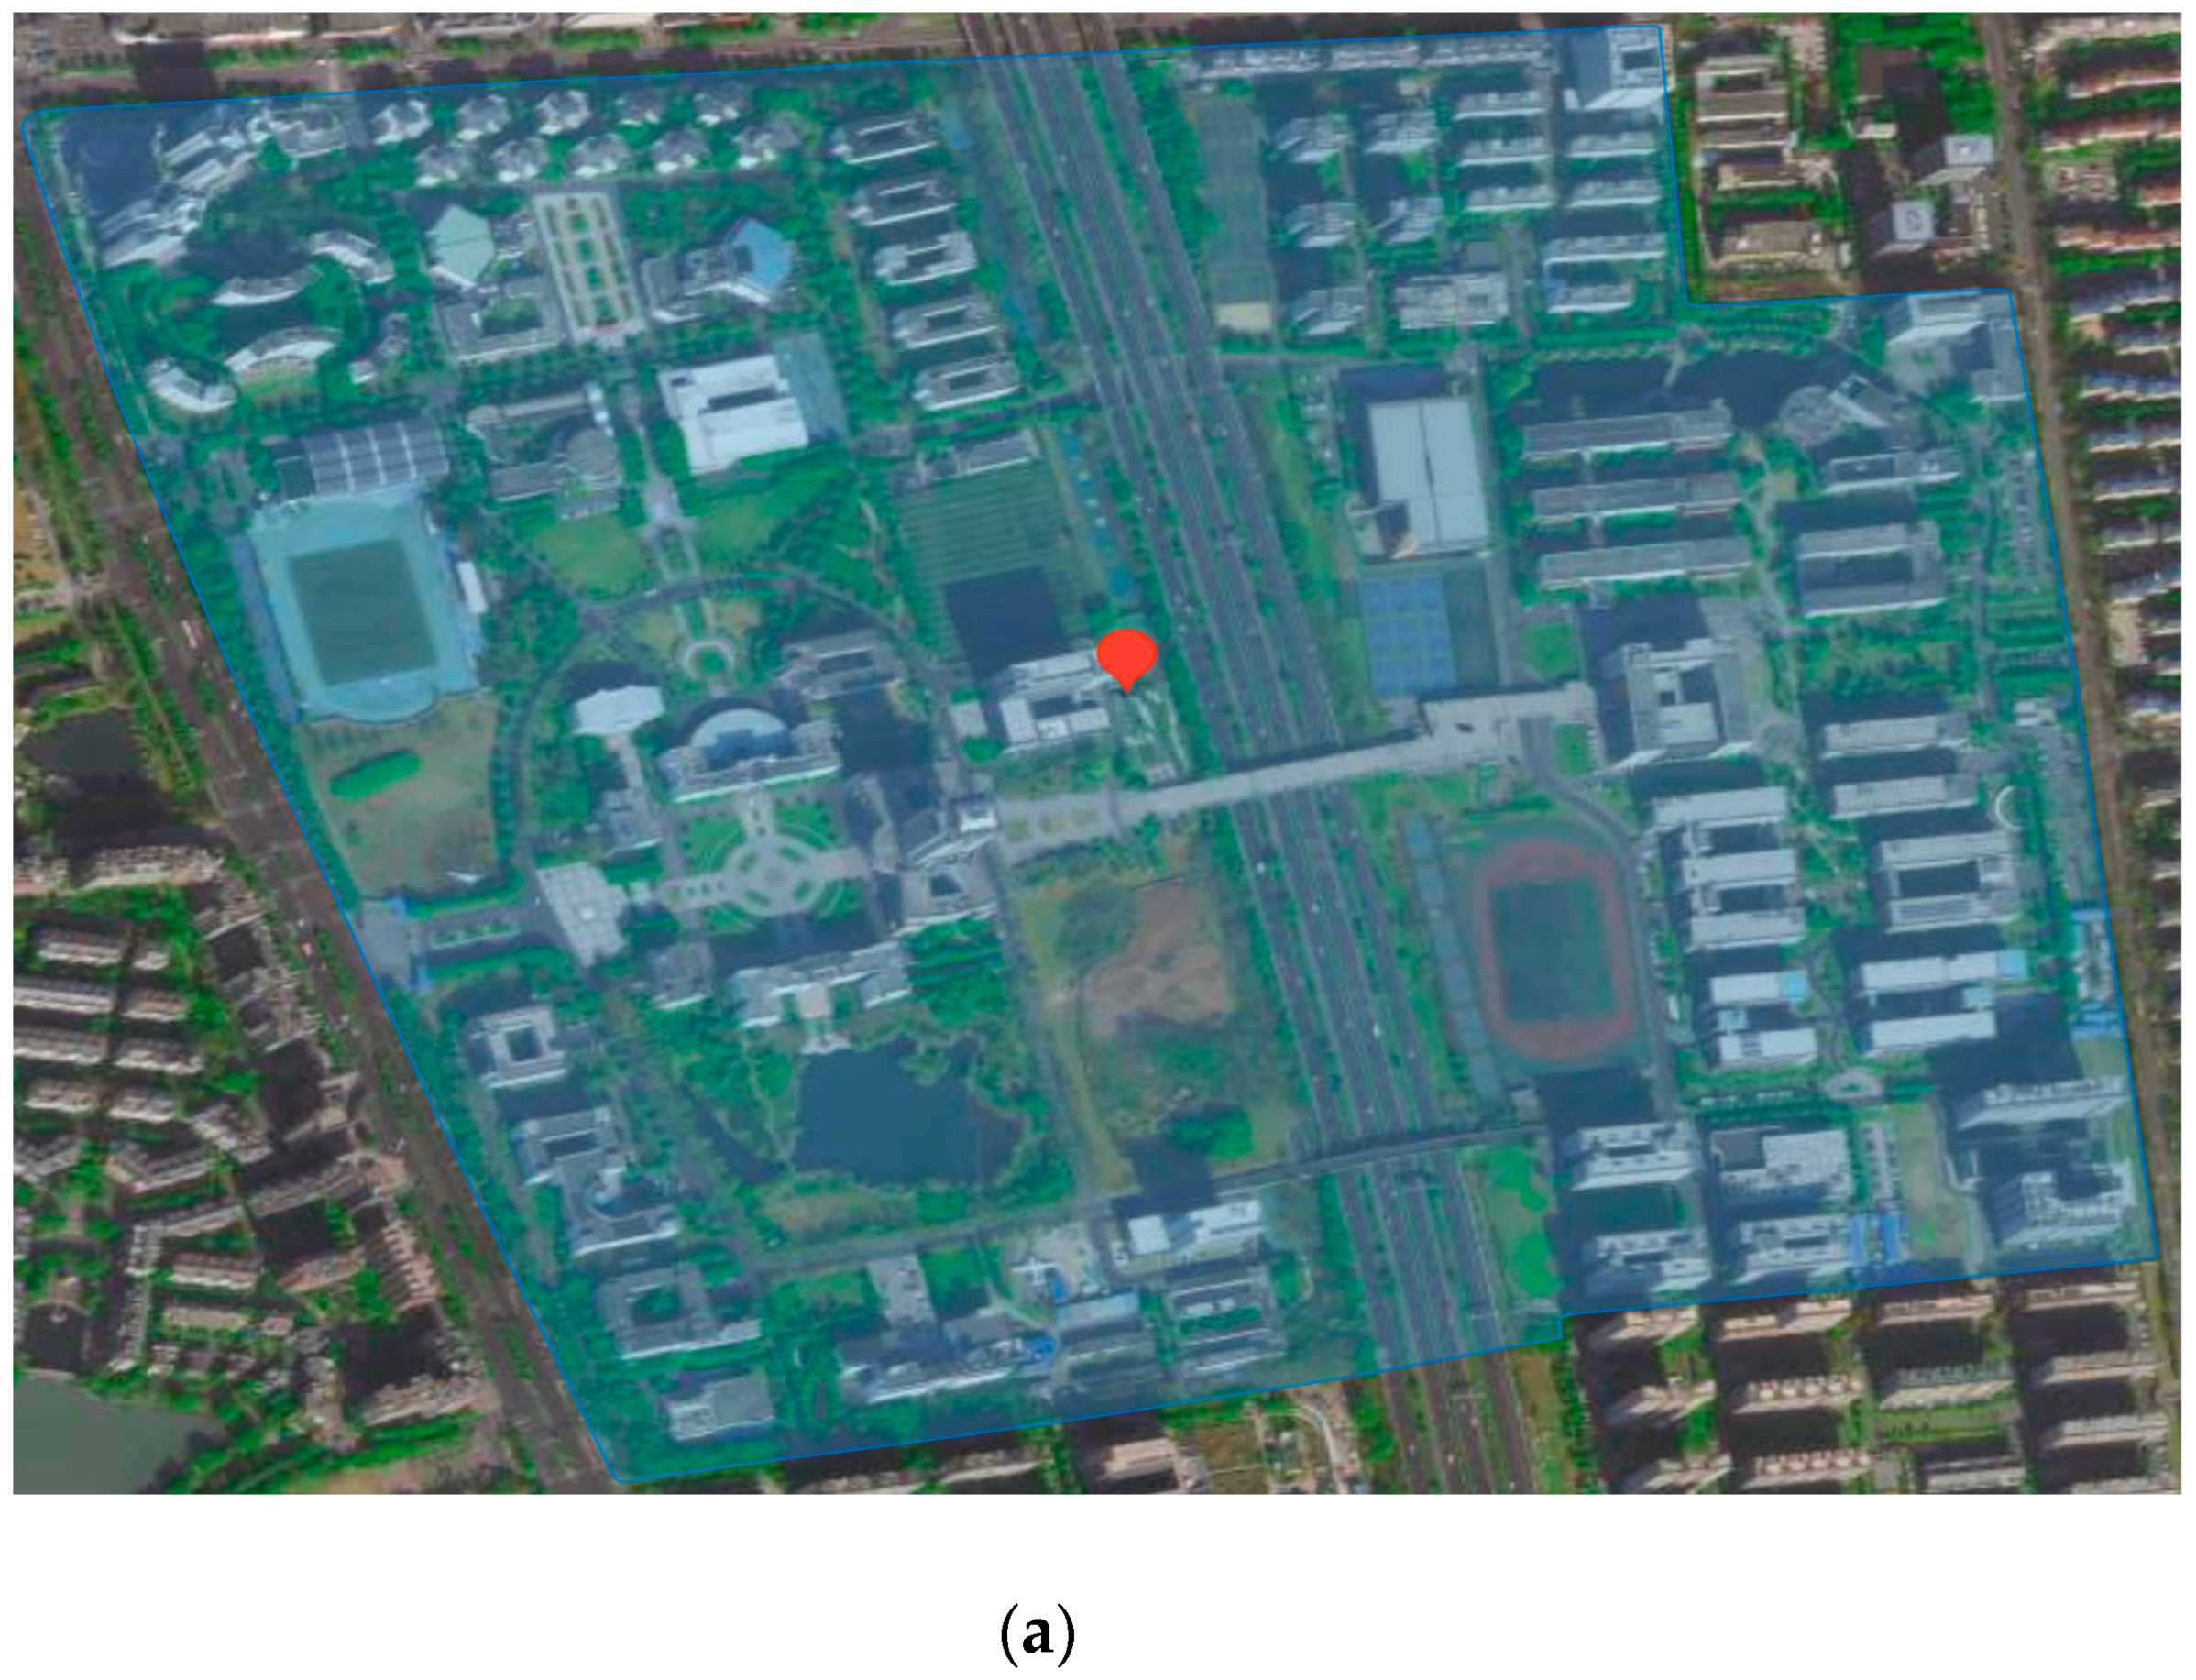
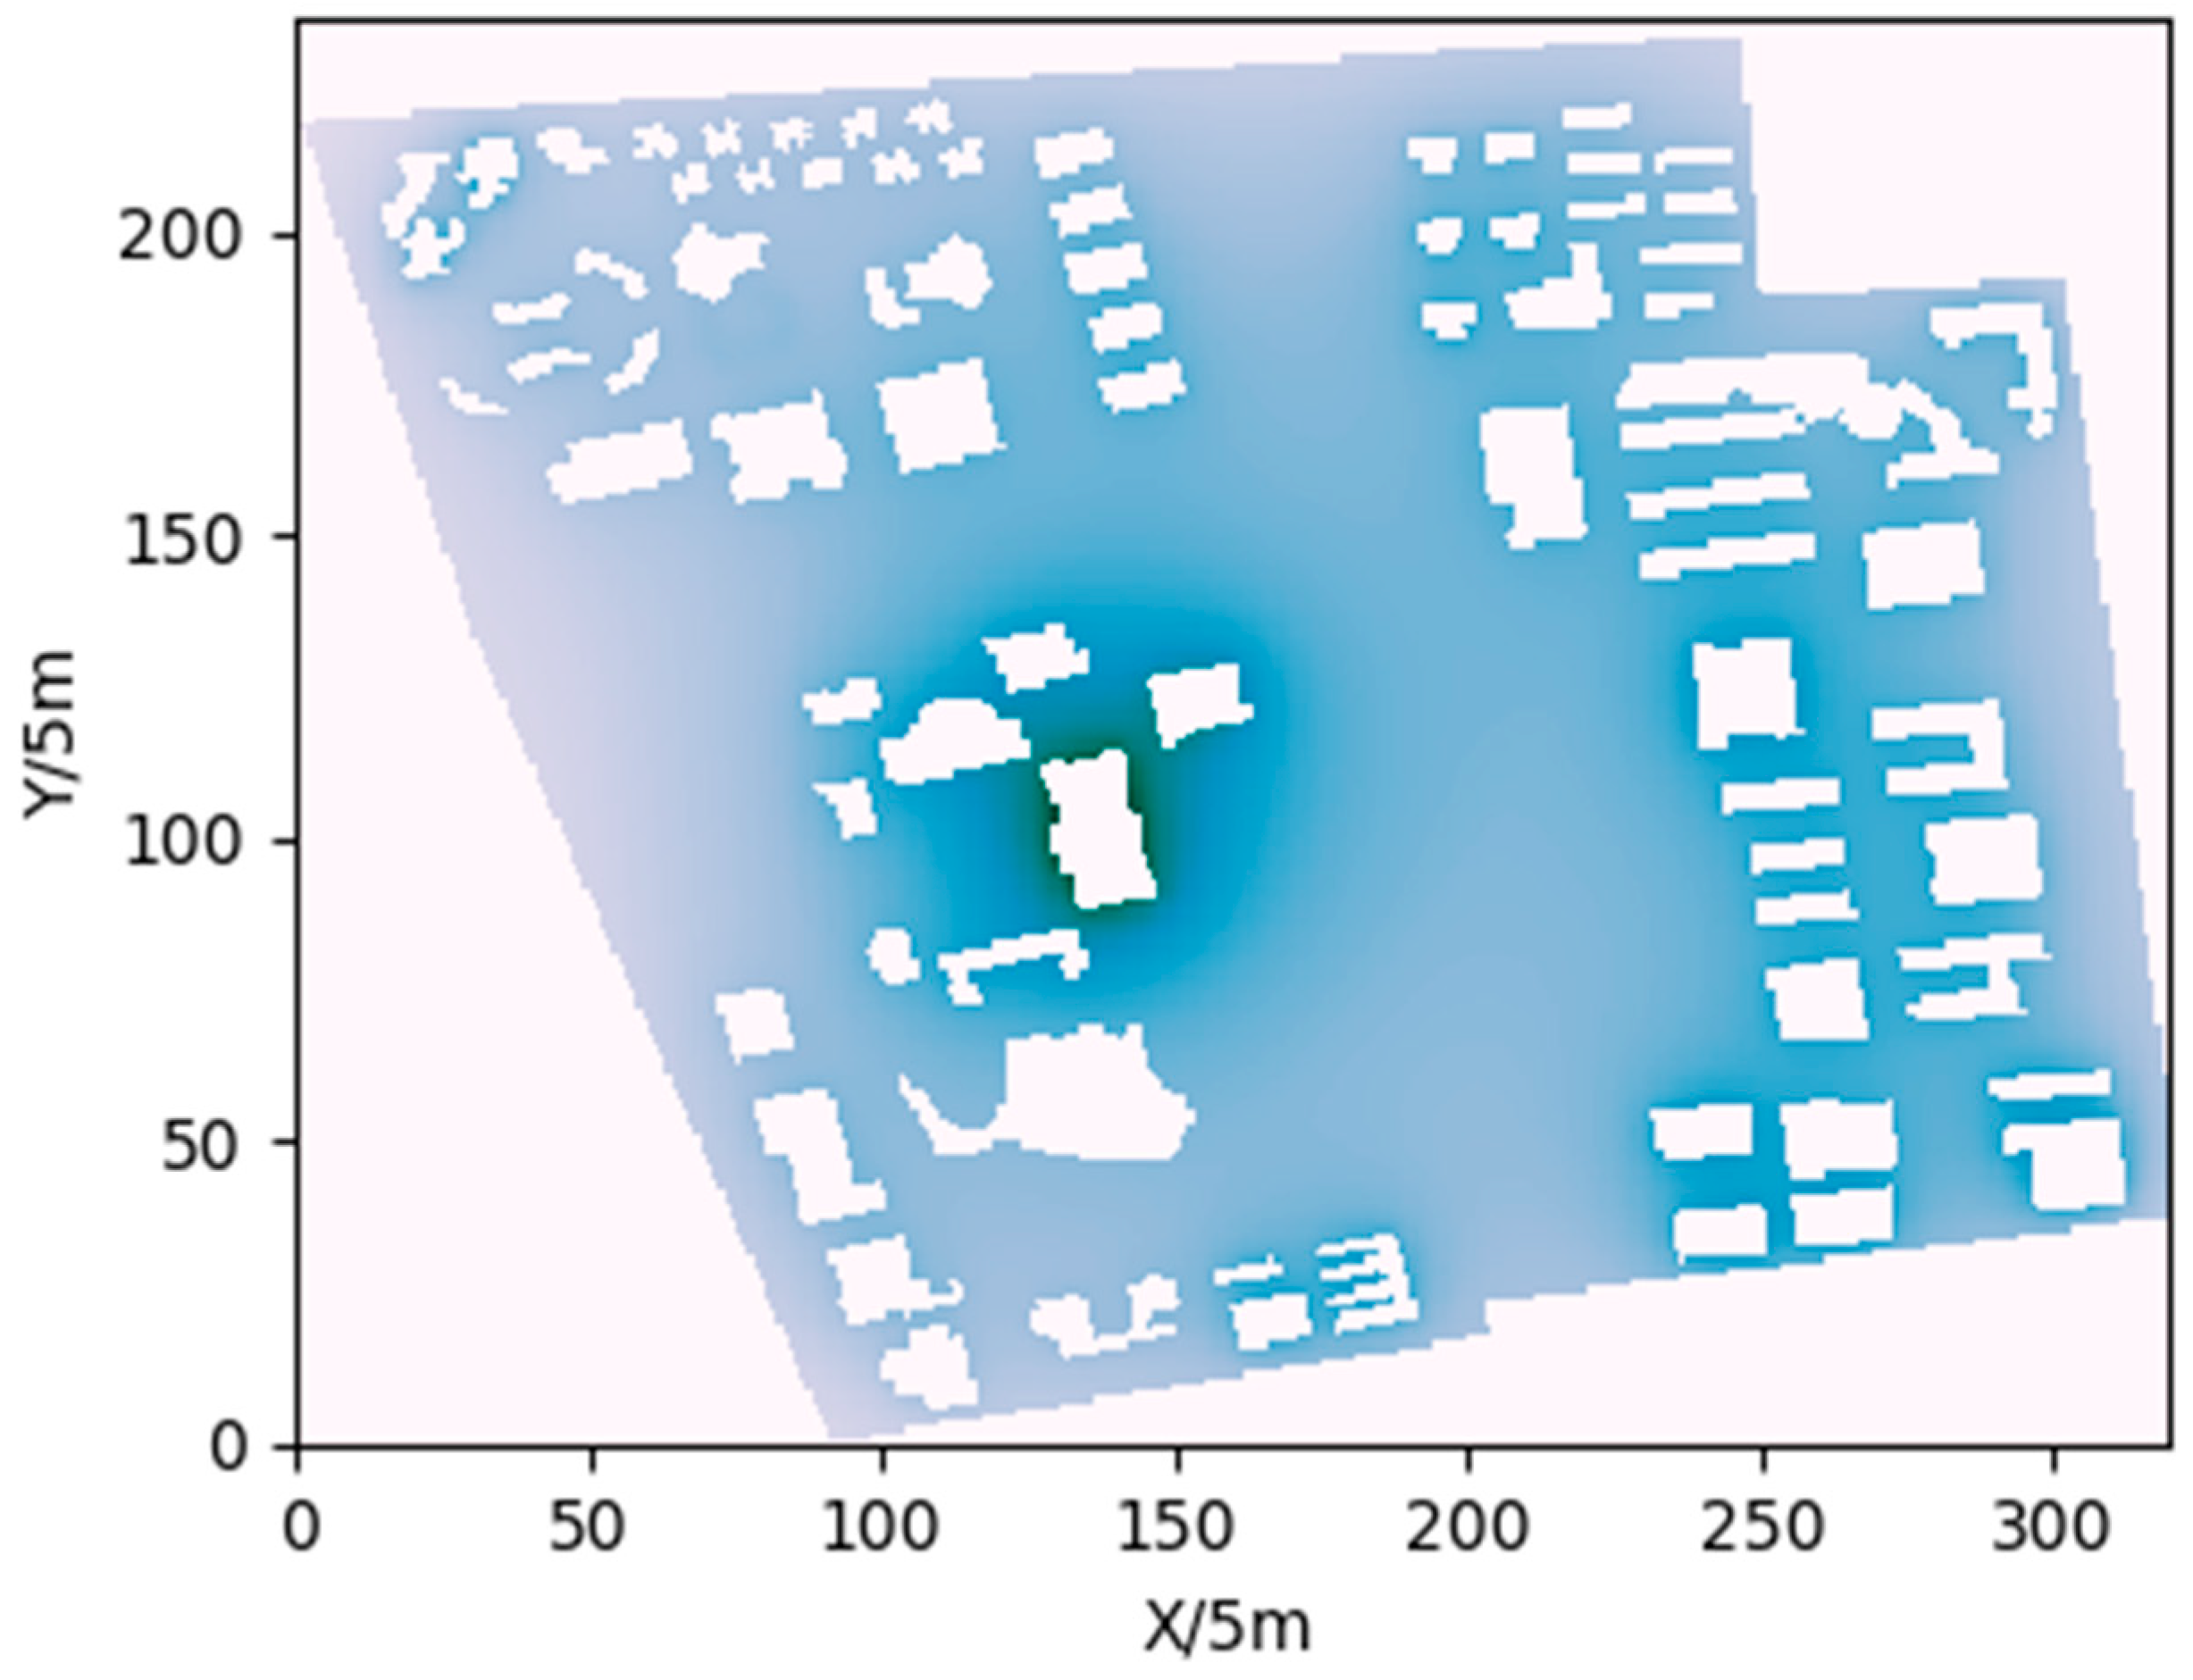
Simulation Environment
To verify the effectiveness of the logistics UAV route network operation capacity assessment model and algorithm, Python 3.9.10 was utilized for simulation experiments. A region in Nanjing, China, is selected as the experimental scenario, as shown in Figure 6a, to construct a logistics UAV route network, as shown in Figure 6b. The route network has 62 vertiports, including 53 end delivery stations and 9 public delivery stations, divided into 4 communities. Logistics UAVs fly on fixed headings without two-way segments.
Logistics UAV operation noise impedance is directly related to the height of the route network; refer to the literature [23]. The route network constructed is planned at 50 m above the ground road, and the noise impedance value calculation results in the region shown in Figure 7; the darker the color, the higher the noise impedance value. According to Figure 7, the noise impedance value and building height are directly inversely correlated; the higher the building height, the closer it is to the logistics UAV path, the more pronounced the noise interference, and the higher the noise impedance value. The distance between the outdoor open area and the logistics UAV route is larger, and the noise impedance value is relatively small.
Population density is related to building distribution. People inside the buildings are clustered, and outdoors are relatively loose; the population density in the region is shown in Figure 8; the darker the color indicates that the population density is greater. According to Figure 8, residential neighborhoods and office building areas are densely populated, parks and football fields are relatively loosely populated, and lake areas are almost devoid of people.
(2)
Parameters
For the logistics UAV delivery scenario, the model parameters are set according to the previous related research [39] and the performance of some multicopter logistics UAVs, such as Meituan FP400, EHang216, and Antwork TR7S, as shown in Table 2.

5.2. Results Analysis

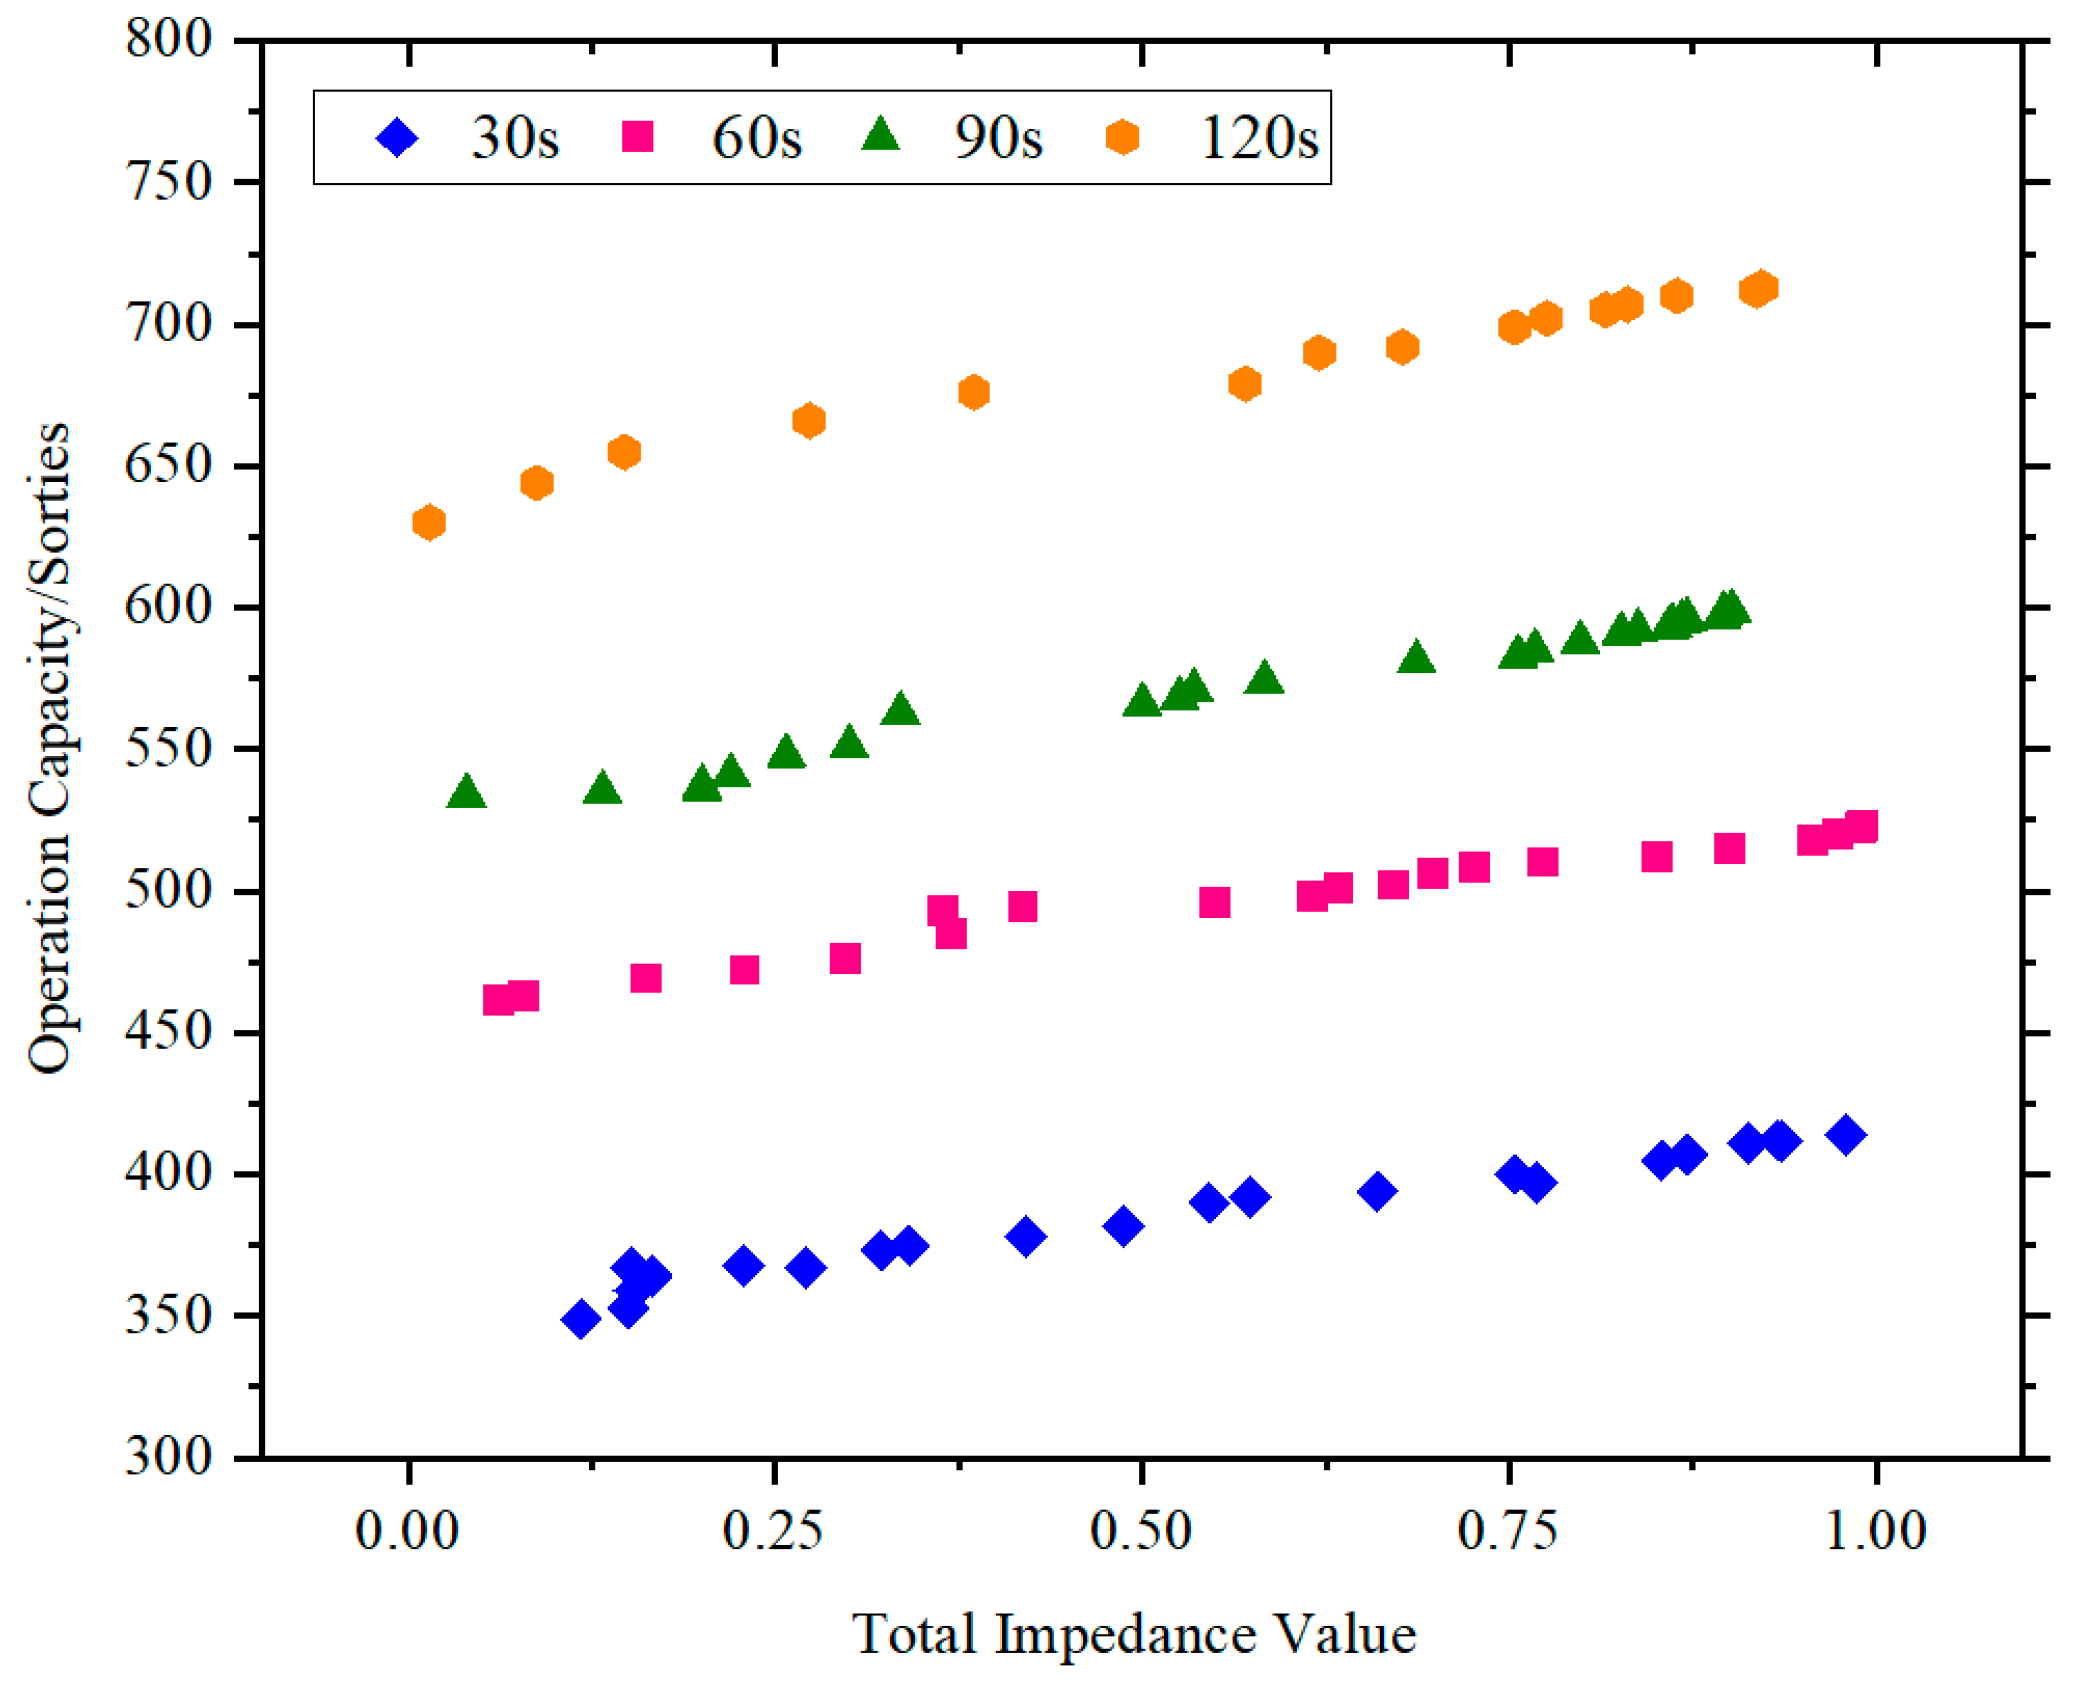
5.2.1. Operation Capacity Analysis

The operation capacity of a logistics UAV route network with operation times of 30 s, 60 s, 90 s, and 120 s is solved using the above model and parameter settings, and the experiment is repeated 20 times for each operation time, and the optimal solution is selected to plot the Pareto front, as shown in Figure 9. The operation capacity and the total impedance value show a linear relationship with similar angular coefficients, and as the total impedance value gradually rises, the operation capacity reaches the inflection point, indicating that the route network operation capacity can continue to optimize the space for improvement gradually decreases. Meanwhile, the Pareto fronts at different operation times are uniformly distributed, indicating that the NGSA-II algorithm maintains the diversity of the population during the solution process.
The optimal solution set among 20 replicate experiments is selected to draw an iterative graph of the operation capacity, as shown in Figure 10. The population optimal solution, namely the optimal operation capacity, and the population average solution, namely the average operation capacity, are outputs for each iteration to comprehensively assess the operation capacity of the logistics UAV route network. The optimal operation capacity of the route network in 30 s, 60 s, 90 s, and 120 s is 414, 523, 599, and 711, respectively, while the average operation capacity is 392, 497, 580, and 688, respectively, and the optimal operation capacity is higher than the average operation capacity by about 20 sorties. When the operation time is 30 s, the optimal solution could be obtained with 400–500 iterations, and when the operation time increases to 90 s and 120 s, the algorithm begins to converge with more than 500 iterations, indicating that with the increase of operation time, the complexity of computing increases, and the convergence speed of algorithm slows down and the optimization magnitude gradually decreases, reflecting the reasonableness of the proposed logistics UAV route network operation capacity assessment model.

5.2.2. Key Parameter Analysis

(1)
Safety Interval
The safety interval mentioned in this paper relates to the minimum distance that the two logistics drones in front and behind must maintain when operating in the route network [40]. Maintaining safety intervals is the basic requirement to ensure the logistics UAV operates safely. The route network operation capacity at different operation times with safety intervals of 15 m, 20 m, 25 m, and 30 m is assessed by considering the performance of multicopter logistics UAV, and each group of experiments is repeated 20 times, and the average value is obtained to plot average operation capacity at different safety intervals with the average total impedance value change, as shown in Figure 11.
According to Figure 11, When the operation duration is fixed, the total impedance value drops as the safety interval grows and the route network’s operation capacity steadily declines. Moreover, when the safety interval is increased from 25 m to 30 m, the operation capacity decreases significantly less than when the safety interval is increased from 15 m to 20 m and from 20 m to 25 m. It is shown that in the scenario proposed in this paper, with the increase of safety interval, the sensitivity of logistics UAV route network operation capacity to safety interval gradually decreases; namely, when the safety interval reaches a certain level, the influence of safety interval on route network operation capacity gradually decreases.
To analyze the assessment of the operation capacity of the logistics UAV route network in relation to the safety interval, the ‘operation time-safety interval-average operation capacity’ and ‘operation time-safety interval-average total impedance value’ graphs were plotted based on the above experimental data, as shown in Figure 12 and Figure 13. A comprehensive analysis of the two key parameters of operation time and safety interval shows that as the operation time increases and the safety interval decreases, the average operation capacity tends to increase. When the operation time is smaller while the safety interval is larger, the average operation capacity is affected more by the operation time; when the operation time is larger while the safety interval is smaller, the average operation capacity is affected more by the safety interval. The smaller variation in the average total impedance value compared to the average operation capacity indicates that the impedance value required to achieve the same increase in operation capacity is decreasing under the influence of marginal effects.
(2)
Flight Speed
According to the scenario developed in this study, logistics UAVs fly at a constant speed throughout the route network, and with reference to the performance parameters of Meituan FP400 logistics UAV, the research analyses the trend of the operation capacity of the route network when the safety interval is fixed at 20 m, and the flight speed of logistics UAVs is increased from 10 m/s to 15 m/s in 0.5 m/s increments. Each group of experiments was repeated 20 times, the average operation capacity and the maximum operation capacity were recorded, and the average of the average operation capacity was obtained to plot the change in flight speed and the average operation capacity. As shown in Figure 14, the average operation capacity rises gradually as the flight speed increases; as the operating time rises, the average operation capacity at the same flying speed improves at a slower rate.
To explore the effect of logistics UAV flying speed on route network operation capacity, based on the above experimental data, the average value of maximum operation capacity and average operation capacity of each group of experiments are taken to plot the relationship between flight speed and operation capacity at different operation time, as shown in Figure 15. According to Figure 15, when the logistics UAV flight speed is increased from 10 m/s to 10.5 m/s, the operation capacity rises at the maximum rate, and as the flight speed increases, the overall rate of rise gradually slows down. Moreover, as the operation time increases, the rate of increase in operation capacity grows. It indicates that when logistics UAVs fly at speeds between 10 m/s and 10.5 m/s, the operation capacity of the route network is influenced by the flight speed, and its influence gradually strengthens as the operation time rises, while the maximum operation capacity is greater than the average operation capacity by about 20 sorties.
In the Analysis section, two main parameters, flight speed and safety interval, are selected for multiple comparative experiments. Reference [41] also establishes a capacity assessment model for logistics UAV routes and selects the safety interval as the key parameter to be analyzed. In reference [41], the capacity of the route network decreases with increasing safety intervals, and the rate of decrease slows down, which is similar to the findings of this paper, which verified the reliability. Moreover, reference [41] does not concern the effect of flight speed on the route network’s capacity, and this study is more comprehensive than reference [41].

6. Conclusions

This paper proposes an urban low-altitude logistics UAV route network operation capacity assessment method in order to respond to the development trend of logistics UAVs; the following are the contributions:
  • This paper clarifies the operation mode of logistics UAVs in urban low-altitude airspace and defines the operation capacity of logistics UAV route networks as the maximum sortie of logistics UAVs that can be served during the operation time of all vertiports in the route network. A bi-objective optimization model for assessing the logistics UAV route network operation capacity is established, considering safety, cost, and noise factors. The first objective is to maximize the logistics UAV delivery plan that can be executed during operation time. The second objective is to minimize the total impedance value;
  • The route network is established utilizing real-world geographic data with a total of 62 vertiports, including 53 end delivery stations and 9 public delivery stations, divided into 4 communities. Based on the above model and experimental scenarios, the NSGA-II algorithm is adopted to solve the model with operation times of 30 s, 60 s, 90 s, and 120 s, respectively. As the operation time increases, the optimal route network capacity increases from 414 to 711, and the algorithm convergence rate slows down, indicating the reasonableness of the proposed model and algorithm;
  • Comparative experiments were designed for the key parameter of the safety interval to assess the logistics UAV route network operation capacity at different operating times with safety intervals of 15 m, 20 m, 25 m, and 30 m. Experiments reveal that when the safety interval rises, the average operation capacity of the route network rapidly declines, and the sensitivity to the safety interval decreases accordingly. In addition, the average total impedance value varies less than the average operation capacity, indicating that the impedance value required to achieve the same increase in operation capacity is decreasing under the influence of marginal effects;
  • Multiple group experiments are carried out to analyze the trend of the route network operation capacity when the flight speed of logistics UAVs is increased from 10 m/s, in 0.5 m/s increments, to 15 m/s, with the goal to expand the relationship between the flight speed of logistics UAVs and the route network operation capacity. The experiments show that as the flight speed increases, the average operation capacity gradually rises, especially when the logistics UAV flight speed is between 10 m/s and 10.5 m/s. The route network operation capacity is influenced by the flight speed, and its influence gradually strengthens as the operation time rises.
This paper proposed a logistics UAV route network operation capacity assessment method. However, the urban environment is complicated, and the logistics UAV operation scenario has meteorological and other dynamic influencing factors interference. In the future, we will try to further study the logistics UAV route network dynamic capacity assessment method through a combination of computer simulation and mathematical modeling methods. Attempts to simulate random influences in the urban low-altitude environment, such as wind shear and bird interference, are made through computer simulation techniques. In addition, we are trying to establish a dynamic network of logistic UAV route networks, which can be based on real-time changes in distribution demand, and studying the dynamic route network capacity assessment methodology. Overall, the study on the capacity assessment of the logistics UAV route network will play a significant role in the planning and scheduling of logistics demand in the real world, especially for the future urban air-ground coordinated logistics and distribution mode. Scientific assessment of the capacity of low-altitude airspace is an important prerequisite for the efficient allocation of air and ground transport resources. Moreover, this study will also provide support for urban low-altitude airspace management and provide a reference value for the development of a reasonable logistics UAV management plan.

Author Contributions

Conceptualization, H.Z.; methodology, J.Y. and C.N.; software, F.W.; validation, J.Y., H.L. and G.Z.; formal analysis, J.Y. and F.W.; investigation, J.Y. and C.N.; resources, J.Y., H.Z. and H.L.; writing—original draft preparation, J.Y.; writing—review and editing, J.Y. and F.W.; visualization, J.Y. and F.W. All authors have read and agreed to the published version of the manuscript.

Funding

This research was funded by the National Natural Science Foundation of China (71971114).

Data Availability Statement

Data will be made available on request.

Conflicts of Interest

The authors declare no conflict of interest.

Abbreviations

Abbreviation Meaning
UAMUrban Air MobilityA new three-dimensional transport system with integrated manned/unmanned aerial vehicle operations on an urban or intercity scale [1,2].
Logistics UAVLogistics Unmanned Aerial VehicleUnmanned Aerial Vehicles (UAVs) used in logistics and transport applications, usually carrying parcels [15].
eVTOLElectric Vertical Takeoff and LandingAn innovative aircraft, vertical takeoff and landing aircraft with an electric power engine [18].
Logistics UAV routeLogistics Unmanned Aerial Vehicle routeAn airway serving logistics UAVs which usually requires pre-planning [36].
NSGA-IINon-dominated Sorting Genetic Algorithm-IIOne of the most popular multiobjective genetic algorithms, which reduces the complexity of non-inferiority sorting genetic algorithms [37].
GAGenetic AlgorithmA stochastic search algorithm that draws on natural selection and natural genetic mechanisms in biology [37].
-Safety IntervalMinimum distance between front and rear logistics UAVs [40].

References

  1. National Aeronautics and Space Administration, SATS: A Bold Vision NASA-Led Technology Development Aimed at Increasing Mobility, Access for Smaller Communities[EB/OL]. Available online: https://www.nasa.gov/centers/langley/news/factsheets/SATS.html#:~:text=The%20Small%20Aircraft%20Transportation%20System%20%28SATS%29%20is%20conceived,initiative%20to%20prove%20the%20SATS%20concept%20will%20work (accessed on 11 April 2023).
  2. National Aeronautics and Space Administration, Urban Air Mobility Airspace Integration Concepts and Considerations[EB/OL]. Available online: https://ntrs.nasa.gov/api/citations/20180005218/downloads/20180005218.pdf (accessed on 11 April 2023).
  3. Ackerman, E.; Strickland, E. Medical delivery drones take flight in east africa. IEEE Spectrum 2018, 55, 34–35. [Google Scholar] [CrossRef]
  4. DHL Express. DHL Express Launches Its First Regular Fully-Automated and Intelligent Urban Drone Delivery Service[EB/OL]. Available online: https://www.dhl.com/global-en/home/press/press-archive/2019/dhl-express-launches-its-first-regular-fully-automated-and-intelligent-urban-drone-delivery-service.html (accessed on 11 April 2023).
  5. Markets and Markets, Drone Logistics and Transportation Market by Solution, Application, Range, User-Global Forecast to 2030[EB/OL]. Available online: https://www.marketsandmarkets.com/Market-Reports/drone-logistic-transportation-market-132496700.html (accessed on 11 April 2023).
  6. Lashari, H.N.; Ali, H.M.; Massan, S.U.R. Applications of unmanned aerial vehicles: A review. Tecnol. Glosas InnovaciÓN Apl. Pyme. Spec. 2019, 2019, 85–105. [Google Scholar] [CrossRef]
  7. Pina-Pardo, J.C.; Silva, D.F.; Smith, A.E. The Traveling Salesman Problem with Release Dates and Drone Resupply. Comput. Oper. Res. 2020, 129, 105170. [Google Scholar] [CrossRef]
  8. Coindreau, M.A.; Gallay, O.; Zufferey, N. Parcel delivery cost minimization with time window constraints using trucks and drones. Networks 2021, 78, 400–420. [Google Scholar] [CrossRef]
  9. Sah, B.; Gupta, R.; Bani-Hani, D. Analysis of barriers to implement drone logistics. Int. J. Logist. Res. Appl. 2020, 24, 531–550. [Google Scholar] [CrossRef]
  10. Sandbrook, C. The social implications of using drones for biodiversity conservation. Ambio 2015, 44, 636–647. [Google Scholar] [CrossRef] [PubMed]
  11. Moshref-Javadi, M.; Winkenbach, M. Applications and Research Avenues for Drone-Based Models in Logistics: A Classification and Review. Expert Syst. Appl. 2021, 117, 114854. [Google Scholar] [CrossRef]
  12. Kwon, H.; Kim, J.; Park, Y. Applying LSA text mining technique in envisioning social impacts of emerging technologies: The case of drone technology. Technovation 2017, 60, 15–28. [Google Scholar] [CrossRef]
  13. Goodchild, A.; Toy, J. Delivery by drone: An evaluation of unmanned aerial ve-hicle technology in reducing CO2 emissions in the delivery service industry. Pergamon 2017, 61, 58–67. [Google Scholar] [CrossRef]
  14. Shi, Z.; Ng, W.K. A collision-free path planning algorithm for unmanned aerial vehicle delivery. In Proceedings of the 2018 International Conference on Unmanned Aircraft Systems (ICUAS), Dallas, TX, USA, 12–15 June 2018; IEEE: Piscataway, NJ, USA, 2018; pp. 358–362. [Google Scholar]
  15. Duan, F.; Li, X.; Zhao, Y. Express UAV Swarm Path Planning with VND Enhanced Memetic Algorithm. In Proceedings of the 2018 International Conference on Computing and Data Engineering, Paris, France, 16–19 April 2018; pp. 93–97. [Google Scholar]
  16. Zhao, Y.; Liu, K.; Lu, G.; Hu, Y.; Yuan, S. Path planning of UAV delivery based on improved APF-RRT* algorithm. In Journal of Physics: Conference Series; IOP Publishing: Bristol, UK, 2020; Volume 1624, p. 042004. [Google Scholar]
  17. Shavarani, S.M.; Nejad, M.G.; Rismanchian, F.; Izbirak, G. Application of hierarchical facility location problem for optimization of a drone delivery system: A case study of Amazon prime air in the city of San Francisco. Int. J. Adv. Manuf. Technol. 2018, 95, 3141–3153. [Google Scholar] [CrossRef]
  18. German, B.; Daskilewicz, M.; Hamilton, T.K.; Warren, M.M. Cargo delivery in by passenger evtol aircraft: A case study in the san francisco bay area. In Proceedings of the 2018 AIAA Aerospace Sciences Meeting, Kissimmee, FL, USA, 8–12 January 2018; p. 2006. [Google Scholar]
  19. Hong, I.; Kuby, M.; Murray, A.T. A range-restricted recharging station coverage model for drone delivery service planning. Transp. Res. Part C Emerg. Technol. 2018, 90, 198–212. [Google Scholar] [CrossRef]
  20. Brunner, G.; Szebedy, B.; Tanner, S.; Wattenhofer, R. The urban last mile problem: Autonomous drone delivery to your balcony. In Proceedings of the 2019 International Conference on Unmanned Aircraft Systems (icuas), Atlanta, GA, USA, 11–14 June 2019; IEEE: Piscataway, NJ, USA, 2019; pp. 1005–1012. [Google Scholar]
  21. Li, J.; Liu, H.; Lai, K.K.; Ram, B. Vehicle and UAV Collaborative Delivery Path Optimization Model. Mathematics 2022, 10, 3744. [Google Scholar] [CrossRef]
  22. Li, S.; Zhang, H.; Li, Z.; Liu, H. An Air Route Network Planning Model of Logistics UAV Terminal Distribution in Urban Low Altitude Airspace. Sustainability 2021, 13, 13079. [Google Scholar] [CrossRef]
  23. Mohamed Salleh, M.F.B.; Chi, W.C.; Wang, Z.K.; Huang, S.; Tan, D.Y.; Huang, T.; Low, K.H. Preliminary concept of adaptive urban airspace management for unmanned aircraft operations. In 2018 AIAA Information Systems-AIAA Infotech@ Aerospace; AIAA: Kissimmee, FL, USA, 2018; p. 2260. [Google Scholar]
  24. Bowen, E.; Pearcey, T. Delays in the flow of air traffic. Aeronaut. J. 1948, 52, 251–258. [Google Scholar] [CrossRef]
  25. Janic, M.; Tosic, V. Terminal airspace capacity model. Transp. Res. Part A Gen. 1982, 16, 253–260. [Google Scholar] [CrossRef]
  26. Majumdar, A.; Ochieng, W.; Polak, J. Estimation of european airspace capacity from a model of controller workload. J. Navig. 2002, 55, 381–403. [Google Scholar] [CrossRef]
  27. Wang, C.; Zhang, X.Y.; Xu, X.H. Simulation study on airfield system capacity analysis using SIMMOD. In Proceedings of the 2008 International Symposium on Computational Intelligence and Design, Wuhan, China, 17–18 October 2008; IEEE: Piscataway, NJ, USA, 2008; Volume 1, pp. 87–90. [Google Scholar]
  28. Zhang, K.; Liu, Y.; Wang, J.; Song, H.; Liu, D. Tree-based airspace capacity estimation. In Proceedings of the 2020 Integrated Communications Navigation and Surveillance Conference (ICNS), Herndon, VA, USA, 8–10 September 2020; IEEE: Piscataway, NJ, USA, 2020; pp. 5C1-1–5C1-8. [Google Scholar]
  29. Bulusu, V.; Sengupta, R.; Polishchuk, V.; Sedov, L. Cooperative and non-cooperative UAS traffic volumes. In Proceedings of the 2017 International Conference on Unmanned Aircraft Systems (ICUAS), Miami, FL, USA, 13–16 June 2017; IEEE: Piscataway, NJ, USA, 2017; pp. 1673–1681. [Google Scholar]
  30. Bulusu, V.; Polishchuk, V. A threshold based airspace capacity estimation method for UAS traffic management. In Proceedings of the 2017 Annual IEEE International Systems Conference (SysCon), Montreal, QC, Canada, 24–27 April 2017; IEEE: Piscataway, NJ, USA, 2017; pp. 1–7. [Google Scholar]
  31. Bulusu, V.; Polishchuk, V.; Sengupta, R.; Sedov, L. Capacity estimation for low altitude airspace. In Proceedings of the 17th AIAA Aviation Technology, Integration, and Operations Conference, Denver, CO, USA, 5–9 June 2017; p. 4266. [Google Scholar]
  32. Sunil, E.; Hoekstra, J.M.; Ellerbroek, J.; Bussink, F.; Nieuwenhuisen, D.; Vidosavljevic, A.; Kern, S. Metropolis: Relating airspace structure and capacity for extreme traffic densities. In Proceedings of the 11th USA/Europe Air Traffic Management Research and Development Seminar (ATM2015), Lisbon, Portugal, 23–26 June 2015. [Google Scholar]
  33. Bulusu, V.; Sengupta, R.; Liu, Z. Unmanned aviation: To be free or not to be free? In Proceedings of the 7th International Conference on Research in Air Transportation, Philadelphia, PA, USA, 20–24 June 2016. [Google Scholar]
  34. Mueller, E.R. Enabling Airspace Integration for High Density Urban Air Mobility; Ames: National Aeronautics and Space Administration (NASA): Moffett Field, CA, USA, 2017. [Google Scholar]
  35. Ren, X.; Chen, C. Construction and application of third-party risk model for unmanned aerial vehicle operation in urban environment. China Saf. Sci. J. 2021, 31, 15–20. [Google Scholar]
  36. Zhang, H.; Wang, F.; Feng, D.; Du, S.; Zhong, G.; Deng, C.; Zhou, J. A Logistics UAV Parcel-Receiving Station and Public Air-Route Planning Method Based on Bi-Layer Optimization. Appl. Sci. 2023, 13, 1842. [Google Scholar] [CrossRef]
  37. Deb, K.; Pratap, A.; Agarwal, S.; Meyarivan, T.A.M.T. A fast and elitist multiobjective genetic algorithm: NSGA-II. IEEE Trans. Evol. Comput. 2002, 6, 182–197. [Google Scholar] [CrossRef]
  38. Jiang, Y.; Ji, W.; He, X.; Su, X. Low-carbon Scheduling of Multi-objective Flexible Job-shop Based on Improved NSGA-II. China Mech. Eng. 2022, 33, 2564–2577. [Google Scholar]
  39. Chen, A.Z.J.; Mo, J.P.T. Modelling of unmanned aerial vehicle deliveries in populated urban areas for risk management. In Proceedings of the 2016 10th International Conference on Software, Knowledge, Information Management & Applications (SKIMA), Chengdu, China, 15–17 December 2016; IEEE: Piscataway, NJ, USA, 2016; pp. 61–66. [Google Scholar]
  40. Zou, Y.; Zhang, H.; Zhong, G.; Liu, H.; Feng, D. Collision probability estimation for small unmanned aircraft systems. Reliab. Eng. Syst. Saf. 2021, 213, 107619. [Google Scholar] [CrossRef]
  41. Yi, J.; Zhang, H.; Li, S.; Feng, O.; Zhong, G.; Liu, H. Logistics UAV Air Route Network Capacity Evaluation Method Based on Traffic Flow Allocation. IEEE Access 2023, 11, 63701–63713. [Google Scholar] [CrossRef]
Figure 1. Logistics UAV delivery scenario schematic.
Drones 07 00582 g001
Figure 2. Logistics UAV operation environment grid schematic.
Drones 07 00582 g002
Figure 3. Logistics UAV operation noise impact schematic.
Drones 07 00582 g003
Figure 4. NGSA−II algorithm schematic diagram [37].
Drones 07 00582 g004
Figure 5. Initial individual coding.
Drones 07 00582 g005
Figure 6. (a) A region in Nanjing, China. (b) Logistics UAV route network in an area of Nanjing, China.
Drones 07 00582 g006aDrones 07 00582 g006b
Figure 7. Noise impedance distribution in an area of Nanjing, China.
Drones 07 00582 g007
Figure 8. Population density distribution in an area of Nanjing, China.
Drones 07 00582 g008
Figure 9. The Pareto front.
Drones 07 00582 g009
Figure 10. Logistics UAV route network operation capacity iteration for different operation times.
Drones 07 00582 g010
Figure 11. Relationship between safety intervals and operation capacity at different operation times.
Drones 07 00582 g011
Figure 12. Relationship between operation time, safety interval, and average operation capacity.
Drones 07 00582 g012
Figure 13. Relationship between operation time, safety interval, and average total impedance value.
Drones 07 00582 g013
Figure 14. Relationship between flight speed and logistics UAV route network operation capacity.
Drones 07 00582 g014
Figure 15. Relationship between flight speed, the average maximum operation capacity, and average operation capacity.
Drones 07 00582 g015
Table 1. Delivery plan information.
Delivery Plan
Serial Number
RoutePackage Weight (kg)
1O1O22
k − 1O2O3O41
3O2O3Oj2.5
2O1O3O4Oj0.5
4O3O43
kO4O5Oj1.5
5O1O2O33
Table 2. Parameter setting [39].
ParameterMeaningValue
w u a v The length of logistics UAV wingspan1 m
l u a v The length of logistics UAV fuselages0.5 m
h u a v The height of logistics UAV fuselages0.5 m
m u a v Logistics UAV unladen mass4 kg
m d e l i v e r y The mass of logistics UAV carried package[0, 3] kg
m max The upper limit of logistics UAV takeoff mass7 kg
v u a v Logistics UAV flight speed10 m/s
T a i r r o u t e The takeoff interval time between the two logistics UAVs before and after1.5 s
ε max The   upper   limit   of   ε ( m d e l i v e r y ) 3
S The average sheltering factor of the route0.5
α Fixed parameter106 J
μ Fixed parameter100 J
L C M F Y The people’s acceptable value of logistics UAS noise30 Db
L i j max The upper limit of logistics UAV flight distance4 km
ω risk Safety impedance weighting coefficients0.4
ω n o i s e Noise impedance weighting coefficients0.3
ω cos t Cost impedance weighting coefficients0.3
ZThe number of retained individuals100
N max The maximum number of iterations1000
Disclaimer/Publisher’s Note: The statements, opinions and data contained in all publications are solely those of the individual author(s) and contributor(s) and not of MDPI and/or the editor(s). MDPI and/or the editor(s) disclaim responsibility for any injury to people or property resulting from any ideas, methods, instructions or products referred to in the content.

