Article

Mapping the Urban Environments of Aedes aegypti Using Drone Technology

by
Kenia Mayela Valdez-Delgado
1,
Octavio Garcia-Salazar
2,
David A. Moo-Llanes
1,
Cecilia Izcapa-Treviño
3,
Miguel A. Cruz-Pliego
3,
Gustavo Y. Domínguez-Posadas
3,
Moisés O. Armendáriz-Valdez
3,
Fabián Correa-Morales
4,
Luis Alberto Cisneros-Vázquez
1,
José Genaro Ordóñez-González
1,
Ildefonso Fernández-Salas
5 and
Rogelio Danis-Lozano
1,*
1
Centro Regional de Investigación en Salud Pública (CRISP), Instituto Nacional de Salud Pública (INSP), 4a Av. Norte Esquina 19 Calle Poniente s/n, Tapachula 30700, Chiapas, Mexico
2
Centro de Investigación e Innovación en Ingeniería Aeronáutica (CIIIA), Facultad de Ingeniería Mecánica y Eléctrica, Universidad Autónoma de Nuevo León (UANL), Apodaca 65582, Nuevo León, Mexico
3
Centro Nacional de Prevención de Desastres (CENAPRED), Secretaría de Seguridad y Protección Ciudadana, Gobierno de México, Av. Antonio Delfín Madrigal 665 Pedregal de Santo Domingo, Ciudad de México 04360, Mexico
4
Centro Nacional de Programas Preventivos y Control de Enfermedades (CENAPRECE), Secretaría de Salud, Gobierno de México, Benjamin Franklin 132, Ciudad de Mexico 11800, Mexico
5
Facultad de Ciencias Biológicas, Universidad Autónoma de Nuevo León (UANL), Ave. Pedro de Alba s/n cruz con Ave. Manuel L. Barragán, San Nicolás de los Garza 66455, Nuevo León, Mexico
*
Author to whom correspondence should be addressed.
Drones 2023, 7(9), 581; https://doi.org/10.3390/drones7090581
Submission received: 30 June 2023 / Revised: 31 August 2023 / Accepted: 1 September 2023 / Published: 15 September 2023
(This article belongs to the Special Issue Evidence-Based Drone Innovation & Research for Healthcare)

Abstract

:
Aedes aegypti is widely distributed worldwide and is the main vector mosquito for dengue, one of the most important infectious diseases in middle- and low-income countries. The landscape composition and vegetation cover determine appropriate environments for this mosquito to breed, and it is fundamental to define the most affordable methodology to understand these landscape variables in urban environments. The proposed methodology integrated drone technologies and traditional entomological surveillance to strengthen our knowledge about areas suitable for Ae. aegypti infestation. We included an analysis using the vegetation indexes, NDVI and NDVIRe, and their association with Ae. aegypti larvae and adults in houses from the El Vergel neighborhood Tapachula, Chiapas, Mexico. We used drone technology to obtain high-resolution photos and performed multispectral orthomosaic constructions for the data of vegetation indexes with a kernel density analysis. A negative binomial regression was performed to determine the association between the numbers of Ae. aegypti larvae and adults with the kernel density based on NDVI and NDVIRe. Medium and high values of kernel density of NDVIRe (both p-value < 0.05) and NDVI (both p-value < 0.05) were associated with a higher amount of mosquito adults per houses. The density of Ae. aegypti larvae per house did not show an association with medium and high values of NDVIRe (both p-value > 0.05) and NDVI (both p-value > 0.05). The vegetation indexes, NDVI and NDVIRe, have potential as precise predictors of Ae. aegypti adult mosquito circulation in urban environments. Drone technology can be used to map and obtain landscape characteristics associated with mosquito abundance in urban environments.

1. Introduction

Vector-borne diseases (VBDs) have become a significant public health concern due to their distribution and incidence in the last decade [1]. Land use and habitat influence nearly every component of the transmission cycle of VBDs [2]. The global distribution of mosquito-borne viruses has received research attention recently, particularly viruses transmitted by Aedes mosquitoes across the tropics and subtropical countries [3]. These diseases, e.g., dengue, yellow fever, and chikungunya, present a significant public health burden, particularly in light of recent spread events in which each disease has emerged either in new regions or in new environments [3,4]. Urban environments have specific features for mosquito populations [5,6]. Anthropogenic modifications of land use and land cover create an overabundance of resources and increase the abundance of Ae. aegypti and Culex quinquefasciatus [7], and the dominance of vector-competent species in urban areas poses a potential risk for epidemics of mosquito-borne diseases [8]. México is densely populated, and its population has increased rapidly from 97 million in 2000 to > 120 million in 2020. The country has large tropical and subtropical regions [9,10]. Additionally, it has high levels of foreign trade and tourism, which encourage human movement via intensive migration from Central American countries. In addition, rapid urbanization has also encouraged dengue disease to spread throughout Mexico over the past 20–30 years [9,11,12].
The scientific and technological development of drones has progressed exponentially [13,14,15]. The technology offered by drones allows for higher resolution images to be taken than those obtained with traditional means, such as satellites and manned aircraft. Through the review of scientific literature, Carrasco et al. [16] documented evidence of the use of unmanned aerial vehicles (UAVs) in entomological surveillance activities and mosquito control in different countries worldwide. In America, a few studies used drones to identify breeding sites for Anopheles darlingi larvae in Peru [17] and breeding sites of Ae. aegypti in Brazil [18]. Recent research approaches have also used drone technology to map different sites in zones inaccessible to human beings. A previous work implemented a standardized methodology for monitoring, detecting, and identifying the breeding sites of Ae. aegypti in a neighborhood of Tapachula, Chiapas, Mexico. It was the first study of its kind in this country [19]. A valuable finding of this research was that through aerial surveillance, it was possible to identify breeding places for mosquitoes in domestic areas inaccessible to traditional ground surveillance, making it possible to propose drones as a useful and complementary tool in surveillance programs and mosquito control [19].
Additionally, drones provide spatially and temporally accurate data to understand the linkages between disease transmission and environmental factors [14,15,20,21]. Different methodologies have been evaluated for elaborating prediction models using different landscape elements. Recently, a predictive model was developed with a partial least squares methodology, which considered the different types of variables involved and the geographic distribution of houses in the south of Mexico. Muñiz et al. [22] demonstrated the use of images captured by UAVs in generating a housing risk index for the abundance of Ae. aegypti in Tapachula, Chiapas, México. We presented a basic methodology for mapping complex urban environments of Ae. aegypti with drones that the house risk index study did not identify [22].
The use of drones for community mapping can provide detailed maps of human settlements to understand disease transmission at the local scale [16]. Using this technology could provide useful information, such as the urban environment of Ae. aegypti, through vegetation cover maps from houses. Thus, this study aimed to apply drone technology to obtain information on vegetation cover that could help with the surveillance activities of Aedes mosquitoes in urban environments of Tapachula, Chiapas, México. We designed a strategy to capture images by a drone to obtain vegetation cover data from 216 houses in the El Vergel neighborhood. Then, we conducted entomological studies of Ae. aegypti immature and adult specimens in the same dwellings. Finally, we studied the association between mosquito densities and the presence of vegetation cover. The proposed methodology in this paper integrated drone technologies and the medical entomology approach for entomological studies of the urban mosquito ecosystem.

2. Materials and Methods
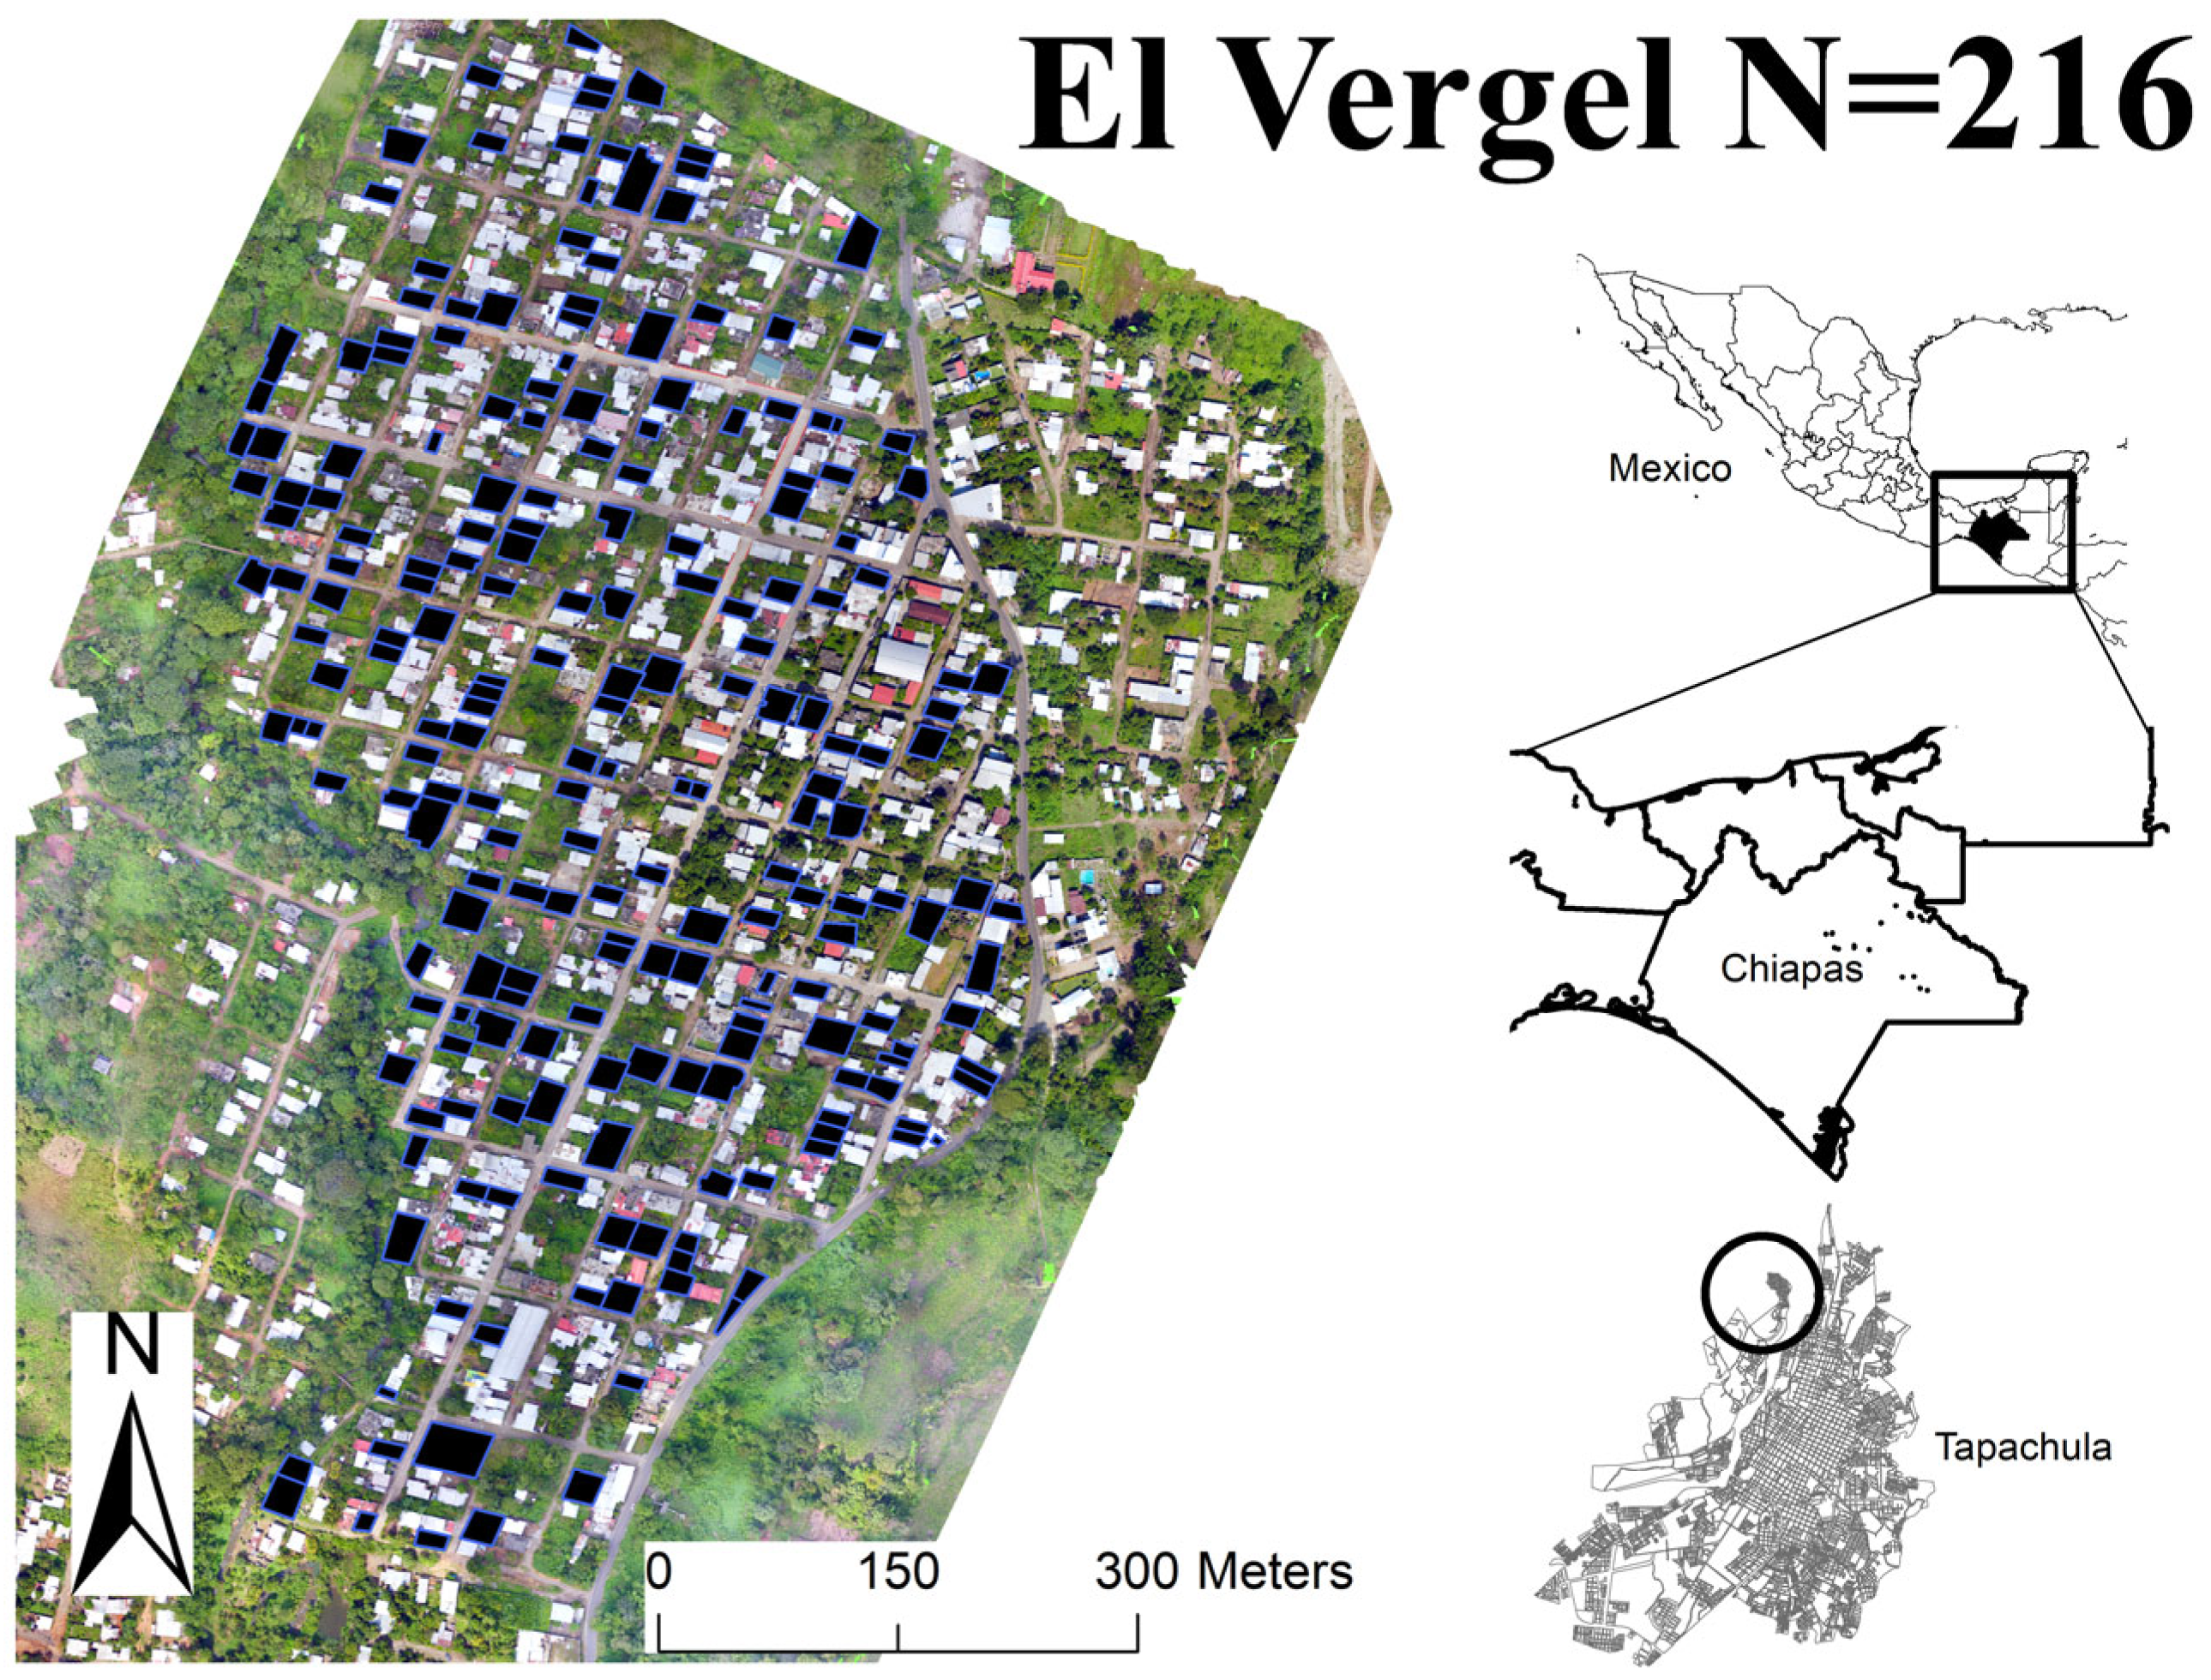
2.1. Study Area

The city of Tapachula is one of the eight socioeconomic provinces of the state of Chiapas, has 353,706 inhabitants, and is located on the southern pacific coast of Mexico. The altitude ranges from sea level to 2600 m, and its ecosystems are cattail marshes, palm groves, and mangroves near the coast, temperate rainforest, and low- and medium-growth rainforest near Sierra Madre de Chiapas [10]. It is an important coffee and cocoa growing area, and the coastal plain has several orchards and other cultivars. Based on the National Institute of Statistics and Geography [10], the average annual temperature of the city is about 21.7 °C with rainfall of 1000–5000 mm. The climate is warm/humid temperate with a heavy rainy season from May to November [10]. Three main rivers cross the city: Texcuyuapán, Coatán, and Manga de Clavo. El Vergel is a neighborhood in the Northwest of Tapachula, Chiapas with an area of 433 km2 and an estimated population of 2590 people in 592 regions of interest (Figure 1).

2.2. Aerial System

This research used a hexacopter UAV model, Matrice 600 DJI (DJI® Austin, TX, USA), a multirotor UAV with six rotors (Figure 2). The air vehicle included a gimbal for mounting a ZenmuseX5 camera [23] (DJI® Austin, TX, USA). Independently, a multispectral camera, MicaSense RedEdge-MX [24], with an RGB sensor and four spectral bands was also placed, considering the range: green (G, 530–570 nm), red (R, 640–680 nm), red edge (RE, 730–740 nm), and near infrared (NIR, 770–810 nm) (AgEagle Aerial Systems Inc.®, Wichita, KS, USA). Thus, it was possible to obtain shots from both cameras in a single flight, which reduced work time in the field.

2.3. Software Interface and Sensors

The software interface of the DJI drone was downloaded through the official DJI website (https://www.dji.com accessed on 5 November 2019) and installed on a laptop computer as a ground station. The Pix4Dmapper [25] was installed on the computer in order to obtain photogrammetry. The MicaSense RedEdge M multispectral camera was calibrated on the ground based on the instructions provided by the manufacturers (Supplementary Materials, Figure S1) [25]. In addition, the weather was verified to obtain suitable state variables, such as temperature, humidity, cloud cover, wind speed, precipitation, and sun position at the zenith, by using the UAV-Forecast application (UAV-Forecast® Cupertino, CA, USA). This information is crucial since it determines the amount of shadow of the objects on the surface of the Earth, influencing the absence of information in photogrammetric processing [26].

2.4. Flight Planning

First, the El Vergel neighborhood was studied to identify the topography, vegetation, obstacles, and possible sources of interference on the ground using the Google Earth platform [27]. The Pix4D Capture [25] application on the IPAD mini 4 was used, and the flight was established and operated through the polygons defined in the Pix4D Capture [25] with an overlap between the photographs of 75%, a height of 100 m above the take-off points of the drone, and an average speed of 8 m/s of flight. Based on this information, the flight time for each polygon was estimated, taking into account the capacity of the batteries, which was around 20 min. The Pix4D [25] was used to define the flight mission in real-time and verified that the system was updated for adequate operation with the ground station, tablet or computer, drone, and radio control software. Figure S2 in the Supplementary Materials shows the process of initializing the drone to start the mission (Supplementary Materials, Figure S2).

2.5. Execution of Overflights

In the El Vergel neighborhood, flights based on protocols (Supplementary Materials, Figure S3) were developed by the National Center for Disaster Prevention to ensure the success of the missions, considering the Official Mexican Standard NOM-107-SCT3-2019 that establishes the requirements to operate a remotely piloted aircraft system, the Mandatory Circular for the Use of Remotely Piloted Aircraft [28]. Once the landing and take-off stages were defined, the overflights were performed with the characteristics described in the planning stage (Supplementary Materials, Figure S3). The GPS sensors provided acceptable accuracies between 3 and 5 m for the horizontal and vertical axes of the cartographic products, and the coordinates of control points obtained in the GLONASS constellation cabinet were taken as a reference to adjust the images from both cameras. A stereoscopic pair data adjustment was performed through the triangulation process to increase the density of the points obtained by the GPS, calculating the coordinates for any midpoint in two stereoscopic pairs [29].

2.6. Orthomosaic Construction

The cartographic products were obtained for both cameras, with separate processing performed using Pix4Dmapper [30]. Obtaining the high-resolution RGB Orthomosaic was based on the algorithms implemented by the Pix4D software [25], which automatically considered the overlap between each of the photographs and generated the points of agreement between each of them [30]. This same process was carried out both for the photographs obtained from the optical camera and for those obtained with the multispectral camera, with the difference being that for the second (multispectral), the calibration was carried out in the field and then integrated to construct the multispectral. According to the manufacturer’s instructions, the orthomosaic generated from the photographs with the multispectral camera was combined between its bands to highlight elements that were sought in the image, such as the 4-3-2 combination in the RGB cannon [30].

2.7. Vegetation Indexes

Finally, the different vegetation indexes were generated using the ArcMap software, the raster calculator tool [31]. These indices were as follows:
a)
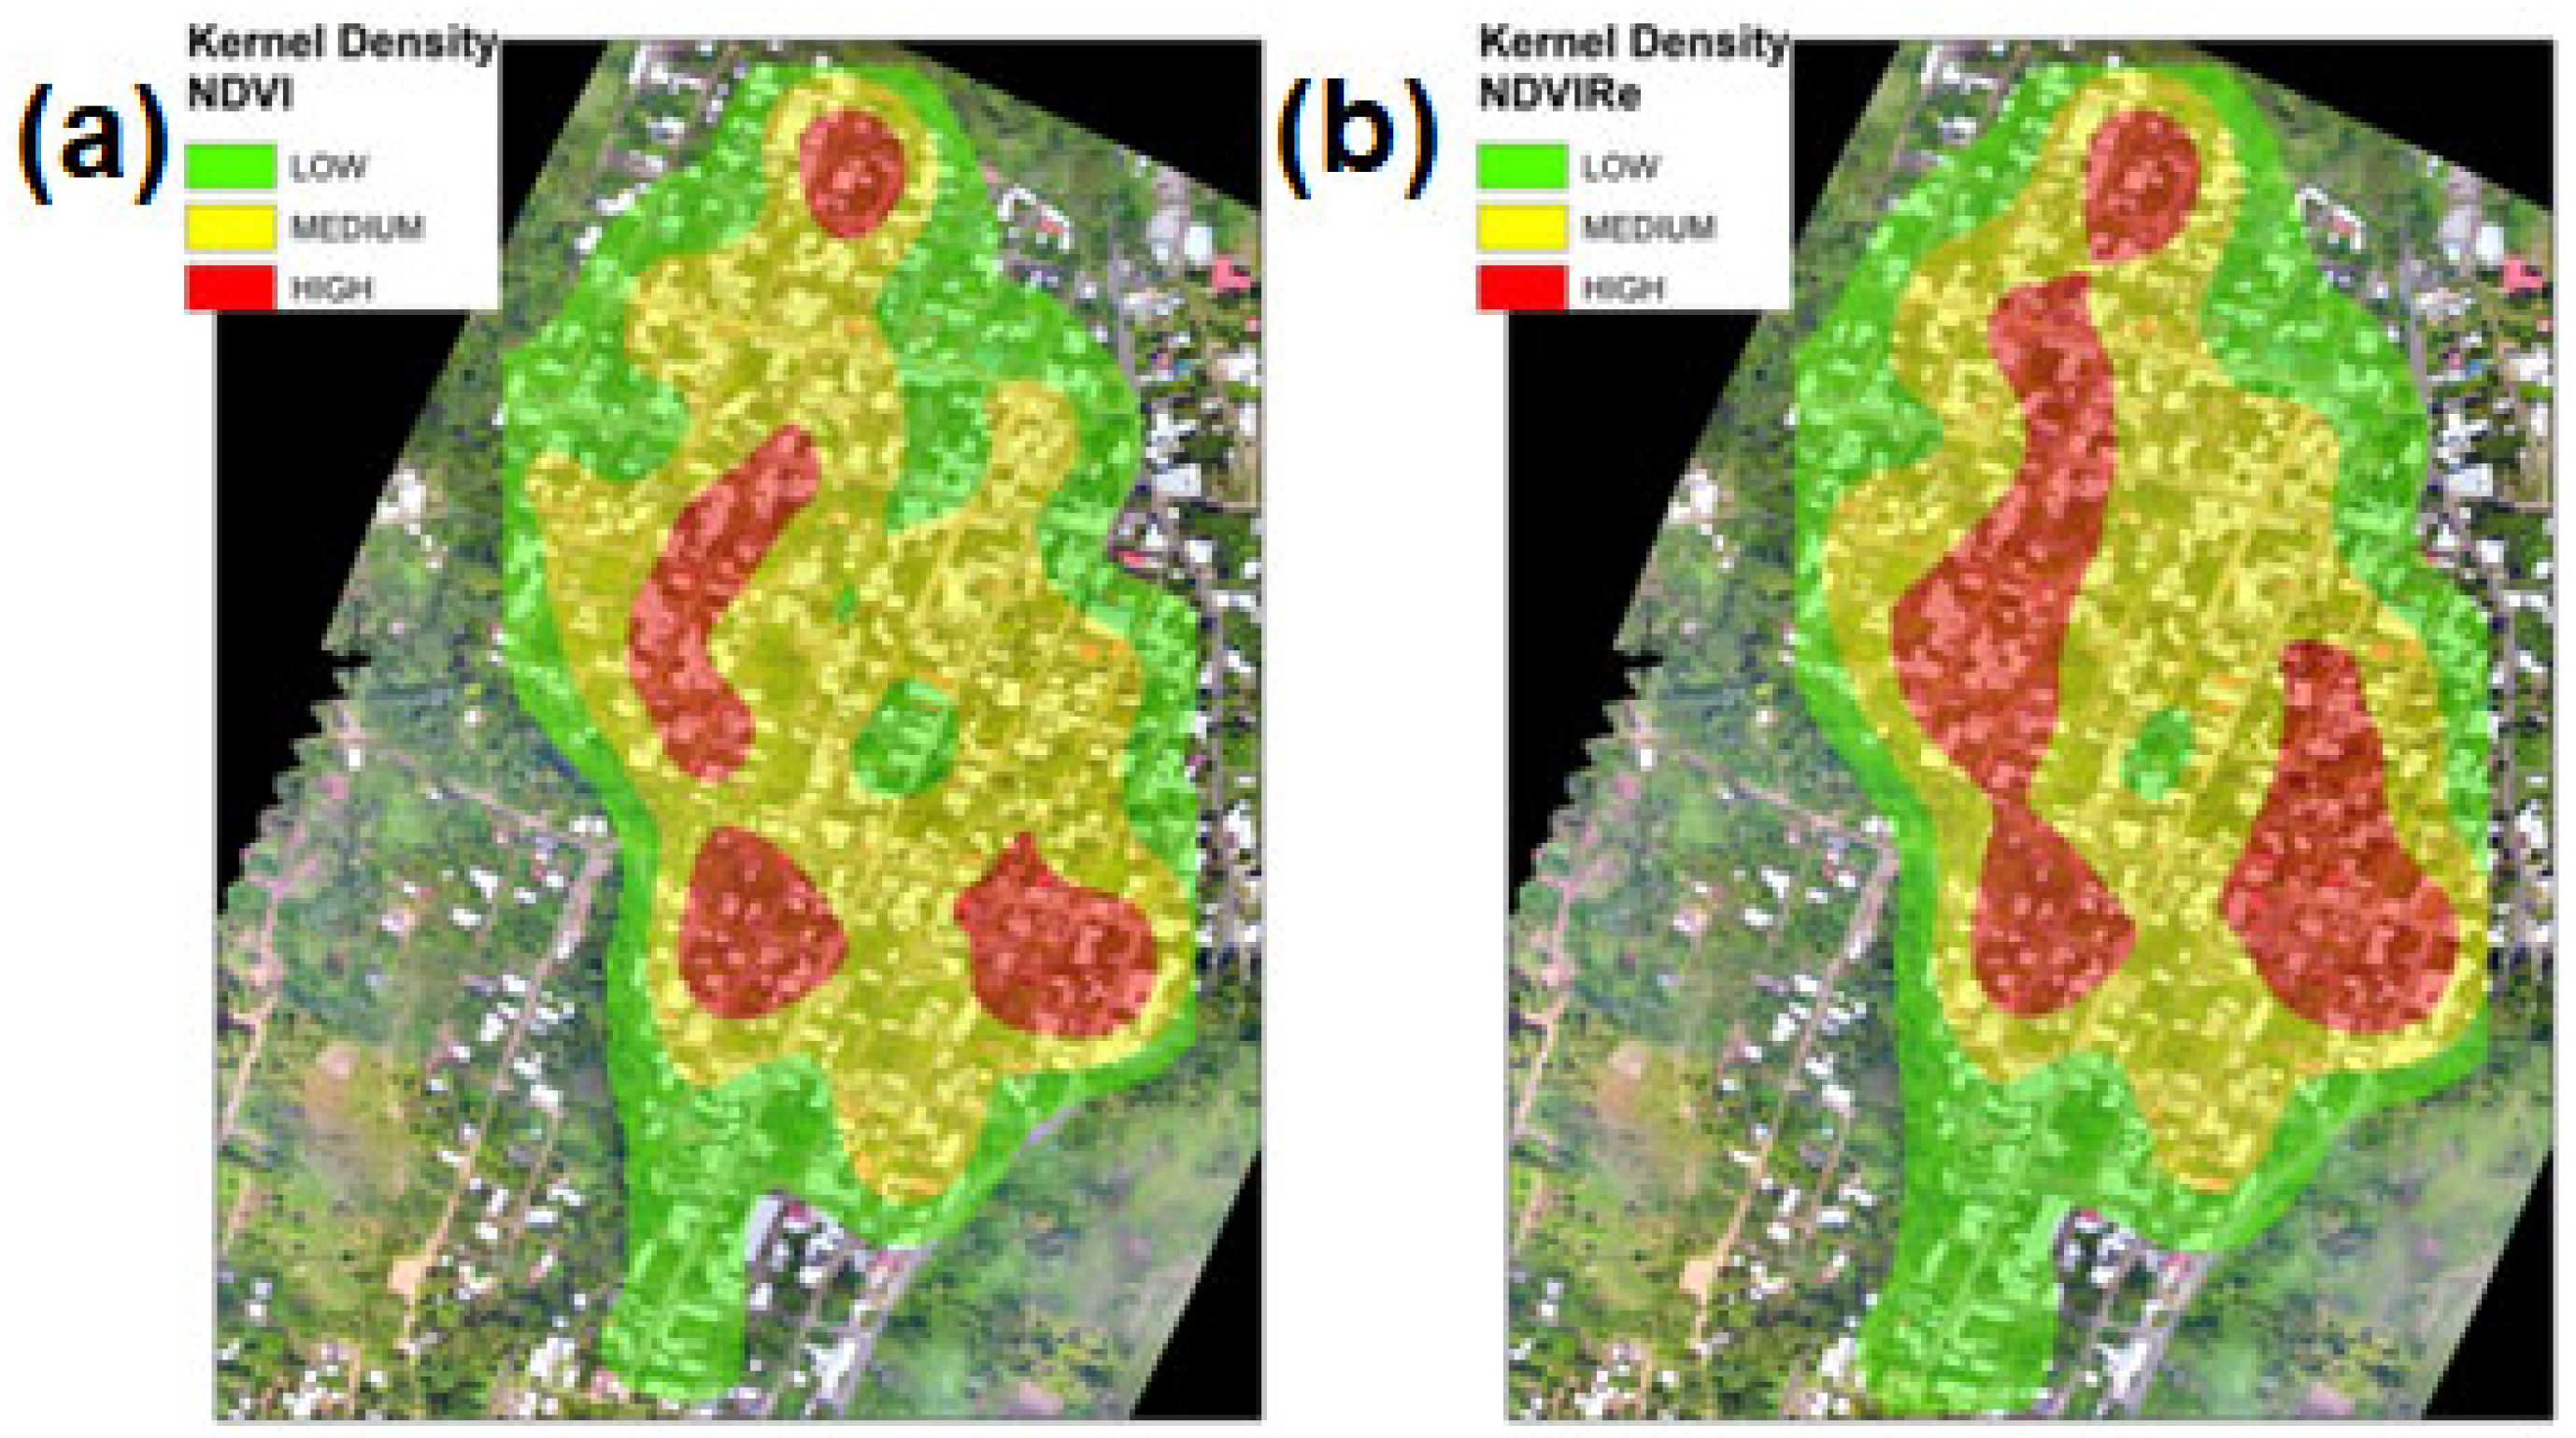
Normalized Differential Vegetation Index (NDVI). This index makes it possible to obtain biomass values and their chlorophyll response, mainly in the near-infrared and red spectra, which is related to the photosynthetic activity of plants, allowing their vigorousness to be determined. The spectral response of the vegetation is visible in the red and near-infrared bands. These values are between −1 and 1; those above 0.1 refer to the presence of vegetation, and the higher the value, the greater the vigor of the plants. Equation: R N I R R r e d R N I R + R r e d   [32,33].
b)
Normalized Difference Vegetation Index RedEdge (NDVIRe). This spectral index is constructed as a mixture of NIR bands and a band using a narrow spectral range between visible red and NIR. It is more sensitive than NDVI during a certain period of crop maturation. It is more valuable than NDVI for intensive use throughout the growing season, as NDVI often becomes inaccurate when plants accumulate the maximum possible amount of chlorophyll. Equation: R N I R R r e d   e d g e R N I R + R r e d   e d g e [33,34].

2.8. Fieldwork Entomological Surveys

We surveyed 216 houses in the El Vergel neighborhood in Tapachula, Chiapas from 19 November to 4 December 2019 (Figure 1). Written consent was obtained from inhabitants of legal age. The entomological survey searched for immature and adult Ae. aegypti mosquitoes. The field technicians searched the Ae. aegypti breeding sites and looked at all containers inside houses, in the backyard, and on roofs when it was possible. The Ae. aegypti positive containers, and the number of eggs, larvae per stage, and pupae per container were counted manually and recorded per house [35]. In each house, we recorded the total abundance on immature Ae. aegypti to use for further analysis. Taxonomy keys were used to identify specimens in the field [36]. Backpack aspirators captured mosquitoes inside houses. The mosquitoes were counted manually and recorded per house.

2.9. Data Analysis

Kernel Density. Each house lot was defined as the polygon that represents the front lot, housing construction, and backyard. First, we projected 100 random points on the ArcMap® 10.3 platform into each house lot [31]. A kernel density analysis was performed, using the vegetation indexes as independent variables. Subsequently, the NDVI and NDVIRe values based on the 100 random points were averaged to obtain an average value for each house. We used kernel density analysis [31] to measure the average density around each neighborhood point based on the vegetation indexes. Subsequently, the continuous results of kernel density were categorized into three levels: low, medium, and high.
Statistical Model. Using Stata v15.0 (StataCorp®, Texas, USA), a negative binomial regression was performed to determine the association between the number of immature stage larvae and adults of Ae. aegypti with the values of the NDVI and NDVIRe indexes. Three levels of kernel density were defined for each of the indexes (low, medium, and high) as independent variables to determine the relationship with the dependent variables (larvae and adults) to be incorporated in the negative binomial regression analysis. This type of regression was selected because the mean parameter in the population was not identical in all the subjects of the study population. This method allows for analyzing the over-dispersion of the data in a Poisson model. Negative binomial regression predicted the logarithm of the outcome with a linear combination of exposure variables. Let z to be the counts of larvae and adults; then, the negative binomial regression is defined as:
log z = α + β 1 X 1 + β 2 X 2 + + β n X n ,
where α is the intercept and β i , for i = 1,2, …, n are the regression coefficients for each variable of interest (vegetation indexes). The outcome variable was larvae and adults by house, and the variable layers of interest were the NDVI and NDVIRe indexes [37].
A matrix of Spearman correlation coefficients was created for larvae, adults, and exposure variables of the vegetation indexes to evaluate the collinearity between the independent variables. Correlation coefficient matrices were constructed to explore potential collinearity for the number of larvae/adult exposure variables and kernel density values for the vegetation indexes. Since a constant variance is not assumed in the negative binomial regression, heteroscedasticity was not formally evaluated but was explored using residual plots. Finally, the Pregibon statistic was calculated to determine the goodness of the link function by calculating the standard error of the linear prediction of the beta calculated in the regression models. The Pregibon test statistic takes the candidate model’s outcome predictions (and their squares) as predictors in a secondary regression. The resulting t-test p-value should be negligible if the link function is correct.

3. Results

3.1. Drone Flights

The development of a flight plan with the optimal characteristics for the conditions of a semi-urban area facilitated the establishment of flight protocols, taking into account the federal guidelines (Supplementary Materials, Table S1). This article implemented the methodology used for optimal use and decision-making using drones. The flights covered an area of 85 Ha of El Vergel, Tapachula, Chiapas during the dry season (12 and 13 November 2019). The average temperature of the drone during the flights was 36.2 °C, while the average humidity percentage was 44.5% (Table 1).
One drone flight could take 15–20 min and, during this time, it was able to take photos over 12–15 hectares at 100 m with a ground resolution of 2.6 cm/pixel. The intervals between flights depended on battery capacities, calibration cameras, and security procedures from the start point. The data sheet parameters of both drone cameras are shown in Table 2. The flight was designed to cover each study polygon (Figure 3) and obtain the necessary image overlap and quality [30].

3.2. Cartography

A total of 7550 photographs corresponding to the blue, green, red, NIR, and red edge bands were taken from the MicaSense camera, and 1122 pictures of the visible spectrum were taken with the ZemmuseX5 camera. An orthomosaic with a resolution of 7.4 cm/pixel and 2.6 cm/pixel for the multispectral and visible spectrum was built by Pix4Dmapper vs. 4.3.31 [30]. The orthomosaic of the El Vergel neighborhood can be seen in great detail, including the houses, roads, trees, bushes, rivers, and paths (Figure 4). Values of the NDVIRe index fell into a range of −0.12 to 0.47, while NDVI had a range of −0.13 to 0.73 (Supplementary Materials, Figure S4). For NDVIRe values, 114 houses (52.8%) had values below the average (0.07), and 102 houses (47.2%) had values above the average. For NDVI values, 107 houses (49.5%) had values below the average (0.11) and 109 houses (50.5%) had values above the average (Figure 5).

3.3. Entomology Surveillance

Each house surveyed took 20–30 min for two technicians, who could visit 12–14 houses/per day. In total, 216 (36.5%) houses were surveyed out of 592 available in the El Vergel neighborhood, Tapachula, Chiapas of which 72 houses were positive for immature stages of Ae. aegypti (33.3%), 52 of which coincided with adult mosquitoes (72.2%). We found 4046 containers, flowerpots, non-disposable plastic containers, and plastic buckets and tubs in the study area. On the other hand, of 1115 containers holding water, 84 were positive for Ae. aegypti immature stage (breeding sites) in 11 types of containers. Cement washbasins (large) were the most common Ae. aegypti immature stage container; 29.6% of this type of container was positive. Fourteen container classifications did not have Ae. aegypti immature stages (Supplementary Materials, Table S1).
In addition, when inspecting the containers present in the houses, a total of 7024 larvae (33 ± 92) were found as follows: 353 (2 ± 9), 1634 (8 ± 22), 2473 (11 ± 36), and 2564 (12 ± 36) of first, second, third, and fourth stages, respectively. Likewise, 1090 pupae (5 ± 15) were counted. The most productive container of Ae. aegypti immatures was the cement washing (large) type; 5374 larvae and 949 pupae were found for 76.5% and 87.0% of these container types, respectively (Table 3). We found Ae. aegypti mosquitoes (48.2%) in 104 houses of which 75 houses were positive for female mosquitoes (34.7%) and 72 houses for male mosquitoes (33.3%). A total of 349 mosquitoes of Ae. aegypti (2 ± 3) were found in surveyed houses of which 175 were female mosquitoes (1 ± 2) and 174 were male mosquitoes (1 ± 2). Finally, the NDVI (0.19 ± 0.23) and NDVIRe (0.11 ± 0.12) indexes showed minimum values of −0.14 and −0.12 and maximum values of 0.74 and 0.47, respectively (Table 3).

3.4. Kernel Density

The highest values of the kernel density were distributed across a large part of El Vergel. In contrast, closer to the periphery, the kernel density was lower (Figure 6). The NDVI and NDVIRe indexes presented a high-density fringe in some areas of the neighborhood periphery and a medium-density fringe across almost the whole of El Vergel, Tapachula, Chiapas (Figure 6).

3.5. Statistical Model

A Poisson regression analysis (univariate and bivariate model) between the density of adults of Ae. aegypti and the kernel density of NDVIRe and NDVI showed that medium and high values for both NDVIRe and NDVI were significant. The significant p-values < 0.05 in the coefficients of determination identified that each change was positive at the pixel level (value), indicating an increase in the density of adults of Ae. aegypti in the houses of the study area. Let z be the number of adults. The first model for adult density and NDVIRe we obtained was:
log z = 0.38 + 2.63 X 1 + 2.38 X 2 ,
while for NDVI, the resulting model was:
log z = 0.38 1.85 X 1 2.03 X 2
The models (univariate and bivariate) for immature stages corresponding to the density of Ae. aegypti larvae at medium and high levels for both NDVIRe and NDVI were not statistically significant (p-value > 0.05).

4. Discussion

In Mexico, the use of drones for public health is very limited. The three main studies have focused on (a) identification of Ae. aegypti from images taken by drones in Tapachula, Chiapas [19]; (b) Muniz et al. [22] provided a proof of concept of the use of drone technology to collect spatial information of the landscape in real time through multispectral images for the generation of a multivariate predictive model that allows for the establishment of a risk index relating sociodemographic variables with the presence of the vector in its different larval, pupal, and adult stages; and finally, (c) the use of drones for the cooling, handling, transport, and release of male Ae. aegypti mosquitoes raised in insectarium conditions for release in the field [38]. The main contribution of this study was as follows: (a) the methodology was designed to include drone technology in public health to strengthen our knowledge of Aedes mosquito development in urban areas, (b) improvement of operational planning, drone flights, and mapping urban complex mosquito ecosystems, (c) analysis of a strategy using drone-specific cartography and vegetation indexes for surveillance mosquito programs, and (d) the successful use of drone technology in urban environments.
Flight planning is a critical element of drone use since the quality of the results depends on it. It is necessary to consider the meteorological conditions for the best drone performance and the characteristics of the terrain and to avoid electromagnetic interference that could put the activity at risk. The multirotor drone system is the best option for areas with high tree vegetation coverage or urban areas with many obstacles because it takes off and lands from very small spaces [39]. Flight altitude needs to be carefully determined, taking into account the type of sensor to be used, the data analysis goals, the level of scene complexity, and legal requirements. Using RGB and NDVI orthophotographs, it was found that the best flight altitude to identify tolares of Parastrephia lepidophilla and Distichia muscoides was 25 m, followed by 50 m [40]. Studies using drones to monitor mosquito-breeding sites tend to fly at 50 to 100 m [17,21,39]. For our study, the resolution obtained for the MicaSense® camera used was 0.07 m/pixel at an altitude of 100 m; at this spatial resolution, the smallest elements of the Ae. aegypti urban landscape could be detected. We recommend making drone flights more than 80 m with small drones (micro with a weight equal to or less than 2 kg) for security in overcrowded urban areas [19]. The highest fly altitude will depend on national regulations. In México, all drones must fly at a maximum height of 120 m [28].
Vegetation indexes are an indirect measure of environmental elements that affect mosquito populations [41], and these present high correlations with mosquito behavior and biological cycles. One of the most commonly used is NDVI [42]. There is evidence that for Ae. aegypti the three-vegetation shadow supports mosquito development [43,44]. Landau and van Leeuwen [45] found that Ae. aegypti presence was positively associated with structure and medium height trees and negatively associated with bare earth through a study of sixteen land cover variables derived from 2010 NAIP multispectral data and 2008 LiDAR in Tucson, AZ., USA. In our study, 63% and 75.5% of houses showed values between −0.2 and 0.2 for NDVI and NDVIRe. Near zero or negative values represented water, built-up areas, and bare earth, whereas positive values were densely vegetated areas [46,47]. Some studies have classified NDVI values of 0.2 to 0.5 as shrub and grassland and more than 0.501 as a tropical urban forest [48]. Only 35 houses (16.2%) showed values over 0.5 in the NDVI index, and none showed NDVIRe values over 0.5. Although the NDVI is a widely used index for vegetation assessment, expressing vegetation status and quantified vegetation attributes [49,50], NDVI is very sensitive to background factors, such as the brightness and shade of the vegetation canopies, soil brightness, and soil color [50].
Remote sensors and geographic information systems can analyze factors associated with malaria transmission and Anopheles species development in rural and semi-urban environments [41,51,52,53,54,55]. Recently, some studies have recommended using a high spatial resolution to better identify and characterize Anopheles mosquitoes’ breeding sites [16,41]. Home recipients, such as plastic and tin buckets and disposable plastic containers with a diameter of 20–30 cm, can be detected by high-resolution drone imagery [19]; these containers hold water and can function as breeding sites, playing a crucial role in Ae. aegypti population dynamics [19,35]. Regarding temporal resolution, drone images can be taken in the daytime and more frequently than the study requires. In contrast, the time of day a satellite takes the imagery cannot be determined by the user [16].
Tapachula, Chiapas has two defined seasons, the dry and rainy seasons. Precipitation amounts, in conjunction with temperature and vegetation cover, determine breeding sites and conditions for mosquito establishment. Future studies need to evaluate populations at different times of the year to strengthen the vegetation index assessments. The analysis employed in this study yielded key findings; small but significant associations are observed between the count, the number of adult stages, and the kernel density between the vegetation index of NDVIRe, adjusting for NDVI. The association between the adult stages and the high and medium NDVIRe kernel density observed was probably due to the spatial scale of the pixel values being too large to detect a possible increase in the density of adult mosquitoes on a finer spatial scale. The vegetation index, NDVIRe, was included as a potential indicator of the circulation of adult mosquitoes and of a greater probability of increased abundance of the vector in houses with high and medium kernel densities for which a positive association was expected with the densities of adult mosquitoes. These findings showed that the vegetation index NDVIRe positively affected the abundance of adult Ae. aegypti mosquitoes.
Since aquatic habitats created by anthropogenic land-use modification are positively correlated with the abundance of Ae. aegypti [7], all house recipients and containers that can hold water need to be recorded [35]. Additionally, the entomology ground surveillance needs to occur simultaneously with the taking of aerial images to record the same scenes [16,19]. The aerial images of this study were taken in the first week of the entomological survey (13 days). Eighty-four containers were positive as Ae. aegypti breeding sites (2.1%), in eleven container categories. Entomological data of the El Vergel neighborhood during the rainy season (August 2019), published previously by the author [19], found 177 breeding sites of Ae. aegypti (6.4%) in 21 categories of containers [19], reporting 53% more positive containers in the rainy season in the same container categories. The cement washbasin (large) was the most positive and productive container of Ae. aegypti immature stages. The cement washbasin (large) container was also the most positive and productive container during the rainy season [19]. The same container was reported as the most productive in other studies carried out in Tapachula, Chiapas [35]. A total of 7024 larvae and 349 mosquitos of Ae. aegypti were recorded in this study. The author also reported 4996 larvae and 494 mosquitos of Ae. aegypti mosquito in the rainy season [56]. Other studies have reported that Ae. aegypti population dynamics fluctuate depending on the season based on mean factors, such as temperature, precipitation, and breeding sites available [57,58,59,60], including studies of Ae. aegypti population dynamics in other villages of Tapachula, Chiapas [61].
Our approach is not scalable for big cities due to drone technological limitations and the current national legal requirements for drone operations [28] and personal data protection [62,63]. Although drone technology has progressed quickly and will continue to improve, legal changes permitting the use of this technology in overpopulated areas will be required. Future research needs to develop, improve, and analyze other efficient ways for drone flights to cover areas in big cities to scale these interventions. This approach could help to apply these technologies to public health to strengthen program operations and decisions. This methodology helps us to understand the urban landscape and housing environments, and these elements could also be associated with other vectors, such as kissing bugs and ticks. Community participation in novel vector control technologies will be necessary for future interventions [64,65,66] and to promote public health policies supported by correct drone operations. A limitation in the estimation of kernel density was the number of samples taken within the polygons of each dwelling (100 sample pixels) as well as the size of the study site itself (approximately 80 Ha.); therefore, the maps may not fully represent the larger landscape. Kernel analysis has been used as a tool to assess the risk of mosquito distribution in larger areas, such as Mexico City. However, the pixel size it refers to was much larger. In this study, we evaluated the colony level scale [67]. Andreo et al. [68] carried out a MaxEnt analysis as a part of workflow towards an operational system that could adapt to the spatial resolution of other earth observation data types.

5. Conclusions

Medium and high values for the kernel density of both NDVIRe and NDVI (both p-value < 0.05) were associated with the number of adult mosquitos per house. However, the density of Ae. aegypti larvae per household did not show an association with medium and high values of NDVIRe and NDVI (both p-value > 0.05). To better understand dengue transmission, operational programs require scientific evidence of high-risk areas based on all factors related to specific conditions for the vector mosquito population. Other methods to estimate high-risk areas using novel technology are required, such as drone aerial images, that are effective, efficient, and relevant and have a high resolution and appropriate frequency for robust analysis. It is also necessary to develop a real-time surveillance method that allows accurate information on urban ecosystems to determine the factors associated with the abundance of vector mosquitoes in priority areas, which could be useful in normal program activities or when disasters occur. We propose using the drone technology commonly used in precision agriculture for public health to characterize mosquito urban ecosystems within the boundaries of the law and community acceptability.

Supplementary Materials

The following supporting information can be downloaded at: https://doi.org/10.6084/m9.figshare.24010374 (Supplementary Materials) (accessed on 15 July 2023). Figure S1. MicaSense® camera calibration. Figure S2. Flowchart of the drone configuration by Centro Nacional de Prevención de Desastres (CENAPRED)/Secretaria de Seguridad y Protección Ciudadana, Gobierno de México. Figure S3. Flight UAV protocol by Centro Nacional de Prevención e Desastres (CENAPRED)/Secretaria de Seguridad y Protección Ciudadana, Gobierno de México. Figure S4. Orthomosaic (NDVI and NDVIRe) of the El Vergel neighborhood, Tapachula, Chiapas. The dark squares are the houses surveyed. Figure S5. Take off drone area. Table S1. Breeding sites of Ae. aegypti in El Vergel, Tapachula, Chiapas.

Author Contributions

Conceptualization, K.M.V.-D., R.D.-L., O.G.-S. and D.A.M.-L.; methodology, K.M.V.-D., R.D.-L., C.I.-T., M.A.C.-P., G.Y.D.-P., M.O.A.-V., O.G.-S. and D.A.M.-L.; software, M.A.C.-P., G.Y.D.-P., M.O.A.-V. and D.A.M.-L.; validation, K.M.V.-D., R.D.-L., C.I.-T., O.G.-S. and D.A.M.-L.; formal analysis, R.D.-L., D.A.M.-L. and K.M.V.-D.; investigation, K.M.V.-D., R.D.-L., C.I.-T., O.G.-S., M.A.C.-P., G.Y.D.-P., M.O.A.-V., D.A.M.-L., I.F.-S., J.G.O.-G. and L.A.C.-V.; resources, K.M.V.-D., R.D.-L., C.I.-T., O.G.-S., F.C.-M., M.A.C.-P., G.Y.D.-P., M.O.A.-V., D.A.M.-L., J.G.O.-G. and L.A.C.-V.; data curation, K.M.V.-D., M.A.C.-P., G.Y.D.-P., M.O.A.-V., D.A.M.-L. and R.D.-L.; writing—original draft preparation, K.M.V.-D., O.G.-S., D.A.M.-L. and R.D.-L.; writing—review and editing, K.M.V.-D., R.D.-L., O.G.-S., D.A.M.-L., I.F.-S. and C.I.-T.; visualization, K.M.V.-D., R.D.-L., O.G.-S., D.A.M.-L. and C.I.-T.; supervision, K.M.V.-D., M.A.C.-P., R.D.-L. and C.I.-T.; project administration, R.D.-L., C.I.-T. and F.C.-M. funding acquisition, R.D.-L. and C.I.-T. All authors have read and agreed to the published version of the manuscript.

Funding

This research was carried out with the support of three institutions of the Mexican government: (1) the vector control program of the health services of Chiapas for entomological activities in the field, (2) CENAPRED research group for the flight of the drones and elaboration of cartography, (3) CRISP/INSP technical personnel for the field activities and analysis of the data.

Data Availability Statement

All the requited data relevant to the presented study are included in the manuscript.

Acknowledgments

We greatly appreciate the reviewers’ helpful comments and suggestions for improving this manuscript. We especially thank the National Center for Disaster Prevention for use of the technology facilities and their contributions to the drone flight-planning methodology, overflight execution, and cartography process. We greatly appreciate the householders, authorities of El Vergel, Tapachula, Chiapas, and the authorities of Sanitary jurisdiction #7 of Chiapas Health Services for the facilities provided for this study. Thanks to Rafael Vázquez Sánchez, Marco Alessio Sandoval Bautista, José Antonio Zavala López, Víctor Hugo López Estrada, and Miguel Muñoz Reyes for their support with field activities. The author would like to thank her parents and her daughter for their continuous support during this study.

Conflicts of Interest

The authors declare no conflict of interest.

References

  1. Ferraguti, M.; Martinez de la Puente, J.; Roiz, D.; Ruiz, S.; Soriguer, R.; Figueola, J. Effects of landscape anthropization on mosquito community composition and abundance. Sci. Rep. 2016, 6, 29002. [Google Scholar] [CrossRef] [PubMed]
  2. Shocket, M.S.; Anderson, C.B.; Caldwell, J.M.; Childs, M.L.; Couper, L.I.; Han, S.; Harris, M.J.; Howard, M.E.; MacDonald, A.J.; Nova, N.; et al. Environmental drivers of vector-borne diseases. In Population Biology of Vector-Borne Diseases; Drake, J.M., Bonsall, M.B., Strand, M.R., Eds.; Oxford University Press: Oxford, UK, 2021; pp. 85–118. [Google Scholar] [CrossRef]
  3. Campbell, L.P.; Luther, C.; Moo-Llanes, D.A.; Ramsey, J.M.; Danis-Lozano, R.; Peterson, A.T. Climate change influences on global distributions of dengue and chikungunya virus vectors. Philos. Trans. R Soc. B 2015, 370, 1665. [Google Scholar] [CrossRef] [PubMed]
  4. Benedict, M.Q.; Levine, R.S.; Hawley, W.A.; Lounibos, L.P. Spread of the tiger: Global risk of invasion by the mosquito Aedes albopictus. Vector-Borne Zoonotic Dis. 2007, 7, 76–85. [Google Scholar] [CrossRef]
  5. Wilke, A.B.B.; Chase, C.; Vasquez, C.; Carvajal, A.; Medina, J.; Petrie, W.; Beier, J.C. Urbanization creates diverse aquatic habitats for immature mosquitoes in urban areas. Sci. Rep. 2019, 9, 15335. [Google Scholar] [CrossRef]
  6. Wilke, A.B.B.; Caban-Martinez, A.J.; Ajelli, M.; Vasquez, C.; Petrie, W.; Beier, J.C. Mosquito adaptation to the extreme habitats of urban construction sites. Trends Parasitol. 2019, 35, 607–614. [Google Scholar] [CrossRef]
  7. Wilke, A.B.B.; Vasquez, C.; Carvajal, A.; Moreno, M.; Fuller, D.O.; Cardenas, G.; Petrie, W.D.; Beier, J.C. Urbanization favors the proliferation of Aedes aegypti and Culex quinquefasciatus in urban areas of Miami-Dade County, Florida. Sci. Rep. 2021, 11, 22989. [Google Scholar] [CrossRef] [PubMed]
  8. Pernat, N.; Kampen, H.; Jeschke, J.M.; Werner, D. Buzzing Homes: Using Citizen Science Data to Explore the Effects of Urbanization on Indoor Mosquito Communities. Insects 2021, 12, 374. [Google Scholar] [CrossRef]
  9. Gómez-Dantes, H.; Farfán-Ale, J.A.; Sarti, E. Epidemiological trends of Dengue Disease in México (2000–2011): A systematic literature search and analysis. PLoS Neglected Trop. Dis. 2014, 8, e3158. [Google Scholar] [CrossRef]
  10. Instituto Nacional de Estadística. Geografía e Informática. Censo de Población y Vivienda 2020. MEX-INEGI 40.201.01-CPV-2020. Available online: https://inegi.org.mx/programas/ccpv/2020/ (accessed on 12 March 2022).
  11. Diaz-Quijano, F.A.; Waldman, E.A. Factors associated with dengue mortality in Latin America and the Caribbean, 1995–2009: An ecological study. Am. J. Trop. Med. Hyg. 2012, 86, 328–334. [Google Scholar] [CrossRef]
  12. Moo-Llanes, D.A.; Lopez-Ordoñez, T.; Torres-Monzon, J.A.; Mosso-Gonzalez, C.; Casas-Martinez, M.; Samy, A.M. Assessing the potential distributions of the invasive mosquito vector Aedes albopictus and its natural Wolbachia infections in México. Insects 2021, 12, 143. [Google Scholar] [CrossRef] [PubMed]
  13. Colomina, I.; Molina, P. Unmanned aerial systems for photogrammetry and remote sensing: A review. ISPRS J. Photogramm. Remote Sens. 2014, 92, 79–97. [Google Scholar] [CrossRef]
  14. Eskandari, R.; Mahdianpari, M.; Mohammadimanesh, F.; Salehi, B.; Brisco, B.; Homayouni, S. Meta-analysis of unmanned aerial vehicle (UAV) imagery for agro-environmental monitoring using machine learning and statistical models. Remote Sens. 2020, 12, 3511. [Google Scholar] [CrossRef]
  15. Rojas-Viloria, D.; Solano, E.L.; Muñoz-Villamizar, A.; Montoya-Torres, J.R. Unmanned aerial vehicles/drones in vehicles routing problems: A literature review. Int. Trans. Oper. Res. 2021, 28, 1626–1657. [Google Scholar] [CrossRef]
  16. Carrasco-Escobar, G.; Moreno, M.; Fornace, K.; Herrera-Varela, M.; Manrique, E.; Con, J.E. The use of drones for mosquito surveillance and control. Parasites Vectors 2022, 15, 473. [Google Scholar] [CrossRef] [PubMed]
  17. Carrasco-Escobar, G.; Manrique, E.; Ruiz-Cabrejos, J.; Saavedra, M.; Alava, F.; Bickersmith, S.; Prussing, C.; Vinetz, J.M.; Conn, J.E.; Moreno, M.; et al. High-accuracy detection of malaria vector larval habitats using drone-based multispectral imagery. PLoS Neglected Trop. Dis. 2019, 13, e0007105. [Google Scholar] [CrossRef]
  18. Velozo, F.; Cavicchioli, Z.; Nogueira, L.H.; de Genaro, D.; Braghini, A.; Colmenero, J. Choice of unmanned aerial vehicles for identification of mosquito breeding sites. Geospat. Health 2019, 15, 810. [Google Scholar] [CrossRef]
  19. Valdez-Delgado, K.M.; Moo-Llanes, D.A.; Danis-Lozano, R.; Cisneros-Vázquez, L.A.; Flores-Suarez, A.E.; Ponce-García, G.; Medina-De la Garza, C.E.; Díaz-González, E.E.; Fernández-Salas, I. Field Effectiveness of Drones to Identify Potential Aedes aegypti Breeding Sites in Household Environments from Tapachula, a Dengue-Endemic City in Southern Mexico. Insects 2021, 12, 663. [Google Scholar] [CrossRef]
  20. Fornace, K.M.; Drakeley, C.; William, T.; Espíno, F.; Cox, J. Mapping infectious disease landscapes: Unmanned aerial vehicles and epidemiology. Trends Parasitol. 2014, 30, 514–519. [Google Scholar] [CrossRef]
  21. Hardy, A.; Makame, M.; Cross, D.; Majambere, S.; Msellem, M. Using low-cost drones to map malaria vector habitats. Parasites Vectors 2017, 10, 29. [Google Scholar] [CrossRef]
  22. Muñiz-Sánchez, V.; Valdez-Delgado, K.M.; Hernandez-Lopez, F.J.; Moo-Llanes, D.A.; González-Farías, G.; Danis-Lozano, R. Use of Unmanned Aerial Vehicles for Building a House Risk Index of Mosquito-Borne Viral Diseases. Machines 2022, 10, 1161. [Google Scholar] [CrossRef]
  23. DJI 2019. Zenmuse X5 Camera®. Available online: https://www.dji.com/mx/zenmuse-x5/info#specs (accessed on 10 October 2019).
  24. MicaSense Inc. Red Edge®. 2019. Available online: https://support.micaSense.com/hc/en-us/articles/115003537673-RedEdge-M-User-Manual-PDF- (accessed on 10 October 2019).
  25. Pix4D Capture. 2019. Available online: https://www.pix4d.com/es/producto/pix4dcapture (accessed on 5 November 2019).
  26. Pérez, J. Apuntes de Fotogrametría III; Universidad de Extremadura, Centro Universitario de Mérida: Mérida, Spain, 2021; 242p. [Google Scholar]
  27. Google Earth. 2019. Available online: https://www.google.com/intl/es-419/earth/ (accessed on 28 November 2019).
  28. Diario Oficial de la Federación. NORMA Oficial Mexicana NOM-107-SCT3-2019, Que establece los Requerimientos Para Operar un Sistema de Aeronave Pilotada a Distancia (RPAS) en el Espacio Aéreo Mexicano. DOF: 14/11/2019. Available online: http://www.dof.gob.mx/normasOficiales/8006/sct11_C/sct11_C.html (accessed on 18 April 2022).
  29. Galindo, C. Fotogrametría Aplicada a la Ingeniería. Bachelor’s Thesis, Universidad Nacional Autónoma de México, México City, México, 2010; 264p. [Google Scholar]
  30. Pix4D. Pix4Dmapper 4.1 User manual. Pix4D SA: Lausanne, Switzerland. 2017. Available online: https://support.pix4d.com/hc/en-us/articles/204272989-Offline-Getting-Started-and-Manual-pdf (accessed on 22 November 2019).
  31. ArcGIS Desktop, A.D. 2020. Available online: https://desktop.arcgis.com/es/arcmap/latest/tools/spatial-analyst-toolbox/raster-calculator.htm (accessed on 22 October 2019).
  32. Díaz, J. Estudios de Índices de Vegetación a Partir de Imágenes Aéreas Tomadas Desde RPAS y Aplicaciones de Estos a la Agricultura de Precisión. Master’s Thesis, Universidad Complutense de Madrid, Madrid, Spain, 2015. [Google Scholar]
  33. Sishodia, R.P.; Ray, R.L.; Singh, S.K. Applications of Remote Sensing in Precision Agriculture: A Review. Remote Sens. 2020, 12, 3136. [Google Scholar] [CrossRef]
  34. EOS. Índice de Clorofila. 2020. Available online: https://eos.com/es/agriculture/ci/#:~:text=El%20%C3%ADndice%20de%20clorofila%20(Cl,de%20los%20tipos%20de%20plantas (accessed on 22 October 2020).
  35. Arredondo-Jiménez, J.I.; Valdez-Delgado, K.M. Aedes aegypti pupal/demographic surveys in southern Mexico: Consistency and practicality. Ann. Trop. Med. Parasitol. 2006, 100 (Suppl. 1), 17–32. [Google Scholar] [CrossRef]
  36. Darsie, R.; Ward, R.; Chang, C.; Litwak, T. Identification and Geographical Distribution of the Mosquitoes of North America, North of Mexico; University Press of Florida: Gainesville, FL, USA, 2016. [Google Scholar]
  37. Ashmore, P.; Lindahl, J.F.; Colón-González, F.J.; Sinh Nam, V.; Quang Tan, D.; Medley, G.F. Spatiotemporal and Socioeconomic Risk Factors for Dengue at the Province Level in Vietnam, 2013–2015: Clustering Analysis and Regression Model. Trop. Med. Infect. Dis. 2020, 5, 81. [Google Scholar] [CrossRef]
  38. Valdez-Delgado, K.M.; Rios-Delgado, J.C.; Nettel-Cruz, J.A.; Angulo-Kladt, R.; Villarreal-Treviño, C. Aerial release of Aedes aegypti male mosquitoes using an unmanned aerial vehicle: A novel control strategy. Salud Publica México 2023, 65, 387–393. [Google Scholar]
  39. Mechan, F.; Bartonicek, Z.; Malone, D.; Lees, S.R. Unmanned aerial vehicles for surveillance and control of vectors of malaria and other vector-borne diseases. Malar. J. 2023, 22, 23. [Google Scholar] [CrossRef]
  40. Estrada Zúñiga, A.C.; Vásquez, J.Ñ. Detection and identification of high Andean plant communities, Wetlands and Tolar de Puna Seca by means of RGB and NDVI orthophotos in” Unmanned Aerial Systems” drones. Sci. Agropecu. 2021, 12, 3. [Google Scholar] [CrossRef]
  41. Youssefi, F.; Zoej, M.J.V.; Hanafi-Bojd, A.A.; Dariane, A.B.; Khaki, M.; Safdarinezhad, A.; Ghaderpour, E. Temporal Monitoring and Predicting of the Abundance of Malaria Vectors Using Time Series Analysis of Remote Sensing Data through Google Earth Engine. Sensors 2022, 22, 1942. [Google Scholar] [CrossRef]
  42. Parselia, E.; Kontoes, C.; Tsouni, A.; Hadjichristodoulou, C.; Kioutsioukis, I.; Magiorkinis, G.; Stilianakis, N.I. Satellite Earth Observation Data in Epidemiological Modeling of Malaria, Dengue and West Nile Virus: A Scoping Review. Remote Sens. 2019, 11, 1862. [Google Scholar] [CrossRef]
  43. Fernández-Salas, I.; Roberts, D.R.; Rodríguez, M.H.; Marina-Fernández, C.F. Bionomics of larval populations of Anopheles pseudopunctipennis in the Tapachula foothills area, southern Mexico. J. Am. Mosq. Control. Assoc. 1994, 10, 477–486. [Google Scholar]
  44. Yoshio, T.; Suwonkerd, W.; Chawprom, S.; Prajakwong, S.; Takagi, A.M. Different Spatial Distribution of Aedes aegypti and Aedes albopictus along an urban–rural gradient and the relating environmental factors examined in three villages in Northern Thailand. J. Am. Mosq. Control. Assoc. 2006, 22, 222–228. [Google Scholar]
  45. Landau, K.I.; Van Leeuwen, W.J. Fine scale spatial urban land cover factors associated with adult mosquito abundance and risk in Tucson, Arizona. J. Vector Ecol. 2012, 37, 407–418. [Google Scholar] [CrossRef]
  46. Viana, C.M.; Oliveira, S.; Oliveira, S.C.; Rocha, J. Land Use/Land Cover Change Detection and Urban Sprawl Analysis. In Spatial Modeling in GIS and R for Earth and Environmental Sciences; Elsevier: Amsterdam, The Netherlands, 2019; pp. 621–651. [Google Scholar] [CrossRef]
  47. Choubin, B.; Soleimani, F.; Pirnia, A.; Sajedi-Hosseini, F.; Alilou, H.; Rahmati, O.; Shahabi, H. Effects of drought on vegetative cover changes: Investigating spatiotemporal patterns. In Extreme Hydrology and Climate Variability; Elsevier: Amsterdam, The Netherlands, 2019; pp. 213–222. [Google Scholar] [CrossRef]
  48. Hashim, H.; Abd Latif, Z.; Adnan, N.A. Urban vegetation classification with NDVI threshold value method with very high resolution (VHR) Pleiades imagery. Int. Arch. Photogramm. Remote Sens. Spat. Inf. Sci. 2019, 42, 237–240. [Google Scholar] [CrossRef]
  49. Huang, S.; Tang, L.; Hupy, J.P.; Wang, Y.; Shao, G. A commentary review on the use of normalized difference vegetation index (NDVI) in the era of popular remote sensing. J. For. Res. 2021, 32, 1–6. [Google Scholar] [CrossRef]
  50. Xue, J.; Su, B. Significant remote sensing vegetation indices: A review of developments and applications. J. Sens. 2017, 2017, 1353691. [Google Scholar] [CrossRef]
  51. Pope, K.O.; Rejmankova, E.; Savage, H.M.; Arredondo-Jiménez, J.I.; Rodríguez, M.H.; Roberts, D.R. Remote sensing of tropical wetlands for malaria control in Chiapas, Mexico. Ecol. Appl. 1994, 4, 81–90. [Google Scholar]
  52. Beck, L.R.; Rodríguez, M.H.; Dister, S.W.; Rodríguez, A.D.; Rejmankova, E.; Ulloa, A.; Meza, R.A.; Roberts, D.R.; Paris, J.F.; Spanner, M.A. Remote sensing as a landscape epidemiologic tool to identify villages at high risk for malaria transmission. Am. J. Trop. Med. Hyg. 1994, 51, 271–280. [Google Scholar]
  53. Beck, L.R.; Rodriguez, M.H.; Dister, S.W.; Rodriguez, A.D.; Washino, R.K.; Roberts, D.R.; Spanner, M.A. An assessment of a remote sensing-based model for predicting malaria transmission risk in villages of Chiapas, Mexico. Am. J. Trop. Med. Hyg. 1997, 56, 99–106. [Google Scholar] [CrossRef]
  54. Rogers, D.J.; Randolf, S.E.; Snow, R.W.; Hay, S.I. Satellite imagery in the study and forecast of malaria. Nature 2002, 415, 710–715. [Google Scholar]
  55. Youssefi, F.; Zoej, M.J.V.; Hanafi-Bojd, A.A.; Dariane, A.B.; Khaki, M.; Safdarinezhad, A. Predicting the location of larval habitats of Anopheles mosquitoes using remote sensing and soil type data. Int. J. Appl. Earth Obs. Geoinf. 2022, 108, 102746. [Google Scholar] [CrossRef]
  56. Valdez-Delgado, K.M. Uso de Drones Para la Asociación de Factores de Riesgo con la Abundancia de Mosquitos Aedes aegypti (Linnaeus) Diptera: Culicidae, en Áreas de Transmisión de Dengue de la Ciudad de Tapachula, Chiapas. Ph.D. Thesis, Universidad Autónoma de Nuevo León, San Nicolás de los Garza, México, 2023. Available online: http://eprints.uanl.mx/id/eprint/25097 (accessed on 9 June 2023).
  57. Liu-Helmersson, J.; Brännström, Å.; Sewe, M.O.; Semenza, J.C.; Rocklöv, J. Estimating Past, Present, and Future Trends in the Global Distribution and Abundance of the Arbovirus Vector Aedes aegypti Under Climate Change Scenarios. Front. Public Health 2019, 7, 148. [Google Scholar] [CrossRef]
  58. Rajarethinam, J.; Ong, J.; Neo, Z.-W.; Ng, L.-C.; Aik, J. Distribution and seasonal fluctuations of Ae. aegypti and Ae. albopictus larval and pupae in residential areas in an urban landscape. PLoS Neglected Trop. Dis. 2020, 14, e0008209. [Google Scholar] [CrossRef] [PubMed]
  59. Che-Mendoza, A.; Martin-Park, A.; Chávez-Trava, J.M.; Contreras-Perera, Y.; Delfín-González, H.; González-Olvera, G.; Manrique-Saide, P. Abundance and seasonality of Aedes aegypti (Diptera: Culicidae) in two suburban localities of South Mexico, with implications for Wolbachia (Rickettsiales: Rickettsiaceae)-carrying male releases for population suppression. J. Med. Entomol. 2021, 58, 1817–1825. [Google Scholar] [CrossRef]
  60. Sarwan, M.; Rasool, B. Seasonal Prevalence and Phenomenal Biology as Tools for Dengue Mosquito Aedes aegypti (Linnaeus) (Diptera: Culicidae) Management. Braz. Arch. Biol. Technol. 2022, 65, e222200502. [Google Scholar] [CrossRef]
  61. Marina, C.F.; Bond, J.G.; Hernández-Arriaga, K.; Valle, J.; Ulloa, A.; Fernández-Salas, I.; Carvalho, D.O.; Bourtzis, K.; Dor, A.; Williams, T.; et al. Population Dynamics of Aedes aegypti and Aedes albopictus in Two Rural Villages in Southern Mexico: Baseline Data for an Evaluation of the Sterile Insect Technique. Insects 2021, 12, 58. [Google Scholar] [CrossRef]
  62. Diario Oficial de la Federación. Ley Federal de Transparencia y Acceso a la Información Pública. DOF 20-05-2021. Secretaría de Gobernación. Gobierno de México. Available online: https://www.diputados.gob.mx/LeyesBiblio/pdf/LFTAIP_200521.pdf (accessed on 30 July 2023).
  63. Diario Oficial de la Federación. Ley General de Protección de Datos Personales en Posesión de Sujetos obligados. DOF 26-01-2017. Secretaría de Gobernación. Gobierno de México. Available online: https://www.diputados.gob.mx/LeyesBiblio/ref/lgpdppso.htm (accessed on 30 July 2023).
  64. Hardy, A.; Proctor, M.; MacCallum, C.; Shawe, J.; Abdalla, S.; Rajab, A.; Abdalla, S.; Oakes, G.; Rosu, L.; Worrall, E. Conditional trust: Community perceptions of drone use in malaria control in Zanzibar. Technol. Soc. 2022, 68, 101895. [Google Scholar] [CrossRef]
  65. Bartumeus, F.; Costa, G.B.; Eritja, R.; Kelly, A.H.; Finda, M.; Lezaun, J. Sustainable innovation in vector control requires strong partnerships with communities. PLoS Neglected Trop. Dis. 2019, 13, e0007204. [Google Scholar] [CrossRef]
  66. Peters, D.H.; Adam, T.; Alonge, O.; Agyepong, I.A.; Tran, N. Implementation research: What it is and how to do it. BMJ 2013, 347, f6753. [Google Scholar] [CrossRef]
  67. Dávalos-Becerril, E.; Correa-Morales, F.; González-Acosta, C.; Santos-Luna, R.; Peralta-Rodríguez, J.; Pérez-Rentería, C.; Ordoñez-Álvarez, J.; Huerta, H.; Carmona-Pérez, M.; Díaz-Quiñonez, M.D.; et al. Urban and semi-urban mosquitoes of Mexico City: A risk for endemic mosquito-borne disease transmission. PLoS ONE 2019, 14, e0212987. [Google Scholar] [CrossRef]
  68. Andreo, V.; Cuervo, P.F.; Porcasi, X.; Lopez, L.; Guzman, C.; Scavuzzo, C.M. Towards a workflow for operational mapping of Aedes aegypti at urban scale based on remote sensing. Remote Sens. Appl. Soc. Environ. 2021, 23, 100554. [Google Scholar] [CrossRef]
Figure 1. The geographic location of the study area, El Vergel, in Tapachula, Chiapas, México.
Drones 07 00581 g001
Figure 2. Hexacopter UAV model, Matrice 600 DJI (DJI® Austin, TX, USA).
Drones 07 00581 g002
Figure 3. Flight drone organization in the El Vergel neighborhood, Tapachula, Chiapas, Mexico: (a) drone flight route to obtain aerial photographs and (b) drone flight polygons in the community.
Drones 07 00581 g003
Figure 4. Orthomosaic of the El Vergel neighborhood, Tapachula, Chiapas: (a) orthomosaic; (b) details of the orthomosaic. The dark squares are the houses that were surveyed.
Drones 07 00581 g004
Figure 5. NDVI and NDVIRe values of houses surveyed in the El Vergel neighborhood, Tapachula, Chiapas.
Drones 07 00581 g005
Figure 6. Kernel density maps for the vegetation indexes in the El Vergel neighborhood, Tapachula, Chiapas: (a) kernel density of NDVI and (b) kernel density of NDVIRe.
Drones 07 00581 g006
Table 1. The operating temperature, humidity, and drone flight time.
DateTimeTemperature °CHumidity (%)
12 November 201911:27 h36.843
12 November 201912:35 h34.348
12 November 201912:54 h35.845
12 November 201913:32 h34.845
13 November 201911:13 h36.644
13 November 201912:16 h38.038
13 November 201912:44 h38.649
13 November 201913:23 h34.544
Table 2. Summary parameters of drone cameras during flights in El Vergel, Tapachula, Chiapas.
ZemmuseX5MicaSense RedEdge MX
ProjectVergelX5newVergelMEnew
Processed15 January 2020 17:13:5220 January 2020 16:14:53
Camera Model Name(s)FC550_DJIMFT15mmF1.
7ASPH_15.0_4608 × 3456 (RGB)
RedEdge_5.5_1280 × 960 (Blue)
RedEdge_5.5_1280 × 960 (Green)
RedEdge_5.5_1280 × 960 (Red)
RedEdge_5.5_1280 × 960 (NIR)
RedEdge_5.5_1280 × 960 (RedEdge)
«MicaSense 5 band»
Average Ground Sampling
Distance (GSD)
2.6 cm/1 in7.4 cm/2.9 in
Resolution2.6 cm/pixel7.4 cm/pixel
Area Covered0.8 km2/78.3 ha/
0.3 sq. mi./193.5 acres
0.9 km2/85.9 ha/
0.3 sq. mi./212.3 acres
Table 3. Descriptive profile of vegetation indices and life stages of the Ae. aegypti mosquitos in El Vergel, Tapachula, Chiapas.
VariableNumberObsMeanStd. Dev.MinMax
Male mosquitoes17421612014
Female mosquitoes17521612023
Total of mosquitoes34921623036
Larvae 1st instar353216290120
Larvae 2nd instar16342168220180
Larvae 3rd instar247321611360276
Larvae 4o instar256421612360266
Larvae702421633920690
Pupae10902165150100
NDVIRe 2160.110.12−0.120.47
NDVI 2160.190.23−0.140.74
Disclaimer/Publisher’s Note: The statements, opinions and data contained in all publications are solely those of the individual author(s) and contributor(s) and not of MDPI and/or the editor(s). MDPI and/or the editor(s) disclaim responsibility for any injury to people or property resulting from any ideas, methods, instructions or products referred to in the content.

