Article

Estimating the Economic Viability of Advanced Air Mobility Use Cases: Towards the Slope of Enlightenment

1
Deutsches Zentrum für Luft- und Raumfahrt (DLR), Lufttransportsysteme, 21079 Hamburg, Germany
2
Institut für Lufttransportsysteme, Technische Universität Hamburg (TUHH), 21079 Hamburg, Germany
3
Roland Berger, Hanseatic Trade Center, 20457 Hamburg, Germany
*
Author to whom correspondence should be addressed.
These authors contributed equally to this work.
Drones 2023, 7(2), 75; https://doi.org/10.3390/drones7020075
Submission received: 5 December 2022 / Revised: 17 January 2023 / Accepted: 18 January 2023 / Published: 20 January 2023
(This article belongs to the Special Issue AAM Integration: Strategic Insights and Goals)

Abstract

:
While different vehicle configurations enter the AAM market, airlines declare different ticket fares for their operations. This research investigates the operating cost of an airline and the economic viability with the announced fare per km rates. For this purpose, three use cases in the metropolitan area of Hamburg showcase representative applications of an AAM system, whereby a flight trajectory model calculates a flight time in each case. The direct operating cost are investigated for each use case individually and are sub-classified in five categories: fee, crew, maintenance, fuel and capital costs. Here, each use case has its own cost characteristics, in which different cost elements dominate. Additionally, a sensitivity analysis shows the effect of a variation of the flight cycles and load factor, that influences the costs as well as the airline business itself. Based on the occurring cost, a profit margin per available seat kilometer lead to a necessary fare per km, that an airline has to charge.

1. Introduction

In line with the Gartner Hype Cycle, the perception of advanced air mobility (AAM) is already fading before the continuous market entry phase begins. In this time, there are many projects focused on the development of new vehicle configurations and designs. However, most of the available funding is concentrated on a few vehicle projects [1]. It seems that the competition between several manufactures is more present than ever and the manufacturers are taking positions in different use cases. Volocopter and Archer already demonstrated the capability of their vehicles in test flights, while certificating their vehicles to entry into service in the coming years [2,3]. The Chinese manufacturer EHang is one step further and started business in South East Asia selling a 20 min flight for roughly 50 € [4,5]. Limitations and integration hurdles of AAM operations have already been investigated and pictured in the case of Zurich, Switzerland [6,7]. Next to resources of vertiports and aircraft, operations, policies and the economics limit an UAM network as well. This study dips into the economics of an AAM airline considering the cost and a deduction to a required ticket fare to operate economically. The FAA defines UAM as an automated aircraft operation in lower altitudes independent of any payload. Additionally, this application works for urban and suburban areas. On top of that, regional use cases outside of urban areas increase the scope of UAM. This expansion will be called Advanced Air Mobility (AAM) in this study, which consists of urban, suburban and rural areas [8].
In total, this study examines three use cases for the Hamburg area and northern Germany. Each use case consists of a combination of vehicle performance and an origin destination pair as presented in Section 3. By varying different cost parameters, the cost characteristics for each use case are described in Section 4.1 and Section 4.2. Furthermore, the potential revenue for an itinerary is examined, so that the economics can be evaluated. Based on these results, an airline can verify its operations to be economically viable as shown in Section 4.5.

2. Cost and Revenue Modeling

2.1. Airline Business

The total travel time T can be expressed as a sum of three individual terms [9].
T = t f i x e d + t f l i g h t + t s c h e d u l e
All ground activities in the vertiport such as boarding or ticket checks are (highly) dependent on the business model of a vertiport operator as well as the vertiport infrastructure itself. Since heuristics to evaluate travel time in a vertiport have already been analyzed by Preis [10], they are summarized as t f i x e d and are not subject to further analysis. Instead, we focus on modeling and estimating the influence of flight time ( t f l i g h t ) on the operating costs of an AAM airline. The AAM flight duration t f l i g h t will be calculated and used for cost evaluations. The concerning model will be explained in Section 2.2.1. The last term t s c h e d u l e represents the timetable of an airline, which is part of an airline business plan and no object of further analysis here.
Operating profit is generally defined as the difference between income and expenses. For airlines in particular, the income is a product of the sold passenger seats, expressed as Revenue Passenger Kilometer (RPK), and its ticket fare (Yield), while the expenses are the Available Seat Kilometers (ASK) multiplied by the unit costs (Unit) [9].
P r o f i t = R P K · Y i e l d A S K · U n i t
In this formula, the term Unit summarizes the averaged financial expenses of an operator for each flown kilometer. The unit cost is a direct link to a cost model. Assuming that the tickets sold cover the airlines’ expenses, a cost model can infer a ticket fare given for an Average Load Factor (ALF). However, an airfare system as well as the RPK are part of an airline business model. While the RPK are linked to the total demand, the Yield can be deduced from the DOC with the aim to operate economically. Therefore, this study does not analyze any capacities, neither for airlines nor for vertiports.

2.2. Cost Modeling

The general structure of the direct operating cost (DOC) model in this study refers to the CeRaS model of manned aviation [11]. This study structures the DOC into five cost elements.
  • Fee charges;
  • Maintenance and overhaul;
  • Capital and depreciation;
  • Fuel;
  • Crew.
Each cost element will be described separately while labeling it with a cost object C. For this purpose, each cost element has a specific input set, which comes from the mission, the vehicle data or the airlines business. The last input describes the usage of a vehicle effecting the potential flight cycles (FC) per time segment. To calculate the FC per day, the calculated flight time for each use case will be computed by taking the vehicle data and mission profiles from Section 3 into account. All inputs and assumptions for the DOC model are summed up in Appendix B.

2.2.1. Flight Cycles

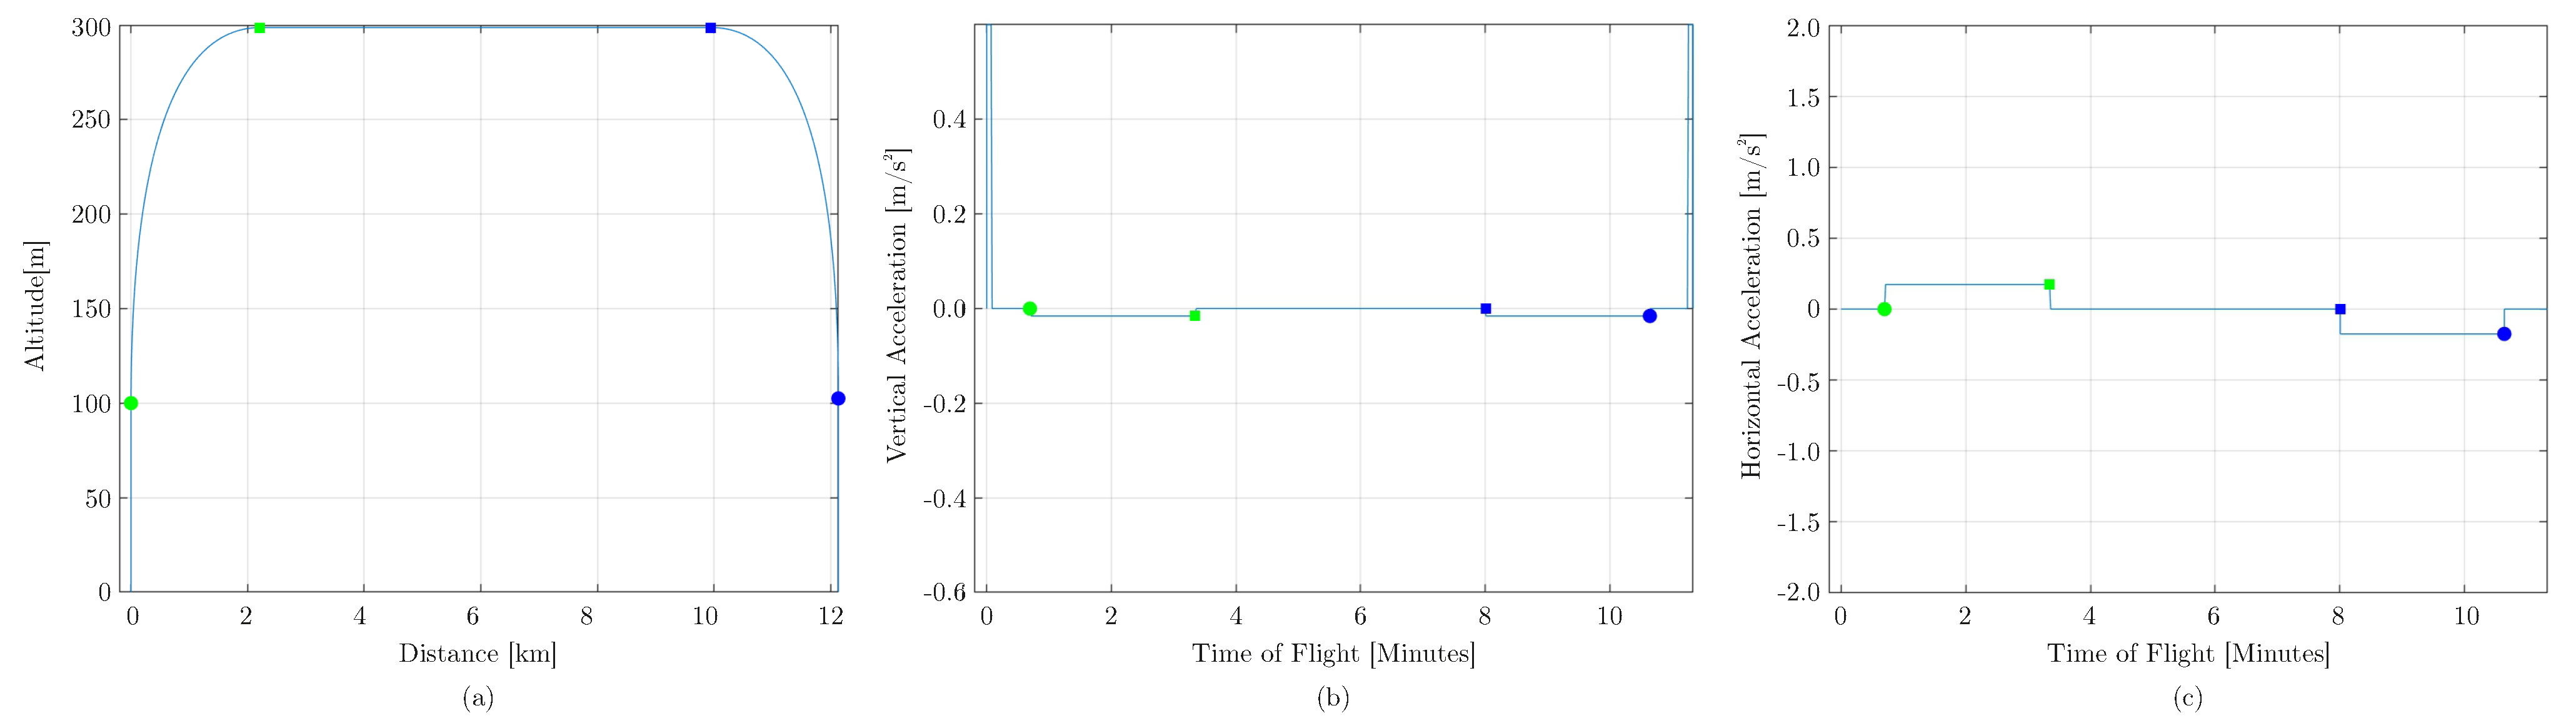
For the prediction of flight profiles regarding time of flight, vertical and horizontal velocities, altitudes as well as the mission specific consumed energy, a trajectory calculation is carried out based on a point mass moving according to Newton’s laws [12]. Figure 1 presents an exemplary flight profile.
The simplified flight profile starts with a vertical acceleration phase, inducing an initial vertical climb (phase 1). In phase 2, starting with green dot, the vehicle climbs with a varying trajectory inclination angle, following a parabolic curve until reaching the top of climb (green square). This curve is generated by superimposing a horizontal acceleration and a vertical deceleration. During cruise (phase 3), we assume a constant altitude and cruise speed. At end of cruise flight (blue square), parabolic (phase 4) and vertical descent phases (phase 5) are conducted in analogy to phases 1 and 2, but in reverse order. The derived parameters of the total flight mission, such as flight time, flight distance and the resulting estimated energy consumption provide crucial input for modeling direct operating costs of individual flights. We determine the vehicle specific flight cycles per year based on the average mission and block time of all routes. When calculating a flight time, Equation 3 presents the link to the flight cycles (FC) per year.
F l i g h t c y c l e s = o p e r a t i o n t i m e y e a r d o w n t i m e y e a r f l i g h t t i m e + g r o u n d t i m e
Here, the potential yearly operation time P O T p a and the yearly forced downtime D T p a of 2748.8 h are fixed concerning Niklaß et al. [12]. The ground time is estimated roughly as about 50% of the statistical average value of 1.83 h for conventional aviation and assumed to be a constant value in contrast to the flight time t f l i g h t , which depends on the routing and vehicle performance. Individual flight times are investigated based on pre-defined use cases that are described in Section 3.

2.2.2. Landing and Terminal Fees and Navigation Charges

Unlike taxes, whose revenue can in principle be used to finance any public expenditure, fees are used either to cover costs or must be used for a specific purpose. In this case, a fee is a cost element that an airline has to pay to another UAM system stakeholder. However, without knowing the future design of the UAM system, estimating the UAM fees is associated with particularly high uncertainties. At this stage of AAM investigation, airspace infrastructure and detailed routing have not been elaborated yet. As a solution, we adopt established fee and cost models of general aviation. This is why this cost element is route-independent, but distance-dependent.
At this stage, we separate an AAM airline from a vertiport operator. As a result, a vertiport operator acts as a further AAM stakeholder and imposes fees for its services. Since AAM operates in urban areas, vertiports might have characteristics of a public transport station as well as of a commercial airport. We therefore split this vertiport service fee into a landing and a terminal component. The first part represents a passenger landing fee ( C l a n d i n g ), while the second fee is a flat rate ( C t e r m i n a l ) per landing. Other sources of vertiport income can be retail, car parking fees or further means of income. If an operator runs an AAM airline and the vertiports, cost at the vertiport will still occur. However, a passenger landing fee will be prorated in accounting.
The passenger landing fee depends on the number of passenger transported in the vehicle. Here, the ground handling justifies this additional fee. In theory, each vertiport and vertiport operator can charge its own passenger fare system. Since no information about the operations in a vertiport is given, landing fees must be estimated.
C l a n d i n g = U l a n d i n g
For setting the level of landing fee U l a n d i n g per passenger, we adopted existing prices in manned aviation. The Ultimate Aviation Group runs a helicopter business in South Africa where they charge a passenger fee of approx. 6 € when landing [
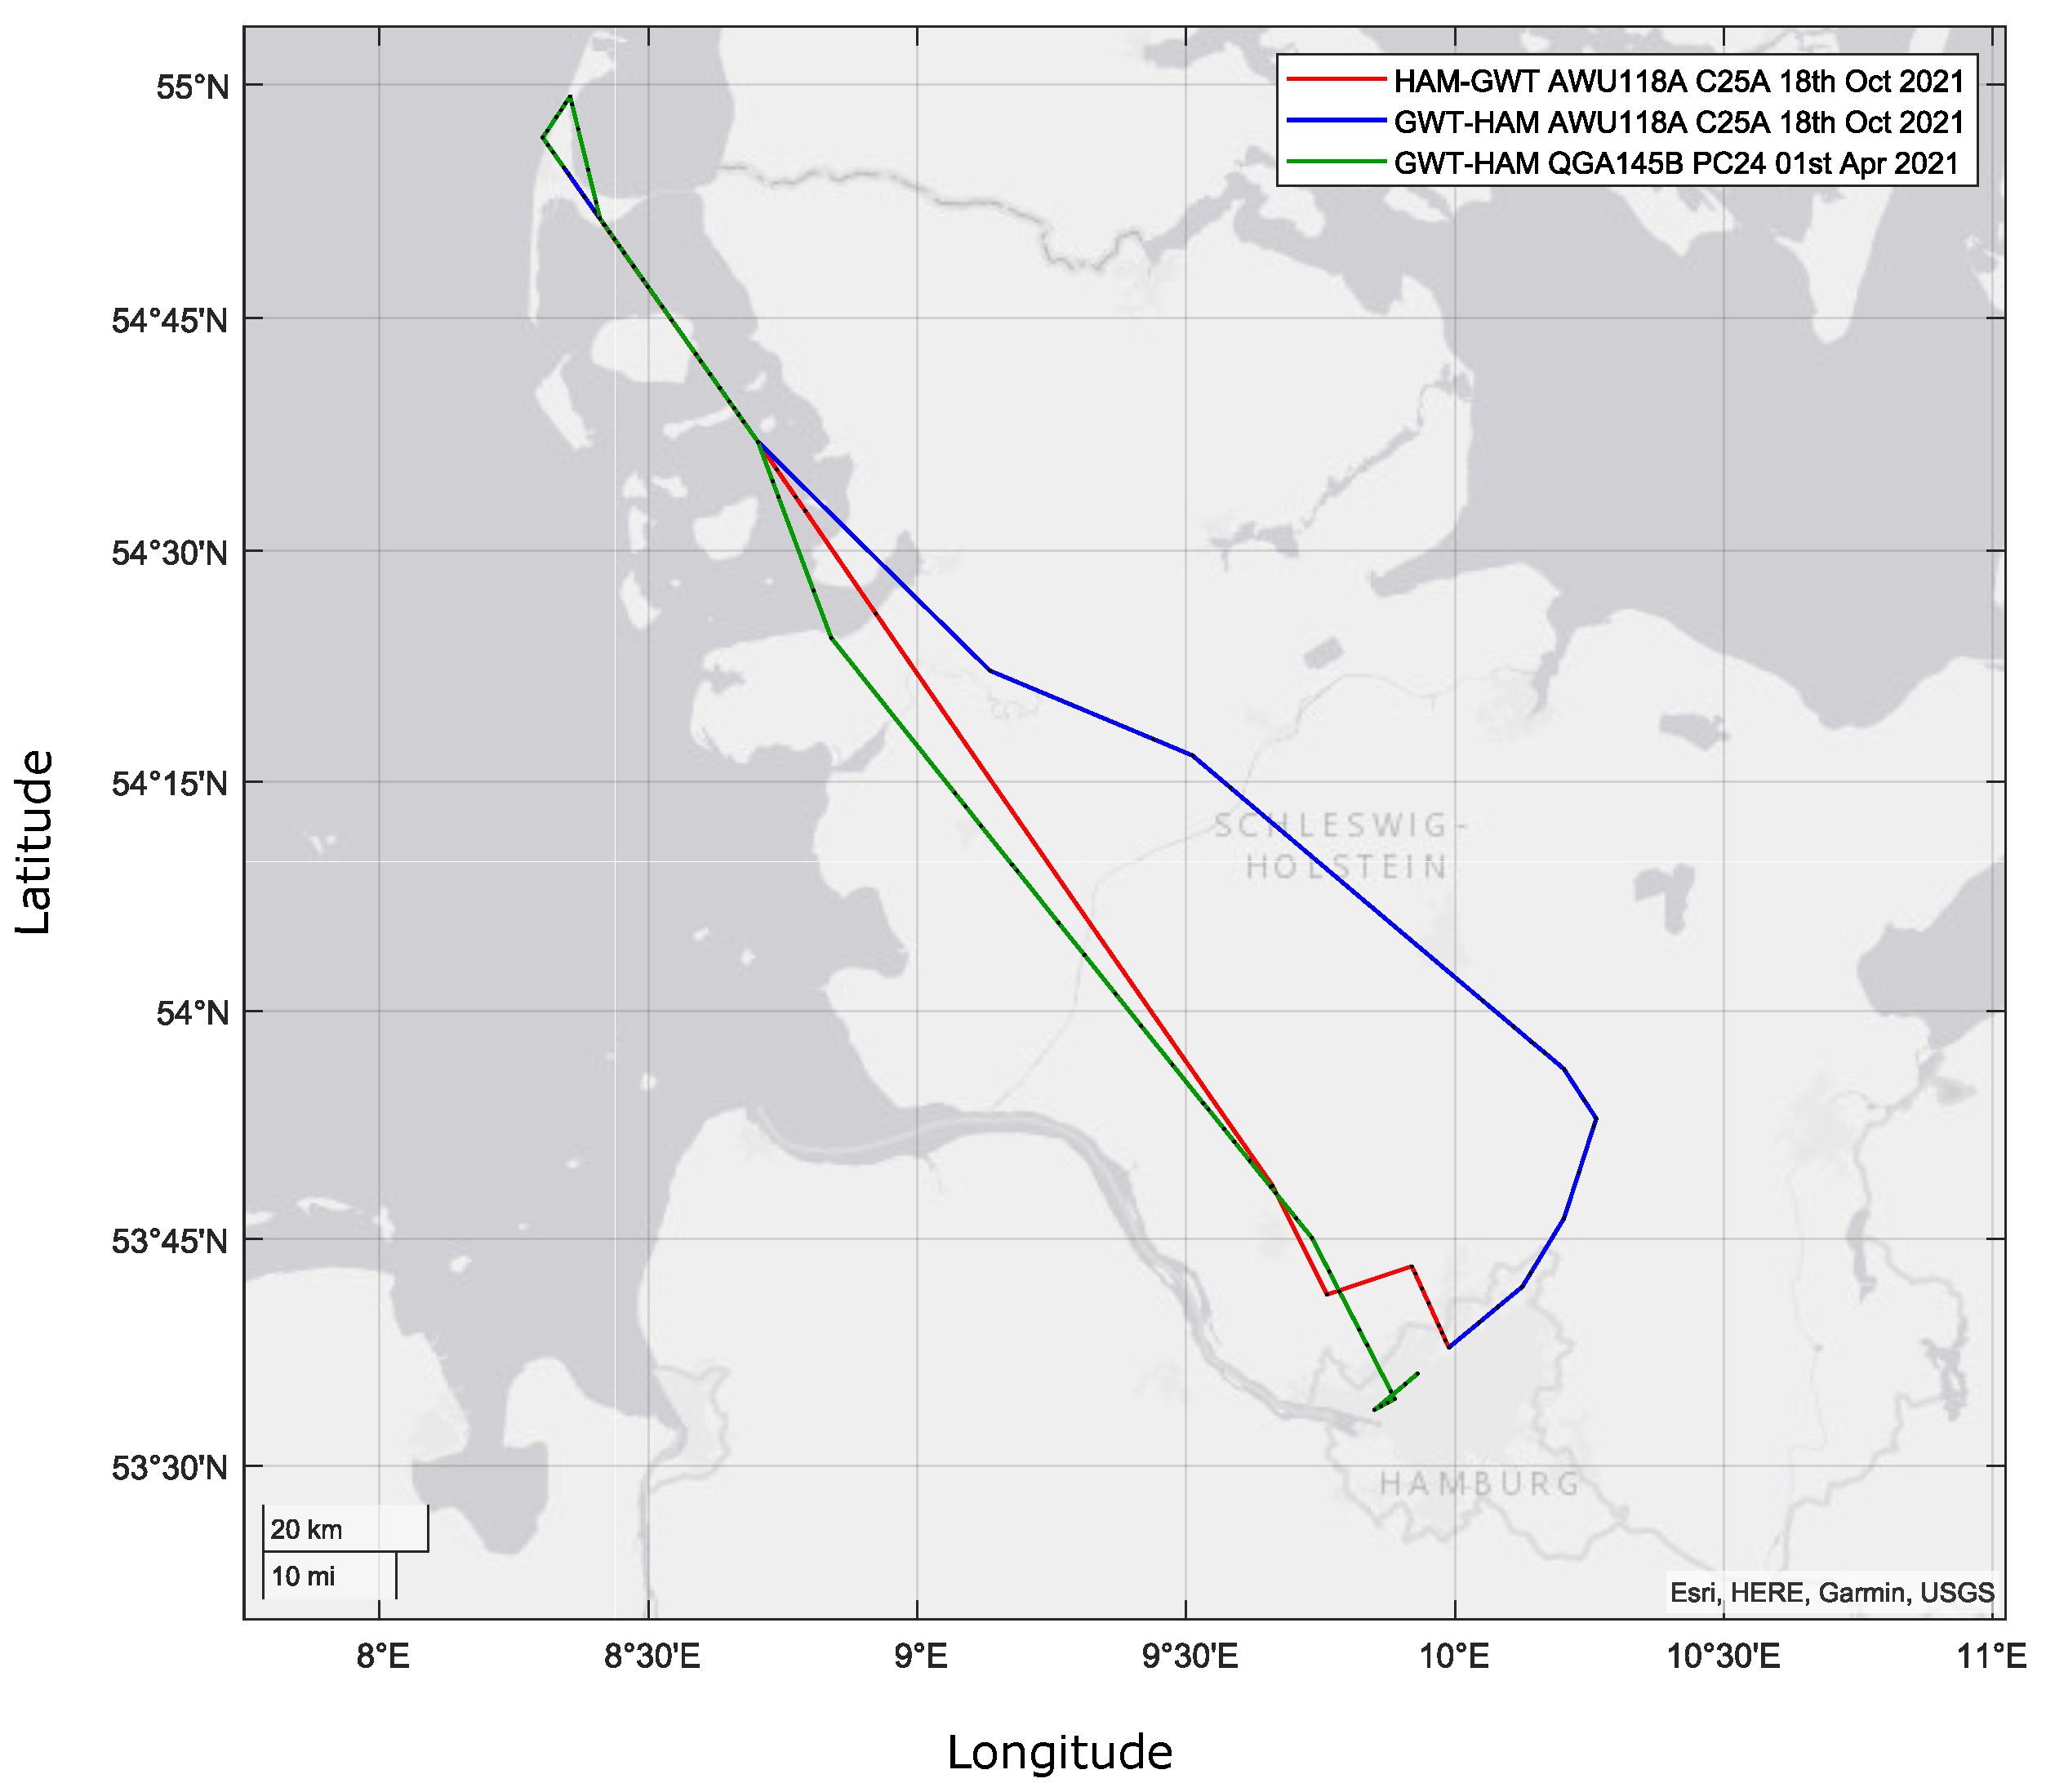
13]. This value is in line with the landing charge at the airport GWT in Sylt and HAJ in Hannover in 2022 [14,15].
The flat-rate landing fee represents the costs incurred by vertiports for handling the vehicle in the infrastructure. At this point, terminal charges of manned aviation are used, where the fee depends on the vehicle mass and country-specific parameters, to calculate a landing charge at a vertiport [16].
C t e r m i n a l = U t M T O W a t b t
In the case of Frankfurt, Germany, the parameters for manned aviation are U t = 235.56 $ ( 223.78 ), a t = 50 and b t = 0.7 . In addition, the fee can be levied based on the noise and emissions generated by the vehicle. However, due to unknown landing procedures and vehicle performance in terms of noise emission, this study does not take any fees for noise into account yet.
Furthermore, an air navigation service provider (ANSP), which is responsible for the air traffic management, charges a distance-dependent fee in general. Such an ANSP does not exist yet, so that a fare system is not established. This is why this cost model adapts an en route charge method of general aviation [16]. Navigation costs are calculated as follows:
C n a v i g a t i o n = U n M T O W a n b n · d
with the distance d and the country-specific parameters of U n = 0.99 $ /km, a n = 50 and b n = 0.5 for Germany. For both C t e r m i n a l and C n a v i g a t i o n , MTOW is given in metric tons.

2.2.3. Maintenance and Overhaul

According to an evaluation of general aviation traffic and their delays, technical issues on the aircraft are the main reason for disruptions in the flight schedule [17]. In the case of a technical issue at a vehicle, an airline has to reorganize its business and allocate available vehicles to fulfill the flight schedule. In the event of AAM in special, the out-of-service vehicle needs to be checked and maintained if necessary. Additionally, it blocks a parking pad at a vertiport, which could lead to capacity constraints on the ground if not enough space is available. Such an analysis depends on the location and the design of the vertiport itself that is out of the scope of this investigation.
Detailed information about the AAM vehicle configurations is unknown in general. For this reason, there is no statement about the life-cycle cost management (LCCM) of component assemblies or line-replaceable units (LRU). As a consequence, this study considers the vehicle as one assembly and does not differentiate between different hardware or battery systems. Previous studies already investigated maintenance intervals and possible labor and material effort for AAM vehicle as shown in Table 1 [18].
The maintenance costs are split into material costs and labor costs, while the wage of a maintenance hour is 66.5 /h. After each 100 h and 200 h as well as after each 1750 FC and 3500 FC, the vehicle will be maintained with respect to the mentioned effort. Here, the maintenance is independent of the vehicle configuration and size, weight and power (SWAP), and includes all aspects of inspection activities.
In general, there is no information about detailed cabin designs and its cleaning procedures for an AAM vehicle yet. According to [19], a full-service car wash for a SUV or van is about 200 . When operating with a four-passenger cabin for AAM, the interior of both means of transport looks nearly the same, resulting in comparable cleaning procedures. Assuming a full-service at the end of the day by operating approx. 20 flights per day, 10 of cleaning cost accrue every FC for an AAM transport mode.

2.2.4. Capital Cost

The capital costs describe the write-off of the aircraft. Therefore, the calculation of the annuity consists of several fixed values for the interest rate ( I R ), depreciation period ( D P ) and the residual value factor ( f R V ) [11].
a = I R · 1 f R V ( 1 1 + I R ) D P 1 ( 1 1 + I R ) D P
I R = 0.05 , D P = 10 in years and f R V = 0.1 are set as fix values for every use case [12]. This is why the value a = 0.1216 is constant in this study. Additionally, the insurance rate ( f I n s ) is fixed to 0.5 %. Finally, the capital cost per flight cycle is an expression of the unit cost as a function of the Operating Empty Weight (OEW), insurance rate and the annuity. The cost per OEW C O E W depends on the vehicle and its price on the market and varies among the three use cases.
C c a p i t a l = C O E W · O E W · a + f I n s F C
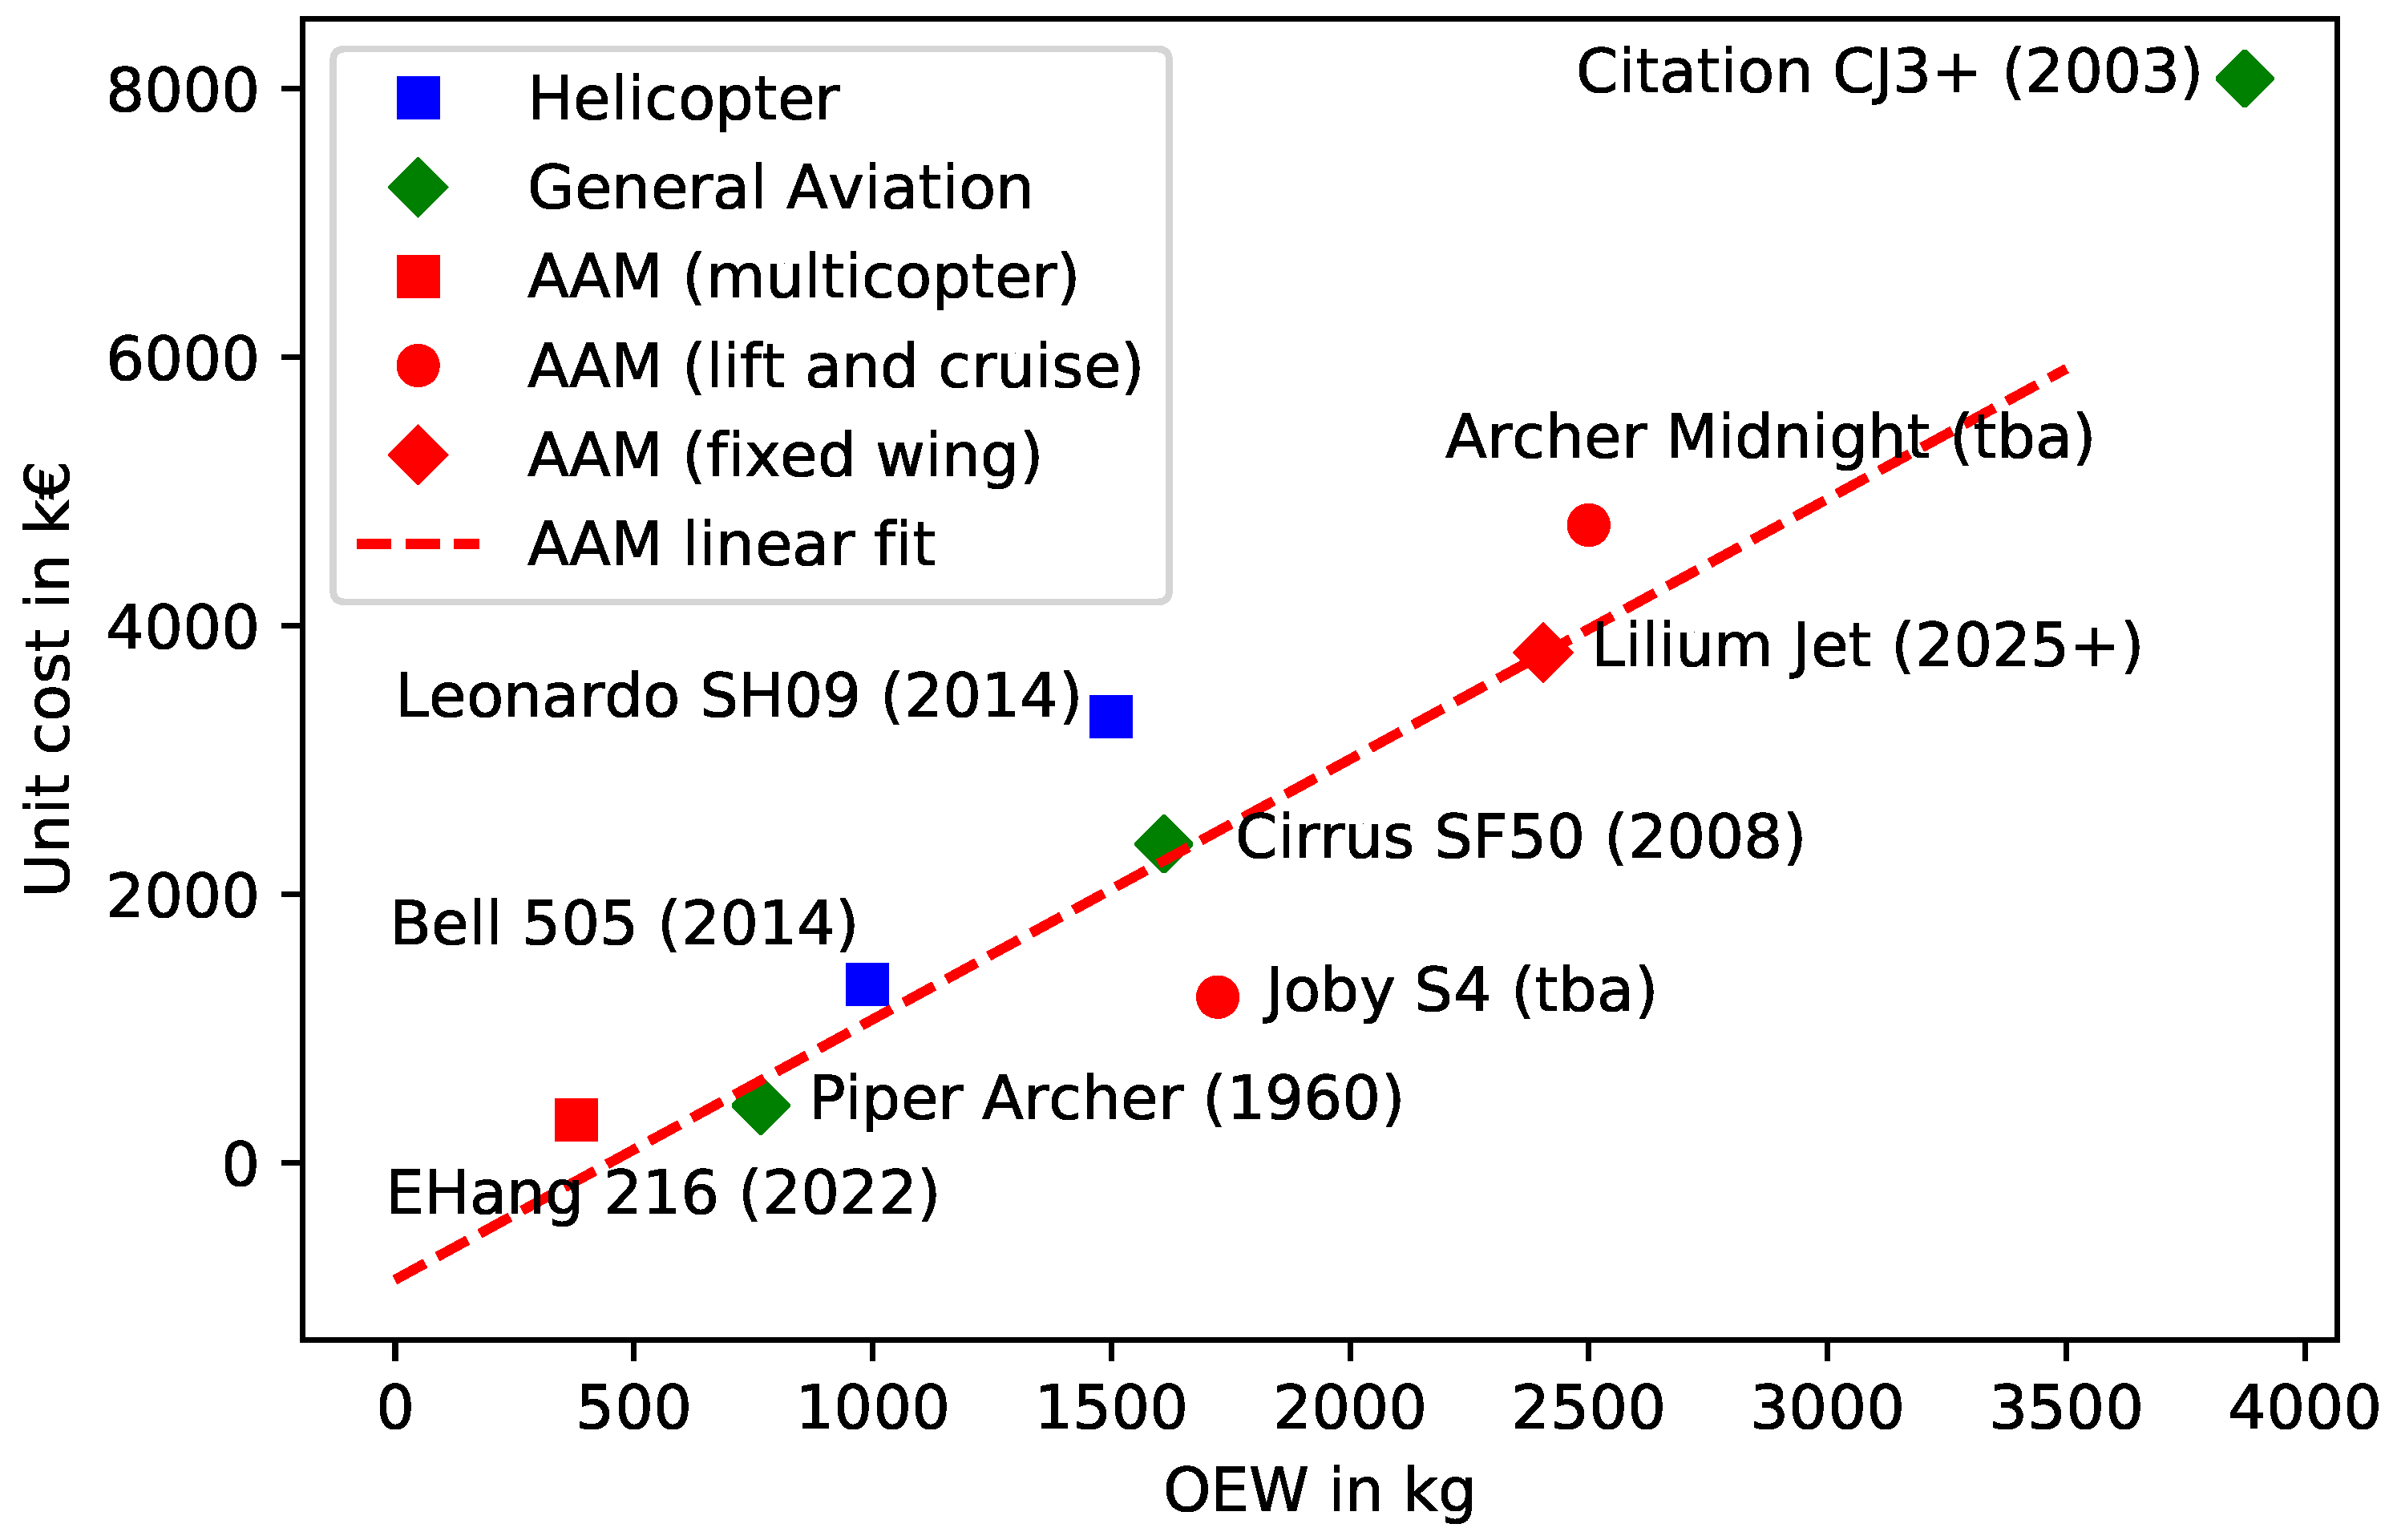
While EHang has set a unit price for its vehicle, unit prices for the Joby S4, Lilium Jet and Archer Midnight do not exist yet. On the other side, airlines like United Airlines from the US and Azul from Brazil announced a declaration of intent for the Archer and Lilium configuration. Based on the monetary volume of the declarations, a unit price for each aircraft is deviated. Figure 2 shows the unit price of the vehicles over their operating empty weight (OEW). In this case, the OEW includes all necessities to fulfill a mission without having a payload and an optional pilot on-board. To enhance comparability, deputies of existing helicopters and general aviation aircraft are added to Figure 2 as well as their Entry Into Service (EIS).
Different vehicle configurations are indicated by different markers. AAM vehicles are marked in red while helicopters and aircraft of general aviation are marked in blue and green. The dashed line presents a linear fit by taking the AAM vehicle into account, consisting of a slope m and an axis intercept b. Here, the unit price increases with the OEW of the aircraft. As a reference to general aviation, this figure includes three examples of manned aviation, Piper Archer, Cirrus Vision SF50 and a Citation CJ3+. Their passenger capacity ranges from five to eight seats including a pilot. All examples of general aviation and the helicopters fit to the SWAP of the presented AAM and are quite in line with the red linear fit.
This study assumes that an airline buys the aircraft by the OEM at any time. Aircraft leasing as an established financing form in other transport modes has not been considered yet. Whenever leasing is introduced to AAM, this DOC model needs to be adapted around the cost element C c a p i t a l .

2.2.5. Fuel Cost

The consumed energy en route depends on the flight trajectory including vertical and horizontal flight phases, as well as the vehicle configuration itself. While the calculation of the flight time and FC per day uses a detailed flight trajectory, the energy consumption depends on the flight distance only in this study. Due to the fact, that the consumed energy during vertical and horizontal flight phases are not known for several vehicle configurations, this study refers to the previous work of Sripad and Viswanatha [38].
Assuming every vehicle operates as fully electrical, the energy consumption has to be multiplied by the relevant energy price. Current developments in the energy business act on C f u e l directly. In general, energy prices increase, while detailed forecasts include a set of uncertainties [39]. Since the energy price per kWh varies and business concepts for AAM applications are not negotiated yet, this study sets the energy price to C e n e r g y = 0.4 /kWh as a conservative derivation of the energy price in Germany in November 2022 [40].

2.2.6. Crew

With the EIS of AAM a pilot on board is expected during flight operations [41]. From the passengers’ point of view a pilot on board offers confidence while an airline plans operation without a crew, so that the vehicle operates autonomous [42]. An airline has three major benefits when operating without a pilot: (1) reducing human factors in their business concept, (2) increasing the ASK since one more seat can be sold to a passenger and (3) decreasing labor cost when no pilot have to be paid. For this investigation, only the last item has an impact on the DOC model. In a first step, the cost model includes a pilot salary ( C c r e w ), as long as the regarded vehicle offers a pilot seat. Therefore, the US Department of Labor published statistics of pilot wages in the US, in which the median for airline pilots, copilots and flight engineers is 160,970 $ in 2020 [43].

3. Pre-Defined Use Case

To evaluate the costs for an AAM flight, this study investigates different applications. For this purpose, this analysis takes three different use cases into account that have already been drafted by Asmer [44]. Based on these mission designs, this study applies the pre-defined use cases to the metropolitan area of Hamburg. Therefore, Table 2 presents the coordinates for the considered origins and destination.
The locations are picked based on the purpose of the mission profiles. However, this does not take any demand analysis or practicability of the vertiports into account. Each presented vertiport performs as an infinite source of ground handling and airspace capacities with no limitations to the flight operations.
The following sub sections describe the three use cases in detail. All vehicle information are summed up in Appendix A. Each use case presents one example of a potential application in the metropolitan area of Hamburg. They serve as a showcase to calculate the costs only without making any statement about the eligibility of the itineraries.

3.1. Intra City

According to the pre-defined use case Intra City, the travel distance goes up to 50 km while a vehicle can carry two up to four passengers. Since vertiports are located in urban areas where constructions around limit take-off and landing procedures, a multirotor configuration for vertical take-off and landing is recommended [44]. For the city of Hamburg, with a population of 1.8 million located within an area of 20 km radius, the EHang 216 fits to the requirements, which is an autonomous two-seater with a maximum range of 35 km [4,45]. The connection between the Main Train Station in Hamburg and the manufacturer Airbus in Finkenwerder is suitable for a representative route for the intra-city use case. Its distance comprises 12.13 km.

3.2. Airport Shuttle

The second exemplary use case describes the Airport Shuttle, in which a passenger wants to travel to or go from the airport. While the travel distance does not exceed 30 km, a vehicle configuration with enough room for additional luggage is needed [44]. A lift and cruise configuration, representative of the Archer Midnight at this point, serves this application. In this case, the vehicle can carry up to four passengers and one pilot [3]. For this study, the airport HAM is connected with the vertiport located in Finkenwerder, so that a travel distance of 15.11 km results from this origin destination pair.

3.3. Regional Air Mobility

To cover a wide area with AAM, the last use case connects distant cities. The inter-city use case represents a regional application in which the travel distance exceeds 100 km while carrying six to ten passengers. On longer routes, a multicopter does not fit well due to the energy consumption and cruise speed [44]. This is why this study takes a Lilium Jet having wings for the lift as a vehicle to fulfill the regional mission. This vehicle has a capacity of seven seats while traveling more than 250 km with 280 km/h [46]. As an example, to represent the regional use case, this study investigates the route between the Main Train Station in Hamburg and the airport GWT of Sylt, which are located 186.35 km apart.

4. Results and Discussion

In the following chapter, direct operating costs (DOC) and revenues are estimated for all UAM use cases considered. In Section 4.1, the DOC are first provided for a baseline scenario. Since DOC estimations for UAM is subject to particularly high uncertainties, sensitivity analyses are conducted in Section 4.2 for those parameters with particularly high leverage and benchmarked against the baseline case.

4.1. Base Scenarios

For all use cases, lateral flight tracks and base case DOC estimates are shown in Figure 3. Since different flight tracks are conceivable for each use case, analyzed routes (gray squares) are visualized relative to the great circle connections. For the great circle trajectories, characteristic starting points of the main flight phases are highlighted as squares and circles in green and blue (compare Figure 1). Our analyzed route of the intra-city flight (Figure 3a) is 13.3 % longer than the shortest possible connection. For the airport shuttle (Figure 3c), the detour factor is 7.1 %, for the regional air mobility 16.7 % (Figure 3e). Corresponding DOCs are pictured as nested circular charts. For a conservative DOC estimate, a detour factor of + 30 % is applied to all charts.
Since there is no pilot on board in use case 1, Figure 3b does not show any crew cost. The DOC for the intra-city use case are mainly driven by maintenance and overhaul costs, which scale with a high frequency due to a short flight time. Terminal and landing fees do not scale with the length of an itinerary, but with the landing only. Since the total DOC on this use case is the lowest, the fraction of landing and terminal fees is greater than 25%.
Regarding use case 2, the Archer Midnight can carry up to five people, including one pilot. For this purpose, the airframe has to provide enough stability for the payload and the battery pack. As long as the OEW of the Archer Midnight cannot be reduced and the price per OEW keeps as high as described in Section 2.2.4, the capital costs, which scale linearly with OEW, dominate this use case.
Lastly, the Lilium Jet operates on the regional use case. Due to the distance and the energy unit price described in Section 2.2.5, almost 50% of the DOC include fuel costs. Changes on the energy unit price have a major impact on the total DOC here. Because of the energy consumption on this itinerary and the uncertainty of energy price forecasts, this use case depends on the energy market and its availability.
All three use cases show different DOC characteristics by reason of vehicle performance and mission profile. Breaking down the distance, Table 3 shows the DOC per ASK. All results are presented with a LF of 100%.
In all three cases, an airline has to bring up the presented DOC per cycle. Split over the distance on each flight, the DOC per ASK indicates the occurring cost per seat and kilometer. While the DOC per ASK for use case 1 and 2 are in same range, this metric decreases on longer flights such as on the regional use case. If an airline cannot operate its mission with a LF of one, the left-over passengers have to carry the remaining cost so that an airline is economically viable. According to Formula (2), the airline deals with the cost reallocation by handling the ticket fare per passenger.

4.2. Sensitivity

While every cost element has its own set of impact factors, every sensitivity analysis in this study considers each cost element as a locked subsystem. This is why this sensitivity analysis does not consider the details of certain cost elements, but handle the DOC in total.

4.2.1. Variation of Flight Cycles

The potential FC per day per aircraft varies among the three use cases. This is mainly driven by the flight time to fulfill the defined mission. Table 4 presents the flight time for each use case calculated by the trajectory model that is described in Section 2.2.1.
The OEM Joby expects 12 h of operations per day for intra-city applications [27]. In the case of 20 FC per day, this assumption implies a new flight every 36 min by operating 300 days per year. Influences such as weather impact, airspace closings or demand gaps are not considered in the detailed FC analysis. Furthermore, an investigation of the necessary time for ground handling does not count into this FC analysis as well. In order to analyze the impact of the FC, the FC varies of 20% around the base scenario to obtain an optimistic and conservative result. The consequences of several flight cycles per year on the DOC are presented in Figure 4 by giving the optimistic, base and conservative scenario.
The optimistic scenario demonstrates a showcase, in which 20% additional FC can be operated on each use cases in comparison to the calculated base scenario. In contrast, the conservative scenario assumes 80% of the base FC. When regarding the DOC, the FC influences the capital and crew costs. In both cases, these cost elements have a fixed price tag per year, which an airline has to pay annually. The more flights that can be done, the more flights are available to carry those cost elements. On the contrary, fee charges, fuel cost and maintenance and overhaul cost accrue with the flight time and FCs.
As a result, the DOC increases for every use case when less FCs can be done per year. Since there is no crew planned on use case 1, only the capital cost shows a rise. While there is a pilot on-board in use cases 2 and 3, there is a rise for crew and capital cost there. It is an airline’s goal to maximize the utilization of their aircraft fleet to keep the DOC per cycle as low as possible.
Alongside the airline, the vertiport operator as a further stakeholder contributes to the AAM business as well. Whenever a vertiport operator applies for approval to integrate a vertiport into the airspace operations, several factors need to be evaluated. Next to ecological impacts and the integration in the construction site, the necessity for aviation operations contributes to the approval procedure [47]. If not enough FCs can be proven, that underlines the need for a certain vertiport location, and no corresponding authority will permit AAM operation at this point. This restriction does not influence the airline directly, but the AAM stakeholder in general.

4.2.2. The Impact of the Load Factor

The second sensitivity analysis considers the load factor on each cycle. Figure 5 presents the DOC per AS when having a LF of less than one. The gradient for each use case depends on the AS per aircraft. Depending on the vehicle data and its AS, the potential revenue seat varies among the use cases. Additionally, this image includes the FC sensitivity analysis of Section 4.2.1.
The baseline for each use case corresponds to the FC presented in Table 4. Since there are no further information on the dynamics of the energy consumption of the vehicles, the cost element C f u e l keeps independent of the LF. While the landing fee per revenue seat C l a n d i n g is the only DOC input that scales with the carried passengers, all other DOC elements are unaffected by the revenue seats. In comparison to a variation of the FC, changes of the LF have a greater impact on the DOC per revenue seat. From an airline perspective, this insight has a consequence on the business model. To reduce the DOC per ASK, an operator focuses on a high LF instead of many FC in a certain time section. As long as an on-demand mobility service can provide a higher LF than a fixed flight schedule with greater FC, on-demand flights lead to lower DOC for an airline.

4.3. Comparison to General Aviation

This chapter provides an overview about the benefit in the aspects of energy consumption and time saving of AAM in comparison to manned aviation. Since a general aviation service does not exist for the first two use cases, this comparison only works for the regional itinerary Hamburg–Sylt. In this case, a Cessna Citation Jet CJ2+ starts at Hamburg HAM going to Sylt GWT and returns. Corresponding flight tracks for the itineraries are presented in Figure 6.
Presented trajectory and the calculation of the consumed fuel for the Citation CJ2+ is based on Lührs [48]. Due to airspace restrictions, the flight trajectory of forward run and return differ as well as the consumed fuel. Table 5 shows the time and energy aspects of a general aviation flight from HAM to GWT. The fuel price is linked to the jet fuel price monitor of IATA ( 1.148 $ /kg) [49].
To compare the existing flight trajectories between HAM and GWT, use case 3, named Regional AAM in Table 5, shows a benchmark in which the travel time and fuel costs are compared. Here, the flights with the Citations CJ2+ offer a benefit in terms of travel time and fuel cost.
As mentioned in Section 2.2.5, the energy cost for the Lilium Jet implies two uncertainties. On the one hand, the energy consumption of the flight applies on an energy consumption model, in which the energy use is given per km independent of any flight trajectory. This is why the energy consumption serves as an orientation, but does not describe a precise flight. On the other hand, the energy price on the market for electricity is a subject of conditions. These conditions can be the availability on the market, contracts between an energy service provider and the airline or influenced by a vertiport operator.

4.4. Review of the Results

As described in Section 2.1, an airline’s objective is to maximize profit. Therefore, unit costs must be reduced to a pre-defined limit while the product of RPK and yield should be as high as possible. As shown in Section 4.2.1 and Section 4.2.2, the FC and the ALF influence the DOC per ASK. While the capital and crew cost per ASK decrease with the utilization of the vehicles, a pilot on-board blocks one potential passenger seat additionally as described in Section 2.2.6. On one side, the cost element C c r e w omits when there is no pilot on-board. On the other hand, the reduced costs can be distributed to one additional seat. The sensitivity analysis has shown that a high LF of the vehicle has a major impact on the DOC per ASK. However, this study does not consider changes in the energy consumption while operating with a different LF. This is why the cost element C f u e l is fixed per use case.
As mentioned before, this study describes the modeling of the DOC only, while indirect cost, such as marketing, overhead and customer service, are part of the airline-specific business. In addition to that, the airline income depends on the attractiveness of the airline that is influenced by the airline offer, the structure of the population and the competition to further transport modes. After setting up an airline business in combination with the passenger behavior in a certain region, the revenue for AAM can be estimated. For this purpose, an airline has to build up a network, in which the profit will be maximized. Previous analysis demonstrated the potential effects of a schedule and an on-demand service by varying FC and LF. In contrast to an airline that maximizes its profit, a public transport service provider optimizes its network in order to maximize the transported passengers or to include area-wide destinations simultaneously [50]. This approach focuses on the amount of carried passengers, where a detailed understanding of the passenger decision and population structure of the area under investigation is necessary.

4.5. Economic Viability

The total operating cost (TOC), as a sum of the DOC and indirect operating cost (IOC), are airline specific and depend on influences that are not the objective of this research. As a reason, the DOC can be set as a pre-defined percentage of the TOC. Two scenarios are presented in Figure 7 [12].
In both cases, optimistic and conservative, the profit margin as the quotient of revenue and TOC is fixed to a healthy margin of 10% [51]. By regarding the passenger behavior and a ticket fare system, the TOC can be evaluated in a loop simulation. Whenever the revenue leads to a defined profit margin by a given ticket fare and DOC, an airline can operate economically. Previous analyses of FC and LF are not influenced qualitatively by introducing TOC to the analysis. Existing effects do not change their character when scaling them with a factor, in this case adding IOC to achieve the TOC. After setting up a healthy 10% revenue margin to the TOC, an airline can determine a required fare system to operate economically. In order to ensure a solid profitability, the assumed profit margin of 10% is set to be more conservative than the annual net profit margin of 7.8 % for conventional aviation in 2019 [52]. Table 6 presents the necessary fare per km in order to achieve the 10% profit margin.
While this fare system does not take a distance-independent base fare into account, the fare per km has to cover the full amount of the costs. Assuming that the OEMs operate the AAM by themselves, Archer announced a cost-per-mile (CPM) of 3.00–4.00 $/mi that is equivalent to 1.77–2.36 /km [53]. Further studies estimate a CPM of less than 3 $/mi for a long term perspective [54,55]. Regarding use case 2, such a CPM does not work for the DOC model of this study to operate economically. Additionally, the calculated fare per km in Table 6 works under the assumption of a LF equals 1. If an airline can not stick to the ALF of one and the mentioned FC, the fare per km has to be even higher to achieve a 10% profit margin. Previous studies have shown the impact of changes of the fare per km on the total demand. Reducing the fare per km down to 2–3 /km in urban areas seems necessary to expect a market size that allows vehicle rotation with a high ALF [56,57]. In comparison to a ground-based taxi transport mode, a passenger has to pay between 1.70–2.60 as a fare per km in Hamburg [58].

5. Final Conclusions

5.1. Uncertainty in Modeling

AAM as a passenger transport service in Europe is still under development. No business plans have yet been published that can be used to evaluate the DOC model in terms of vehicle utilization or fleet size. Additionally, the DOC inputs do not refer to a certain area of application. The energy price, construction costs for the vertiport presented as landing fee, salaries for crew and labor are region-specific and may vary from city to city. Additionally, further developments in inflation and insurance rates as well as in the energy price influences the model in addition. This model does not take into account any time-related changes in the input parameters. This aspect also applies to the production cost of the vehicle configuration. Here, the unit price, derived from LOIs and literature research, does not include any learning curve or scaling factors in the production. Moreover, detailed vehicle specifications are unknown. This is why maintenance and overhaul cost as well as the energy consumption have to estimate on an abstract level.

5.2. Airline Business

If an AAM airline sets up a business, it has two general methods of how to operate: (1) a fixed schedule regardless of the current demand and (2) a demand service, in which a passenger sends a request and an airline provides a vehicle. In the first case, an airline can optimize the network to maximize vehicle utilization, investigated by varying the FC, while it is possible that there is a mischief if not enough passengers choose the AAM mode of transportation. This demand uncertainty has to be taken into account, representative in the ticket fare, in order to cover flights with a low LF. On the other hand, an on-demand service includes additional waiting time, if not enough vehicles are available to carry all passengers from one starting point. In that case, external vehicles have to be transported to where they are needed. From the perspective of an airline, empty flights are not desirable, since costs are incurred, but no revenue can be generated. In both scenarios, understanding passenger behavior is necessary to understand the impact of additional waiting time and increased ticket prices to estimate a profit margin. This study shows that a high ALF has a bigger impact on the DOC per ASK than increasing the FC. When an airline plans an AAM operation, the vehicle allocation needs to be set up with respect to minimize empty flights. Secondary empty flights could lead to additional waiting time on the vertiport where the vehicle was requested. Formula (1) describes this part of the total travel time as t s c h e d u l e . At this point, an airline has to evaluate the passenger and its reason for picking AAM as well, which is not part of this research.

5.3. Ticket Model

The ticket fare system as part of the income for AAM airlines was not discussed in detail in this study, assuming a base fare and fare per km leads to a unique ticket value on each itinerary. As mentioned in Section 2.1, EHang provides first flights in South East Asia, where a passenger has to pay around 55 for a 20 min flight, independent of the LF and booking time [5]. Another approach follows the idea of distributed ticket fares. That means, the first passenger who books a flight on a certain itinerary pays more than a passenger who fills the aircraft that is already allocated on this itinerary. In that case, low occupied flights could occur less frequently, depending on the passenger behavior. A higher ALF decreases the DOC per ASK, so that a lower ticket fare system can be provided. To include such an investigation, a passenger preference model is needed.

5.4. Outlook

Section 5.1 already describes uncertainties in the DOC model due to the lack of information. Whenever a vehicle configuration for AAM will be open for research, detailed maintenance and overhaul aspects can be investigated, which influences the maintenance cost. In the same way, the capital cost and depreciation benefit from price labels for AAM vehicle since unit prices have to be deduced from press releases only. A third unknown influence on the DOCs is the energy consumption. At this moment manufacturers do not publish the technical performance in terms of energy. In detail, a climb and descent as well as a cruise consume the same amount of energy independent of the LF.
Figure 7 presents the IOC fraction related to the TOC. Since AAM airlines did not publish any detailed business models, there are no statements about the marketing, customer services or further overhead activities yet. In fact, the indirect operating cost influences both, the expenses on the one hand and the potential profit on the other hand. Revenue aspects are investigated in passenger choice models as mentioned in Section 4.5.
After understanding the general economics of AAM, it is planned to integrate different transport modes into the business evaluation. This enables the derivation of key performance indicators for specific AAM markets.

Author Contributions

Conceptualization, J.P., M.N., M.S., V.G., S.K., K.S. and S.B.; methodology, J.P., M.N. and M.S.; software, J.P., M.N. and M.S.; validation, J.P., M.N. and M.S.; formal analysis, J.P., M.N. and M.S.; investigation, J.P., M.N. and M.S.; resources, J.P., M.N. and M.S.; data curation, J.P., M.N., M.S., S.K. and K.S.; writing—original draft preparation, J.P.; writing—review and editing, J.P., M.N. and M.S.; visualization, J.P. All authors have read and agreed to the published version of the manuscript.

Funding

This research received no external funding.

Data Availability Statement

Not applicable.

Acknowledgments

The authors would like to thank Florian Linke and Alexander Lau for providing the flight track and fuel consumption on the itinerary HAM-GWT.

Conflicts of Interest

The authors declare no conflict of interest.

Abbreviations

The following abbreviations are used in this manuscript:
AAMAdvanced Air Mobility
AAVAutonomous Aerial Vehicle
ALFAverage Load Factor
ANSPAir Navigation Service Provider
ASKAvailable Seat Kilometer
CPMCost per Mile
DOCDirect Operating Cost
DPDepreciation Period
EISEntry Into Service
FCFlight Cycles
FHFlight Hours
IOCIndirect Operating Cost
IRInterest Rate
LCCMLife Cycle Cost Management
LFLoad Factor
LRULine Replaceable Unit
LOILetter of Interest
MOMaintenance and Overhaul
MTOMMaximal Take-Off Mass
OEMOriginal Equipment Manufacturer
OEWOperating Empty Weight
RPKRevenue Passenger Kilometer
RVResidual Value Factor
SWAPSize, Weight and Power
TOCTotal Operating Cost
UAMUrban Air Mobility letter acronym

Appendix A

Table A1. Vehicle data for DOC calculation.
ValueUnitEHang 216Archer MidnightLilium Jet
n_seat-257
n_pilot-011
cruise speedkm/h100240280
cruise altitudem30020003000
rangekm35100250
Operating Empty Weightkg36025002475
Maximal Take-Off Masskg62029503175
vertical accelerationm/s20.60.60.6
horizontal accelerationm/s2222

Appendix B

Table A2. Inputs for DOC model.
NameSymbolUnitValue
Exchange rate €/$0.95
Electricity price €/kWh0.4
Interest rateIR 0.05
Depreciation periodDPa10
Residual value factorfRV 0.1
Insurance ratefINS 0.005
Salary pilot €/a150,000
Price OEW slopem€/kg1938.09
Price OEW interceptb−869,480.59
Labor rate €/h70
MMH100h24
MMH200h40
MMH1750h60
MMH3500h80
c_mat100$320
c_mat200$640
c_mat1750$6400
c_mat3500$16,000
cleaningcleaning10
landingU_landing6
a_t 50
b_t 0.7
U_t$235.56
a_e 50
b_e 0.5
U_e$/km0.99
C_landing€/pax6
K_landing30
POT_pah8760
DT_pah2748.8
Ground Timegroundtimeh0.83

References

  1. Drone Industry Insights. Windrove Vertiport: HAP 1.1. Available online: https://droneii.com/drone-reports (accessed on 4 December 2022).
  2. Treeck, H.; Reuter, F. Volocopter Air Taxi Flies Over Singapore’s Marina Bay. Available online: https://www.volocopter.com/newsroom/volocopter-conducts-south-koreas-first-crewed-airtaxi-test-flight/ (accessed on 22 April 2022).
  3. Blain, L. Archer Outlines What Its Early eVTOL Air Taxi Service Will Look Like. Available online: https://newatlas.com/aircraft/archer-evtol-service-interview/ (accessed on 4 December 2022).
  4. Lye, G. EHang 216 Flying Taxi to Be Tested in Bali, Indonesia this October—Public Will Get to Use Service in 2022. International News. Available online: https://paultan.org/2021/09/06/indonesia-to-begin-testing-flying-taxis-in-bali-this-october/ (accessed on 22 April 2022).
  5. Kurniawan, D.; Setyakusuma, M.K. EHang 216 Flying Taxi Arrives in Indonesia. Available online: https://en.tempo.co/read/1501705/ehang-216-flying-taxi-arrives-in-indonesia (accessed on 4 December 2022).
  6. Maheshwari, A.; Mudumba, S.; Sells, B.E.; DeLaurentis, D.A.; Crossley, W.A. Identifying and Analyzing Operations Limits for Passenger-Carrying Urban Air Mobility Missions. In Proceedings of the AIAA Aviation 2020 Forum, Virtual, 15–19 June 2020. [Google Scholar] [CrossRef]
  7. Balac, M.; Rothfeld, R.L.; Horl, S. The Prospects of on-demand Urban Air Mobility in Zurich, Switzerland. In Proceedings of the 2019 IEEE Intelligent Transportation Systems Conference (ITSC), Auckland, New Zealand, 27–30 October 2019; pp. 906–913. [Google Scholar] [CrossRef] [Green Version]
  8. Federal Aviation Administration. Urban Air Mobility and Advanced Air Mobility: What is Urban Air Mobility; Federal Aviation Administration: Washington, DC, USA. Available online: https://www.faa.gov/uas/advanced_operations/urban_air_mobility/ (accessed on 20 April 2022).
  9. Belobaba, P. (Ed.) The Global Airline Industry; Wiley: Chichester, UK, 2009. [Google Scholar]
  10. Preis, L.; Hornung, M. A Vertiport Design Heuristic to Ensure Efficient Ground Operations for Urban Air Mobility. Appl. Sci. 2022, 12, 7260. [Google Scholar] [CrossRef]
  11. Risse, K.; Schäfer, K.; Schültke, F.; Stumpf, E. Central Reference Aircraft data System (CeRAS) for research community. CEAS Aeronaut. J. 2016, 7, 121–133. [Google Scholar] [CrossRef]
  12. Niklaß, M.; Dzikus, N.; Swaid, M.; Berling, J.; Lührs, B.; Lau, A.; Terekhov, I.; Gollnick, V. A Collaborative Approach for an Integrated Modeling of Urban Air Transportation Systems. Aerospace 2020, 7, 50. [Google Scholar] [CrossRef]
  13. Ultimate Aviation Group. Ultimate Helistop—Heliport Fees. Available online: https://ultimate-aviation.net/service/heliport-fees/ (accessed on 4 January 2023).
  14. Flughafen Sylt. Entgeltregelung für den Verkehrsflughafen Sylt: Landeentgelte. Available online: https://www.flughafen-sylt.de/piloten/entgelte (accessed on 2 January 2023).
  15. Rode, L.; Alpers, P.; Noll, E.; Hollburg, D.; Blaume, M.; Schreiber, E. List of Fees: Airport Fees according to Art. 19b Air Traffic Act. Available online: https://www.hannover-airport.de/fileadmin/downloads/B2B_und_Geschäftskunden/Entgelte_und_AGB/AGB_und_Entgelttabellen/List_of_Fees_2022-01-01.pdf (accessed on 9 January 2023).
  16. Sridhar, B.; Ng, H.K.; Linke, F.; Chen, N.Y. Impact of Airspace Charges on Transatlantic Aircraft Trajectories. In Proceedings of the 15th AIAA Aviation Technology, Integration, and Operations Conference, Dallas, TX, USA, 22–26 June 2015. American Institute of Aeronautics and Astronautics. [Google Scholar] [CrossRef] [Green Version]
  17. Eriksson, S.; Steenhuis, H.J. (Eds.) Routledge studies in the modern world economy. In The Global Commercial Aviation Industry; Routledge: London, UK, 2016; Volume 144. [Google Scholar]
  18. Sieb, P.; Michelmann, J.; Floeter, F.; Wicke, K. Identifying Challenges in Maintenance Planning for On-demand UAM Fleets using Agent-based Simulations. CEAS Aeuronautical J. 2022. under review. [Google Scholar]
  19. Sonnier, B. How Much Does a Car Wash Cost? Average Cost. Available online: https://www.charmcitycirculator.com/how-much-does-a-car-wash-cost/ (accessed on 2 January 2023).
  20. Future Flight. EHang Autonomous Aerial Vehicle. Available online: https://www.futureflight.aero/aircraft-program/ehang-autonomous-aerial-vehicle?model=ehang-216 (accessed on 8 November 2022).
  21. Future Flight. Preorder for 100 EHang eVTOL Aircraft Paves the Way for Urban Air Moiblity in Indonesia. Available online: https://www.futureflight.aero/news-article/2022-04-11/preorder-100-ehang-evtol-aircraft-paves-way-urban-air-mobility-indonesia (accessed on 26 July 2022).
  22. Bell, M.; Abud, F.D. Lilium Holds Capital Markets Day, Announces Plan for $1 Billion Commercial Deal & Strategic Alliance with Leading Brazilian Airline Azul and the Appointment of New Board Members Following Business Combination with Qell. Available online: https://lilium.com/newsroom-detail/capital-markets-day-planned-1-billion-commercial-deal-with-brazilian-airline-azul-appointment-of-new-board-members (accessed on 26 July 2022).
  23. Blain, L. Lilium Touts Billion-Dollar, 220-Unit eVTOL Sale to Brazilian Airline. Available online: https://newatlas.com/aircraft/lilium-azul-sale/ (accessed on 26 July 2022).
  24. Weitering, H. Archer Plans to Reveal Its ‘Midnight’ eVTOL Air Taxi Next Month. Available online: https://www.futureflight.aero/news-article/2022-10-14/archer-plans-reveal-its-midnight-evtol-air-taxi-next-month (accessed on 8 November 2022).
  25. Adcock, B.; Goldstein, A. Archer to Unveil Production Aircraft Midnight at its November 16th Open House Event. Available online: https://www.archer.com/ (accessed on 9 November 2022).
  26. Bogaisky, J. Has Joby Cracked The Power Problem To Make Electric Air Taxis Work? Available online: https://www.forbes.com/sites/jeremybogaisky/2020/11/23/joby-batteries-electric-aviation/?sh=253486ee76a7 (accessed on 8 November 2022).
  27. Bevirt, J.; Sciarra, P.; Thompson, M. Commercializing Aerial Ridesharing-Joby and Reinvent: Reinvent is Proud to Sponsor Joby: A World-Changing. Available online: https://d1io3yog0oux5.cloudfront.net/_dcbc6a0f9bffdc1c066caee0280e043f/reinventtechnologypartnersa/db/1153/10255/presentation/Commercializing+Aerial+Ridesharing+-+Joby+and+Reinvent+-+02.24.2021.pdf (accessed on 4 December 2022).
  28. Calcagno, J.; Markford, D.; Sessoms, B.; Gunnarsion, R.; Spadaro, G.; Ouellet, M. Archer LX: Four-Place, Single Engine Piston. Available online: https://www.piper.com/wp-content/uploads/2022/03/2022_Archer-LX-Single-Sheet-np.pdf (accessed on 9 November 2022).
  29. European Aircraft Sales. PIPER Archer LX/DLX—European Aircraft Sales. Available online: https://europeanaircraftsales.com/piper-dealer/piper-archer-lx-dx/#1523974226562-29396fc6-c362 (accessed on 9 November 2022).
  30. Cirrus Aircraft. Vision Jet Specification. Available online: https://cirrusaircraft.com/aircraft/vision-jet/ (accessed on 9 November 2022).
  31. Controller. Cirrus Vision SF50 Aircraft For Sale. Available online: https://www.controller.com/listings/for-sale/cirrus/vision-sf50/aircraft (accessed on 9 November 2022).
  32. Cessna. Citation CJ3+: Model Specification. Available online: https://cessna.txtav.com/en/citation/cj3#_model-specs (accessed on 9 November 2022).
  33. AvBuyer. View Cessna Citation CJ3+ Jets | AvBuyer. Available online: https://www.avbuyer.com/aircraft/private-jets/cessna-citation/cj3-plus (accessed on 9 November 2022).
  34. Bell Aircraft Corporation. Bell Products: Five Seats. Innumerable Benefits. Available online: https://de.bellflight.com/products/bell-505 (accessed on 9 January 2023).
  35. AvBuyer. Bell 505 Jetranger X Turbine Helicopters for Sale. Available online: https://www.avbuyer.com/aircraft/helicopter/turbine/bell-helicopters/505-jetranger-x (accessed on 9 January 2023).
  36. Koptergroup. AW09 Single (R)evolution. Available online: https://koptergroup.com/sh09/ (accessed on 9 January 2023).
  37. air.one. Leonardo SH09: Base Aircraft Price: Summary. Available online: https://air.one/aircraft-showroom/leonardo-sh09 (accessed on 2 January 2023).
  38. Sripad, S.; Viswanathan, V. The promise of energy-efficient battery-powered urban aircraft. Proc. Natl. Acad. Sci. USA 2022, 118, 45. [Google Scholar] [CrossRef] [PubMed]
  39. Afman, M.; Hers, S.; Scholten, T. Energy and Electricity Price Scenarios 2020-2023-2030: Input to Power to Ammonia Value Chainsand Business Cases. Available online: https://cedelft.eu/wp-content/uploads/sites/2/2021/04/CE_Delft_3H58_Energy_and_electricity_price_scenarios_DEF.pdf (accessed on 1 November 2022).
  40. Holm, L.M. Strom-Report: Statistiken & Infografiken: Energie & Umwelt. Available online: https://strom-report.de/ (accessed on 1 November 2022).
  41. European Union Aviation Safety Agency. Study on the Societal Acceptance of Urban Air Mobility in Europe; European Union Aviation Safety Agency: Cologne, Germany, 2021. [Google Scholar]
  42. Kim, S.R.; Cho, Y.J.; Jeon, S.M. A Study on the Urban Air Mobility(UAM) Operation Pilot Qualification System. Int. J. Internet, Broadcast. Commun. 2022, 14, 201–208. [Google Scholar] [CrossRef]
  43. U.S. Department of Labor, Bureau of Labor Statistics. Occupational Outlook Handbook and Career Guide to Industries. Available online: https://www.bls.gov/ooh/ (accessed on 1 November 2022).
  44. Asmer, L.; Pak, H.; Prakasha, P.S.; Schuchardt, B.I.; Weiand, P.; Meller, F.; Torens, C.; Becker, D.; Zhu, C.; Schweiger, K. Urban Air Mobility Use Cases, Missions and Technology Scenarios for the HorizonUAM Project. In Proceedings of the AIAA Aviation 2021 Forum, Virtual, 2–6 August 2021; American Institute of Aeronautics and Astronautics: Reston, VA, USA, 2021. [Google Scholar] [CrossRef]
  45. EHang. Autonomous Aerial Vehicle (AAV) Innovator for Urban Air Mobility (UAM). Available online: https://www.ehang.com/ (accessed on 2 November 2022).
  46. Bogaisky, J. Lilium’s New Course: On Verge Of Going Public, It’s Working On A Bigger Air Taxi. Can It Deliver? Available online: https://www.forbes.com/sites/jeremybogaisky/2021/02/10/lilium-evtol-spac-air-taxi/?sh=49613b21627c (accessed on 2 November 2022).
  47. Bundesministerium der Justiz. Bekanntmachung der Allgemeine Verwaltungsvorschrift zur Genehmigung der Anlage und des Betriebs von Hubschrauberflugplätzen: Nummer 246a; Bundesministerium der Justiz: Berlin, Germany, 2005. [Google Scholar]
  48. Lührs, B.; Linke, F.; Gollnick, V. Erweiterung eines Trajektorienrechners zur Nutzung meteorologischer Daten für die Optimierung von Flugzeugtrajektorien. In Proceedings of the 63. Deutscher Luft- und Raumfahrtkongress 2014 (DLRK), Augsburg, Germany, 16–18 September 2014. [Google Scholar]
  49. International Air Transport Association. Jet Fuel Price Monitor: Economics: Publications; International Air Transport Association: Montreal, QC, Canada, 2022. [Google Scholar]
  50. Ministry for Infrastructure and Digital Affairs of the State of Saxony-Anhalt. OEPNV-Plan 2020–2030: Plan des öffentlichen Personennahverkehrs. Available online: https://www.nasa.de/fileadmin/content_nasa/inhalte/02_verkehr_planung/02_oepnv_plan/pdf/OEPNV-Plan_2020_-_2030_Webfassung.pdf (accessed on 3 August 2022).
  51. Plötner, K.O.; Al Haddad, C.; Antoniou, C.; Frank, F.; Fu, M.; Kabel, S.; Llorca, C.; Moeckel, R.; Moreno, A.T.; Pukhova, A. Long-term application potential of urban air mobility complementing public transport: An upper Bavaria example. CEAS Aeronaut. J. 2020, 1–17. [Google Scholar] [CrossRef] [PubMed]
  52. CSImarket. Airline Industry Profitability: Profitability Information and Trends. Available online: https://csimarket.com/Industry/industry_Profitability_Ratios.php?ind=1102&hist=8 (accessed on 2 August 2022).
  53. Garsten, E. Archer Electric VTOL Air Taxi Demo Passes Major Test. Available online: https://www.forbes.com/sites/edgarsten/2021/12/20/archer-air-taxi-demo-passes-major-test/ (accessed on 8 November 2022).
  54. Goyal, R.; Reiche, C.; Fernando, C.; Cohen, A. Advanced Air Mobility: Demand Analysis and Market Potential of the Airport Shuttle and Air Taxi Markets. Sustainability 2021, 13, 7421. [Google Scholar] [CrossRef]
  55. Reiche, C.; Goyal, R.; Cohen, A.; Serrao, J.; Kimmel, S.; Fernando, C.; Shaheen, S. Urban Air Mobility Market Study. Available online: https://escholarship.org/uc/item/0fz0x1s2 (accessed on 4 December 2022).
  56. Pertz, J.; Lütjens, K.; Gollnick, V. Approach of modeling passengers’ commuting behavior for UAM traffic in Hamburg, Germany. In Proceedings of the 25th ATRS World Conference, Antwerp, Belgium, 24–27 August 2022. [Google Scholar]
  57. Rimjha, M.; Hotle, S.; Trani, A.; Hinze, N. Commuter demand estimation and feasibility assessment for Urban Air Mobility in Northern California. Transp. Res. Part A Policy Pract. 2021, 148, 506–524. [Google Scholar] [CrossRef]
  58. Free and Hanseatic City of Hamburg. Taxirechner für Hamburg: Wie Viel Kostet Meine Taxifahrt? Available online: https://www.hamburg.de/taxirechner/ (accessed on 14 November 2022).
Figure 1. Exemplary simplified flight profile: (a) altitude over distance, (b) vertical acceleration over flight time and (c) horizontal acceleration over flight time.
Drones 07 00075 g001
Figure 2. Estimated unit cost per OEW for EHang 216 [20,21], Lilium Jet [22,23], Archer Midnight [24,25], Joby S4 [26,27], Piper PA-28-181 Archer III LX [28,29], Cirrus Vision SF50 [30,31], Citation CJ3+ [32,33], Bell 505 [34,35], Leonardo SH09 [36,37]; all vehicles labeled are with their EIS.
Drones 07 00075 g002
Figure 3. Flight track and DOC for each use case in a base scenario.
Drones 07 00075 g003
Figure 4. Different scenarios variations of FC: o p t i m i s t i c = 1.2 · F C , b a s e = 1 · F C , c o n s e r v a t i v e = 0.8 · F C .
Drones 07 00075 g004
Figure 5. DOC per revenue seat in € with different FC and LF scenarios, use case 1 in green diamonds, use case 2 in red circles and use case 3 in blue triangles.
Drones 07 00075 g005
Figure 6. Flight track of a Cessna Citation CJ2+ between HAM and GWT.
Drones 07 00075 g006
Figure 7. Visualization of the profit margin for an optimistic and conservative TOC set up [12].
Drones 07 00075 g007
Table 1. Maintenance schedule for UAM vehicles after certain flight hours (FH) and flight cycles (FC) [18].
Intervals C labor C material
100 FH 1596 304
200 FH 2660 608
1750 FC 3990 6080
3500 FC 5320 15,200
Table 2. Locations for investigated use cases.
LocationLatitudeLongitude
Main Train Station53.55092310.007651
Finkenwerder53.5397419.824558
HAM, Fuhlsbüttel53.62630710.001671
GWT, Sylt54.9121278.330815
Table 3. DOC per ASK while LF = 1.
Use CasePaxDOCDOC/ASDOC/ASK
1Intra City2 62.07 31.04 2.59 /km
2Airport Shuttle4 231.30 57.83 3.86 /km
3Regional6 700.83 116.81 0.63 /km
Table 4. Flight time and cycles for each use case assuming 300 operation days per year; flight cycles presented per year ( a 1 ) and per day ( d 1 ).
Use CaseFlight TimeFlight CyclesFlight Cycles
1Intra-City 11.6 min 5874 a 1 19.58 d 1
2Airport Shuttle 12.0 min 5836 a 1 19.45 d 1
3Regional 56.6 min 3389 a 1 11.30 d 1
Table 5. General aviation flight from HAM to GWT and return in comparison to regional AAM (use case 3) in terms of travel distance, travel time and fuel cost.
DistancetFlight Δ tFlight Fuel C fuel Δ fuel
HAM-GWT 100.74 km 25.2 7 min 54.8 %187 kg 203.94 37.2 %
GWT-HAM 111.56 km 27.59 min 50.5 %206 kg 224.66 30.8 %
Regional AAM 186.33 km 55.70 min-nA 324.54 -
Table 6. Fare per km giving an optimistic and conservative DOC share rate.
Use CaseOptimisticConservative
Intra City 4.1 /km 5.7 /km
Airport Shuttle 6.1 /km 8.5 /km
Regional 1.0 /km 1.4 /km
Disclaimer/Publisher’s Note: The statements, opinions and data contained in all publications are solely those of the individual author(s) and contributor(s) and not of MDPI and/or the editor(s). MDPI and/or the editor(s) disclaim responsibility for any injury to people or property resulting from any ideas, methods, instructions or products referred to in the content.

