Communication

Evaluating Thermal and Color Sensors for Automating Detection of Penguins and Pinnipeds in Images Collected with an Unoccupied Aerial System

by
Jefferson T. Hinke
*,
Louise M. Giuseffi
,
Victoria R. Hermanson
,
Samuel M. Woodman
and
Douglas J. Krause
Antarctic Ecosystem Research Division, Southwest Fisheries Science Center, National Marine Fisheries Service, National Oceanic and Atmospheric Administration, La Jolla, CA 92037, USA
*
Author to whom correspondence should be addressed.
Drones 2022, 6(9), 255; https://doi.org/10.3390/drones6090255
Submission received: 28 June 2022 / Revised: 19 August 2022 / Accepted: 14 September 2022 / Published: 15 September 2022
(This article belongs to the Special Issue UAV Design and Applications in Antarctic Research)

Abstract

:
Estimating seabird and pinniped abundance is central to wildlife management and ecosystem monitoring in Antarctica. Unoccupied aerial systems (UAS) can collect images to support monitoring, but manual image analysis is often impractical. Automating target detection using deep learning techniques may improve data acquisition, but different image sensors may affect target detectability and model performance. We compared the performance of automated detection models based on infrared (IR) or color (RGB) images and tested whether IR images, or training data that included annotations of non-target features, improved model performance. For this assessment, we collected paired IR and RGB images of nesting penguins (Pygoscelis spp.) and aggregations of Antarctic fur seals (Arctocephalus gazella) with a small UAS at Cape Shirreff, Livingston Island (60.79 °W, 62.46 °S). We trained seven independent classification models using the Video and Image Analytics for Marine Environments (VIAME) software and created an open-access R tool, vvipr, to standardize the assessment of VIAME-based model performance. We found that the IR images and the addition of non-target annotations had no clear benefits for model performance given the available data. Nonetheless, the generally high performance of the penguin models provided encouraging results for further improving automated image analysis from UAS surveys.

1. Introduction

Estimating the abundance of land-based breeding aggregations of seabirds and pinnipeds is a key part of population monitoring and marine resource management efforts [1]. However, remote locations of breeding colonies, inaccessible or hazardous beach landings, and narrow periods of time for conducting standardized counts of adults or offspring can constrain the collection of census data using traditional ground-based counting techniques. Additionally, large aggregations can complicate manual counts and may require extended visitation at breeding locations to achieve reliable estimates. One alternative to manual ground counts is the use of small, unoccupied aerial systems (UAS) that can systematically survey breeding aggregations using airborne cameras.
Advances in UAS technology [2,3,4] have facilitated the development of safe, reliable platforms for research [5], particularly in polar environments [6]. Moreover, surveys conducted with small UAS can offer relatively low-disturbance methods [7] for quickly obtaining full photographic coverage of large breeding colonies in remote and inaccessible areas [8,9]. However, with the use of UAS, the burden of analysis shifts from on-site counting efforts to the review and annotation of images. The cryptic nature of pinnipeds and seabirds in polar areas and the high-contrast environment (e.g., bright snow or ice on dark substrates) can introduce uncertainty when identifying species or life stages from photographs. Additionally, UAS images collected at the scales necessary to count large, often dispersed breeding aggregations can create large data streams that are unmanageable for manual image analysis. Moreover, a manual process of identifying and counting individuals or species within photographs can be difficult to replicate across multiple observers. Automated image analysis is therefore appealing as it can provide a structured and replicable process to advance the use of small UAS aerial surveys for rapid census work.
The development of machine learning (ML) algorithms, particularly deep learning classification models that are rooted in convolutional neural networks [10], provides accessible opportunities to automate image analysis in support of UAS-based predator monitoring. Prior efforts to develop automated methods for the detection of penguins and pinnipeds in polar settings from aerial surveys have yielded varying degrees of success [11,12]. However, continual improvement in automated image classification algorithms [13], development of open-access tools that support a broader implementation of machine learning techniques [14,15], and the expanding use of automated and semi-automated methods to detect and classify a wide range of organisms in aerial images [16,17,18] support further exploration.
A key factor affecting the utility of UAS-derived images for animal detection is the choice of sensor used to image targets. The utility of traditional color (RGB) imagery can depend on light levels, contrast of targets with background substrate (e.g., ice, snow, rock, vegetation), and shadows that may mask targets. Alternatively, infrared (IR) thermal imaging may improve the detection of warm targets against colder backgrounds irrespective of light levels, potentially reducing image complexity and improving target detectability [17,19,20,21,22]. For example, Hyun et al. [22] report that thermal sensors were advantageous for detecting large elephant seals in a maritime Antarctic setting. To assess the benefits of IR images relative to RGB images for automating the detection of smaller Antarctic organisms, we used a single camera with integrated IR and RGB sensors. The paired images facilitate the direct comparison of the different spectra for automating animal detection in the northern Antarctic Peninsula, where targets may occur on substrates that include snow, ice, water, rock, cobble, guano, moss, and grasses.
Here, we evaluate IR and RGB sensors for using deep learning convolutional neural networks (CNN) to automate the detection of target penguins (Pygoscelis spp.) and Antarctic fur seals (Arctocephalus gazella) in images collected by a small UAS. Such direct comparisons of sensor types for use in developing automated detection algorithms is, to our knowledge, not commonly considered in UAS applications. We used the Video and Image Analytics for Marine Environments software (VIAME v0.16.1; https://www.viametoolkit.org, accessed on 8 September 2021), a publicly available computer vision application for building and deploying image analysis tools [15,23], to build separate detection models from paired IR and RGB images. We ask specifically whether models developed from IR images performed better than models from corresponding RGB images. Finally, we introduce a method to assess model performance with a custom R [24] package, vvipr (Verify VIAME predictions v0.3.2; https://github.com/us-amlr/vvipr; accessed on 14 September 2022), that allows users to adjust thresholds for identifying valid model predictions, visualize the overlaps of model predictions and truth (expert) annotations, and rapidly calculate aggregate model performance metrics using a standardized, repeatable process. We developed vvipr as a GUI-based web application with the R package shiny [25] to make it accessible to non-R users. We describe the core functionalities of vvipr here.

2. Materials and Methods

2.1. Aerial Surveys

We conducted aerial surveys at Cape Shirreff, Livingston Island, Antarctica (60.79 °W, 62.46 °S) during the 2019–2020 austral summer. Aerial surveys were flown over breeding aggregations of chinstrap (Pygoscelis antarcticus) and gentoo (P. papua) penguins in December 2019 and over aggregations of Antarctic fur seals consisting of pups (<3 months old) and non-pups (≥1 year old) at Cape Shirreff and the neighboring San Telmo Islands in December 2019 and February 2020. All aerial surveys occurred under the Marine Mammal Protection Act Permit No. 20599 granted by the Office of Protected Resources/National Marine Fisheries Service, the Antarctic Conservation Act Permit No. 2017-012, NMFS-SWFSC Institutional Animal Care and Use Committee Permit No. SWPI 2017-03, and all domestic and international UAS flight regulations.
We flew an APH-28 hexacopter (Aerial Imaging Solutions, LLC, Old Lyme, CT, USA) for all surveys and used a bespoke ground station that receives real-time flight information and video data from the aircraft. The APH-28 weighs 1.6 kg, can be powered by up to three batteries (6-cell 440 mAmp lithium-polymer), and has a payload capacity of 1.8 kg with an estimated flight endurance of 30 min. We used the FLIR Duo Pro R camera system (Teledyne FLIR LLC., Wilsonville, OR, USA) as payload to image the animal aggregations. The camera system contains independent thermal (IR, 0.33 megapixel) and color (RGB, 6 megapixel) sensors that, upon triggering, capture simultaneous IR and RGB images of the same target area. We used this integrated camera system to enable direct comparisons of models developed from the different sensors.
We conducted visual-line-of-sight aerial surveys, flying between 30 and 90 m above ground level (AGL). Survey grids for each flight covered target aggregations of animals and the camera triggered when the aircraft paused at each waypoint.

2.2. Image Sets for Analysis

From all images collected during the flights, we selected a subset of images that met three criteria. First, we selected only IR and RGB images that contained targets (penguins or fur seals). Second, we retained only the pairs of IR and RGB images that exhibited minimal blurring from sensor movement or aircraft vibrations. Although blurring occurs normally in UAS aerial survey work, the extent of blurring in much of the IR imagery was atypical and unfit for model training (Figure S1). Third, we rejected IR and RGB pairs if the images contained individuals present in previously selected images (i.e., overlapping images). In this way, we sought to ensure each image pair represented a unique set of in-focus individuals for model training and testing. Extensive blurring of poorly resolved targets resulted in the rejection of most images obtained during the survey flights. In total, we retained 20 image pairs containing penguins and, initially, 23 image pairs containing fur seals. Upon annotation, we discarded two images from the fur seal IR analysis due to inconsistent blurring of individuals but retained the corresponding RGB images for the RGB analysis (Table 1).

2.3. Image Annotation

We manually annotated each image set with the annotation tools provided in the desktop version of VIAME software (version 0.16.1) or in the online instance of VIAME-Web (https://viame/kitware.com/, accessed on 1 November 2021). We used rectangular bounding boxes to identify target classes, centering the bounding box on the target and extending the edges to surround all visible features of the target. For the penguin model, we could not distinguish chinstrap and gentoo penguins in the IR images, so we simply annotated individuals as generic ‘penguins’ for all analyses. For the fur seal model, we identified individuals as pups or non-pups based on the relative size of imaged targets (all images) and coloration (RGB images only).
In addition to the target classes for detection, we also included annotations of non-target features to test whether the additional information might help constrain the detection of penguin or fur seal targets. These non-target features included rocks, abandoned nests, guano stains, or other identifiable objects in the images that shared visual characteristics of the target classes. For example, in the penguin image set, we added non-target annotations for 212 “warm” and 172 “cold” background areas in the IR images and, correspondingly, 276 “light” and 296 “dark” background features in the RGB images. For the fur seal image set, we included 42 annotations of an “other” class that identified non-targets with visual characteristics similar to fur seal pup targets in the RGB imagery only. The image annotations thus define seven classification models that we trained and tested (Table 2) to compare model performance.

2.4. Model Training and Testing

We randomly split the collection of paired IR and RGB images into two image sets for independent model training and model testing. For penguins, we set aside 70% of the images for training and 30% for model testing (Table 1). Due to the reduced number of targets in the fur seal images relative to the penguin images, we assigned at least 80% of the fur seal images to the training set (Table 1).
Using the training images and annotation sets (Table 2), we trained seven independent classification models based on the YOLOv3 CNN model [13] as implemented in its default configuration in VIAME v0.16.1 [15,23]. The default YOLOv3 model was trained originally on the COCO dataset [26]. The use of the YOLOv3 model is consistent with prior work to automate detection of other organisms [17,21]. Note that the IR images are single-channel 8-bit images, whereas the RGB images are 3-channel 24-bit images. The implementation of YOLOv3 in VIAME typically requires a 3-channel input images. However, the model automatically replicates the single-channel IR image to achieve the necessary 3-channel input without material change to the information available for model training. Once trained, we confronted each model with its corresponding set of novel test images (Table 1) to generate predictions for each target class. The predictions provide a bounding box to identify the location of the target, a label to identify the class of the target, and a confidence level on the prediction ranging from 0 to 1. The confidence level represents an estimate of the degree to which a prediction differs from the target class (i.e., it is not a probability of correct identification).

2.5. Model Evaluation

We used vvipr to evaluate the performance of each model by comparing the model predictions on the test images (Table 2) to the corresponding truth annotations for the test images. The method of vvipr is chiefly concerned with identifying false positives (FP) in the model predictions, from which counts of false negatives (FN) and true positives (TP) can be estimated, given known counts of truth annotations and total model detections, using the ‘uniroot’ optimization [27] in R [24]. From the total counts of FP, FN, and TP, we computed five standard performance metrics to characterize aggregate model performance: accuracy, precision, recall, F1, and mean average precision (mAP) of each model. The performance metrics are defined as:
A c c u r a c y = T P T P + F P + F N
P r e c i s i o n = T P T P + F P
R e c a l l = T P T P + F N
F 1 = T P T P + 0.5 F P + F N
m A P = 1 N i = 1 N A v e r a g e   P r e c i s i o n i
Accuracy represents the ratio of the number of correct predictions relative to the total number of observations. Precision represents the ratio of the number of correct predictions relative to the total number of predictions. Recall represents the ratio of the number of correct predictions relative to the total number of possible correct predictions. The F1 score is a weighted average of Precision and Recall. These four metrics represent aggregate measures of model performance for all target classes and are based on the model evaluation thresholds identified by a sensitivity analysis (see below). The mAP represents the mean of the class-specific average precision that is calculated over a range (e.g., 10% to 90%) of overlap thresholds.
When assessed together, this suite of metrics provides a useful benchmark to assess model performance. We used a benchmark value of 0.9 as a target performance goal. This benchmark is an arbitrary choice, representing a threshold that is lower than the traditional 5% error for manual counts of individual nests in a colony of Antarctic seabirds [28] but similar to the model performance achieved in another application of automated classification of penguins from UAS images [11].
The evaluation of the models for Accuracy, Precision, Recall, and 
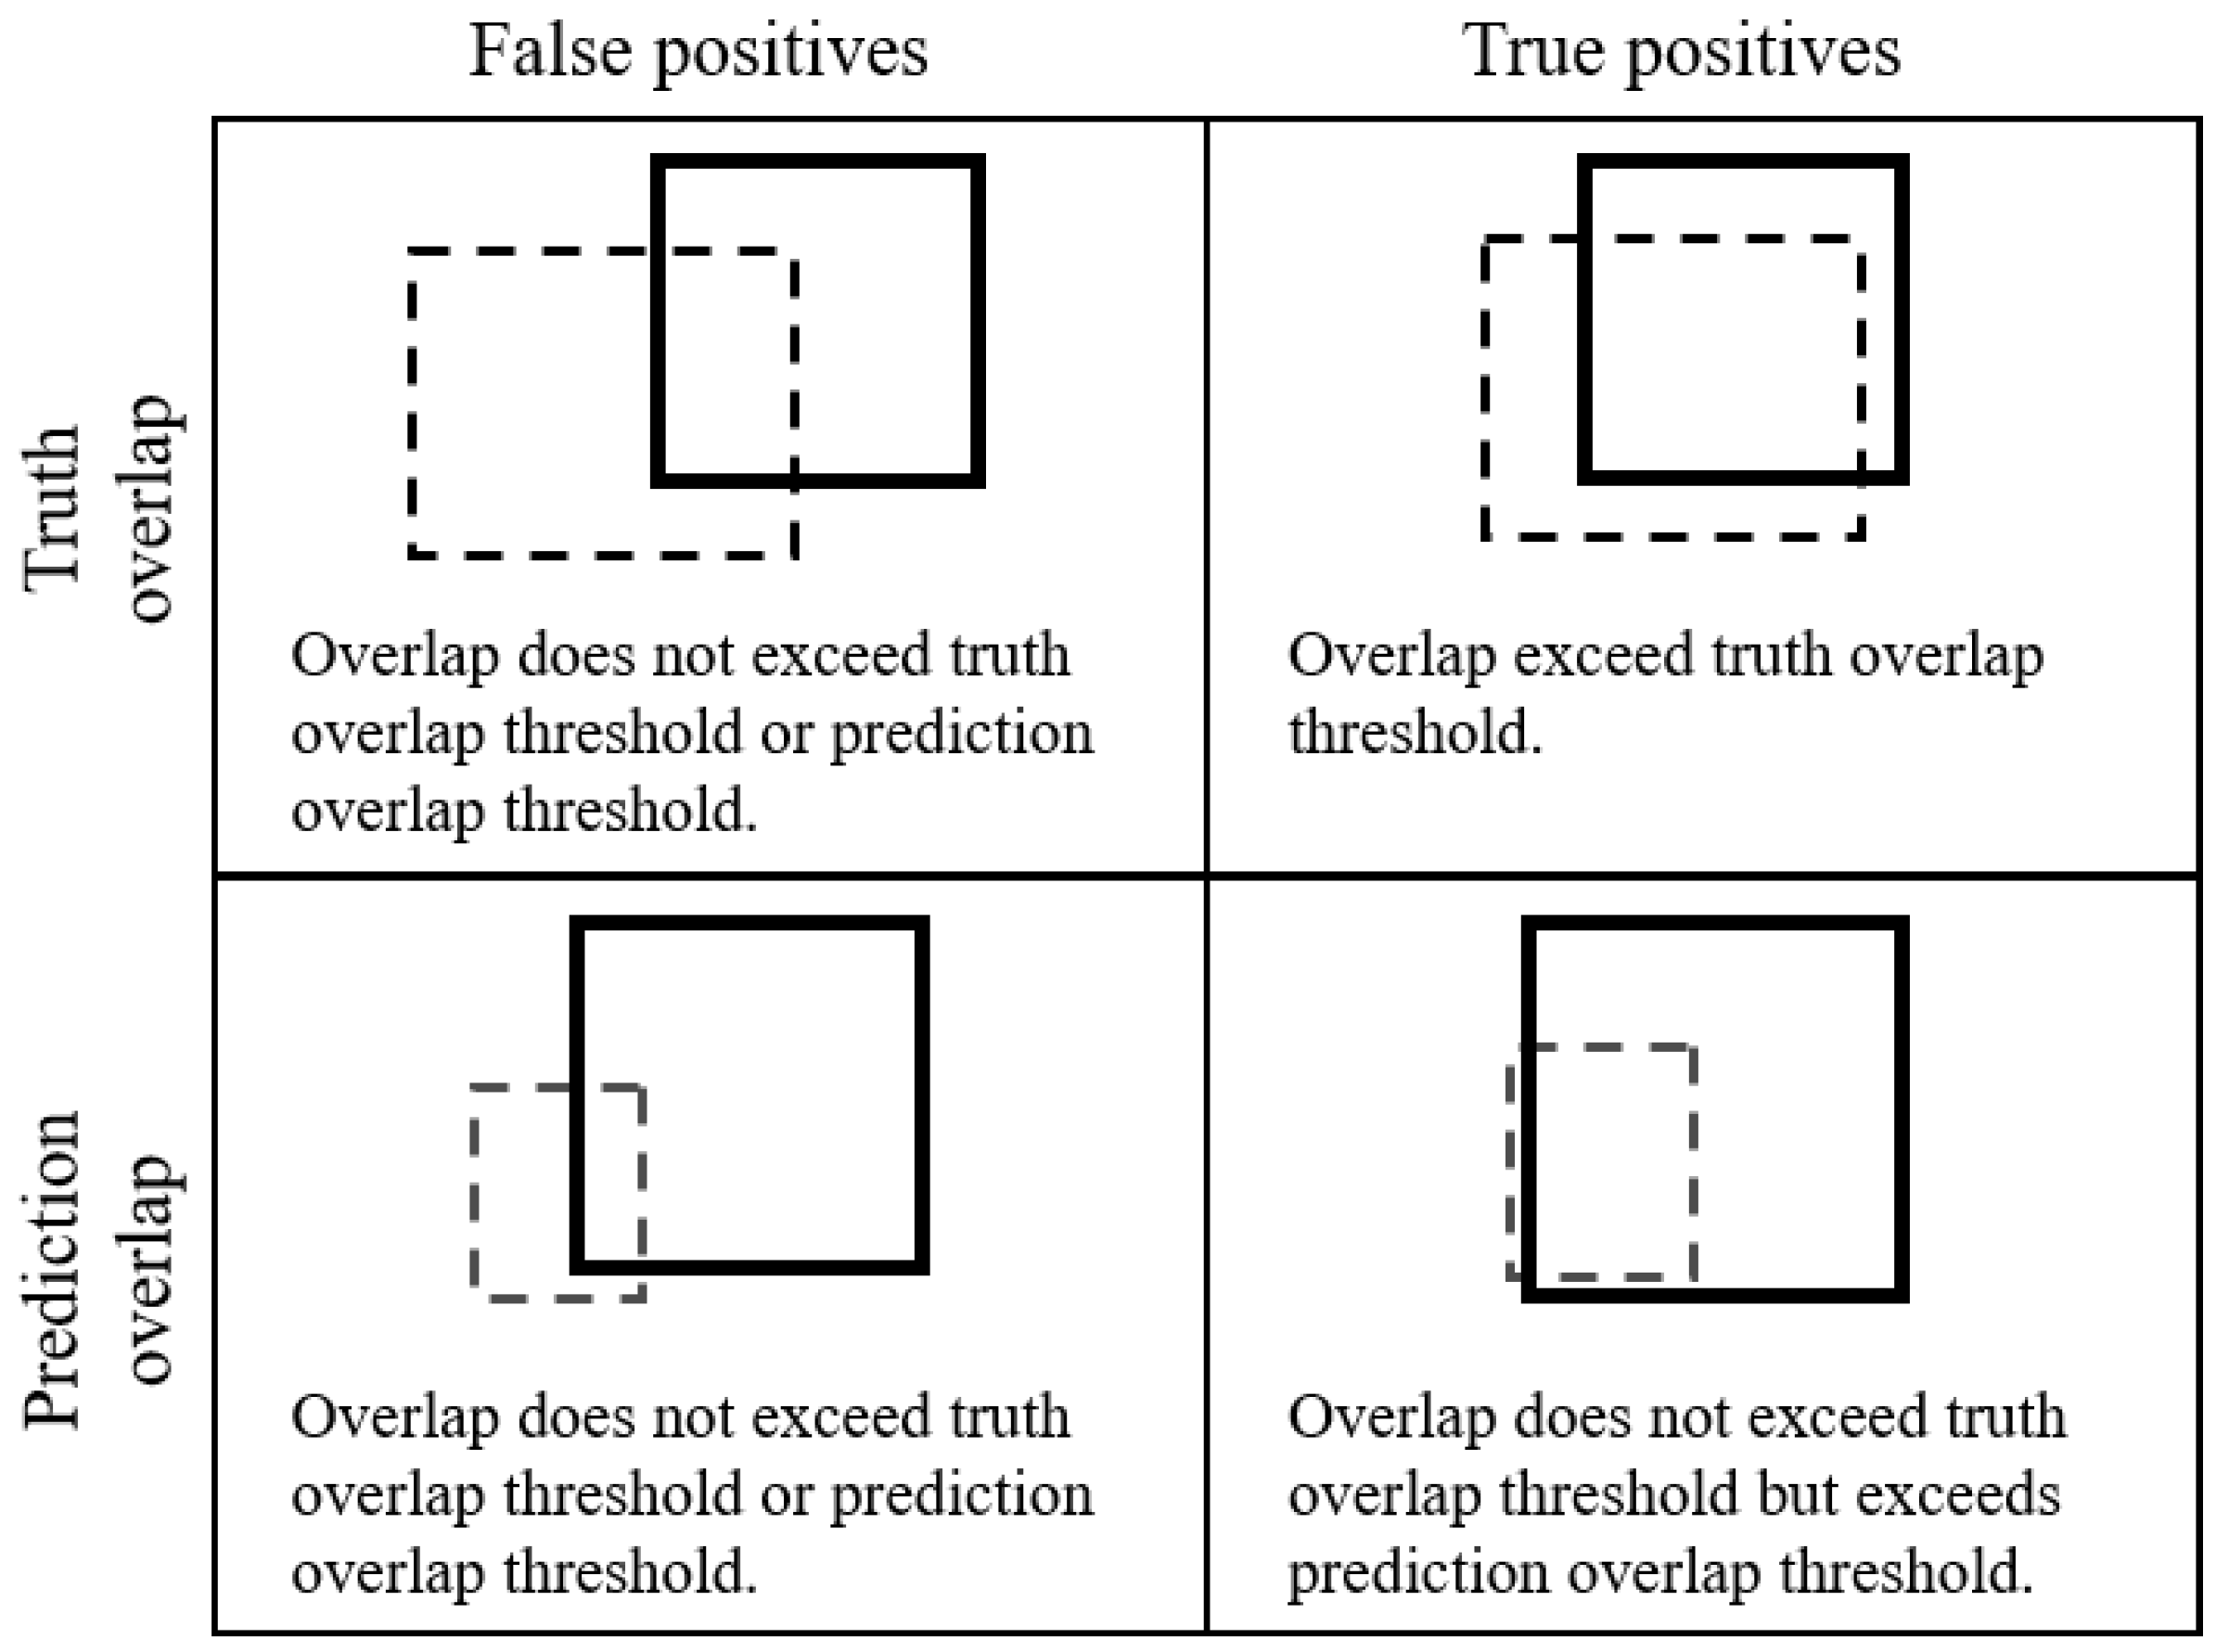
F1 required the selection of appropriate confidence and overlap thresholds for accepting predictions as correct. These thresholds are implemented in vvipr as (1) the confidence threshold for initial filtering of model predictions; (2) the minimum proportion of the geometric area of a truth annotation that is overlapped by a prediction (truth overlap); and (3) the minimum proportion of the geometric area of the prediction that overlaps a truth annotation (prediction overlap). The confidence threshold optionally filters out low-confidence predictions prior to analysis. The “truth overlap” parameter optionally requires that the prediction overlaps the area of the truth annotation to the degree specified. The “prediction overlap” optionally allows for the retention of predictions in special cases where the total area of the prediction is small relative to the area of the truth annotation but overlaps the truth annotation to the degree specified. Figure 1 illustrates schematically how the overlap of predictions and truth annotations can vary and how vvipr treats such overlaps (Figure 1).
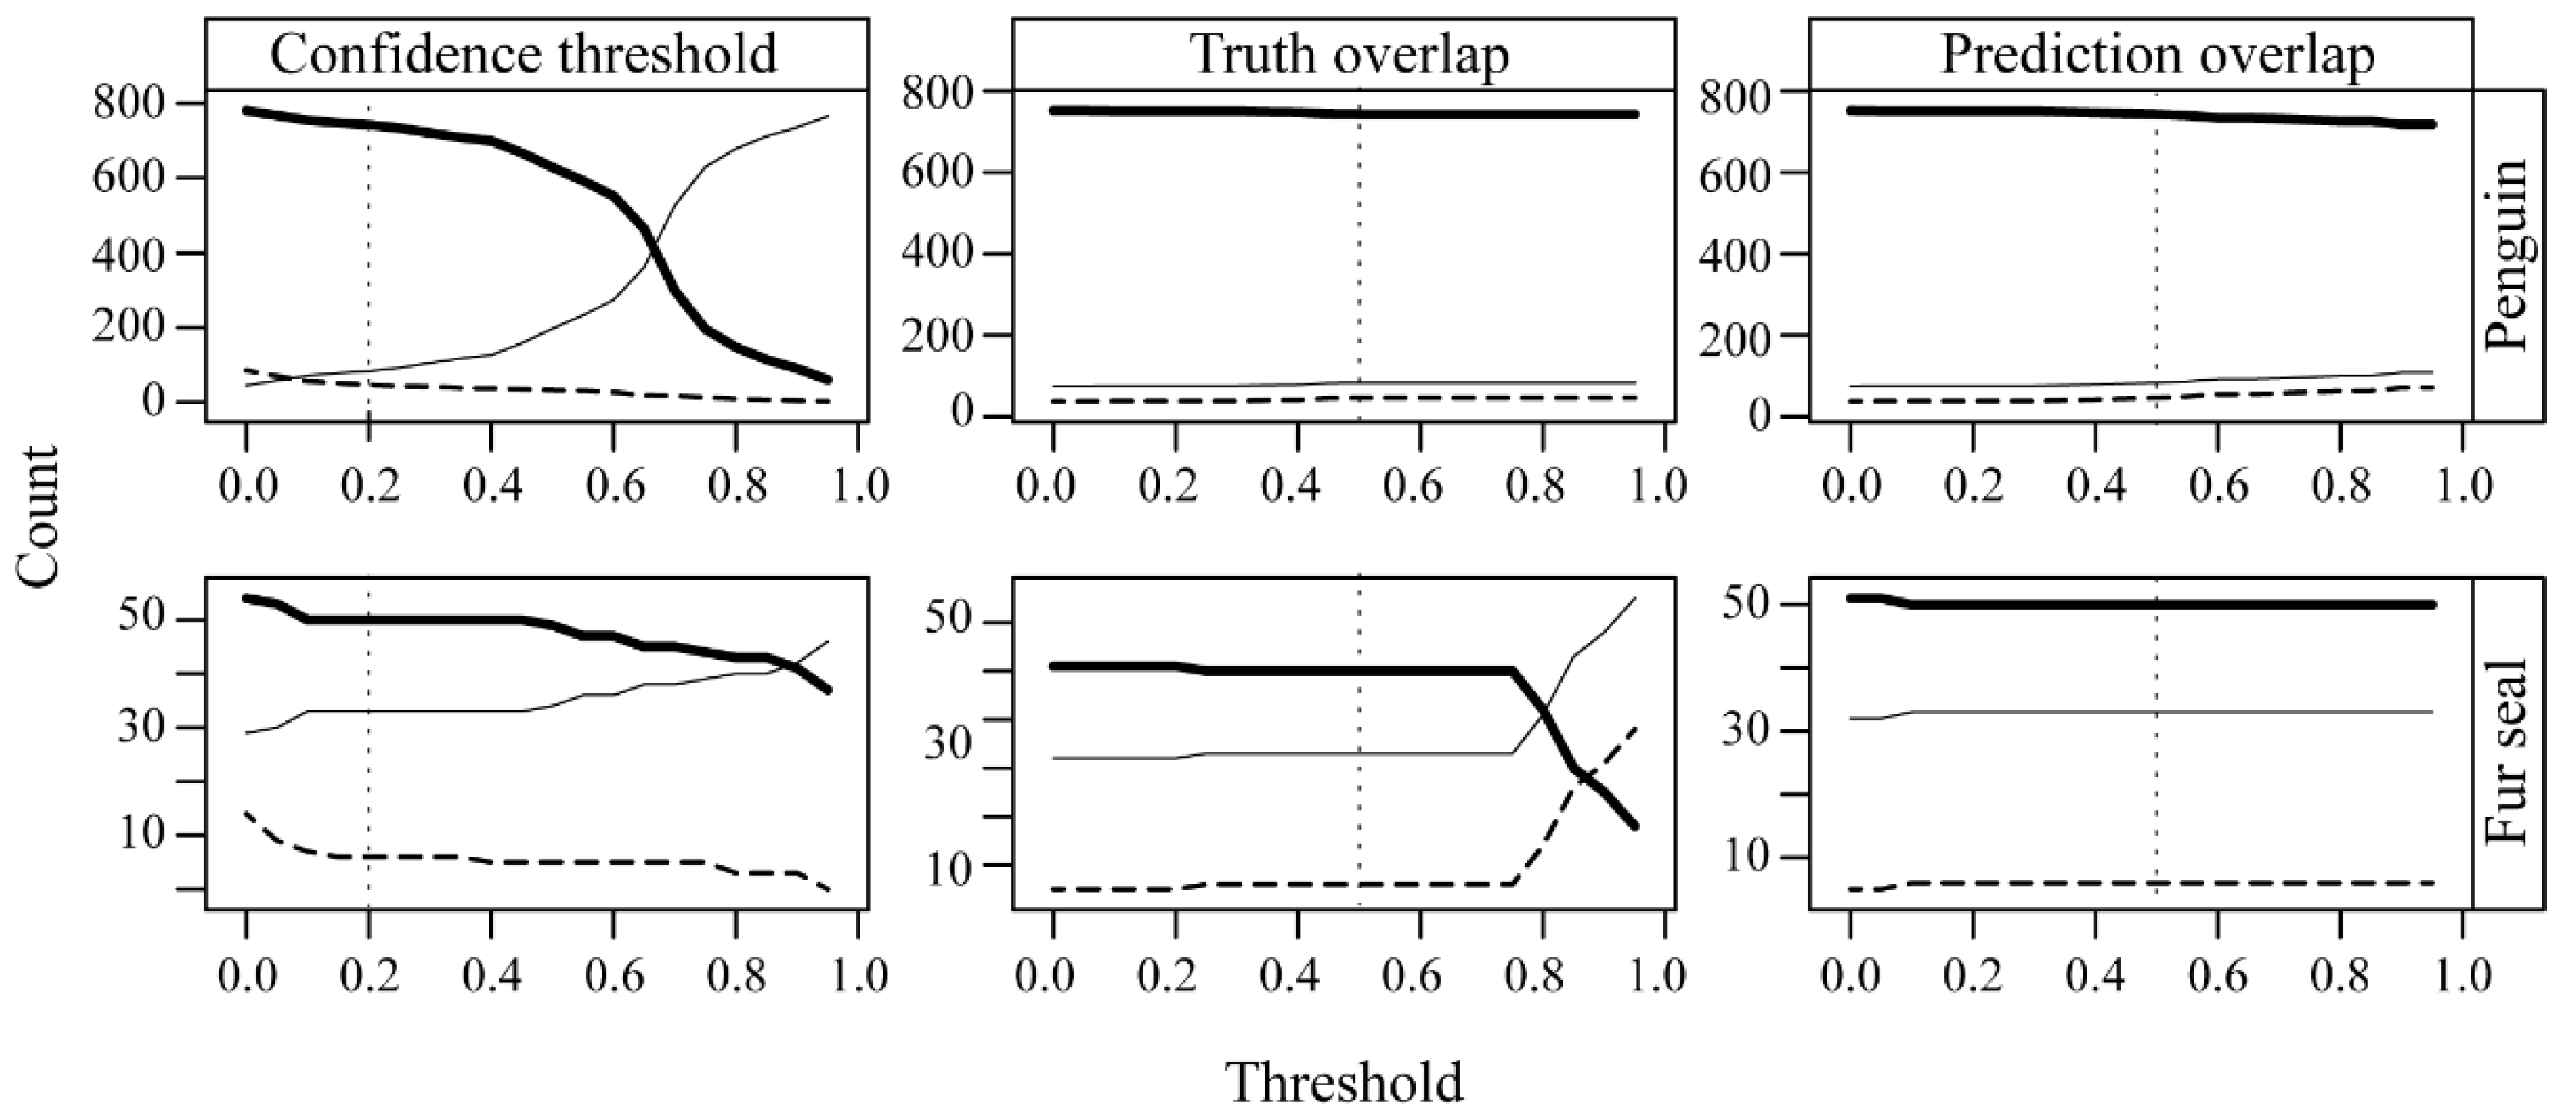
Appropriate thresholds for the confidence level, truth overlap level, and prediction overlap level for this data set required justification. We therefore conducted a sensitivity analysis to assess how the counts of FP, FN, and TP varied across the range of potential confidence threshold, truth overlap, and prediction overlap values to identify inputs for analysis.

3. Results

3.1. Sensitivity Analysis

Across the range of confidence thresholds, results from the penguin and fur seal models suggested that a confidence limit of 0.2 was appropriate for rejecting many low-confidence false positives while having relatively lower effects on the counts of true positives and false negatives (Figure 2). The sensitivity analysis suggested a truth overlap of 0.5 provided a reasonable threshold for the penguin and fur seals models (Figure 2). A level of 0.5 avoided inflated model performance when low-overlap conditions are accepted (i.e., increases in TP when low-overlap conditions are allowed) and avoids reduced model performance when high-overlap conditions are rejected (relatively large decrease in TP when high-overlap conditions are required). Similarly, the sensitivity analysis suggested that a prediction overlap of 0.5 also provided a reasonable threshold for the penguin and fur seal models. A prediction overlap of 0.5 represents a balance between inflated scores when the threshold is low and reduced model performance caused by the rejection of predictions if the threshold is too high. We therefore present results based on a confidence threshold of 0.2, a truth overlap threshold of 0.5, and a prediction overlap threshold of 0.5.

3.2. Model Performance

The seven different models yielded varying degrees of successful detection of penguins, fur seal pups, or non-pups in the test images (Table 3, Figure 3). Generally, the penguin models exhibited high Precision (Table 3), indicative of well-constrained model predictions with a low false positive rate. However, the Accuracy of the penguin models fell below our target threshold (0.9), largely due to a higher rate of false negatives in model predictions (Figure 3a). The fur seal models performed more poorly. In particular, the rate of false positives was 2–3× higher in the seal models than in the penguin models, whereas the rate of false negatives exceeded 32% of all predictions in seal models (Table 3). In the seal IR model, most fur seal pups were not detected (e.g., Figure 3b), leading to the lowest mAP among the suite of models (Table 3). Relative to pups, the fur seal models exhibited better detection of non-pup targets, leading to higher true positive rates and relatively low false positive rates (Figure 3c).
In general, performance metrics for the penguin models exceeded those from the fur seal models (Table 3). We attribute this difference to the reduced number of annotations available to train a robust model for detecting fur seals. Furthermore, the results suggest that the multi-class models that included annotations for non-target elements provided no consistent improvement in the performance of the different models.
Among the penguin models, models based on IR images generally performed better, but not in all performance metrics (Table 3). For example, among the penguin models, Precision was marginally higher in the RGB models, but all other metrics were higher in the IR models. Furthermore, all penguin models exhibited scores that met or exceeded our initial target performance goal of 0.9 despite relatively small training sets. For the fur seal models, no model achieved the target performance goal, and no IR or RGB model provided a clear advantage. Overall, the general similarity of IR and RGB models for both penguins and seals suggests no clear benefit of IR images relative to RGB image for building simple detection models for penguins and seals.

4. Discussion

Despite small sample sizes for annotation and model training, we successfully trained automated image analysis algorithms to detect and classify penguin and pinniped targets from IR and RGB images. Although general detectors based on convolutional neural networks often require tens of thousands of annotations to train [29], successful animal detection models have been developed from pre-trained CNN models using several hundreds of annotations [11,17,18], consistent with our sample sizes. Nonetheless, due to the limited availability of training data from our UAS flights, we caution that the models remain inadequate for implementing colony-wide censuses. However, the models are adequate to evaluate the potential benefits of IR images relative to RGB images for automating detection of penguins and fur seals in aerial imagery collected by UAS. We concluded that the available IR and RGB images provided generally equivalent information for automating the detection of penguins and fur seals. We also determined that the annotation of non-target features provided no clear advantage for the detection and correct classification of target classes in the trained models.
We expected that an IR sensor would allow for improved model performance for detecting and classifying penguin and pinniped targets relative to models using a traditional RGB sensor. A prior demonstration with high-accuracy detections of pinnipeds based on IR sensors [16] and the expectation of a relatively strong contrast of warm targets against a cold polar substrate [22] support this expectation. However, the nature of the physical environment, the size of targets, and the capability of the sensor itself appear to have limited its utility in this study. For example, thermal sensors have shown promise for accurate target detections in applications where vegetation or darkness obscures animals [30] or with relatively large targets [16,22]. However, in our study colonies, vegetation and daylight during the summer breeding season do not preclude visual detections. Moreover, the lower resolution of the IR sensor relative to the RGB sensor resulted in greater blurring and reduced our ability to differentiate species and life stages, particularly for small-bodied penguins that present an area ≈0.07 m2 when prone. The combination of these limitations precluded the identification of a clear advantage of one sensor over the other for use in automating target detection in this study.
We note that the major constraint on model training in this study was the poor image quality from the IR sensor that severely limited sample sizes. The reasons for reduced image quality are unclear but may have resulted from unanticipated interactions between the APH-28 platform, the IR sensor, and the cold and windy local environmental conditions that ultimately resulted in image blur. Though it is not our intent to review the performance of the IR sensor, we note that other IR sensors [16] do not appear to have limited detectability of targets in other applications. Despite the fact that thermal cameras remain a viable and important option for further testing, traditional RGB sensors provide an effective option for future efforts to operationalize automated image analysis pipelines. Namely, the generally higher resolution to resolve small targets, wider commercial availability for proper mating with rapidly changing UAS platforms, and intuitiveness of traditional RGB sensors and their outputs are tangible advantages to consider.
The results from our experimental approach to compare models based on target-only annotations with models that included additional, non-target annotations suggested no strong difference in model performance. We expected that the addition of non-target annotations would constrain the detection of target classes and improve model performance. Counterintuitively, the addition of non-target classes in our annotations generally led to models with similar or reduced performance. This negative result suggests a potentially time-saving step for analyses, where the annotation of non-target classes may be avoided, provided target annotations are complete.
Finally, we note that verifying model predictions and assessing model performance represents a key step in developing automated workflows. Though manual verification of model predictions is possible, it can be cumbersome, time consuming, and difficult (if not impossible) to consistently apply the same set of conditions for analysis, especially across different observers. We developed an R package, vvipr (v0.3.2; https://github.com/us-amlr/vvipr; accessed on 14 September 2022) to increase the transparency and repeatability of the model verification process for VIAME model outputs, while providing flexibility to adjust model performance thresholds as required by different projects. For non-R users, vvipr also includes a stand-alone shiny [25] web application that enables the rapid estimation of model performance and visualization of how each model prediction is evaluated. Standardizing the process for model assessment is especially useful for evaluating multiple competing models to identify candidates for further development or deployment and for assessing appropriate thresholds for identifying true and false positives among the set of predictions. We contend that the iterative process to correctly assign a status of false positive, false negative, or true positive to model predictions vastly benefits from a standard, repeatable process to ensure performance metrics are computed across models consistently.

5. Conclusions

We aimed to compare the efficacy of IR and RGB sensors for use in developing automated classification methods. Our experimental approach helped directly assess the relative strengths of IR versus RGB images for the automation of species detection and classification from aerial drone surveys. In general, the relatively high performance of the penguin models provides encouraging results for implementing machine learning techniques to improve data acquisition from drone surveys of seabirds and pinnipeds in the near future. More specifically, we conclude that the IR images provided no clear advantages for target detection relative to the RGB images. Considering the need to distinguish species and life stages in aerial imagery for accurate population assessments, RGB images appear to offer a greater opportunity for further model development at this time.
Developing a robust automated classification model for deployment on novel images remains an important task. There are several important issues to address in relation to such a development. First, increasing sample sizes relative to those reported here will allow improved model training and validation on a broad suite of field conditions likely encountered during UAS surveys. Second, similar to the comparison of sensor types reported here, a comparison of machine learning approaches (e.g., YOLO [13], Faster R-CNN [31], Mask R-CNN [32], and fuzzy decision trees [33]) will be useful for identifying tradeoffs among alternative models. Fortunately, several object detector algorithms are implemented within VIAME to facilitate such exploration [15]. Finally, we note that multi-spectral sensors are increasingly available for use in small UAS applications [34]. Harnessing additional information from such sensors may improve the utility of imagery for automating classification beyond simple RGB or IR images alone.

Supplementary Materials

The following supporting information can be downloaded at: https://www.mdpi.com/article/10.3390/drones6090255/s1. Figure S1: Example image from thermal (IR) sensor with blurring for Antarctic fur seals and penguins. Figure S2: Schematic of image analysis process from annotation of raw images through to model assessment using the vvipr tool. The information and data can be downloaded from Zenodo at https://doi.org/10.5281/zenodo.6714100 (accessed on 14 September 2022).

Author Contributions

Conceptualization, D.J.K. and J.T.H.; methodology, J.T.H., D.J.K. and S.M.W.; formal analysis, J.T.H., L.M.G., V.R.H. and D.J.K.; investigation, J.T.H., V.R.H., L.M.G. and D.J.K.; resources, D.J.K. and J.T.H.; data curation, J.T.H., L.M.G., V.R.H. and D.J.K.; software, J.T.H. and S.M.W.; writing—original draft preparation, J.T.H.; writing—review & editing, J.T.H., L.M.G., V.R.H., S.M.W. and D.J.K.; visualization, J.T.H.; project administration, D.J.K.; funding acquisition, D.J.K. and J.T.H. All authors have read and agreed to the published version of the manuscript.

Funding

This research was funded by the National Oceanic and Atmospheric Administration, Oceanic and Atmospheric Research, Uncrewed Systems Research Transition Office, grant # 2019-01.

Data Availability Statement

Raw images, annotations, and vvipr code (v0.3.2) are available with the following https://doi.org/10.5281/zenodo.6714100 (accessed on 14 September 2022).

Acknowledgments

We thank B. Jaime and G. Watters for their constructive review of an earlier draft. We thank D. LeRoi for integrating the aircraft and FLIR payload and technical support. We thank G. Cutter and M. Dawkins for their help with model development. We thank Lt. Cmdr. A. Reynaga, A. Fox, S. Walden, L. Brazier, and C. Kroeger for their assistance in the field. Reference to any specific commercial products, process, or service by trade name, trademark, manufacturer, or otherwise, does not constitute or imply its recommendation or favoring by the United States Government or NOAA/National Marine Fisheries Service.

Conflicts of Interest

The authors declare no conflict of interest.

References

  1. Boyd, I.; Wanless, S.; Camphuysen, C.J. Top Predators in Marine Ecosystems: Their Role in Monitoring and Management; Cambridge University Press: Cambridge, UK, 2006. [Google Scholar]
  2. Watts, A.C.; Perry, J.H.; Smith, S.E.; Burgess, M.A.; Wilkinson, B.E.; Szantoi, Z.; Ifju, P.G.; Percival, H.F. Small unmanned aircraft systems for low-altitude aerial surveys. J. Wildl. Manag. 2010, 74, 1614–1619. [Google Scholar] [CrossRef]
  3. Whitehead, K.; Hugenholtz, C.H.; Myshak, S.; Brown, O.; LeClair, A.; Tamminga, A.; Barchyn, T.E.; Moorman, B.; Eaton, B. Remote sensing of the environment with small unmanned aircraft systems (UASs), part 2: Scientific and commercial applications. J. Unmanned Veh. Syst. 2014, 2, 86–102. [Google Scholar] [CrossRef]
  4. Linchant, J.; Lisein, J.; Semeki, J.; Lejeune, P.; Vermeulen, C. Are unmanned aircraft systems (UASs) the future of wildlife monitoring? A review of accomplishments and challenges. Mammal Rev. 2015, 45, 239–252. [Google Scholar] [CrossRef]
  5. Johnston, D.W. Unoccupied aerial systems in marine science and conservation. Ann. Rev. Mar. Sci. 2019, 11, 439–463. [Google Scholar] [CrossRef] [PubMed]
  6. Goebel, M.E.; Perryman, W.L.; Hinke, J.T.; Krause, D.J.; Hann, N.A.; Gardner, S.; LeRoi, D.J. A small unmanned aerial system for estimating abundance and size of Antarctic predators. Polar Biol. 2015, 38, 619–630. [Google Scholar] [CrossRef]
  7. Krause, D.J.; Hinke, J.T.; Goebel, M.E.; Perryman, W.L. Drones minimize Antarctic predator responses relative to ground survey methods: An appeal for context in policy advice. Front. Mar. Sci. 2021, 8, 648772. [Google Scholar] [CrossRef]
  8. Pfeifer, C.; Barbosa, A.; Mustafa, O.; Peter, H.-U.; Rümmler, M.-C.; Brenning, A. Using fixed-wing UAV for detecting and mapping the distribution and abundance of penguins on the South Shetlands Islands, Antarctica. Drones 2019, 3, 39. [Google Scholar] [CrossRef]
  9. Krause, D.J.; Hinke, J.T. Finally within reach: A drone census of an important, but practically inaccessible, Antarctic fur seal colony. Aquat. Mamm. 2021, 47, 349–354. [Google Scholar] [CrossRef]
  10. He, K.; Zhang, X.; Ren, S.; Sun, J. Deep residual learning for image recognition. In Proceedings of the IEEE Conference on Computer Vision and Pattern Recognition (CVPR), Las Vegas, NV, USA, 27–30 June 2016. [Google Scholar]
  11. Borowicz, A.; McDowall, P.; Youngflesh, C.; Sayre-Mccord, T.; Clucas, G.; Herman, R.; Forrest, S.; Rider, M.; Schwaller, M.; Hart, T.; et al. Multi-modal survey of Adélie penguin mega-colonies reveals the Danger Islands as a seabird hotspot. Sci. Rep. 2018, 8, 3926. [Google Scholar] [CrossRef] [PubMed]
  12. Angliss, R.; Sweeney, K.; Moreland, E.; Hou, B.; Richmond, E.; Khan, C.; Sanderson, B.; Lynn, M.; Martinez, A. A. Report of the Image Processing Workshop. NOAA Tech. Memo. 2020, NMFS-AFSC-408. 77p. Available online: https://repository.library.noaa.gov/view/noaa/26365(accessed on 14 September 2022).
  13. Redmon, J.; Farhadi, A. YOLOv3: An incremental approach. arXiv 2018, arXiv:1804.02767. [Google Scholar] [CrossRef]
  14. Abadi, M.; Agarwal, A.; Barham, P.; Brevdo, E.; Chen, Z.; Citro, C.; Corrado, G.S.; Davis, A.; Dean, J.; Devin, M.; et al. TensorFlow: Large-scale machine learning on heterogeneous distributed systems. arXiv 2016, arXiv:1603.04467. [Google Scholar] [CrossRef]
  15. Dawkins, M.; Sherrill, L.; Fieldhouse, K.; Hoogs, A.; Richards, B.; Zhang, D.; Prasad, L.; Williams, K.; Lauffenburger, N.; Wang, G. An open-source platform for underwater image and video analytics. In Proceedings of the 2017 IEEE Winter Conference on Applications of Computer Vision, Santa Rosa, CA, USA, 24–31 March 2017; pp. 898–906. [Google Scholar]
  16. Seymour, A.C.; Dale, J.; Hammill, M.; Johnston, D.W. Automated detection and enumeration of marine wildlife using unmanned aircraft systems (UAS) and thermal imagery. Sci. Rep. 2017, 7, 45127. [Google Scholar] [CrossRef] [PubMed]
  17. Corcoran, E.; Denman, S.; Hanger, J.; Wilson, B.; Hamilton, G. Automated detection of koalas using low-level aerial surveillance and machine learning. Sci. Rep. 2019, 9, 3208. [Google Scholar] [CrossRef]
  18. Gray, P.C.; Fleishman, A.B.; Klein, D.J.; McKown, M.W.; Bézy, V.S.; Lohmann, K.J.; Johnston, D.W. A convolutional neural network for detecting sea turtles in drone imagery. Methods Ecol. Evol. 2019, 10, 345–355. [Google Scholar] [CrossRef]
  19. Duck, C.; Thompson, D.; Cunningham, L. The status of British common seal populations. Scientific advice on matters related to the management of seal populations. SCOS Brief. Pap. 2003, 3, 47–53. [Google Scholar]
  20. Gooday, O.; Key, N.; Goldstien, S.; Zawar-Reza, P. An assessment of thermal-image acquisition with an unmanned aerial vehicle (UAV) for direct counts of coastal marine mammals ashore. J. Unmanned Veh. Syst. 2018, 6, 100–108. [Google Scholar] [CrossRef]
  21. Santangali, A.; Chen, Y.; Kluen, E.; Chirumamilla, R.; Tiainen, J.; Loehr, J. Integrating drone-borne thermal imaging with artificial intelligence to locate bird nests on agricultural land. Sci. Rep. 2020, 10, 10993. [Google Scholar] [CrossRef] [PubMed]
  22. Hyun, C.-U.; Park, M.; Lee, W.Y. Remotely piloted aircraft system (RPAS)-based wildlife detection: A review and case studies in maritime Antarctica. Animals 2020, 10, 2387. [Google Scholar] [CrossRef] [PubMed]
  23. Richards, B.; Beijbom, O.; Campbell, M.; Clarke, M.; Cutter, G.; Dawkins, M.; Edington, D.; Hart, D.; Hill, H.; Hoogs, A.; et al. Automated analysis of underwater imagery: Accomplishments, products, and vision. NOAA Tech. Memo. 2019, NOAA-TM-NMFS-PIFSC-83. 59 p. Available online: https://doi.org/10.25923/0cwf-47144 (accessed on 14 September 2022).
  24. R Core Team. R: A Language and Environment for Statistical Computing; R Foundation for Statistical Computing: Vienna, Austria, 2020. [Google Scholar]
  25. Chang, W.; Cheng, J.; Allaire, J.; Sievert, C.; Schloerke, B.; Xie, Y.; Allen, J.; McPherson, J.; Dipert, A.; Borges, B. shiny: Web Application Framework for R. R package version 1.7.1. 2021. Available online: https://CRAN.R-project.org/package=shiny (accessed on 5 May 2022).
  26. Lin, T.-Y.; Maire, M.; Belongie, S.; Hays, J.; Perona, P.; Ramanan, D.; Dollár, P.; Zitnick, C.L. Microsoft coco: Common objects in context. In European Conference on Computer Vision; Springer: Berlin/Heidelberg, Germany, 2014; pp. 740–755. [Google Scholar]
  27. Brent, R. Algorithms for Minimization without Derivatives; Prentice-Hall: Englewood Cliffs, NJ, USA, 1973. [Google Scholar]
  28. Lynch, H.J.; Naveen, R.; Fagan, W.F. Censuses of penguin, blue-eyed shag Phalacrocorax atriceps and southern giant petrel Macronectes giganteus populations on the Antarctic Peninsula, 2001–2007. Mar. Ornithol. 2008, 36, 83–97. [Google Scholar]
  29. Szegedy, C.; Toshev, A.; Erhan, D. Deep neural networks for object detection. In Advances in Neural Information Processing Systems 26; 2013; pp. 2553–2561. Available online: https://papers.nips.cc/paper/2013 (accessed on 14 September 2022).
  30. Brunton, E.A.; Leon, J.X.; Burnett, S.C. Evaluating the efficacy and optimal development of thermal infrared and true-color imaging when using drones for monitoring kangaroos. Drones 2020, 4, 20. [Google Scholar] [CrossRef]
  31. Ren, S.; He, K.; Girshick, R.; Sun, J. Faster r-cnn: Towards real-time object detection with region proposal networks. In Advances in Neural Information Processing Systems 28; 2015; pp. 91–99. Available online: https://papers.nips.cc/paper/2015 (accessed on 14 September 2022).
  32. Chen, K.; Wang, J.; Pang, J.; Cao, Y.; Xiong, Y.; Li, X.; Sun, S.; Feng, W.; Liu, Z.; Xu, J.; et al. MMDetection: Open MMLab detection toolbox and benchmark. arXiv 2019, arXiv:1906.07155. [Google Scholar] [CrossRef]
  33. Levashenko, V.; Zaitseva, E.; Puuronen, S. Fuzzy classifier based on fuzzy decision tree. In Proceedings of the EUROCON 2007—The International Conference on “Computer as a Tool”, Warsaw, Poland, 9–12 September 2007; pp. 823–827. [Google Scholar]
  34. Wang, D.; Shao, Q.; Yue, H. Surveying wild animals from satellites, manned aircraft and unmanned aerial systems (UASs): A review. Remote Sens. 2019, 11, 1308. [Google Scholar] [CrossRef] [Green Version]
Figure 1. Examples of assessing a model prediction (dashed lines) against a truth annotation (solid line) based on the extent of overlap specified by the truth and prediction overlap parameters. In this example, consider a truth overlap value of 0.5 and prediction overlap value of 0.5. The assessment first considered the truth overlap threshold, and then the prediction overlap threshold. If either the truth or the prediction thresholds are exceeded, the prediction is retained as a true positive. The general flow of this process is depicted schematically in supplemental Figure S2.
Drones 06 00255 g001
Figure 2. Counts of false positives (dashed lines), false negatives (thin lines), and true positives (thick lines) as a function of confidence threshold (left column), truth overlap (middle column), and prediction overlap (right column) parameters for the penguin (top row) and fur seals (bottom row) data. Data displayed here represent results from the Peng_IR_TC and Seal_IR_TC models. For illustration, we allowed one parameter to vary, whereas the other two remained fixed. Fixed values for the respective panels were set at 0.2 (confidence threshold), 0.5 (truth overlap), and 0.5 (prediction overlap). Vertical dotted lines highlight the thresholds used for analysis of all model predictions.
Drones 06 00255 g002
Figure 3. Examples of predication and annotation overlap for (a) penguins in the Peng_IR_MC model where most truth annotations are entirely overlapped by predictions, indicating good model performance; (b) pups in the Seal_IR_TC model, where model predictions rarely overlap truth annotations, indicating poor model performance; and (c) non-pups in the the Seal_RGB_TC model, where predications and truth annotations overlap in some areas, but not consistently throughout the image. The upper row shows the annotations split as true and false positives over truth annotations, and the lower panel shows the truth and predicted annotations overlaid on the corresponding images.
Drones 06 00255 g003
Table 1. Total number of images and individual animal targets in the penguin and fur seal annotations. Differences in the number of targets between thermal (IR) and color (RGB) images reflect differences in the ability to manually identify targets, differences in the spatial footprint of the respective image types (RGB images often had a slightly larger footprint, hence more individuals), or differences in the number of images used.
IRRGB
TargetImage SetN PhotosN TargetsN PhotosN Targets
PenguinTraining141686141880
Test68266955
Fur sealTraining1722819517
Test4834139
Table 2. Seven annotation sets for model training and testing of automated image classification models. The model names identify the animal, image type, and the presence of only target classes (TC) or multiple classes (MC) of target and non-target classes in the annotations.
TargetImage TypeDescriptionModel Name
PenguinIRpenguin onlyPeng_IR_TC
IRpenguin + 2 non-target classesPeng_IR_MC
RGBpenguin onlyPeng_RGB_TC
RGBpenguin + 2 non-target classesPeng_RGB_MC
Fur sealIR2 fur seal classes onlySeal_IR_TC
RGB2 fur seal classes onlySeal_RGB_TC
RGB2 fur seal classes + 1 non target classSeal_RGB_MC
Table 3. Aggregate counts of false positives (FP), false negatives (FN), true positives (TP), and derived performance metrics for the seven models trained and tested from thermal (IR) and color (RGB) images. Accuracy, Precision, Recall, and F1 scores are calculated using the thresholds identified in Figure 2. Mean average precision (mAP) scores for each model represent the mean average precision across the range of ‘truth overlap’ thresholds (10–90%) for each target class. Model names are defined in Table 2. Bold text identifies the model metrics exceeding 0.9.
ModelFPFNTPAccuracyPrecisionRecallF1mAP
Peng_IR_MC48707560.860.940.920.930.78
Peng_IR_TC51887380.840.940.890.910.79
Peng_RGB_TC351667890.800.960.830.890.70
Peng_RGB_MC342187370.750.960.770.850.74
Seal_RGB_TC1952870.550.820.630.710.60
Seal_IR_TC835480.530.860.580.690.48
Seal_RGB_MC1675730.450.820.490.620.74
Publisher’s Note: MDPI stays neutral with regard to jurisdictional claims in published maps and institutional affiliations.

