Abstract
Applications of drones have increased significantly in the past decade for both indoor and outdoor operations. In order to assist autonomous drone navigation, there are numerous sensors installed onboard the vehicles. These include Global Navigation Satellite Systems (GNSS) chipsets, inertial sensors, barometer, lidar, radar and vision sensors. The two sensors used most often by drone autopilot controllers for absolute positioning are the GNSS chipsets and barometer. Although, for most outdoor operations, these sensors provide accurate and reliable position information, their accuracy, availability, and integrity deteriorate for indoor applications and in the presence of radio frequency interference (RFI), such as GNSS spoofing and jamming. Therefore, it is possible to derive network-based locations from Wi-Fi and cellular transmission. Although there have been many theoretical studies on network positioning, limited resources are available for the expected quantitative performance of these positioning methodologies. In this paper, the authors investigate both the horizontal and vertical accuracy of the Android network location engines under rural, suburban, and urban environments. The paper determines the horizontal location accuracy to be approximately 1637 m, 38 m, and 32 m in terms of 68% circular error probable (CEP) for rural, suburban, and urban environments, respectively, and the vertical accuracy to be 1.2 m and 4.6 m in terms of 68% CEP for suburban and urban environments, respectively. In addition, the availability and latency of the location engines are explored. Furthermore, the paper assesses the accuracy of the Android network location accuracy indicator for various drone operation environments. The assessed accuracies of the network locations provide a deeper insight into their potential for drone navigation.
1. Introduction
Applications of drone navigation have been rapidly diversifying in the past decade. Drones are not only used for recreational purposes, but also for agriculture, geographical surveying, reconnaissance, and possibly for remote delivery [1]. In order to provide navigation information to the operators, or ensure fully autonomous systems, it is imperative to have accurate and reliable position, velocity, and time (PVT) information. There is an abundance of sensors and positioning techniques that are incorporated to provide the necessary PVT information to drones. These include, but are not limited to, GNSS receivers, inertial navigation systems composed of accelerometers and gyroscopes, magnetometers, barometers, and cameras.
Many drones utilize inertial sensors, as these are standalone sensors that do not rely on external resources to provide navigation information. In addition, their high update rate, compact size, and low weight make them ideal sensors for drones that carry out high dynamic maneuvers. However, as inertial measurements need to be integrated to obtain position solutions, cheaper sensors are prone to drift. Consequently, other sensors such as GNSS and barometer are used together with the inertial sensors. GNSS sensors provide accurate absolute PVT to the users, and barometers provide altitude estimates with respect to the standard atmospheric pressure or a local reference station. Although this suite of sensors provides accurate PVT to the users in nominal outdoor environments, they need additional sensors to navigate indoor environments or when in the presence of radio frequency interference (RFI). This is because under these conditions, GNSS may be unavailable or not trustable. Consequently, numerous localization methodologies have been developed to complement these sensors and assist in drone navigation, one of which is network positioning. Unlike methodologies, such as simultaneous localization and mapping (SLAM) or ground-based localization systems, network positioning does not require a large onboard computational load, and a lot of the necessary infrastructure is already available in areas with Wi-Fi or cell service. Network positioning is a means of absolute positioning that is popular in smartphones, but has had limited exploitation in autonomous vehicle operations.
In order to assess the potential of network positioning for drone applications, the authors investigated the accuracy and the characteristics of the network location provider (NLP) in Android devices. This was preliminarily presented by Nedelkov, but a more extensive investigation is presented within this paper [2]. The accuracy of the NLP was tested under rural, suburban, and urban environments with varying numbers of available Wi-Fi and cell access points. For the positioning assessment, the authors attempted to characterize the accuracy of, not only the horizontal positions, but also the altitude provided by the NLP. Afterwards, the accuracy of the NLP was quantified with respect to the number of Wi-Fi and cell access points available. These accuracies were compared with Google’s NLP accuracy estimates to see how well the estimates bound the errors, and, if necessary, how much they need to be inflated by before being passed on to the drone’s flight controller for navigation error bounding. Furthermore, availability, update rate, and latency of the NLP were assessed under different conditions. Effectively, the results of this paper aim to highlight the expected performance of the out-of-the-box Android NLP under various drone operating conditions. Overall, the main contributions of this paper include:
- Characterization of the NLP accuracy in several environments with varying numbers of visible Wi-Fi and cell tower access points;
- Accuracy assessment of the altitude measurements provided by the NLP;
- Determining the correlation between the NLP accuracy and the number of visible access points;
- Validation of the position accuracy estimates provided by the NLP;
- Investigation of the NLP availability, update rate, and latency.
3. Network Positioning
3.1. Wi-Fi Fingerprinting
The NLP primarily utilizes Wi-Fi fingerprinting, a technique that constructs a radio map from network access points and the geolocations they were detected at, and then compares this radio map against the user’s current available access points and respective signal strengths. If the true locations of the access points are known, they can be entered into the database instead. As Wi-Fi fingerprinting uses the constructed radio map for positioning, the accuracy of the map directly correlates to the performance of the NLP. The maps can be an open source of proprietary to the operating companies. One example of a public crowd-source database of Wi-Fi, cell, and Bluetooth access points is WIGLE. It has been collecting network access points and their locations from public users using their Android application since 2002, and has accumulated over 820 million Wi-Fi networks on its database [24]. It is possible for the users to access the information including the BSSID/MAC address, location, and updated date of the access point. On the other hand, large organizations, such as Google, are constantly collecting new fingerprints and updating their large databases to maintain an accurate NLP. Google went into greater detail regarding their fingerprinting methodology in a letter released to the Defense Priorities and Allocations System in 2010 [25]. Google tracks the media access control (MAC) address and the received signal strength (RSS) of each visible access point, along with the GPS location of the user’s device. They use this information by comparing the visible MAC addresses with the stored MAC addresses in the database, from which a location is identified. Finally, using the RSS of each access point, a positioning algorithm from the server estimates the location of the user and the location is sent back to the device. Figure 1 illustrates this fingerprinting technique.
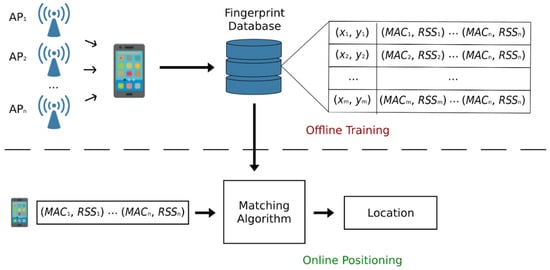
Figure 1.
Wi-Fi fingerprinting methodology. Access points are received by a user, and the corresponding identifier and location is saved to the database. When another device receives a set of identifier and the corresponding power, it is sent to a server to be converted to a location solution.
By analyzing the information provided by the Android NLP engine, it is possible to gain greater insight into what additional information the device has in addition to the radio map database. Each Wi-Fi access point provides information, including the venue name, SSID/BSSID, signal level, and frequency. Most likely, the signal level is converted into a range by using the free space path loss equation as shown in Equation (1), and then processed for a navigation solution.
Range ambiguity is being addressed in the next generation Wi-Fi positioning called Wi-Fi RTT ranging, which will be discussed further in the following sections. For the altitude resolution, it is possible to add an altitude value to the fingerprint database. In the case of indoor scenarios, a multi-story environment navigation resolution approach can be applied. For example, Han determines the floor of the device in a building by combining three-dimensional fingerprinting with a coarse clustering-based positioning algorithm using the difference of received MAC addresses in varying floors [26]. In another approach, Liu uses the device’s barometer to determine the altitude to assist in floor identification [27]. Similarly, Zhao proposes a hybrid floor-identification algorithm using the barometric pressure of the device and Bayesian classification to determine a floor level with 96.1% accuracy [28].
3.2. Cell Positioning
Although it is not as accurate Wi-Fi positioning, the NLP in Android also utilizes cell tower localization. Cell tower localization is similar to Wi-Fi fingerprinting, since it involves determining a position using the signal strength of visible cell towers and their known location in a database. Figure 2 depicts how a mobile device may determine a location through cell tower triangulation. Using the known cell tower locations and their respective signal power levels observed by the device, it is possible to estimate the user position. Unlike the Wi-Fi routers, it may also be more convenient to estimate the transmitted power from the cell towers, as these would be centrally controlled rather than being dependent on each individual station [29].
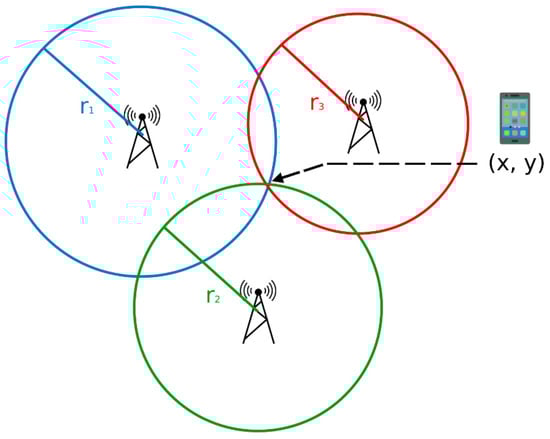
Figure 2.
Illustration of cell localization using cell towers. If the locations of the cell towers are known, and the distance to each cell tower can be estimated, a position solution can be computed.
Another important characteristic that differentiates Wi-Fi positioning to cell positioning is the range of the signals. Cell signals have longer range, because the typical transmitted cell signal power is greater than that of Wi-Fi, and also cell signals utilize a lower frequency spectrum. Although this assists in providing better availability for cell positioning, it also reduces the need for a high-density cell tower distribution. Consequently, a receiver may often be in the range of only a few cell towers that are kilometers away. In such environments, where there is a low density of cell towers, the accuracy can range from anywhere between a few hundred meters up to multiple kilometers, which is much worse than that of Wi-Fi positioning [23]. In the near future, 5G technology may significantly improve the accuracy of cellular positioning, especially in areas with many 5G access points available. The introduction of 5G technology would allow accuracy within 10 m for scenarios, such as emergency calls, and decimeters in an indoor factory setting [30].
Based on what was extractable from the smartphones used in this study, the Android NLP engine is able to identify what type of network the cell signals are on, so this may help to weight all of the measurements based on their estimated qualities. For example, it is possible to differentiate between GSM, CDMA, LTE, WCDMA, 5G, and TDSCDMA. In terms of measurements, all signals provide a station ID and a power level. In the case of LTE, the bandwidth is provided, and in the case of CDMA, the station latitude and longitude are also available.
3.3. Wi-Fi RTT Ranging
Another form of network positioning is Wi-Fi round-trip time (RTT), which measures the distance from a device to nearby Wi-Fi access points to determine a location. The IEEE 802.11mc standard made Wi-Fi RTT possible in 2016 with the fine timing measurement (FTM) protocol [31]. Wi-Fi RTT works by measuring the distance from a device to nearby Wi-Fi access points. More specifically, the RTT is the time it takes for a signal to be sent to the access point, plus the time it takes for the access point to communicate that the signal was received. Wi-Fi RTT allows the user to achieve 1-2 m accuracy in indoor scenarios [32]. This method is superior to Wi-Fi fingerprinting, as there is no need to build a radio map and maintain a large database. Instead, the location of the access points can be configured and provided upon connection [33]. Android added support for Wi-Fi RTT ranging in 2018, although the lack of access points that have implemented the IEEE 802.11mc standard has proved that this technology is still in its early stages. Once more access points support this standard and the technology is more developed, Wi-Fi RTT may grow to be a leading indoor positioning technique with future possibilities of sub-meter accuracy. Although this could be revolutionary for indoor drone positioning, the limited number of access points currently supporting this standard prompts the authors to focus on the current capabilities of traditional Wi-Fi and cell localization instead.
4. Testing Scenario
In order to evaluate the accuracy of the NLP, a set of experiments were devised to test the NLP engine under a plurality of scenarios. As the network location provider provides not only latitude and longitude, but also altitude, an assessment was carried out for both horizontal and vertical accuracies. For the horizontal accuracy, a drive test was carried out in rural, suburban, and urban environments with varying amounts of Wi-Fi and cell coverage. For the rural scenario, a route around Erie, Colorado, was selected. This was because most of the route was through farmlands, which meant that the number of visible Wi-Fi access points is limited. For the suburban scenario, a drive through Boulder, Colorado, was chosen. This is due to the presence of many small businesses and residential houses along the route. For the urban scenario, Denver, Colorado, was chosen due to the large number of high-rise buildings and numerous corporate networks located in the city center. For the vertical accuracy, a drive test was carried out near Boulder, Colorado, where there are altitude variations between 1620 m and 1720 m in a less than 10-min time period. A summary of the scenarios is provided in Table 1 and the route visualizations are provided in Figure 3. Each test was approximately one hour long and was carried out on 11 December 2021.

Table 1.
Summary of all of the scenarios investigated in this study.
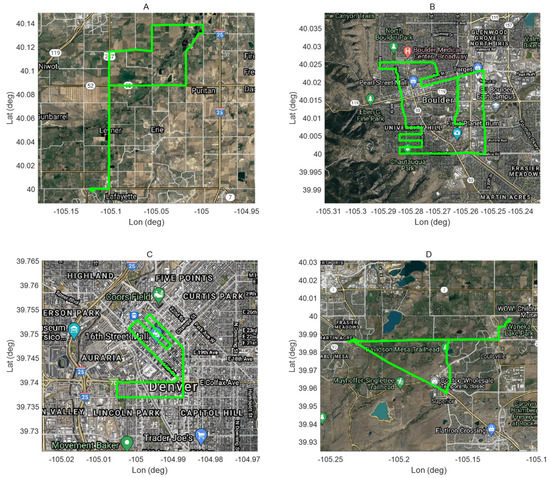
Figure 3.
The routes used for each of the test scenarios. (A) Erie, Colorado, with limited Wi-Fi and Cell coverage; (B) downtown Boulder, Colorado, with many residential network coverage; (C) downtown Denver, Colorado, with many corporate and business network coverage; (D) a loop with a lot of elevation changes;.
The device used to log the data was a pair of Samsung S21 Ultra 5G. The phone had Wi-Fi and cell turned on, and the “Wi-Fi scanning” option which “lets apps use Wi-Fi for more accurate location detection, even when Wi-Fi is off” was enabled. The data was logged using a custom logger that logs information provided by the Android Network Location Provider and all visible Wi-Fi and cell access points.
For truth comparison, a u-blox C099-F9P receiver with a ZED-F9P GNSS module and a L1/L2 multi-band, high precision GNSS antenna was used for data collection. The data collected was processed using RTKLib PPP-RTK dynamic mode with NIST, Colorado, as a reference DGNSS station. As the expected accuracy of the u-blox is within 0.01 m with RTK and has a navigation update rate of 20 Hz, it was deemed sufficient to serve as a truth reference for this study [34]. Furthermore, although the performance of GNSS receivers is limited in signal-attenuated environments where no GNSS signals are available, or in the presence of spoofing, the authors verified that the dataset collected had 100% GNSS availability, and no form of GNSS spoofing.
5. Results
5.1. Horizontal Accuracy
Figure 4 shows the total number of Wi-Fi and cell access points available for each NLP solution. Looking at the total number of access points, it is clear that there were a limited number of access points for the rural set, and an abundant number of access points for the urban set. The rural set scenario had a root mean squared (RMS) of 25 access points for all epochs with a network location solution, the suburban scenario had an RMS of 75 access points, and the urban scenario had an RMS of 100 access points. Typically, a larger quantity of access points corresponds to a better accuracy, but for the case of the suburban scenario there are points with over 130 access points with low accuracy. This is because those are near student apartments, and at the time this test was carried out, many students were moving in and out due to the end of the semester, which altered the physical location of the Wi-Fi routers, contributing to a degradation of fingerprinting database accuracy. In order to validate this speculation, positions from the NLP were recorded in static mode inside a house, then repeated after leaving the phone in the same position, and moving the location of the Wi-Fi routers. The initial static test resulted in less than 1 m RMS deviation from the mean position, and the deviations were likely due to the deviations in the signal strengths. However, when the routers were moved by approximately 20 m, the positions shifted more than 5 m from the original mean, confirming that changing the locations of the access points is sufficient to change the computed NLP solution. For other locations, especially downtown Denver and Boulder, most Wi-Fi routers in businesses are fixed, so such behavior was not noticed.
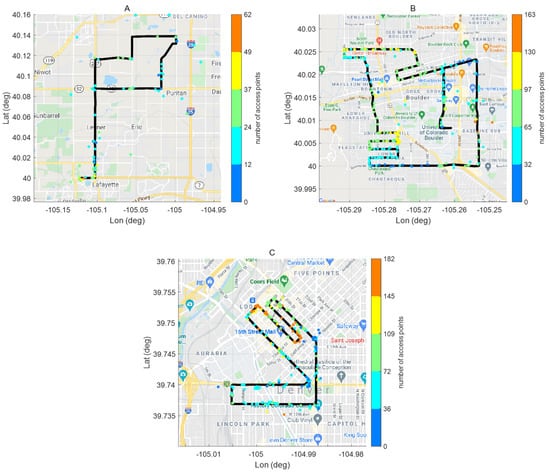
Figure 4.
Representation of the route in black, available NLP in colored dots, and the representation of the number of access points in the respective colors. (A) is the rural scenario, (B) is the suburban drive, and (C) is the urban test for downtown Denver.
Figure 5 shows the horizontal accuracy of all the NLP points for each scenario. In line with the preliminary results discussed by Nedelkov et al. (2020), the horizontal accuracy of the NLP was better when more access points were available. Furthermore, the accuracy of NLP dropped significantly when cell positioning was used instead of Wi-Fi positioning. Although it will be discussed further in the following altitude accuracy section, it is possible to tell whether Wi-Fi access points are used by looking at the availability of altitude measurements for NLP. For the rural scenario, 50% of the NLP had Wi-Fi positioning, while the rural and urban scenarios had Wi-Fi positioning for all of the NLP solutions. Table 2 summarizes the total number of access points observed for each scenario and their respective accuracies. Figure 6 shows the relationship between the number of access points versus the horizontal error. It is possible to see that more access points correlate to a smaller horizontal error.
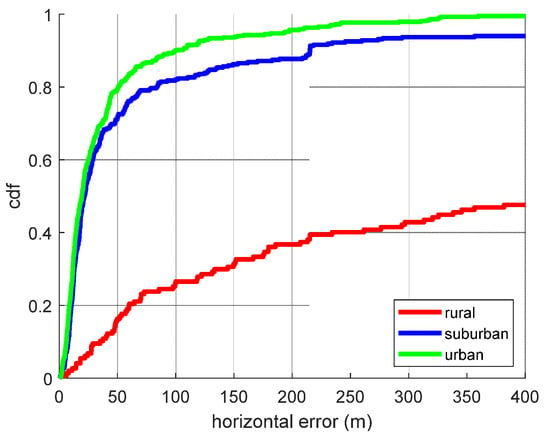
Figure 5.
Cumulative distribution function plot of the horizontal errors observed for three scenarios: rural, suburban, and urban. The urban scenario had the least horizontal errors, and the rural scenario had the most errors.
Table 2.
Observed number of access points and the observed horizontal accuracy for each scenario.
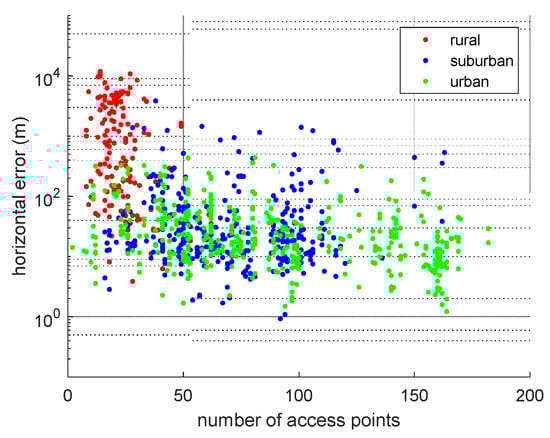
Figure 6.
Relationship between the number of access points and the observed horizontal error. When only cell positioning is used (rural), the horizontal error was the greatest. For suburban and urban scenarios when Wi-Fi positioning was used, an increased number of access points meant smaller horizontal error, but the advantage plateaus when enough access points are available.
5.2. Vertical Accuracy
In order to assess when altitude measurements were available, the NLP information was logged with Wi-Fi positioning turned on and off. It was noticed that when only cell positioning was enabled, and when Wi-Fi positioning was enabled but no Wi-Fi access points were available, the altitude field provided by the NLP was null. This indicates that Wi-Fi access points are the source of altitude information. Figure 7 illustrates and Table 3 summarizes the observed accuracy of the NLP measurements. The accuracy was 1.9 m for 68% CEP when the total amount of altitude variation was 200 m for the altitude variation drive. In the case of the suburban scenario, the altitude error was 1.2 m for 68% CEP, and for the urban scenario it was 4.6 m for 68% CEP. This suggests that the altitude fingerprinting for the urban environment is problematic, possibly due to the Android crowdsourcing data being partially obtained from mobile devices above the road inside of multi-floor buildings, which increases the altitude estimate. Furthermore, as the altitude is dependent on the availability of Wi-Fi access points, in Figure 8 the altitude error is plotted against the number of available access points. From the plot, it is possible to see that there is an inverse correlation relationship.
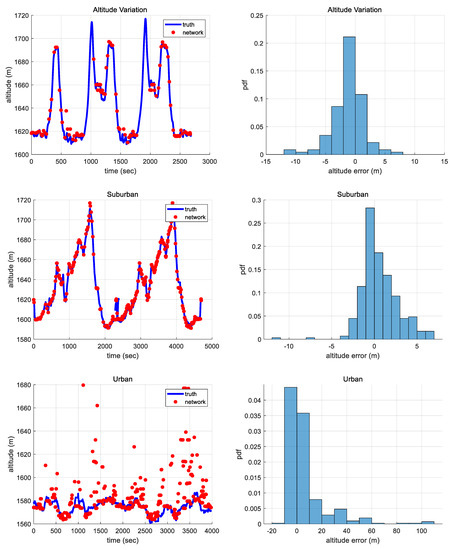
Figure 7.
Accuracy of the altitude measurements from the NLP versus truth. For altitude variation and suburban scenarios, the altitude estimates match closely. For the urban scenario, the NLP altitude is sometimes positively skewed due to over-estimating the altitude.
Table 3.
Observed accuracy of the altitude measurements from the scenarios: altitude variation, suburban, and urban.
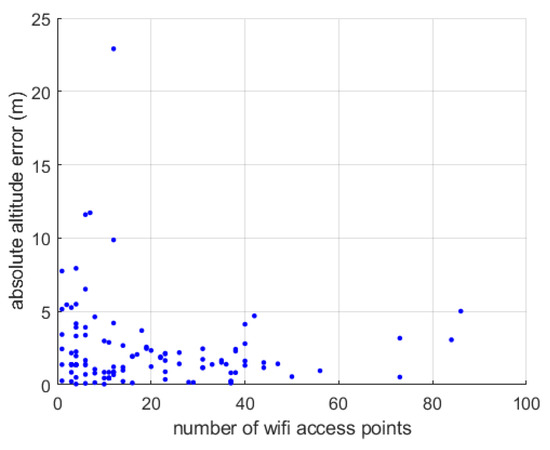
Figure 8.
Relationship between the number of Wi-Fi access points and the observed altitude error.
5.3. Protection Level
The Android network location engine not only provides the NLP, but also the expected accuracy of the NLP. This expected accuracy is defined by Google to be the radius of 68% confidence. [35] For horizontal Wi-Fi positioning, the minimum threshold was 11 m, and the maximum was 156.9 m. For horizontal cell positioning, the minimum was 500 m and the maximum was 2300 m. For vertical Wi-Fi positioning, the threshold was between 1 m and 30 m. In order to assess how accurate these values are, the accuracy of the NLP was compared with the estimate for various environments, and the results are shown in the time domain in Figure 9. In the case of horizontal errors, for the urban environment, the Android estimate was fairly accurate and bounded 75% of the errors. In the case of the suburban scenario, it was successful in bounding 72% of the errors. However, in the case of the rural scenario, it was only able to bound 38% of the errors. This indicates that although the Android NLP estimates successfully bound 68% of the measurements for urban and suburban scenarios, they need to be inflated significantly more for the rural environment where only cell positioning is available. In the case of altitude errors, the android estimates bounded 64.2% for the urban scenario, and 93.1% of the errors for the suburban scenario. The rural scenario was not considered due to the limited number of available Wi-Fi altitude measurements. This indicates that although the network altitude is well bounded for smaller buildings, the estimate needs to be inflated for urban environments with Wi-Fi access points located on multiple floors.
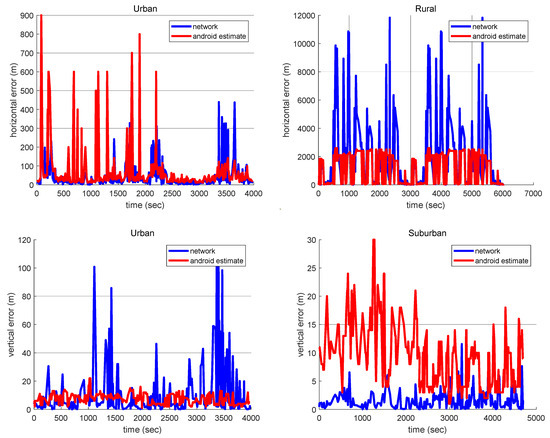
Figure 9.
Observed network location error versus the android estimated error level. For horizontal accuracies, the Wi-Fi errors matched the android estimates well, but the errors exceeded the estimates significantly for the urban scenario when only cell positioning was used. For vertical accuracies, the Wi-Fi errors were well bounded for the suburban scenario, but were underestimated for the urban environment.
5.4. Availability and Latency
From all of the scenarios, the update interval for the NLP was at a minimum of 5 s, and was typically at 5 s or 20 s. This is due to the limited network search rate inherent in the Android devices associated with power savings. Even when only Wi-Fi or only cell positioning was used, the same update rate was observed. For the total number of access points required for cell positioning, the authors looked at the minimum number of access points observed when only cell positioning was used. For Wi-Fi positioning, the minimum number of access points required for altitude measurements was assessed, as altitude is available only when Wi-Fi positioning is available. Consequently, a minimum of two cell towers were required for cell positioning, and only a single Wi-Fi access point available in the fingerprinting database was required for Wi-Fi positioning.
In order to obtain the NLP solution, the access point data needs to be transmitted from the smartphone, computed over the server using the access point fingerprinting, and sent back to the user. This implies that there is a latency between the data collection and PVT computation. In order to estimate this, the time stamps for the GNSS and NLP solutions from the Android device were assessed. Both position fixes provide UTC and receiver time stamps. Although it is difficult to know the timing truth, as GNSS time has on a nanosecond-level accuracy, GNSS time was assumed to be the truth [11]. Also, as the receiver time is common for both location engines, it was used as a comparison basis. When the two location engines were compared, NLP was slower by 1.13 s RMS, which is the location engine latency.
6. Conclusions
In this study, the accuracies of the horizontal and vertical positions provided by the NLP under various scenarios were investigated. When only the cell positioning was used, no altitude measurements were provided, and the horizontal accuracy was limited to 500 m or worse. When Wi-Fi was available, the urban scenario had the best horizontal accuracy, and the worst vertical accuracy. This is because in the urban case, there were the greatest number of access points available lending to the high horizontal accuracy. However, those access points were located on various floors of multi-story buildings, and the locations used for the crowdsourcing were also from various altitudes.
Consequently, for rural environments, some level of coarse positioning is available from the cell locations when two or more cell towers were available. When one or more Wi-Fi access points registered in the fingerprint database is available, altitude measurements are available as well. For suburban navigation, the expected accuracy of the NLP is 38 m horizontal and 1.2 m vertical for 68% CEP. For urban navigation, the expected horizontal accuracy increases further but the altitude estimates are less reliable. Also, the Android estimated errors are similar to the actual errors for the suburban scenario, but the Android underestimates the horizontal accuracy for rural environments, and underestimates the vertical accuracy for urban environments. A summary of the NLP performances is provided in Table 4. However, it is important to note that these performances were based on the network fingerprinting database available at that time to the Android devices. If any of the access points are not available in the database, they cannot be used for navigation solution computation, and if the location of the access points has moved and has not been updated in the database yet, inaccurate localization solutions can be computed. Also, the NLP rate suggests that although it can be used for various navigation purposes, the relatively lower update rate and latency compared to other sensors, such as GNSS and INS, may be a limiting factor for high dynamic operations.
Table 4.
Summary of the expected performance of NLP for various scenarios and environments.
This study provides insight into the expected accuracy of Android NLP under various environments, and assesses the accuracy of the corresponding estimated errors. Furthermore, the altitude analysis suggests that although NLP is often used for geolocation purposes in two-dimensional maps, it can also be used to provide altitude information as well. This altitude can be used not only for navigation, but also for barometric altitude calibrations in the absence of local pressure monitoring stations. Furthermore, these expected accuracies may assist in estimating the error bounds for NLP in various environments as a form of APNT, and a method to validate the GNSS measurements for the potential presence of spoofing [36]. This study was carried out outdoors, as GNSS truth was only available outdoors. However, as the NLP is dependent on the availability of Wi-Fi and cell tower signals, similar performance is expected indoors as well. In order to obtain a more statistically significant representation of diverse operation environments, additional exhaustive and comprehensive data collection in required. This paper is a performance assessment of NLP at this point in time, and the accuracies are expected to further improve in the future with the infrastructure expansion of more 5G cell towers and 802.11mc compatible Wi-Fi routers.
Author Contributions
All the authors have contributed to the presented work. The first author, D.-K.L. suggested and embodied the methodology to assess the network location information provided by the Android devices, and processed all the logged measurements. The second author, F.N. developed the Android logger used to save all the Wi-Fi and cell information provided by the devices. D.M.A. suggested the original concept of the system and supervised its development and the direction of the research. All authors participated in formulating the idea and in discussing the proposed approach and results. All authors have read and agreed to the published version of the manuscript.
Funding
This research was funded by the University of Colorado Boulder. Publication of this chapter was funded by the University of Colorado Boulder Libraries Open Access Fund.
Conflicts of Interest
The authors declare no conflict of interest.
References
- FAA Approves Flytrex Drone Delivery Service Expansion, AVweb. 14 December 2021. Available online: https://www.avweb.com/recent-updates/unmanned-vehicles/faa-approves-flytrex-drone-delivery-service-expansion/ (accessed on 20 December 2021).
- Nedelkov, F.; Lee, D.; Miralles, D.; Akos, D. Accuracy and Performance of the Network Location Provider in Android Devices. In Proceedings of the 33rd International Technical Meeting of the Satellite Division of The Institute of Navigation (ION GNSS 2020), Online, 22–25 September 2020; pp. 2152–2165. [Google Scholar]
- Pixhawk 4 Datasheet, Px4. 2021. Available online: https://docs.px4.io/master/en/flight_controller/pixhawk4.html (accessed on 20 December 2021).
- ICM-20689 Datasheet, InvenSense. 2021. Available online: https://invensense.tdk.com/download-pdf/icm-20689-datasheet/ (accessed on 20 December 2021).
- Chow, J.C.K.; Hol, J.D.; Luinge, H. Tightly-Coupled Joint User Self-Calibration of Accelerometers, Gyroscopes, and Magnetometer. Drones 2018, 2, 6. [Google Scholar] [CrossRef] [Green Version]
- Spreading Wings S1000 Datasheet, DJI. 2021. Available online: https://www.dji.com/spreading-wings-s1000/spec (accessed on 20 December 2021).
- Nistér, D.; Naroditsky, O.; Bergen, J. Visual odometry. In Proceedings of the 2004 IEEE Computer Society Conference on Computer Vision and Pattern Recognition (CVPR 2004), Washington, DC, USA, 27 June–2 July 2004; Volume 1, pp. 1–652. [Google Scholar]
- Durrant-Whyte, H.; Bailey, T. Simultaneous localization and mapping: Part I. IEEE Robot. Autom. Mag. 2006, 13, 99–110. [Google Scholar] [CrossRef] [Green Version]
- Pressure Altitude, National Oceanic and Atmospheric Administration, National Weather Service. 2021. Available online: https://www.weather.gov/media/epz/wxcalc/pressureAltitude.pdf (accessed on 20 December 2021).
- Lee, D.; Nedelkov, F.; Akos, D.; Park, B. Barometer based GNSS spoofing detection. In Proceedings of the 33rd International Technical Meeting of the Satellite Division of The Institute of Navigation (ION GNSS+ 2020), Online, 22–25 September 2020; pp. 3268–3282. [Google Scholar]
- Misra, P.; Enge, P. Global Positioning System: Signals, Measurements, and Performance, 2nd ed.; Ganga-Jamuna Press: Lincoln, MA, USA, 2006; ISBN 9780970954411. [Google Scholar]
- Geng, J.; Guo, J.; Chang, H.; Li, X. Toward global instantaneous decimeter-level positioning using tightly coupled multi-constellation and multi-frequency GNSS. J. Geod. 2018, 93, 977–991. [Google Scholar] [CrossRef] [Green Version]
- Suzuki, K.; Pullen, S.; Enge, P.; Ono, T. Evaluation of Dual-Frequency GBAS Performance using Data from Public Receiver Networks. In Proceedings of the 23rd International Technical Meeting of the Satellite Division of The Institute of Navigatio (ION 2010), Portland, OR, USA, 21–24 September 2010; pp. 2592–2602. [Google Scholar]
- Mueller, M.S.; Jutzi, B. UAS Navigation with SqueezePoseNet—Accuracy Boosting for Pose Regression by Data Augmentation. Drones 2018, 2, 7. [Google Scholar] [CrossRef] [Green Version]
- Humphreys, T.E.; Ledvina, B.M.; Psiaki, M.L.; O’Hanlon, B.W.; Kintner, P.M. Assessing the spoofing threat: Development of a portable GPS civilian spoofer. In Proceedings of the 21st International Technical Meeting of the Satellite Division of The Institute of Navigation (ION GNSS ITM), Savannah, GA, USA, 16–19 September 2008; pp. 2314–2325. [Google Scholar]
- Kerns, A.; Shepard, D.P.; Bhatti, J.A.; Humphreys, T.E. Unmanned aircraft capture and control via GPS spoofing. J. Field Robot. 2014, 31, 617–636. [Google Scholar] [CrossRef]
- Lee, D.; Miralles, D.; Akos, D.; Konovaltsev, A.; Kurz, L.; Lo, S.; Nedelkov, F. Detection of GNSS Spoofing using NMEA Messages. In Proceedings of the European Navigation Conference (ENC 2020), Online, 23–24 November 2020; pp. 1–10. [Google Scholar]
- Akos, D. Who’s Afraid of the Spoofer? GPS/GNSS Spoofing Detection via Automatic Gain Control (AGC). Navigation 2012, 59, 281–290. [Google Scholar] [CrossRef]
- Miralles, D.; Akos, D.; Lee, D.; Konovaltsev, A.; Kurz, L.; Lo, S. Robust Satellite Navigation in the Android Operating System using the Android Raw GNSS Measurements Engine and Location Providers. In Proceedings of the 2020 European Navigation Conference (ENC), Dresden, Germany, 23–24 November 2020; pp. 1–12. [Google Scholar]
- Miralles, D. Reliable Satellite Radionavigation in the Android Operating System. Ph.D. Thesis, University of Colorado Boulder, Boulder, CO, USA, January 2021. [Google Scholar]
- Rizos, C. Locata: A Positioning System for Indoor and Outdoor Applciations where GNSS Does Not Work. In Proceedings of the 18th Association of Public Authority Surveyors Conference, Canberra, Australia, 13–14 March 2013; pp. 73–83. [Google Scholar]
- Zandbergen, P. Comparison of WiFi positioning on two mobile devices. J. Locat. Based Serv. 2012, 6, 35–50. [Google Scholar] [CrossRef]
- Yang, J.; Varshavsky, A.; Liu, H.; Chen, Y.; Gruteser, M. Accuracy Characterization of Cell Tower Localization. In Proceedings of the 12th ACM International Conference on Ubiquitous Computing (UbiComp ’10), Copenhagen, Denmark, 26–29 September 2010; pp. 223–226. [Google Scholar] [CrossRef]
- Wigle.net. Available online: https://wigle.net/index (accessed on 20 December 2021).
- Leiteritz, R. Copy of Google’s Submission Today to Several National Data Protection Authorities on Vehicle-Based Collection of Wifi Data for Use in Google Location Wbased Services. Available online: http://static.googleusercontent.com/media/www.google.com/en//googleblogs/pdfs/google_submission_dpas_wifi_collection.pdf (accessed on 26 March 2020).
- Han, L.; Jiang, L.; Kong, Q.; Wang, J.; Zhang, A.; Song, S. Indoor Localization within Multi-Story Buildings Using MAC and RSSI Fingerprint Vectors. Sensors 2019, 19, 2433. [Google Scholar] [CrossRef] [PubMed] [Green Version]
- Liu, K.; Wang, Y.; Wang, J. Differential Barometric Altimetry Assists Floor Identification in WLAN Location Fingerprinting Study. In Principle and Application Progress in Location-Based Services; Springer: Berlin/Heidelberg, Germany, 2014; pp. 21–29. [Google Scholar]
- Zhao, F.; Luo, H.; Zhao, X.; Pang, Z. HYFI: Hybrid Floor Identification Based on Wireless Fingerprinting and Barometric Pressure. IEEE Trans. Ind. Inform. 2015, 13, 330–341. [Google Scholar] [CrossRef] [Green Version]
- Human Exposure to Radio Frequency Fields: Guidelines for Cellular Antenna Sites, Federal Communications Commission. 2019. Available online: https://www.fcc.gov/consumers/guides/human-exposure-radio-frequency-fields-guidelines-cellular-and-pcs-sites (accessed on 20 December 2021).
- Dwivedi, S.; Shreevastav, R.; Munier, F.; Nygren, J.; Siomina, I.; Lyazidi, Y.; Shrestha, D.; Lindmark, G.; Ernstrom, P.; Stare, E.; et al. Positioning in 5G networks. arXiv 2012, arXiv:2102.03361. [Google Scholar] [CrossRef]
- Ma, C.; Wu, B.; Poslad, S.; Selviah, D.R. Wi-Fi RTT Ranging Performance Characterization and Positioning System Design. IEEE Trans. Mob. Comput. 2020, 21, 740–756. [Google Scholar] [CrossRef]
- Ibrahim, M.; Liu, H.; Jawahar, A.; Nguyen, V. Verification: Accuracy Evaluation of WiFi Fine Time Measurements on an Open Platform. In Proceedings of the 24th Annual International Conference on Mobile Computing and Networking, New Delhi, India, 29 October–2 November 2018; pp. 417–427. [Google Scholar] [CrossRef]
- Wi-Fi Location: Ranging with RTT, Android Developers. 2021. Available online: https://developer.android.com/guide/topics/connectivity/wifi-rtt (accessed on 20 December 2021).
- ZED-F9P module Product Sheet, u-Blox. Available online: https://www.u-blox.com/sites/default/files/ZED-F9P_ProductSummary_UBX-17005151.pdf (accessed on 20 December 2021).
- Location, Android Developers. 2021. Available online: https://developer.android.com/reference/android/location/Location (accessed on 20 December 2021).
- Spens, N.; Lee, D.-K.; Akos, D. An Application for Detecting GNSS Jamming and Spoofing. In Proceedings of the 34th International Technical Meeting of the Satellite Division of The Institute of Navigation (ION GNSS+ 2021), St. Louis, MO, USA, 20–24 September 2021; pp. 1981–1988. [Google Scholar] [CrossRef]
Publisher’s Note: MDPI stays neutral with regard to jurisdictional claims in published maps and institutional affiliations. |
© 2022 by the authors. Licensee MDPI, Basel, Switzerland. This article is an open access article distributed under the terms and conditions of the Creative Commons Attribution (CC BY) license (https://creativecommons.org/licenses/by/4.0/).