1. Introduction
The daily parcel of e-commerce enterprises has attracted huge attention due to their rapidly growing volume. In 2021, the global parcel shipping volume exceeded 159 billion parcels, which is expected to reach 256 billion in 2027 at a compound annual growth rate of 8.5 per cent [
1]. Meanwhile, the variability of customer demand characteristics, such as different service locations and service times, has led to the need for logistic service providers to invest large-scale capacity and resources in “the last mile” transportation of parcels [
2]. Thus, more and more companies are trying to find innovative and autonomous delivery methods for “the last mile” transport, such as drone logistics, to improve the quality of logistics. With the development of technology, drones’ airworthiness and cargo-carrying capacity have improved significantly. Electric-powered logistics drones are not restricted by road networks and can reduce environmental costs and increase service flexibility [
3]. The contactless services provided by drone logistics are also widely recognised due to the coronavirus outbreak [
4]. Overall, the above advantages make drone logistics a powerful solution to solving the problems of traditional logistics [
5]. Internationally renowned logistics companies such as Amazon, DHL Express, and Jingdong Logistics have begun developing drone logistics versions [
6]. Statistics from BusinessWire also show that the global business value of drone package delivery has grown from USD 0.68 billion in 2020 to approximately USD 1 billion in 2021 and is expected to be USD 4.4 billion in 2025 [
7].
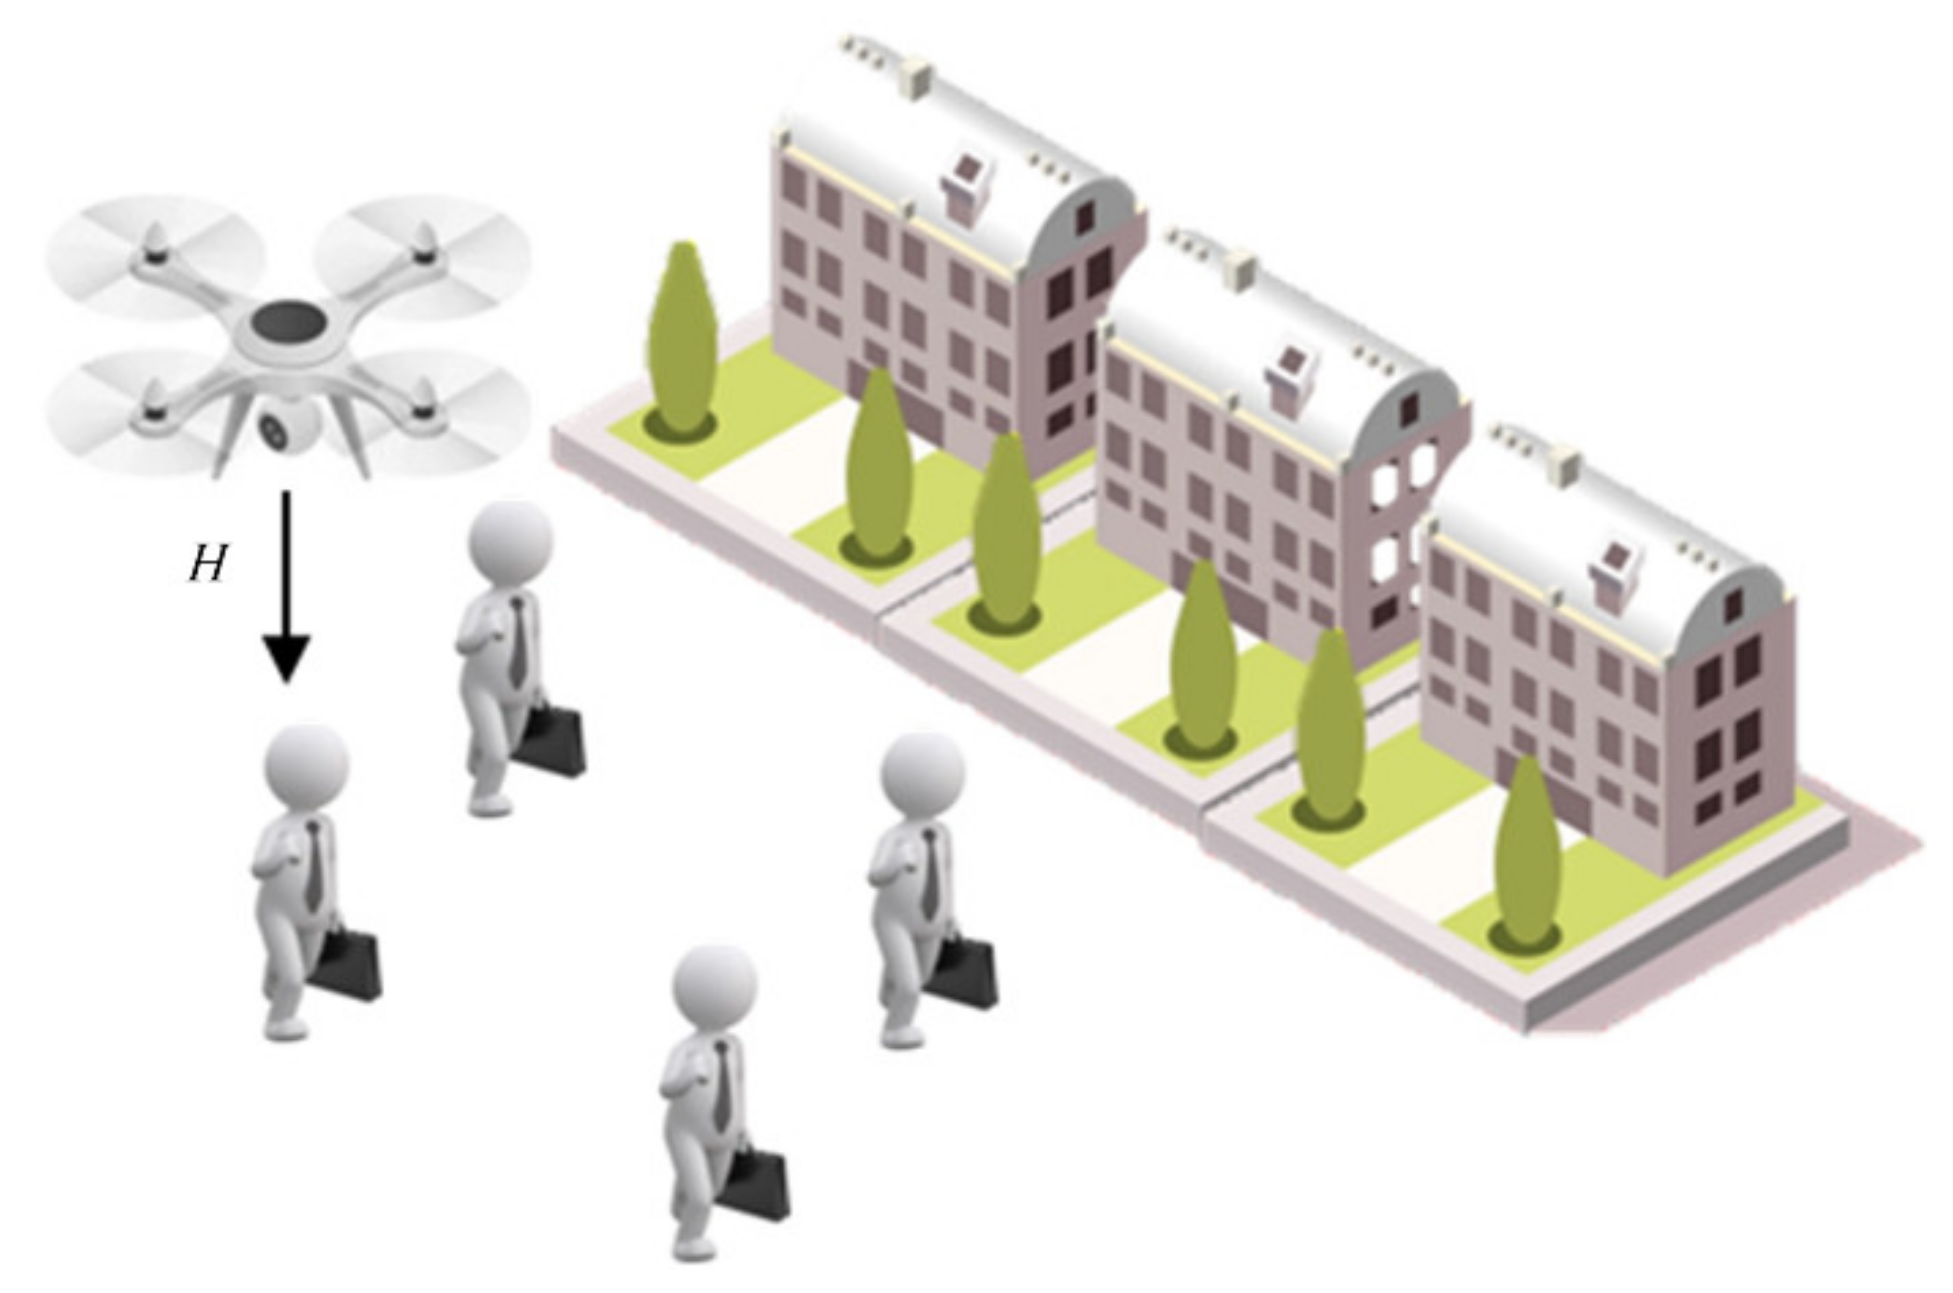
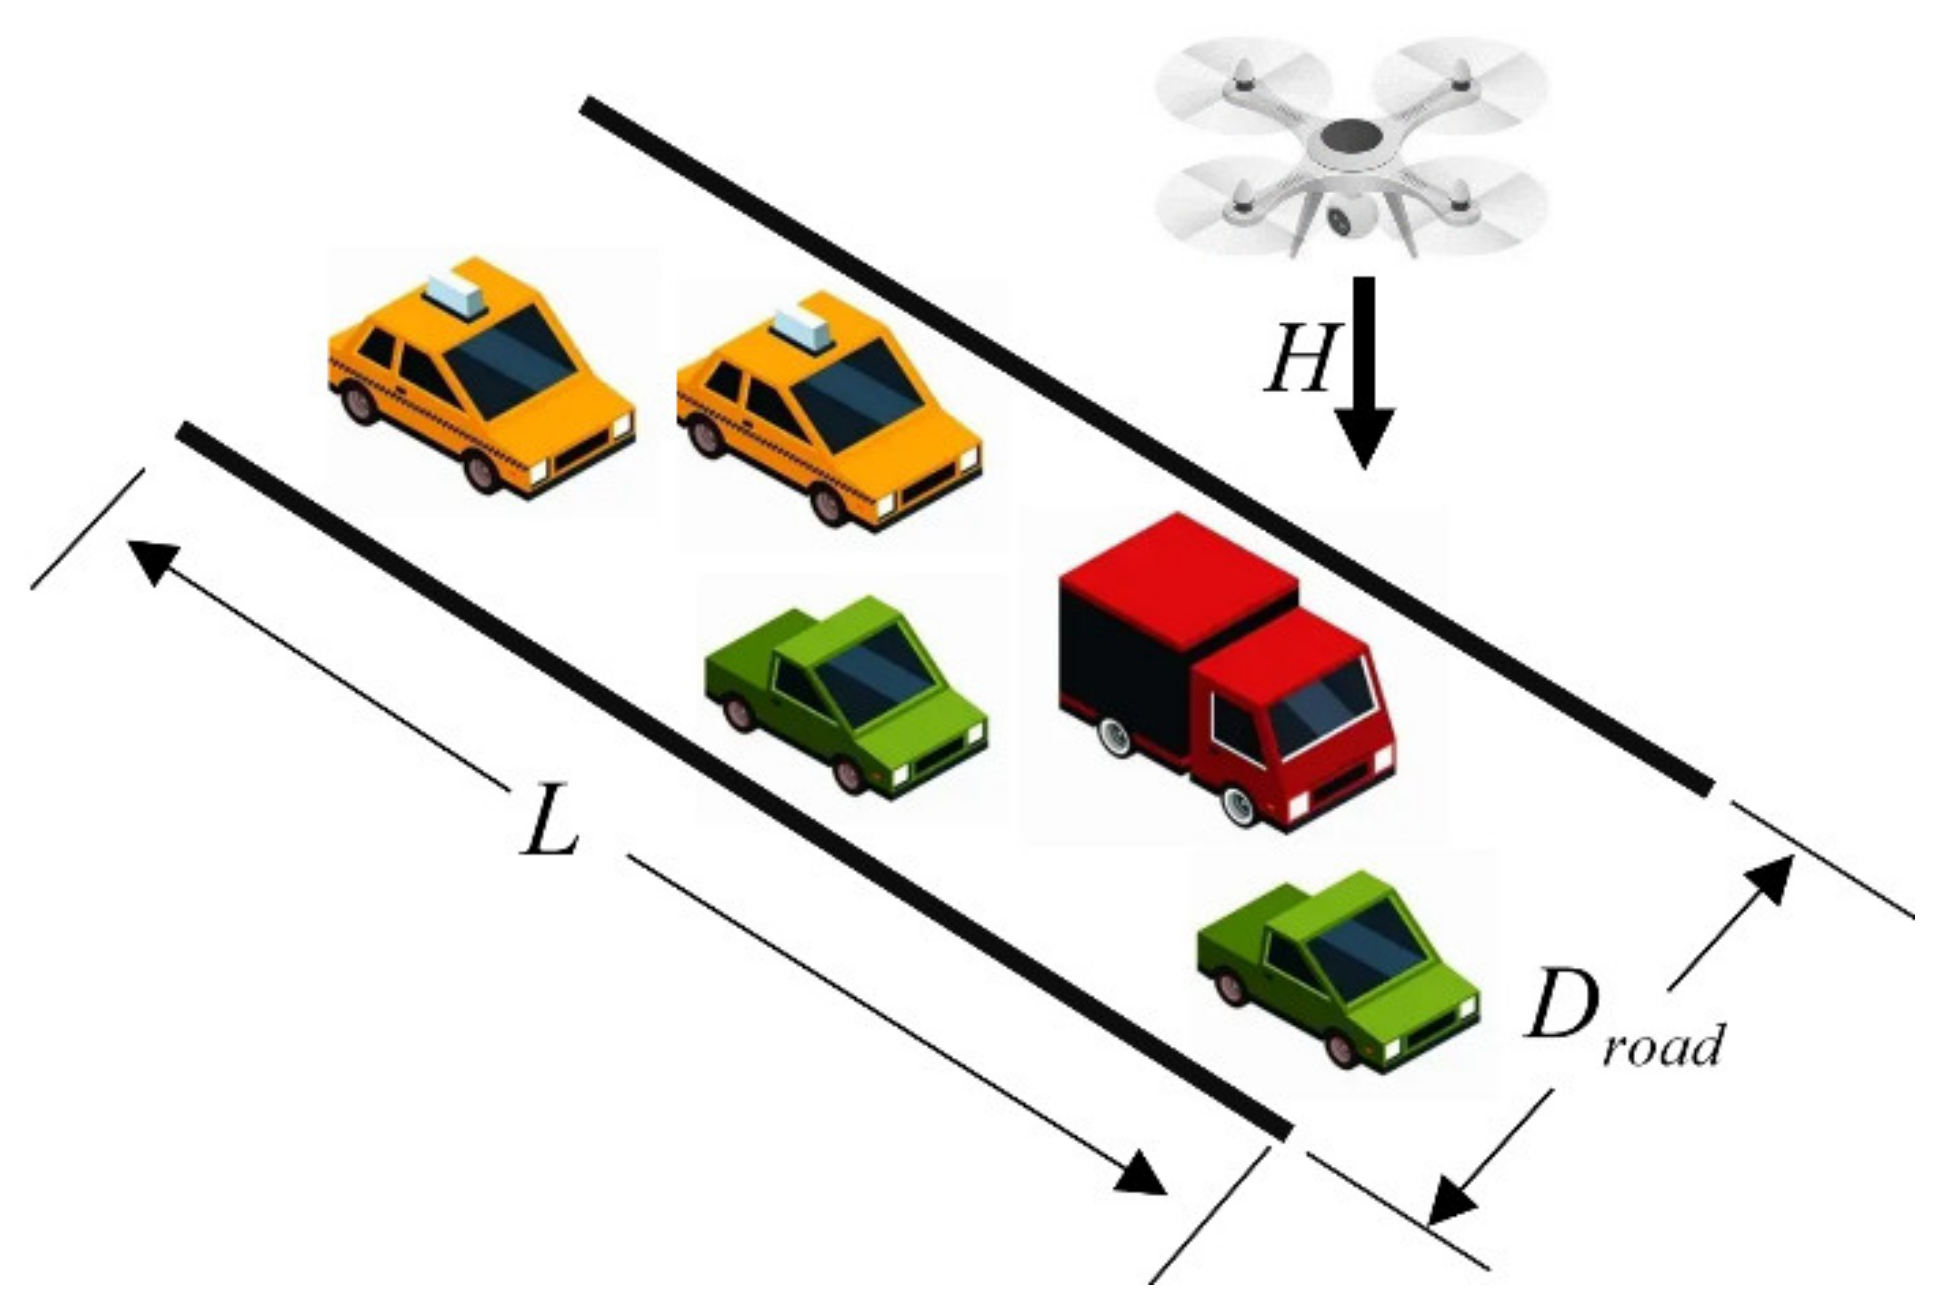
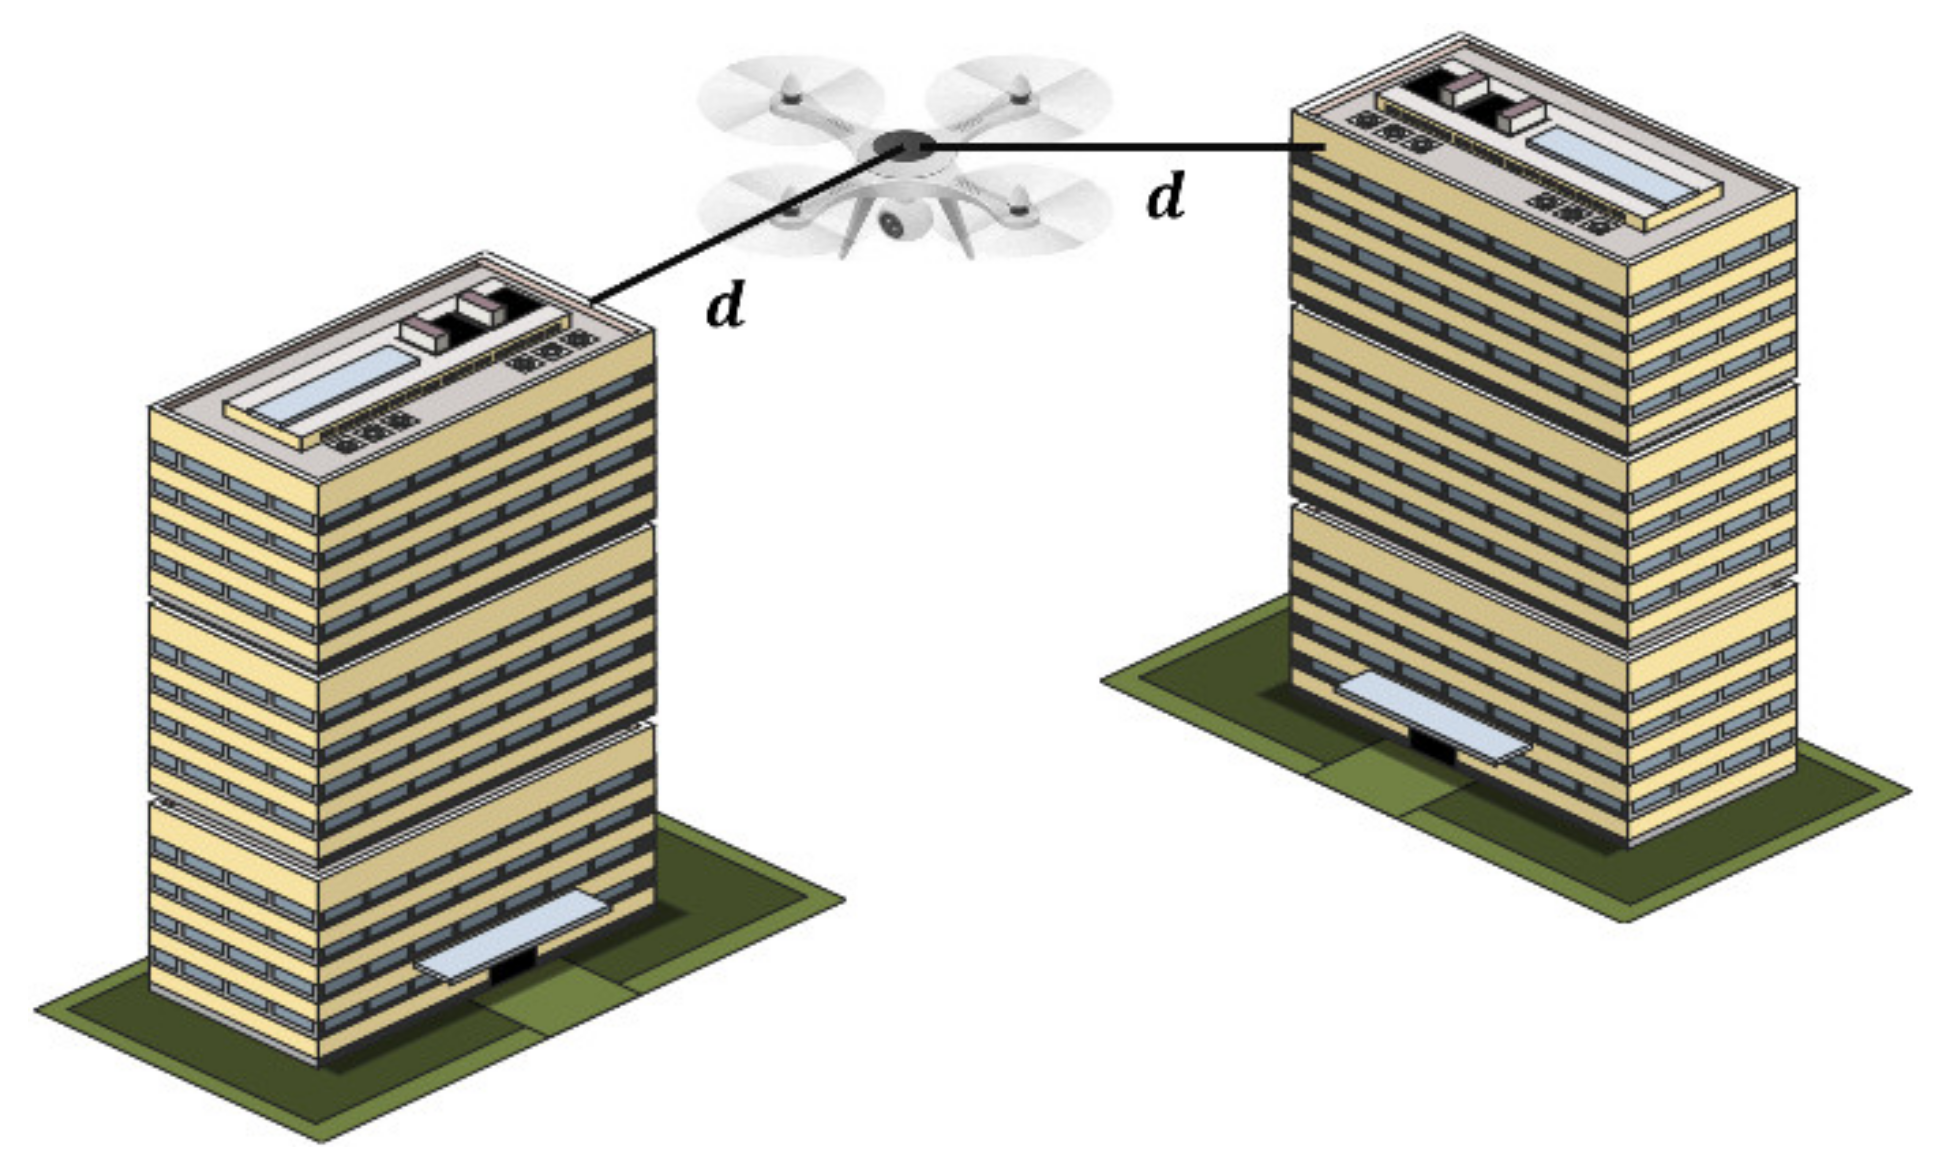
However, the accident risks associated with the large-scale application of logistics drones must be effectively assessed and managed. The drone would not only threaten the safety of people and vehicles on the ground in urban environments [
8], but also may collide with high-rise buildings [
9]. To ensure the safety of other aircraft, people, and property after a drone crash, aviation organisations, including the Federal Aviation Authority (FAA), require a risk mitigation assessment in the pre-flight state [
10]. Hence, the study of path risk assessment and mitigation methods is a critical technical prerequisite for logistics drone applications.
Throughout the existing research, the vehicle path problem is a classical mathematical model for studying urban last-mile logistics. It is based on the travelling salesman problem (TSP) [
11], which ensures the minimum transportation time or cost by planning the service sequence of customers. The existing research evolved on the basis of this problem model. Murray and Chu [
12] proposed a collaborative path-planning model for trucks and drones considering drone service range and load capacity constraints. In this work, they reported two new variants of the traditional TSP problem, the flying sidekick travelling salesman problem (FSTSP) and the parallel drone scheduling travelling salesman problem (PDSTSP). Yurek and Ozmutlu [
13], Freitas and Penna [
14], and Mbiadou Saleu et al. [
15] also presented various algorithms for these problems. The above-simplified approaches assumed that the order of customer service at different locations remains consistent with the drone’s service path, while ignoring the problem of safety risks inevitably involved in the actual operation. Inspired by this factor, existing studies have started to consider the risk assessment of drone operations. These mainly include the risk of collision in flight and the impact on the ground.
Falling drones would threaten the safety of pedestrians and vehicles on the ground. Mitici and Blom [
16] proposed a mathematical model for collision probability estimation, which provides a research solution for the collision risk assessment of drones. Bertrand et al. [
17] studied the probability of drone operations threatening road traffic, defined the range of ground a falling drone could affect, and developed a collision probability model to identify high-risk areas in the road network. Koh et al. [
18] and Clothier et al. [
19] studied the extent of injury to pedestrians struck by drones and proposed weight limits for drones based on the associated injury scales and criteria. Drone aerial collision risks mainly originate from buildings, no-fly zones, unstable weather, and other drones [
20]. To assess the risk of aerial collisions, existing studies have established various collision models, mainly including the REICH model, the EVENT model, and the position probability model based on the concept of position error. The REICH model [
21] lays the foundation of flight safety interval assessment and is mainly applied to assess the risk of collision between two aircraft in parallel flight paths. It finds that the collision probability and relative velocity in each direction determine the flight collision risk. The EVENT model proposed by Brooker [
22] combines radar and controller operations to analyse lateral and longitudinal separation, which can calculate the probability of collision risk in each direction. The probabilistic model based on position error focuses on collecting and processing information about the positioning error and trajectory deviation of the drone, in order to predict the probability of the flight trajectory conflicting with the risk area [
23].
Based on the conflict risk assessment research, most research on drone path risk mitigation aims to find no-conflict paths. One intuitive approach is geometry-based. The closest proximity point approach is used to solve the potential conflict warning problem by measuring the position between two drones, thus avoiding collision risk and ensuring the safety of the planned path [
24,
25]. As an improvement to the geometric method, Fan et al. [
26] and Tang et al. [
27] introduced artificial potential fields (APF) and simulated the environment by designing virtual attractive and repulsive potential fields for autonomous guidance of the drone to avoid obstacles. Driven by efficiency, many researchers have tried to use heuristic search to find the optimal no-conflict path. For example, a node-based optimal algorithm is a special form of dynamic programming. When a map or graph is already constructed, they first define a cost function, and then search each node and arc to find a path with minimum cost. It mainly includes the A* algorithm [
28], Lifelong Planning A* (LPA) [
29], Theta* [
30], Lazy Theta* [
31], D*-Lite [
32], Harmony Search [
33], etc. Evolutionary algorithm, which contains genetic algorithm [
34], memetic algorithm [
35], particle swarm optimisation [
36], ant colony optimisation [
37], and shuffled frog leaping algorithm [
38]. The evolutionary algorithm starts by selecting randomly feasible solutions as the first generation. Then, taking the environment, drone capacity, goal, and other constraints into consideration, the planner evaluates the fitness of each individual. In the next step, a set of individuals is selected as parents for the next generations according to their fitness. The last step is a mutation and crossover step and stops the process when a pre-set value is achieved. The best fitness individual is decoded as the optimal path. Recent studies have treated drones as intelligent agents for stochastic dynamic threats in urban environments and used reinforcement learning to guide drones to avoid collisions [
39,
40,
41].
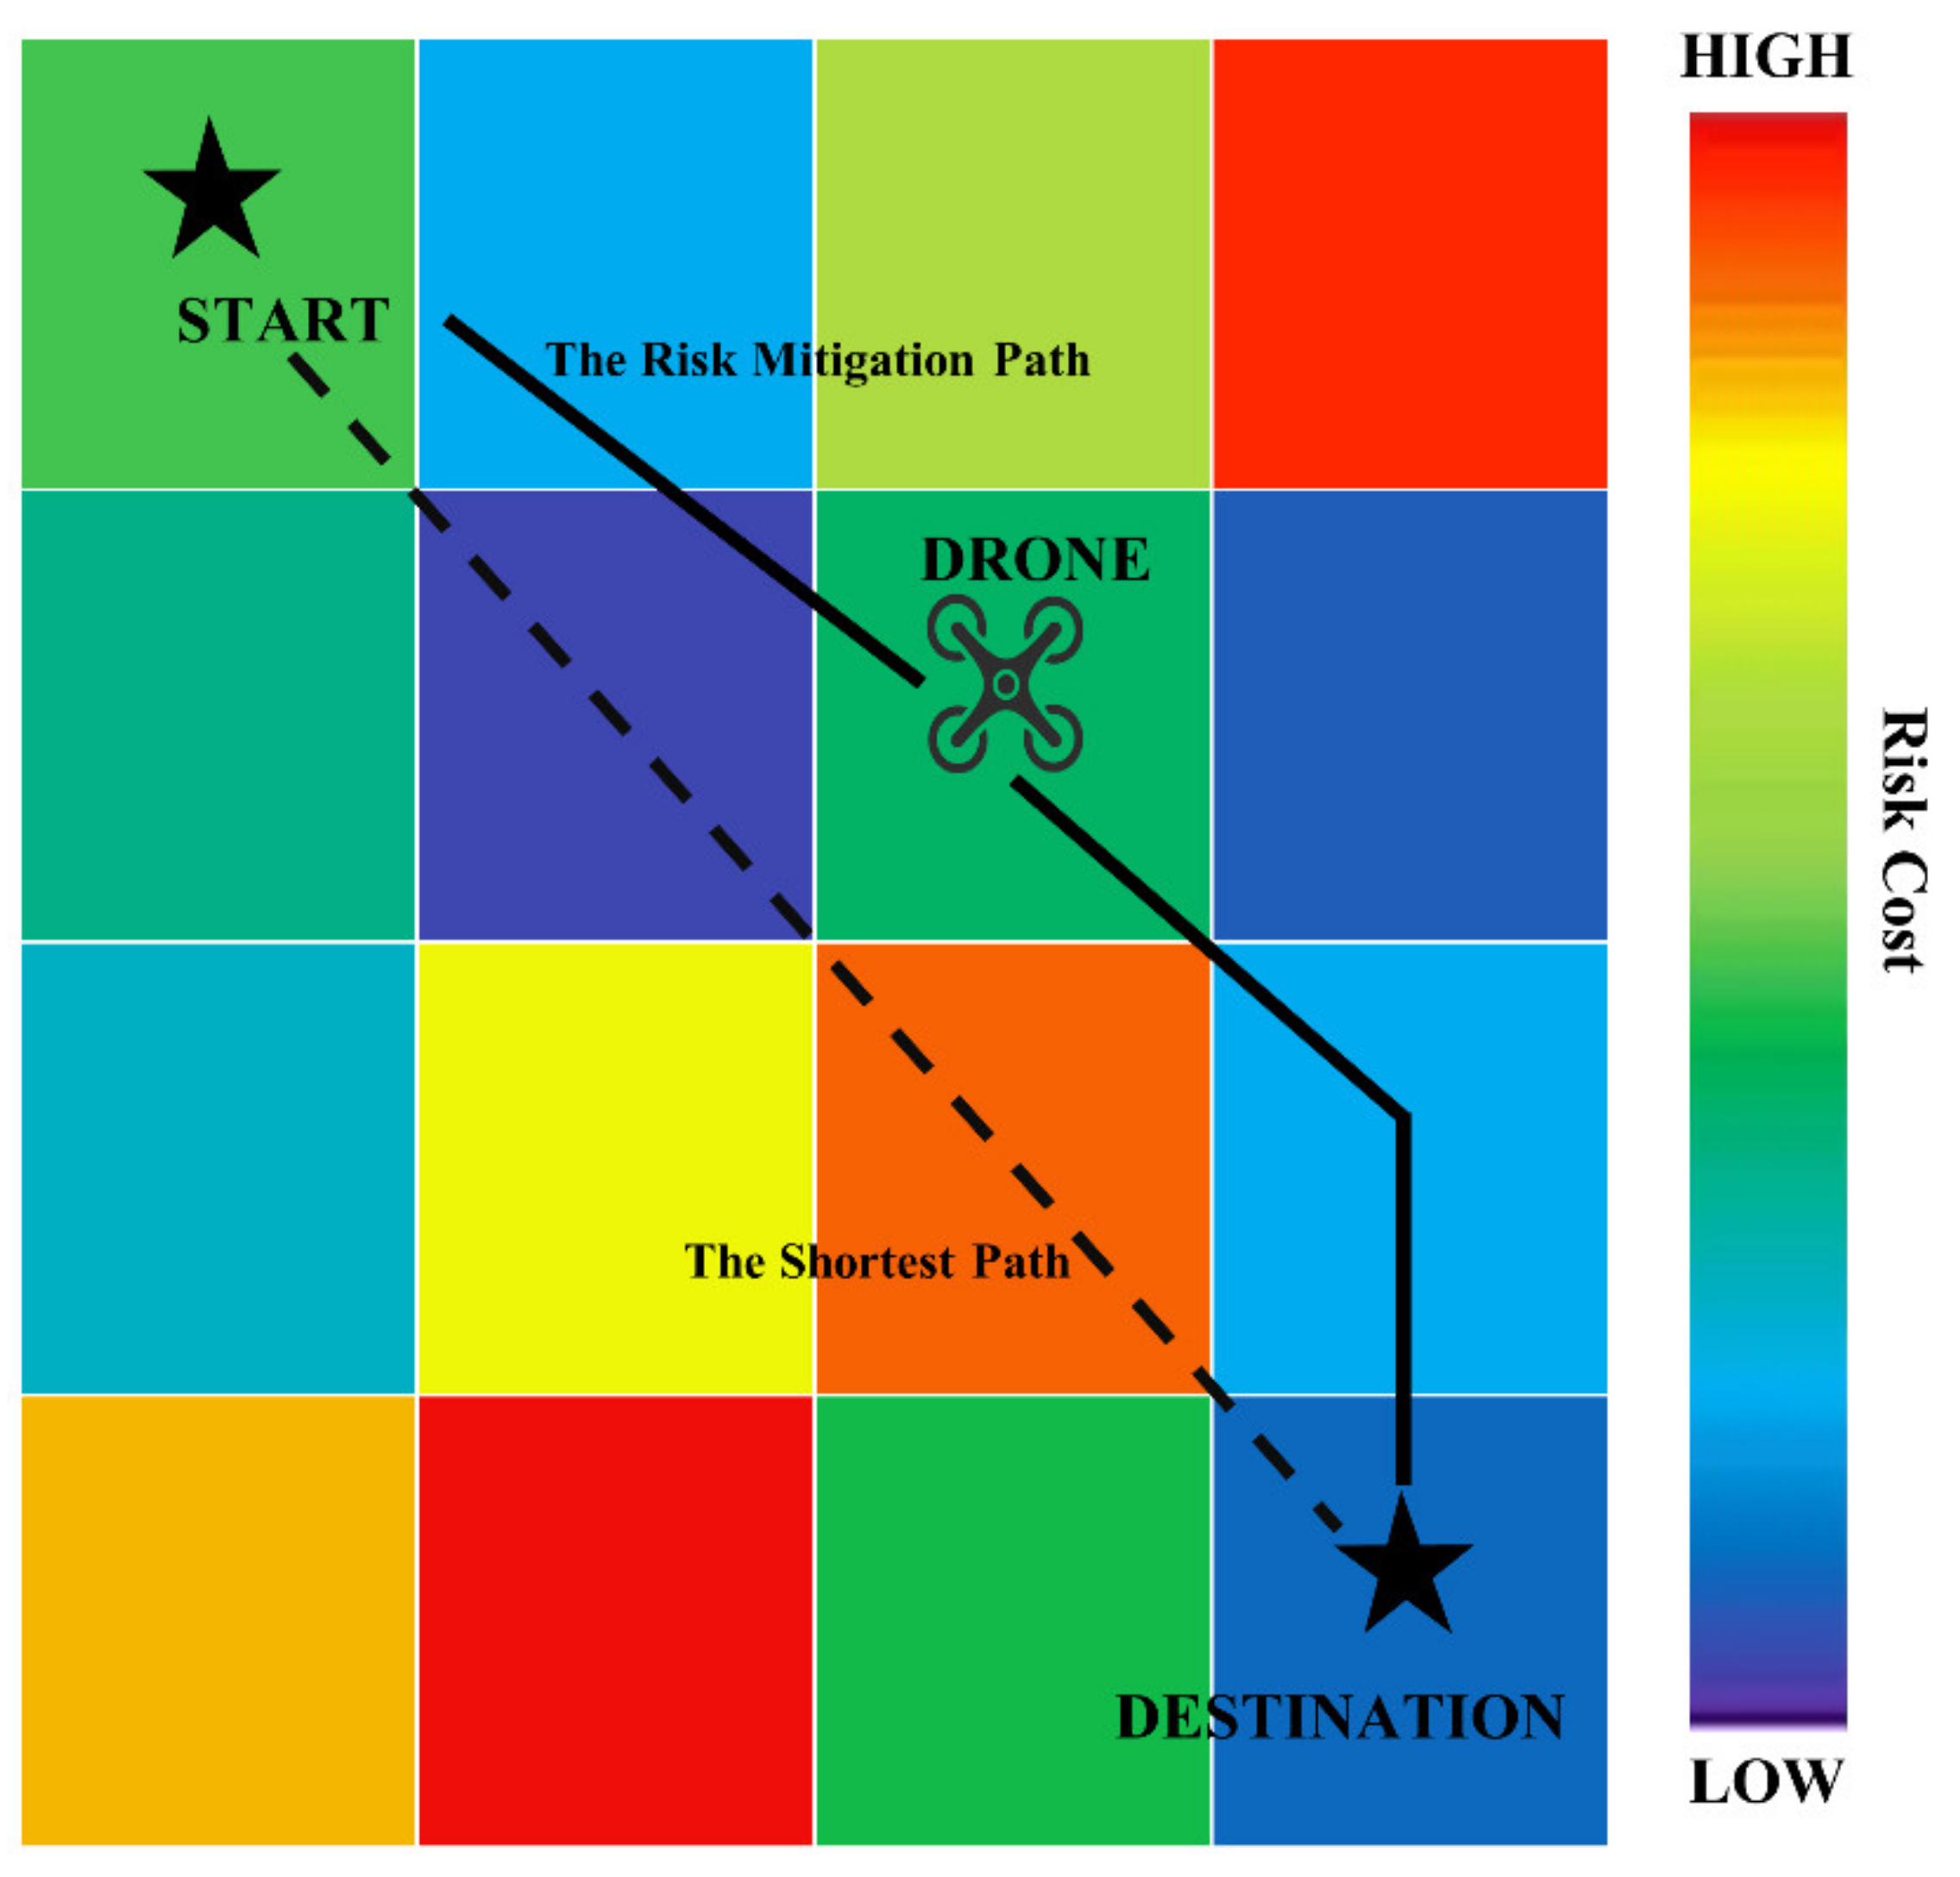
Nevertheless, it is still an open problem for drone logistics to plan effective service paths in complex urban environments and ensure service completion based on reducing the threat to pedestrians, vehicles, buildings, etc. Many works focus on only considering obstacles in the environment during the finding phase of collision-free paths, while little attention has been paid to the fact that the risk cost from the threat is simultaneous with the service benefit of providing services to customers. To address the shortcomings in the above studies, we propose an urban environment model considering the coupling effect of customer service requirements and complex risks and develop a path point search strategy for improving the exploration of feasible paths in the environment. We summarise the main contributions of this paper as follows.
- (1)
We studied the complex risk factors of drone operation in urban environments and established a risk quantification model, which considers three primary risk sources in urban environments, including pedestrians, vehicles, and buildings.
- (2)
We established a logistics service benefit quantification model and proposed a multi-drone path planning method that integrates risk cost and service benefit, with the goal of guiding drones to find a path with the highest service benefit and lowest risk cost under the constraints of flight performance indicators, such as energy consumption and step length.
- (3)
We proposed a path point search strategy to solve a dynamic path planning problem driven by customer demand and risk. The strategy ensures that drones can adjust local paths in dynamic environments through regular global searches.
The rest of this paper is organised as follows:
Section 2 analyses the critical elements affected by drones in the urban environment and illustrates the concept of path planning that combines customer needs and risks. The proposed methodology is described in
Section 3, followed by simulation validations and case studies in
Section 4. The summary of our work is in
Section 5.
4. Results
In order to validate the path planning model coupling risk cost and service benefit, we perform simulations and analyses in a constructed urban environment containing pedestrian risk zones, vehicle risk zones, building risk zones, and logistics customers.
First, the urban environment model is constructed based on the modelling of risk areas and customer demands above. Then, we apply the proposed path search algorithm to search the logistics service path with the lowest risk cost and the highest service benefit.
Based on the above, the effect of risk combinations and the dynamic addition in risk areas are investigated to verify the reliability of the model and algorithm, which can mitigate the three risk costs while ensuring the response to the dynamic environment. Next, sensitivity analysis is conducted for the risk and benefit coefficients to study the balance of risk cost and service benefit in path planning. To evaluate the effectiveness of the algorithm proposed in this paper, the three most critical metrics in logistics path planning, namely, service completion, average path length, and average risk, are considered to compare with the A* algorithm. Finally, simulations and statistical analyses were performed to evaluate the effectiveness of the proposed path planning model for balancing risk cost and service benefit when extended to other urban environments.
4.1. Path Planning for Multiple Drones
The urban environment model proposed in this paper includes pedestrian risk, vehicle risk, and building risk, and it is verified that drones can ensure the completion of customer service while reducing the cost of path risk. In this section, the required parameters for simulation experiments are shown in
Table 2 [
46,
53,
54], and the optimisation effect of the model in this study compared with the traditional method is analysed.
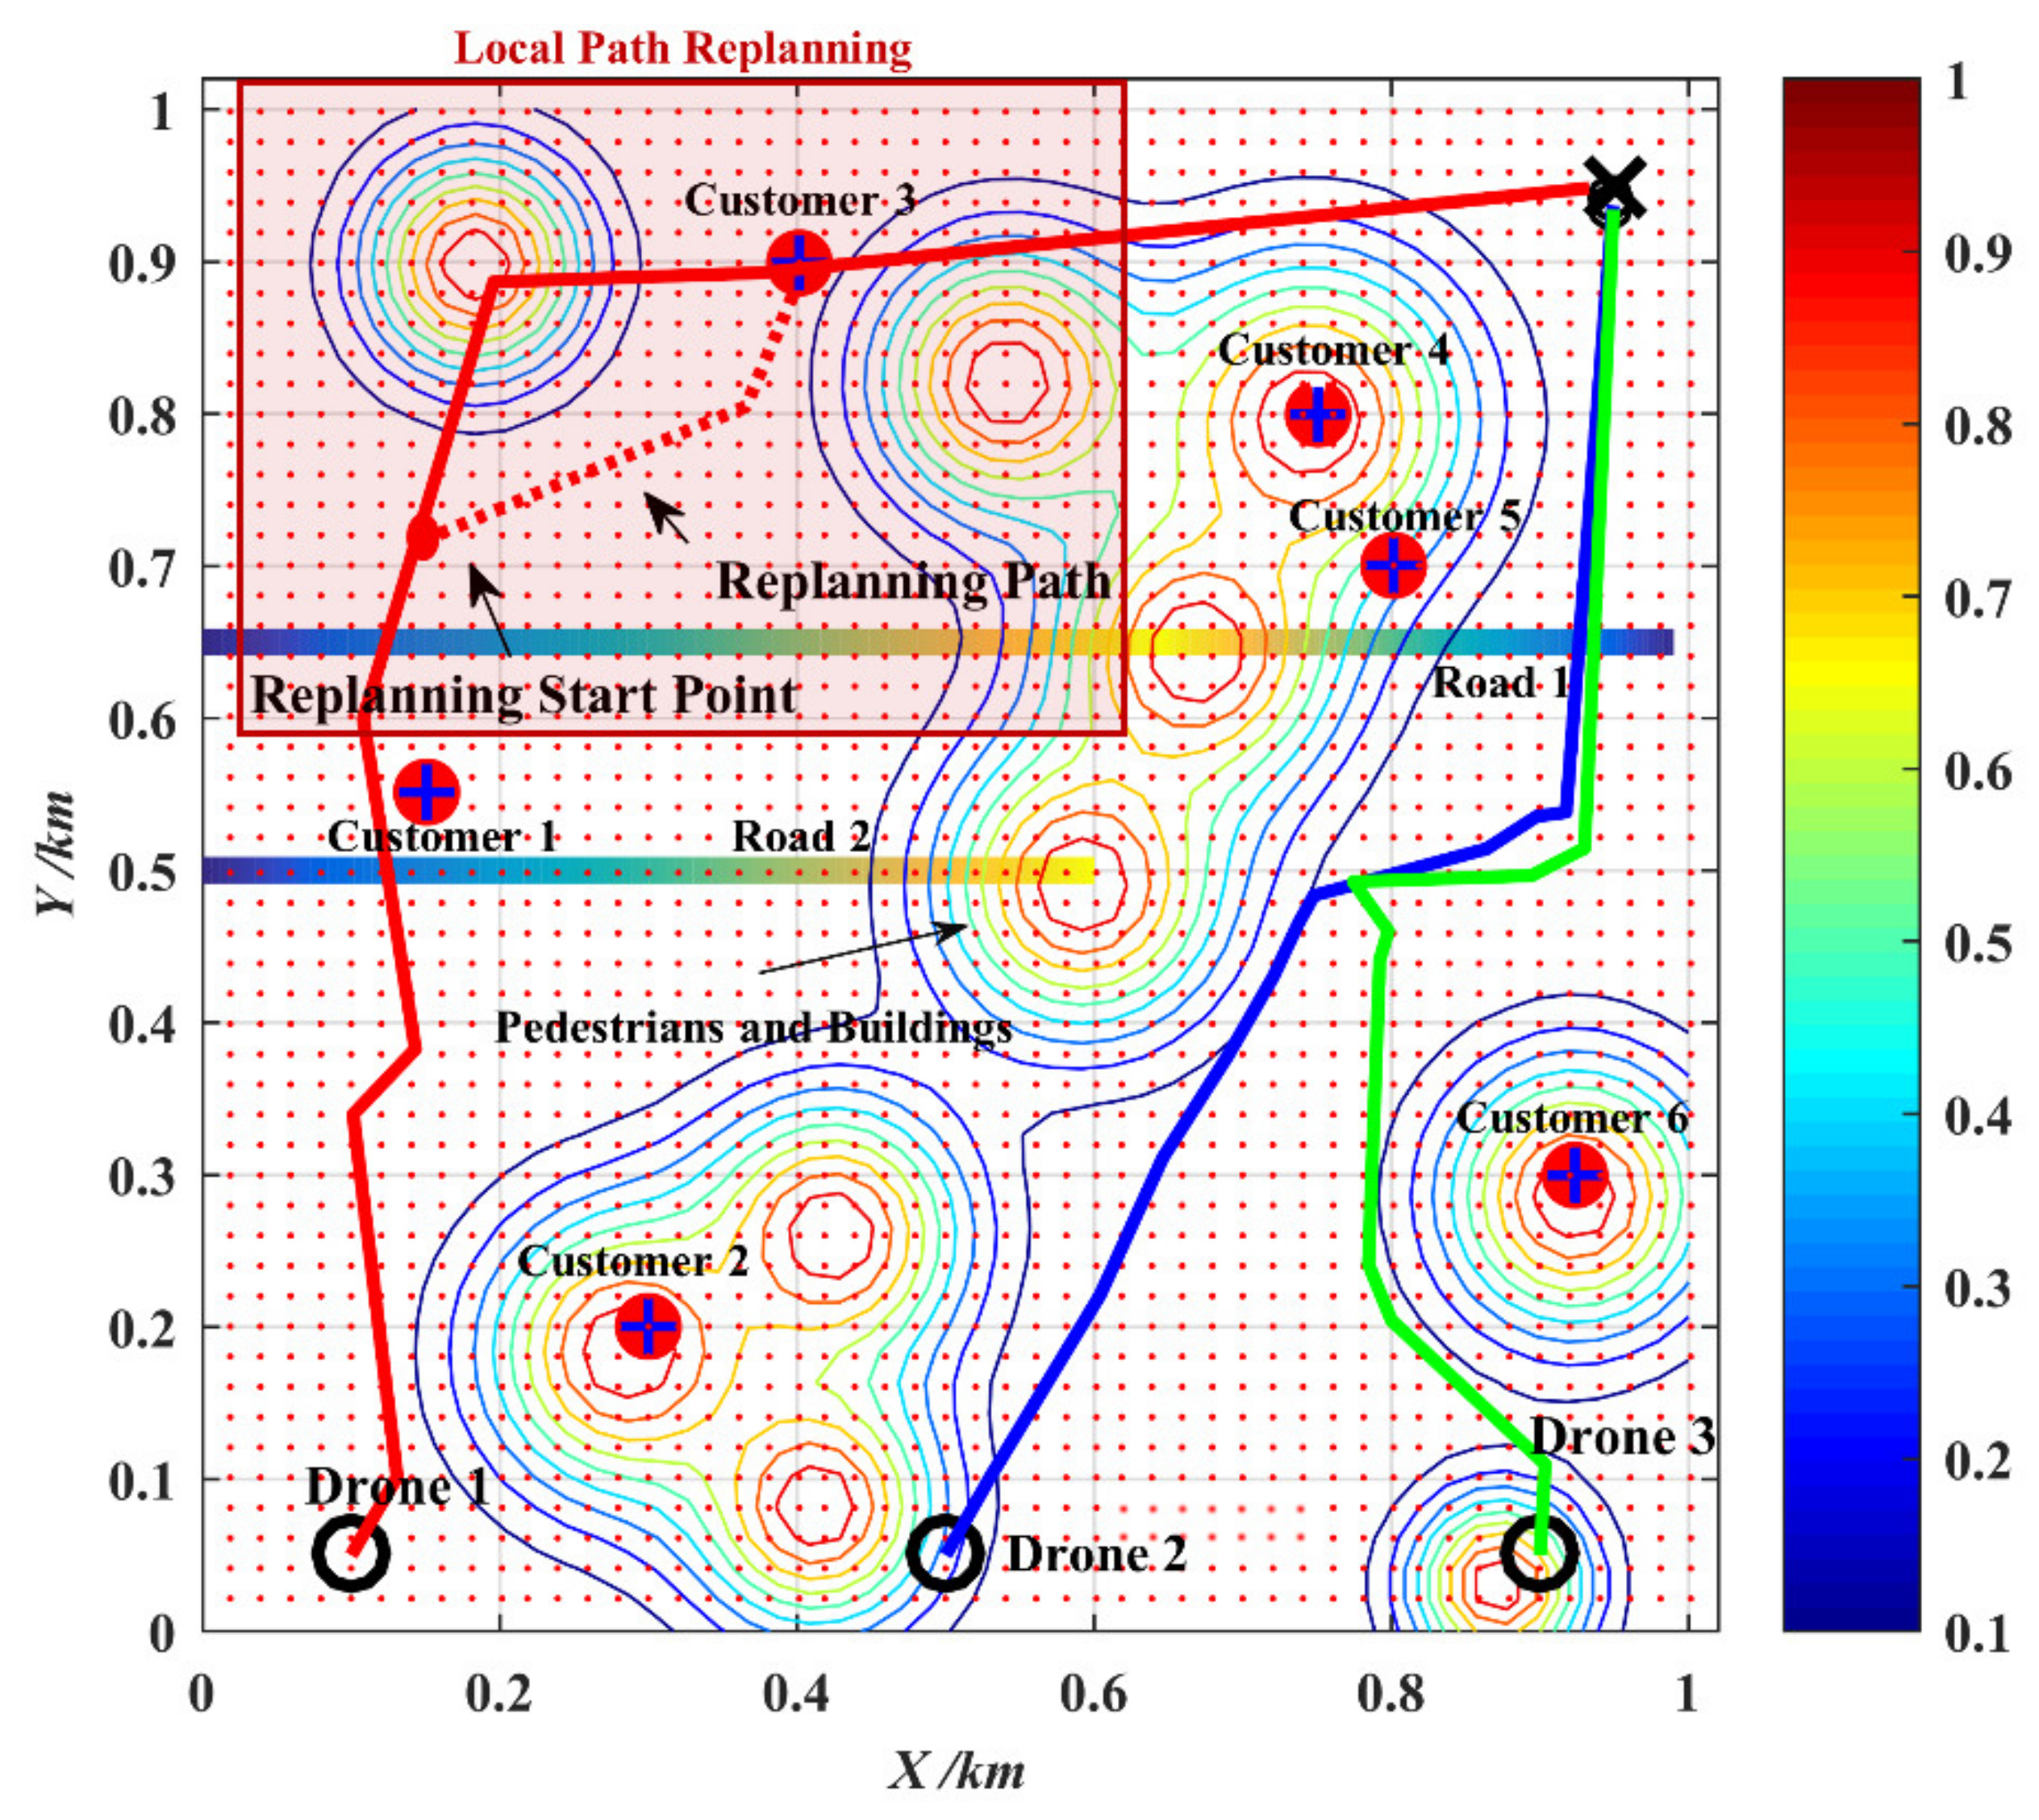
The flight area with a range of 1000 × 1000 m is divided into grids. In the environment model, we assume that the drone starting points are represented by black circles; the endpoint is represented by a black cross; the building risk zones are randomly generated variance ; the crowd risk zones and the road vehicle risk zones are randomly generated risk radius ; the customer zones to be served are assigned random initial demand .
Considering that the size of the drones is much smaller than the size of the grids, in this paper, we use the integral method to obtain the path risk cost, and the calculation result is not affected by the size of the grids and drones. Therefore, the drone is considered a prime point to simplify the calculation. The drone path planning is guided based on the risk cost distribution consisting of pedestrians, buildings, and vehicles in the environment and the service benefit distribution determined by the customer’s location and acceptable service range. The path planning is performed in MATLAB using the algorithm described above. The initial environment modelling and path planning results are shown in
Figure 8. The paths of the three drones departing from different locations are represented by three colours. Path group 1 represents the result of path planning considering the balance of service benefit and risk cost, where Drone 1 serves Customers 1, 2, and 3 according to the solid red path, Drone 2 serves Customers 4 and 5 according to the solid blue path, Drone 3 serves Customers 4, 5, and 6 according to the solid green path. Path group 2 is the path only considering customer service without risk. Path group 3 is the path only considering risk without customer service. The colours in the map show the distribution of risk cost, with red representing areas of high risk cost and blue representing areas of low risk cost. The contour lines represent the distribution of risk cost due to building risk and pedestrian risk, and road 1 and road 2 represent the vehicle risk cost distributed along the road. The specific path parameters are shown in
Table 3.
As shown in
Figure 8 and
Table 3, the result of path planning without considering the risk model (path group 2; no risk considered) traverses the high-risk area to ensure the shortest path to complete the customer service and reach the endpoint, resulting in increased risk cost. The path without considering customer service (path group 3; no customer considered) ignores customers overlapping with the location of high-risk areas for ensuring the shortest length and lowest risk cost path to reach the endpoint. The customers overlapping with high risk cost areas are completely ignored, leading to a decrease in service completion. The model of this paper, which considers both risk avoidance and customer service completion as the driving force, can balance the risk cost and service benefit. Risk cost is reduced by 81.25% compared with path group 2, and service completion is improved by 57.00% compared with path group 3.
4.2. Path Planning with Different Risk Combinations
According to the result in the previous subsection, it can be seen that the model obviously mitigates the risk cost in path planning. However, the comprehensive risk model proposed considers three types of risks: pedestrian, vehicle, and building. The path planning results also are affected to an extent by the difference in risk models.
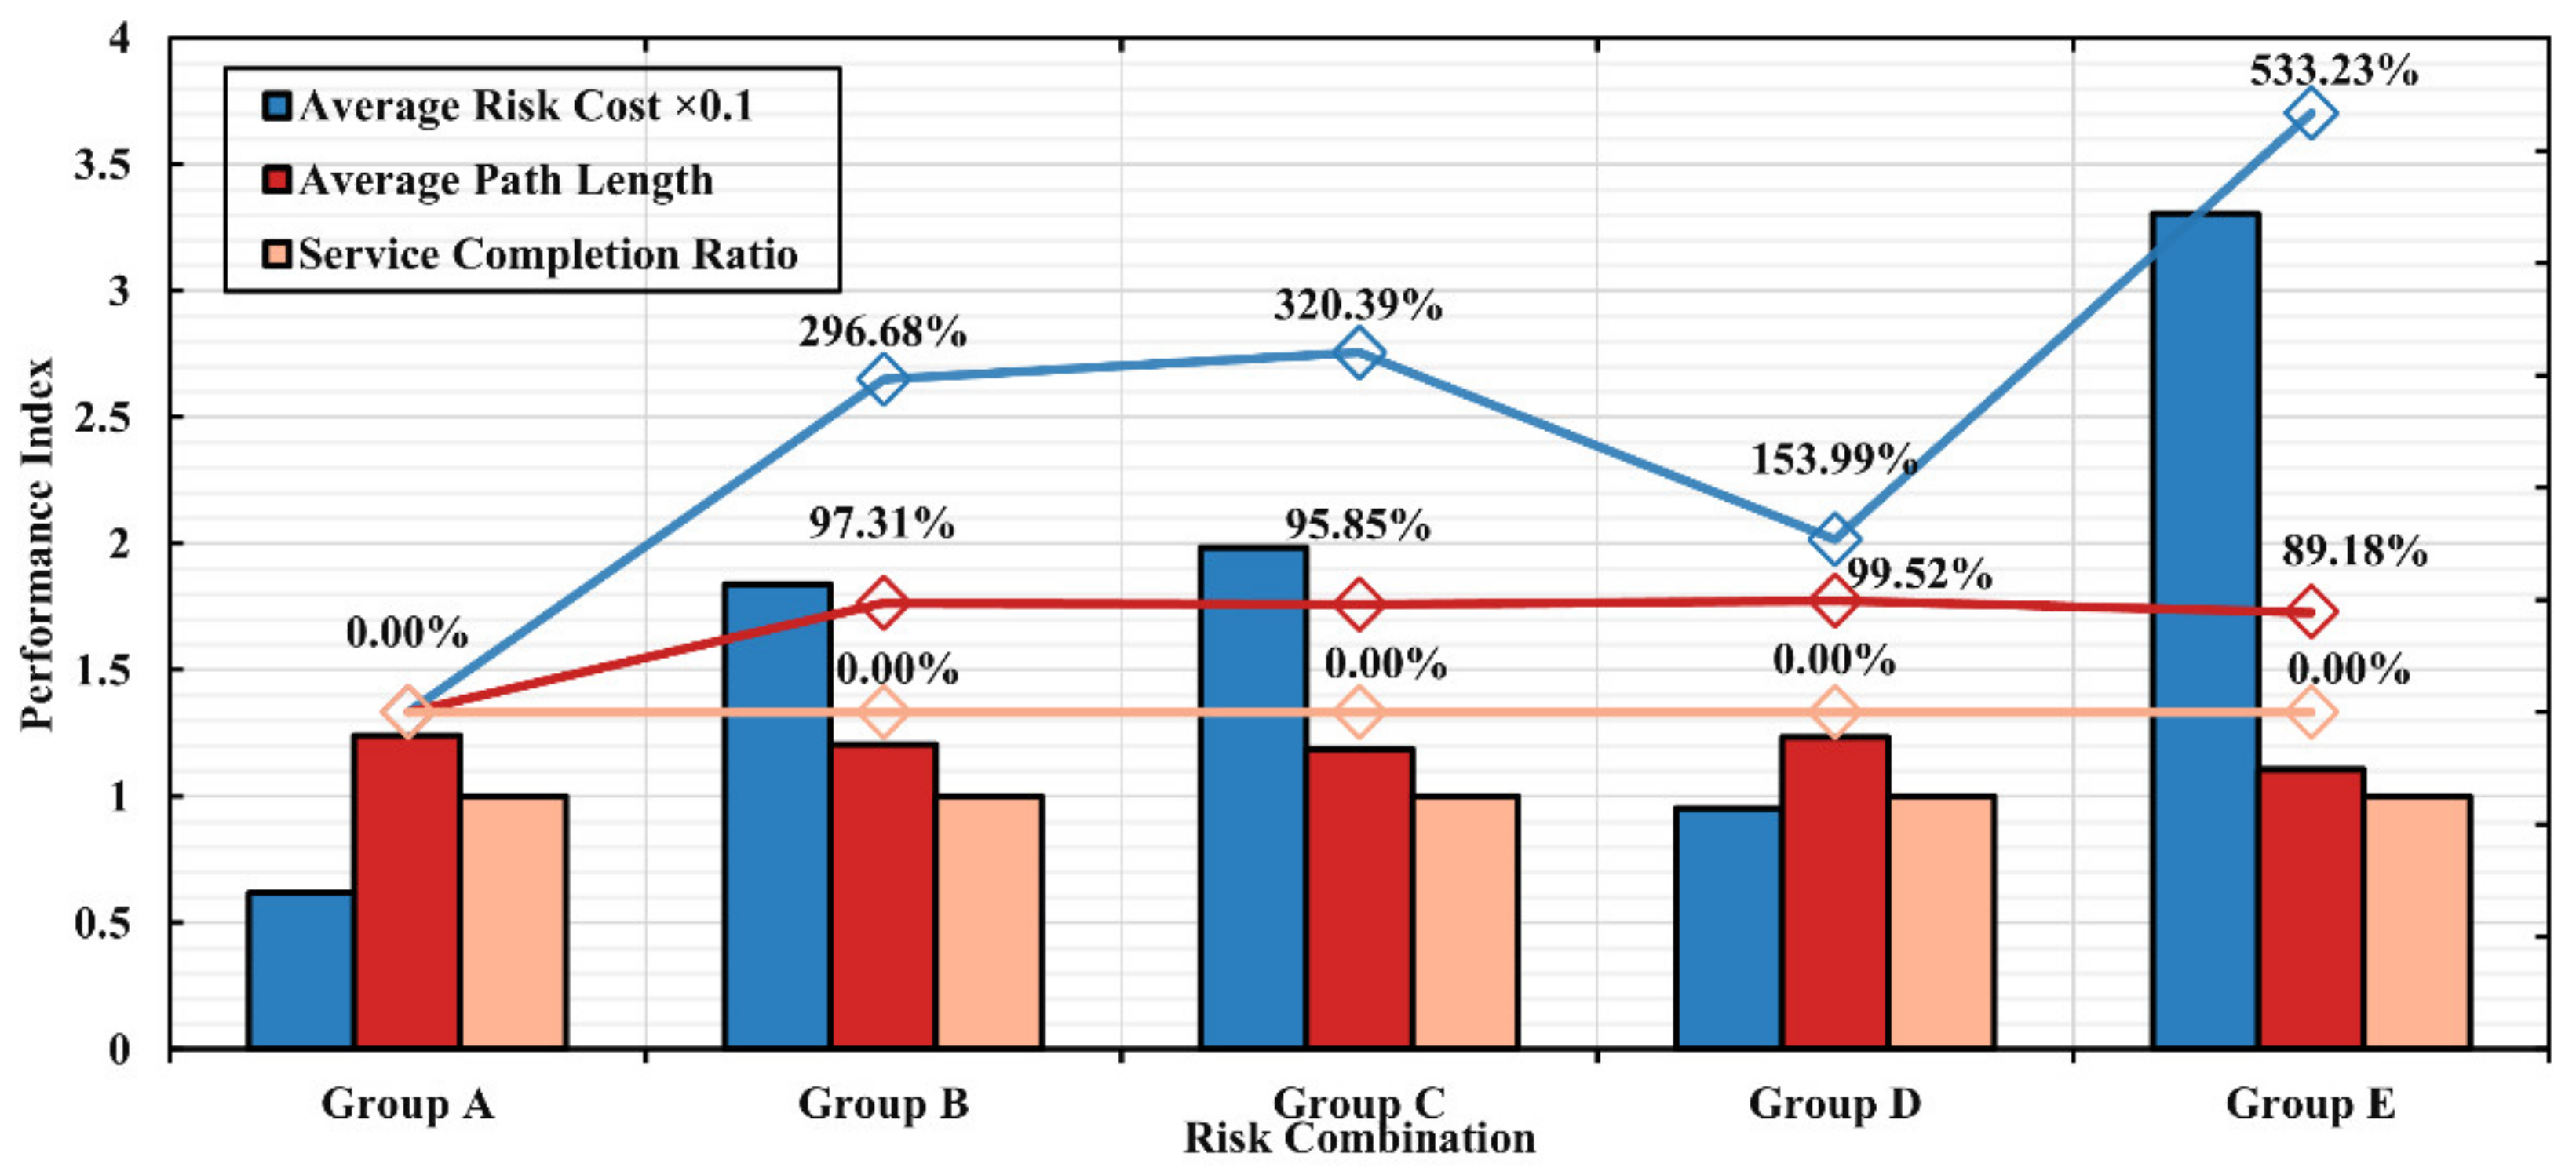
Therefore, further quantitative analysis is required to study the effects of different risk combinations on drone path planning and risk costs in urban environments. This section simulates and studies path planning in the above flight area with four risk combinations: (a) Group A considers three risks, (b) Group B considers pedestrians and buildings, (c) Group C considers buildings and vehicles, (d) Group D considers pedestrians and vehicles, and (e) Group E does not consider risks.
Figure 9 presents the effect of different risk combinations on path planning. Path A has a total risk cost of 6.20. Path E is the worst because it does not mitigate any risks, with 433.23% higher total risk cost than Path A. Path B and Path C have similar results, with Path C being 7.99% higher than Path B due to dense pedestrian areas being more relevant to buildings. The risk cost of Path D increases by 53.99% relative to Path A. Due to the gravity model, the distribution of pedestrians and vehicles is associated with buildings, and disregarding building risks leads to a subsequent small increase in pedestrian and vehicle risks, but this increase is significantly lower than Path B and Path C, where the corresponding risks are not considered.
The average path length is affected by the combination of risks, and Path E has the shortest length without considering risks. Considering all three risk types, the model proposed in this paper only increases the path length by 12.00% over Path E.
For the increase in path length, on the one hand, the 12.00% increase in path length is minimal compared to the 433.23% increase in risk. On the other hand, we add the constraint of drone energy consumption to the path planning model. Although the length of Path A increases, it still completes all customer service requirements and reaches the target point within the energy consumption constraint, indicating that the increase in path length is negligible.
The results show the path planning under different risk combinations to further understand the differences in the various types of risk costs of the path planning results while considering the risk combinations.
This paper investigates each type of risk cost (pedestrian risk cost R1, vehicle risk cost R2, and building risk cost R3) in the above five risk combinations. The results are shown in
Table 4. Path C was planned without considering the risks associated with pedestrians in the environment. The drone path enters dense pedestrian areas, resulting in a pedestrian risk cost R1 of 15.48, which is higher than the case of Path A and Path B, where pedestrian risk is considered. On the contrary, the risk combination considered in Path B includes pedestrian risk, thus avoiding the area with high pedestrian risk costs. However, vehicle risk is not considered, resulting in a higher vehicle risk cost of 14.47. The exclusion of building risk in Path D leads to an increase in building risk by 452.63%.
The gravity model leads to an overlap of the three risk types, which is similarly demonstrated in the variation of the three types of risk cost. Path B ignores vehicle risk, while pedestrian risk and building risk increase respectively by 6.27% and 94.74%; Path C ignores pedestrian risk, but vehicle risk and building risk increase respectively by 16.92% and 573.68%; Path D ignores building risk, and pedestrian and vehicle risk increase respectively by 68.35% and 7.52%. Although Path D ignores the building risk, the drone path does not intrude into the high building risk zones due to the presence of pedestrian risk, so the building risk is reduced by 17.97% compared to Path B. The relevance of the variation in different risk cost types also proves the importance of studying the integrated risk assessment model in this paper.
Path E presents that all three types of risk values are the highest among the five paths due to the correlation of various risk areas in the urban environment, such as the dense distribution of pedestrians and vehicles around the buildings. Therefore, the path planning results without considering any risk, the cost of all three risk categories is higher than the value of the corresponding risk category in any other combination.
For the mitigation effect of each type of risk, comparing Path E with Path A, it is shown that Path E in construction risk is 1.33 and Path A is 0.19, decreasing the risk by about 85.61%. Path E in vehicle risk is 15.11, and Path A is 2.66, decreasing the risk by approximately 82.40%. Path E for pedestrian risk is 16.62, and Path A is 3.35, decreasing the risk by about 79.85%. The total risk is reduced by approximately 81.25%. As a result, the model in this paper has a good mitigation effect on all three types of risks, and the proportion of the three risk reductions is kept at about 80.00%.
We can conclude that more risk sources in path planning can effectively mitigate the total path risk cost. This is because capturing more comprehensive risk sources is beneficial for avoiding more high-risk areas. It also further demonstrates the importance of our analysis and modelling for various types of elements threatened by drones in cities, which can guarantee the effectiveness of capturing risk costs in path planning.
4.3. Temporary Response Effect of the New Risk Area
During the process of drone logistics transportation in urban environments, the obstacles and risk areas in the environment can basically be examined and commanded to go around in the global path pre-planning stage before starting the mission due to the more comprehensive network coverage. However, due to the complexity of the urban environment, it is still challenging to avoid unknown obstacles in advance, such as flocks of birds, which require commanding the drone to change its route to avoid them.
In the path planning algorithm of this study, the drone scans the global environment at each step. Once there are new risk areas that affect the original flight path of the drone, the subsequent path is replanned to ensure that the drone adapts to the dynamic urban low-altitude environment. This section focuses on analysing the effect of the avoidance strategy proposed by the algorithm.
As shown in
Figure 10 and
Table 5, when a new risk area appears at the location of the point (0.2, 0.9), drone 1 moves one step according to the original path and finds that the subsequent original path passes through the new high risk cost area, so a local path replanning is performed to avoid the new risk area. The red dashed line in
Figure 10 represents the locally replanned path of drone 1, and the solid red line indicates the original path. The solid blue line indicates the path of drone 2, the solid green line indicates the path of drone 3. As the new risk zone does not affect the original paths of drone 2 and drone 3, the paths of these two drones do not change. For analysing the impact on drone 1, which was replanned to avoid the new risk zone, we further compared and analysed the path parameters. The path length of drone 1 increased from 1.62 of the original path to 1.69, and the growth rate was 4.32%. The path risk cost was affected by the new risk zone, which increased from 5.20 to 5.22, with a growth rate of 0.35%. The service completion was always 100%, indicating that the path length increase was negligible. It is clear that the avoidance strategy proposed by the algorithm allows the drone to change the original path before entering the new risk zone. It could ensure that the risk cost from the new risk zone is mitigated and the increase in path length is minimal.
In order to further study new risk zones, this paper investigates the effect of the number of new risk zones on the path planning results. As shown in
Figure 11, the length of path 1 increased by about 3.99% on average with the addition of each new risk area, the service completion always remained at 1, and the path risk cost increased by about 0.30% on average.
In summary, the temporary response of the algorithm to new risk zones can reduce new risk costs on the basis of service completion. The avoidance strategy is influenced by the time when the risk zone is discovered. The above discussed that a new risk zone is discovered before the drone enters that risk zone. Because the avoidance strategy requires the drone to scan and judge whether there is a new risk zone once in each step, it can guide the drone to update the next path point in time to avoid the risk zone. In the case that the drone has already entered the new risk zone when it is found, it is obvious that the drone will change the next path point according to the strategy, thus leaving the risk zone with the shortest distance. This case does not need to be discussed.
4.4. Sensitivity Analysis on Coefficients
After the above analysis, it can be seen that the model in this paper has a good effect on mitigating the path risk cost based on the assurance of service completion. Trade-off effects of service benefits and risk costs will be discussed in this part. In the model, the parameter
determines the priority for the service, thus affecting service completion. When
has a fixed value, a larger
makes the drone more inclined to satisfy more customers, and the drone will bear more risk costs and path lengths due to the overlap of customer locations and risk areas. On the contrary, a smaller
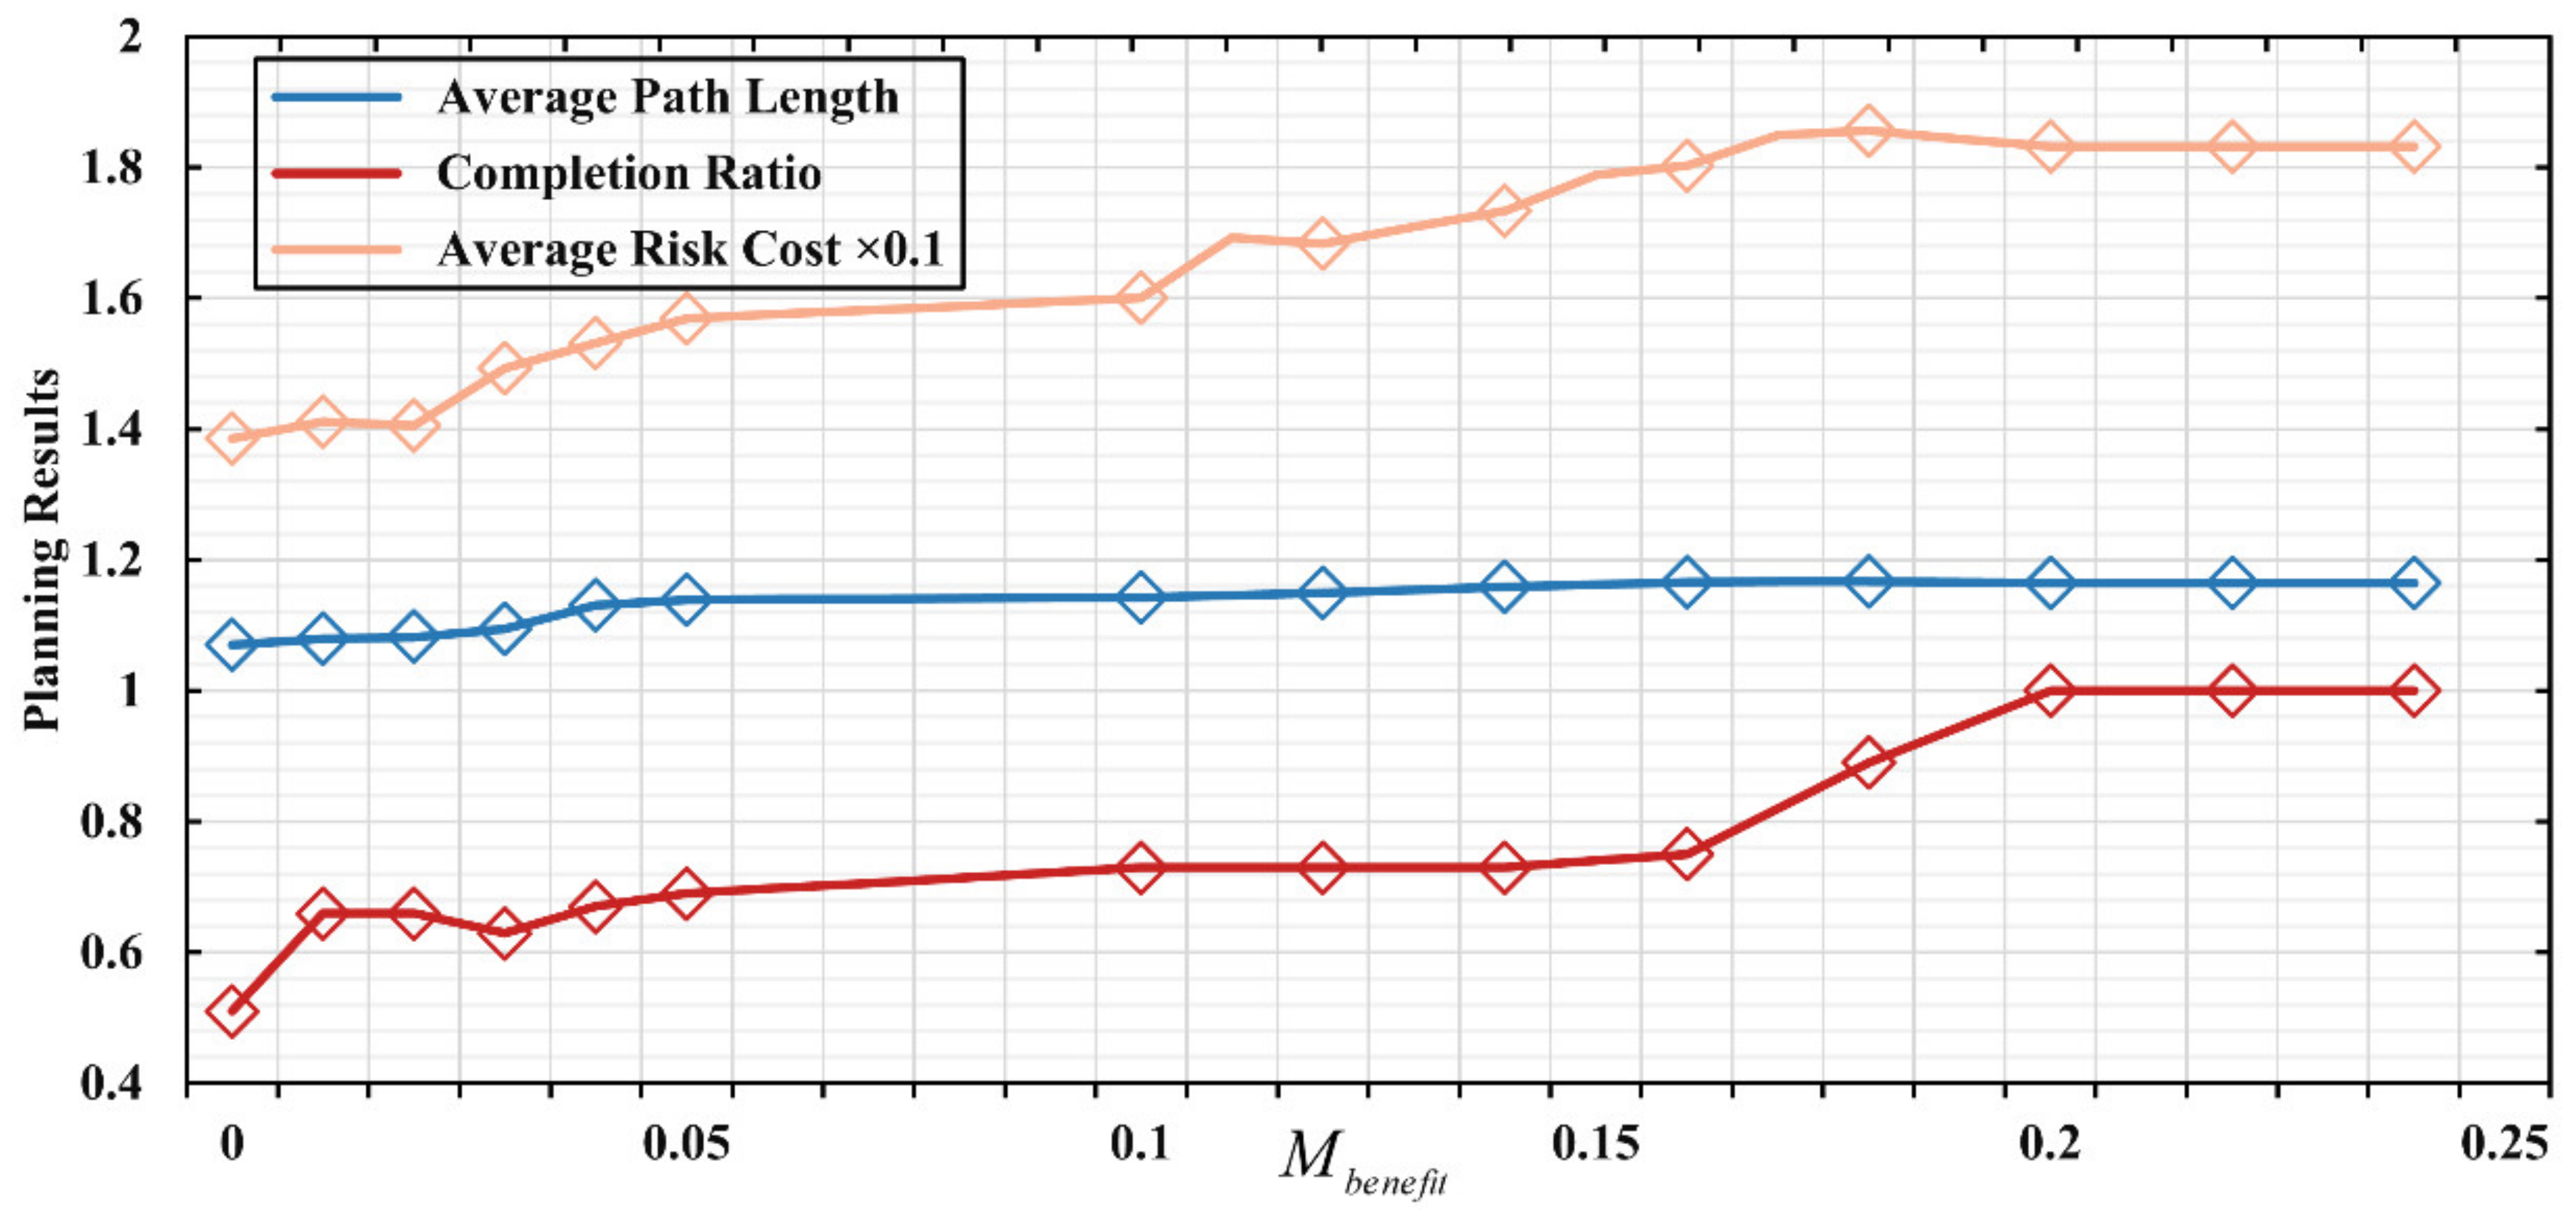
means that the drone will ignore some customers but reach the destination directly with a shorter path and lower risk cost. As shown in
Figure 12, service completion and average risk will increase with the increase of
.
Since is the coefficient of customer service benefit, its change had the most significant impact on service completion among the three indicators, which was 0.51 when and increased to 1 when with a growth ratio of 49%; while the average path length increased from 1.07 to 1.165 with a growth ratio of 8.87%; the average path risk increased from 1.385 to 1.832 with a growth ratio of 32.27%.
Average path length and average path risk increased much less than service completion. Due to the increase in , drones tend to complete more services, resulting in the drones needing to detour farther to reach the customer service area. The path risk also increased due to the overlap of customers and risk areas. However, since the minimisation objective in this paper’s model includes path length and risk cost, this constraint ensures that the path length and risk cost remain stable when customer service completion increases rapidly. It can be found that our model achieves a flexible balance of service benefit with risk and path cost by adjusting .
Similar to parameter , controls the drone’s tolerance for risk. When increases, drones are more inclined to avoid the risk zone to reduce path risk, which leads to a rapid decrease in the average risk. The average path risk decreases by 79.09%, with a 52.90% decrease from to and a 26.19% decrease from to . Customer service completion remained at 100% when . Due to the overlap between customer location and risk area, when , the coefficient of risk cost was much higher than customer service benefit, drones tended to avoid risk instead of serving customers in the risk area, leading to a decrease in customer service completion rate, which decreased by 25% when .
With the increase of
, drones tend to move away from the risk area, leading to an increase in path length. Due to customer demand, the drone still needs to enter the customer area while avoiding the risk area, so the path length grows faster with an increase of 16.37% when
. In the stage of
to
, the influence of the customer is significantly weaker than the risk area, which can be proved by the 25% drop in demand completion analysed above. A sufficiently large
value made the drone less likely to extend the detour distance, which can be demonstrated by the average risk value decreasing by 26.19% from
to
, which is about 50% less than
to
. The reasons mentioned above eventually led to a significant slowdown in the growth of drone path length, which increased by only 0.5% from
to
. The results for the parameter
are shown in
Figure 13.
According to the analysis of the above results, it is evident that the adjustment of the coefficients and changes the preference for risk and benefit in path planning, which leads to significant differences in the parameters of the planning results (average path length, service completion ratio, average risk cost). It also further demonstrates the importance of our proposed path planning approach that considers balancing risk cost and service benefit, which can reflect the process of completing customer service while avoiding risks in the actual operation of logistics drones.
Another critical parameter affecting drone paths in complex urban environments is the acceptable service range for customers. Due to the fact that customer locations often overlap with high risk cost areas such as buildings, pedestrians, and vehicles, part of the customer demand may be discarded if the acceptable service range decreases and the drone path needs to traverse more high-risk cost areas to complete the service. Therefore, we further analyse the impact of acceptable service range on path planning results.
According to the results shown in
Table 6, it can be seen that as the acceptable service range decreases, the overall service completion decreases significantly due to balancing the risk cost and service benefit, and the path risk cost will decrease due to ignoring some customers. The acceptable service range decreases from 200 m to 100 m, and the service completion decreases by 57.00%, while the average path risk cost only increases by 12.26%. This is because the reduction of the acceptable service range causes the drone needs to traverse more high-risk cost areas to complete the service, which is detrimental to the goal of balancing risk cost and service benefit, so the drone discards part of the customer requirement. When
, only the service to Customer 2 was dropped due to balancing risk cost and service benefit, so service completion decreased. However, providing service to Customers 4, 5, and 6 leads to a 5.97% increase in risk cost due to the reduction in the acceptable service range.
The variation of completion degree in customer demand shows that the reduction of the acceptable service range does not affect the completion degree for Customers 1 and 3, which do not overlap with the high-risk cost area. Meanwhile, Customers 2, 4, 5, and 6, which overlap with high-risk cost areas, were not served. The comparative experimental results of adjusting the risk cost preference parameter also demonstrate that the purpose of discarding some customer demands is to balance the service benefits and risk costs. For the case that the acceptable service range was 100 m, the drone path accepted a higher risk cost when ; thus, Customers 4, 5, and 6 that were not served at could be served, and the service completion was improved to 90%. While path risk costs increased by 83.06% due to serving customers whose acceptable service ranges overlap with high risk cost areas.
In summary, it is important to improve the acceptable service range of customers for logistics drone risk management. Logistics drone companies also need to adjust the risk cost and service benefit preferences according to the acceptable service range and customers’ location in order to ensure service quality.
4.5. Algorithm Effectiveness Comparison
We propose path point generation rules with an exploration strategy to adapt the scenario for multi-drone logistics operations in urban environments and verify the effectiveness of our algorithm in this section. The A* algorithm [
55] is a standard algorithm for path planning by limiting the selectable actions of drone movements. We consider that both the A* algorithm and the algorithm proposed in this paper are node-based optimal algorithms, while the A* algorithm performs local merit by limiting the candidate nodes at the current location when selecting the next location. The algorithm in this paper is a global merit algorithm that selects any point within the map in the form of probability by setting heuristic factors. So, we take the A* algorithm as the benchmark for comparison, which is a more relevant comparison. In addition, we choose the genetic algorithm as another comparison algorithm because it treats paths as individuals and selects individuals with higher fitness through the calculation of individual fitness functions. This approach is consistent with the global merit strategy for node search, and the comparison shows the effectiveness of the method in this paper more clearly.
Based on the A* algorithm, at each step of path planning, a drone can choose among one of a fixed number of equally distributed directions to move one unit step. In our experiments, we set up eight directions for drones and thus have eight candidate nodes
for a drone to choose from at each step. To apply the A* algorithm in the constructed environment, it is required to specify the cost-benefit function of performing an optional action at the current location, as shown in Equation (24)
where
is the current position,
is the candidate point specified for the next step,
is the Euclidean distance between
and
,
and
are risk cost and service benefit consistent with the previous definition.
For genetic algorithms, we need to specify the calculation of individual fitness, as shown in Equation (25)
where
is the
-th path individual,
is the path length of individual
,
is the total path risk cost of individual
,
is the remaining customer demand after the drone provides service by path,
is the initial total customer demand,
is the benefit of the service completed by path
.
According to the comparison with the results of the genetic algorithm, the quality of the results obtained by the algorithm in this paper is basically consistent with the method of directly generating the overall path. There was a difference in path length of about 2% and a difference in risk cost of about 5%. The similarities in the values and trends of the results demonstrate that applying the global merit strategy in the node search process can improve the quality of the results. Service completion is the most important index to measure the result of logistics service path planning in a complex urban environment. As shown in
Table 7 and
Table 8, compared with the A* algorithm, the service completion of our algorithm is significantly higher, with an improvement of 20–40%. The path planning results of the algorithm in this paper have a slightly higher average risk than the A* algorithm. While the difference between the two algorithms’ path lengths remains between 1 and 2%, proving that the increase in risk basically comes from the existence of an overlap between the customer location and the risk area.
The mentioned indexes show that the proposed search rule promotes the drone’s exploration of the environment compared to the A* algorithm. Furthermore, the shortest path could be found based on the guarantee of completing the service. In addition, the algorithm can flexibly respond to the change of risk factor k, which ensures the risk tolerance of drones. It avoids the situation that the original algorithm cannot complete the path planning in the complex environment.
As increased significantly, the drone was more sensitive to risks in the environment. This is equivalent to a more complex risk area in the environment, which requires more detours to avoid, and the A* algorithm fails to find a valid path and deadlocks in this situation. The path search rule proposed in this study still guarantees 100% service completion, while the average path length and average risk have a smooth change. It indicates that the solving ability of our algorithm is still acceptable.
As for the benefit coefficient , the search rule proposed in this study can better show the change in the preference for customer demand. The service completion was 100% when , which increased by 34% compared with , and remained at 100% completion. For the A* algorithm, when , the service completion was 61%, with an increase of 16%, indicating that the A* algorithm is worse in response to the demand factor . The main reason for this difference is that the path search rule proposed in this paper can guarantee a comprehensive exploration of the environment.
4.6. External Validity Analysis
The effectiveness of the proposed path planning model needs to be validated in balancing risk costs and service benefits when extended to other urban environments. In this work, external validity is performed, and 100 different urban environments are randomly generated.
Randomly generated pedestrian density and vehicle density were in the range
[
56]. The buildings in all environments had randomly generated variance
. The flight area range was
and was divided into
grid areas. We set up the customer area to be served and assigned a random initial demand of
. The results of path planning without considering risk and the cost-benefit model proposed in this paper were calculated separately in 100 independent environments. The path risk costs obtained from these two methods were compared to demonstrate the risk mitigation effect of the model in this paper. The total risk cost for each simulation is shown in
Figure 14. Among the 100 generated samples (urban model), the average customer service completion rate of the paths planned by the model in this study reached 98.68%, and all showed good risk mitigation effects.
To test the effectiveness of risk mitigation, the results were further statistically analysed to calculate the percentage of risk mitigation at the 95% confidence level. Two sample groups were considered, the risk-mitigated group (Group 1) and the risk-unmitigated group (Group 2). There were 100 samples within each group. Due to the large sample size
, a normal distribution could be used to calculate confidence intervals. The results of calculating the sample means (
and
) and sample variances (
and
) for the two groups are shown in
Table 9.
and
are the population means.
is the confidence interval for the risk mitigation effect, where
was estimated by the following equation:
.
The results show the 95% confidence interval for the risk mitigation effect . In any urban environment, path planning with the cost-benefit model proposed in this paper mitigates the average total risk by at the 95% confidence level and can effectively reduce the risk cost of path planning results for all types of urban environments based on customer service completion.

