1. Introduction and Background
Nowadays, Unmanned Aerial Vehicles (UAVs) are employed in several fields [
1,
2], and for this reason Advanced Air Mobility (AAM), also known as Urban Air Mobility (UAM), is expected to turn into reality in the near future. Currently, there are UAV applications in different fields such as smart agriculture, emergency and detection of buildings, bridges and other objects [
3,
4,
5,
6]. Moreover, UAM services for passengers—performed by electric vertical take-off and landing (eVTOL) aircraft—and freight transport, or some other services such as medical aid, are under development [
7,
8,
9,
10,
11,
12]. The use cases reported above are only a limited number of UAM application opportunities, but they have attracted the interest for AAM services by many stakeholders. For instance, in the Italian context, UAM services have been considered by the Italian Civil Aviation Authority (ENAC) as a relevant opportunity for civil aviation development [
13], and a roadmap to develop UAM passenger services before 2030 has been set. In Europe, public acceptance regarding AAM services has been analysed in a European Union Safety Agency (EASA) report, which points out the importance of operations for medical aid and drone delivery applications as emerged by users’ opinions [
14].
Most parts of the research efforts on UAM topics are focusing on prototype development [
15], but in order to implement an effective UAM service it is necessary to focus on a number of additional aspects, including management of the low airspace, ground facility location and integration with the existing transport systems. Cooperating UAVs or eVTOLs—hereafter named Aerial Cooperative Vehicles (ACVs)—will have to carry out their functions in the low airspace (around 1200 ft), i.e., in the ICAO class G [
16], which is currently uncontrolled. Consequently, the implementation of a traffic management system in the Class G airspace is essential to ensure safe and efficient ACV flows—both manned and unmanned. Despite the existence of the air traffic management (ATM) system for traditional aviation, which provides a good basis for the development of a similar system in the lower space, there are technical and management problems to be solved to integrate the UAM system into the current urban multimodal system due to the heterogeneous characteristics of the urban airspace environment.
The National Aeronautics and Space Administration (NASA), in the USA, introduced a Concept of Operations (ConOps) to set safe procedures for Unmanned Aerial Systems (UAS) in the airspace organization, and then UAS Traffic Management (UTM) systems [
17,
18] have been described. UTM aims to allow safe and successful operations in the low airspace by achieving services such as airspace dynamic configuration, dynamic geo-fencing, weather information, route planning and flight separation [
19]. Also in Europe, the U-space concept is being developed with the same goal, i.e., to support low-altitude air traffic management [
20] and integrate it with current air traffic. A limited number of studies concerning a framework to develop aspects such as the organization and safety of this emerging transportation system have been proposed [
21,
22,
23], but the research in this field is still evolving.
Another relevant factor for UAM service development is related to ground infrastructures, also called
vertiports, which are aerial–ground interchange nodes. Municipalities that want to ensure a successful UAM system should carefully identify the suitable number and location of vertiports that have to be placed in a certain urban area [
24]. Moreover, it is important to consider that the introduction of vertiports in urbanized areas would modify the city accessibility and lead to changes in the urban structure [
25]. In the literature, some methods have been discussed to locate vertiports as near as possible to people’s trip origins and destinations [
26,
27]. Other studies focus on the minimization of travel times and costs [
28], whereas other approaches consider several variables such as the socioeconomic and environmental features of the study area [
29]. Solving the vertiport location problem requires a large amount of information (also updated in real time, if possible), concerning both infrastructural and organizational aspects.
The use of a digital twin of the urban area can help finding solutions by taking into account most of the features considered above, both for introducing urban aerial networks and for establishing vertiport locations.
A digital twin can be defined as the digital model of a physical system that is regularly updated by the exchange of information between virtual and physical systems. In recent years, technological innovations have transformed the way to study and simulate processes and systems. Digital twins are a core part of this improvement, and they can be used to simulate, design and process several application scenarios [
30]. The digital twin approach has already been explored to test, simulate, design and plan new solutions in the transport field, such as operations of Connected Autonomous Vehicles (CAVs) [
31] or airport operations [
32,
33], as well as to recreate a virtual population in order to realize agent-based simulations [
34]. To the best of the authors’ knowledge, this is the first paper that explicitly introduces a digital twin model for designing and developing UAM applications, such as vertiport location problems, airspace and air vehicle management. More specifically, the purpose of this paper is to outline a novel framework that aims to improve the use of the digital twin as a tool for developing UAM systems integrated with existing ground transportation systems. A digital twin can be useful to identify the positioning of vertiports—which requires specific conditions—by incorporating a dedicated air network to identify flight paths suitable for ACVs. The paper also proposes a 3D aerial network model, which would benefit from the digital twin model of the urban environment for setting effective and safe air services. In particular, a simulation scenario in a real-world context is reported to show how the digital twin framework would operate to identify vertiports and air corridors on which to set UAM services.
The paper is organized as follows.
Section 2 provides the methodological scheme of the paper.
Section 3 aims to detail the digital twin concept by referring to the example of the digital twin of a real city (Bologna, in northern Italy).
Section 4 provides the possible application of a digital twin for the vertiport location problem, while
Section 5 discusses airspace management issues. Finally,
Section 6 contains the discussions and the conclusions.
3. Digital Twin Perspectives for Transport System Simulations
The employment of digital twin approaches to simulate processes and evolutions of territorial realities has becoming more and more usual, with the aim of describing in a quantitative and detailed way the physical world to simulate and predict the effects of actions. The concept of digital twin was first formalized by Grieves [
35] for some industrial contexts, but it is now used in several other fields such as road infrastructures [
36], harbours [
37], boats [
30] and other civil sectors [
38] to evaluate noise and air pollution, solar potential, and the effects of future urban development [
39], or for simulating, planning and managing urban transportation networks [
40,
41].
Digital twins of complex systems, such as urban environments, could be fed by off-line data and/or data collected in real time, depending on the aim. With respect to a simple 3D urban model based only on geometrics data, the digital twin of an urban environment considers socio-economic and anthropic information that may be obtained by official sources (e.g., municipalities) or specific surveys—such as population and job densities, median income, working places, recreational areas, building type and points of interest. Such data require only periodic (not real time) updates. On the contrary, some other data—such as traffic flows, pollution levels, traffic noise and meteorological conditions—have to be collected in real time by sensors located suitably in the urban area.
A digital twin model could also be useful for the analysis and simulation of transportation systems that do not currently exist, such as UAM systems in metropolitan areas. In this perspective, the digital twin model may be applied to identify and evaluate the suitable areas for locating UAM ground infrastructures (i.e., vertiports) and also to run realistic simulations and to establish urban air corridors in the lower airspace for ACVs operations. Further details on these two aspects are provided in the following sections.
It worthwhile noting that the amount of gathered information related to the city characteristics affects the UAM scenarios that can be developed. The basic information useful for the vertiport positioning—particularly locations and also integration with ground transportation systems—and to identify aerial corridors in the lower airspace, both size and direction, are:
Digital Terrain Model (DTM);
Building height;
Intended use of the building (or building type, such as schools, hospitals and churches);
Socioeconomic variables (e.g., population density, workplaces, leisure spaces);
Ground transportation infrastructures (e.g., roads, rails, terminals);
Places where people can gather (e.g., stadium, main squares, pedestrian areas).
The use of these variables to locate vertiports and aerial corridors will be discussed in detail in the next sections.
As an example for the application of the proposed framework depicted in
Figure 1, the digital twin model of the city of Bologna has been realized. Bologna is located in northern Italy, with a population of almost 390,000 inhabitants. Some characteristics that may represent relevant challenges for the introduction of UAM services are: (i) the relevant number of medieval towers in the 3D city centre (see the digital twin model in
Figure 2); (ii) the land morphology, i.e., the northern part of the city is on a flat area, while the southern one is placed on a hilly surface (see
Figure 3). These characteristics, which introduce a high number of obstacles for ACVs operations and vertiport location, make the city of Bologna an interesting case study.
To realize the city digital twin, a GIS tool has been used to merge and process a high amount of information that has been gathered by different sources (i.e., municipalities and cadastral data). In this first attempt, the model is based on freely available data. First, a DTM for the entire city was used as a base. Data on buildings such as height, type (e.g., schools, hospitals, churches, sport and leisure facilities), shape and size have been collected and added together with information on population density referring to the different city districts. Green areas such as parks have been modelled explicitly because they are places where people group. The main ground transportation infrastructures (roads, railways), the public transport stops and the airport area have then been added to the city model. Finally, uncovered rivers or streams have been included because ACVs could overfly them to minimize the risk of collision.
Figure 3 shows a graphic representation of the city digital twin, included the DTM on the background, where buildings are in red, roads and railways are in light blue and blue, respectively, and parks are in green. More data, included real time data, may be included depending on availability.
4. Vertiport Location
Vertiports are important infrastructures of UAM systems, and their location plays a crucial role for the development of the entire 3D-UAN in a given area. The location of vertiports depends on a wide range of factors, which include: (i) existing/planned obstacles, which have to be avoided by ACVs; (ii) available space, depending on vertiport layout; (iii) procedures, which are required to set suitable connections between the ground and the aerial transportation networks; (iv) ground travel times (accessibility); (v) externalities produced in the neighbourhood.
In the European context, the first regulation for vertiport design and placement has been published by EASA [
42]. However, it mainly focuses on vertiport design and only takes into account the potential obstacles for ACV flight procedures in urban area. In the Cologne Airport case study [
43], considerations such as the ones in the EASA report on obstacle clearance have been used to identify potential vertiport locations. The
Geofences data, i.e., virtual volumes around obstacles (such as buildings) set to avoid collisions, especially for high urbanized cities, are considered among the most important ones to support obstacle avoidance by ACVs and vertiport design suitability [
44]. Furthermore, as in current airport plan procedures, analyses of wind intensity and direction as well as externalities produced by noise emissions are considered main criteria to identify vertiport localization [
45]. As for this latter, some studies suggest placing vertiports next to roads, railways or airports [
29] or in cloverleaf interchanges [
46] to reduce noise impacts. In the European context, people seem worried about UAM safety and noise pollution, which might represent a relevant limit to implement UAM services in the EU [
14].
The proximity between vertiports and the main ground transportation nodes could be an important element to guarantee a good connection between the ground and aerial transportation networks, which is a successful element for the introduction of UAM services [
47]. Other features that have been explored to choose vertiport locations involve rooftop flatness and its shape and size. As an example, these analyses, coupled with the socio-economic data of the study area, have been carried out for the city of New York [
48], whereas other applications—such as for Munich and Los Angeles—mainly focus only on the socioeconomic characteristics of the area [
29].
In some other analyses, obstacles or other physical hindrances have not been considered, while the aim has been to optimize some variables under specific criteria. For example, some studies have developed optimization algorithms to place vertiports in order to minimize the total travel time [
49,
50], maximize the number of passengers that can use UAM services [
51,
52], maximize the service provider revenues [
51] and maximize the travel time saving [
53].
All the studies cited above consider, in turn, only a limited number of variables useful to identify vertiport locations. However, an effective vertiport location based on several points of view requires a holistic approach that takes into account the different aspects, such as urban environment, rules and impacts.
From this perspective, a digital twin of a city could give significant support to design, place and manage vertiports as it contains detailed information that allows one to identify space occupancy, obstacle clearance, acoustic impacts and accessibility to ground services, but also potential demand based on socio-economic features as well as limitations for safety and security issues. In more detail, information on building heights allows the identification of potential spaces for locating vertiports, or, on the contrary, the areas that cannot be used for this aim. Similarly, obstacles (e.g., antennas) would prevent the use of such areas for locating vertiport. At the same time, population density, position of interchange ground nodes and suitable socio-economic indexes (e.g., high-income areas) would facilitate the identification of spaces potentially allocable to host vertiports. Integrating socio-economic and trip data, in particular concerning passengers’ origin and destination points inside the study area, is useful for optimal vertiport positioning.
High-density areas associated with high-income, which are attractive for starting UAM services and then locating vertiports for accessing such services, generally correspond to densely urbanized areas, where space is rarely available. Furthermore, space availability does not refer simply to the area occupied by the vertiport infrastructure, but also to a suitable volume around it for allowing safe landing and take-off manoeuvres. The advantage of the digital twin city in this context is to use multi-criteria approaches for identifying vertiport location also facilitated by the visual representation.
Finally, externalities generated by the vertiport can be assessed based on some aerial traffic hypotheses. Moreover, as the vertiport will be accessed mainly by ground transportation modes, additional externalities due to the multi-modal ground transportation systems can be considered and estimated—e.g., noise impacts, which is the most perceived one by the population, can be assessed, and it might represent another criterion used to identify the optimal vertiport location with respect to residents.
As an example,
Figure 4 reports a preliminary solution—still referring to the city of Bologna—where the vertiport location has been identified based on the information of its digital twin. Particularly, vertiport suitability has been identified by Fadhil [
29], based on the weighted overlay of different features. In more detail, the suitability,
S, may be defined as [
54]:
where
wi is the weight assigned to factor
i,
Xi is the criterion score of factor
i and
Cj is a constraint. Factors and constraints are identified in the digital twin database of the case study (see also
Section 3); in particular, the main factors are population density, job density, median income, the characteristics of ground transportation and the main point of interests, while the constraints are elements that prevent the location of a vertiport in a given area (e.g., space unavailability, obstacles, proximity to schools, and similar). As for weights, in this first attempt they have been identified based on some preliminary results, also in the work by Fadhil [
29]. The selected factors for the weighted overlay are summarized in
Table 1. A different radius for points of interest with respect to public transport stops—respectively 1000 m and 500 m—has been identified, as points of interest are expected to be less frequent than public transport stops, which generally are 500 m from each other in city central areas.
From Equation (1), a preliminary vertiport location has been found close to the main train station, which is characterized by a large square that would facilitate safe manoeuvres. The identified area is also close to both the city centre, with several points of interest in the surroundings, and an important interchange node, with train and bus services that would improve intermodality between ground and aerial services. It is worth noting that the assigned weights and constrains used in Equation (1) reflect, from one side, the importance given to several factors and from the other side the unfeasibility of some locations based on criteria such as building geofence, obstacles and so on, as it emerges from the digital twin database. The area is also characterized by a high value of population and job density. Although high population and job densities might be considered a constraint for vertiport location, the considered geofence data would guarantee suitable distances from relevant buildings and at the same time a suitable, potential demand for UAM services. Based on the chosen factors, weights and constraints, the airport area, which is also close to the city, has not been identified as a potential solution for locating the vertiport. For example, in this case the population density is not so high as in the city centre, and intermodality is not as relevant as in the location close to the train station.
This brief example has shown how the digital twin framework depicted in
Figure 1 could support the location of vertiports. While this solution has been found by considering simple constraints and weights coming from the literature, more precise solutions may be found by improving the set of data in the digital twin and by adding further constraints related to environmental impacts or minimization of access time to the vertiports, which in this example have not been considered as not all the data were available at this stage. As for environmental impacts in particular, several hypotheses on the expected traffic at the vertiport could provide different solutions, thus also suggesting capacity limits to guarantee good life quality levels to the community living around the vertiport.
Finally, it is worth noting that airports are expected to host vertiports inside or close to their neighbourhood [
55], especially for aerial airport shuttle services. Mainly for airports close to urban areas (city airports)—but generally for airports serving a given territorial system—the digital twin should also include information on aircraft take-off and landing trajectories (and the consequent obstacle limitation surfaces) in order to consider the potential risks due to ACVs movements in airport area and the related possible interferences with traditional aviation.
Geofencing data would also be a suitable solution in this case.
5. Urban Aerial Network Model
Ensuring effective and safe connectivity between trip origin and destination pairs by UAM services requires setting a suitable aerial network where ACVs will move. Particularly, vertiports represent access/egress points of UAM services, landing/take off spaces for ACVs and initial/end nodes of aerial links, which may also be combined for providing more complex aerial routes between some relevant vertiports. As depicted in
Figure 1, the location of vertiports has a direct effect on the urban aerial network that would guarantee the aerial services in the area.
Among the considered factors and constraints, the appropriate location of vertiports also has to take into account the local features of the low airspace—e.g., fixed and dynamic obstacles, climatic conditions, protected zones. Again, the digital twin helps in identifying such aerial routes, which should be suitably high above buildings, natural or artificial obstacles and should guarantee safe flight conditions. In addition to the third aerial dimension, it is necessary to define a structure for the management of routes and in-flight operations. For this purpose, an aerial network model has been proposed in order to enable ACV [
23]—i.e., drones, UAVs, eVTOLs—operations in uncontrolled airspace (class G). This model requires a corresponding set of data that should be included in the digital twin model.
5.1. Main Features of the Aerial Network Model
The aerial network model integrates the concept of dynamic air corridors (e.g., DDCs) [
56] in a multilayer structure [
57] in order to define a three-dimensional graph that involves the vertical dimension for ensuring trips between origin/destination points. Here a 3D-UAN model is proposed, given by the union of bi-dimensional graphs,
GL, in multiple layers,
L, which includes the set of Fixed Nodes (
NF,L), a set of Transition Nodes (
NT,L) and a set of Dynamic Links (
DL) connecting the nodes and the layers.
The 3D Graph (Θ) model [
23] is summarized by the following formulation:
where
.
In more detail, Fixed Nodes correspond to vertiports, which are the access to egress from UAM services, and are located based on the digital twin of the urban system, as described in
Section 3. Transition Nodes are set to allow horizontal crossings and shifting to an upper or lower layer; some of them may be located at the same coordinates as Fixed Nodes, except for the vertical coordinate. Again, the location of Transition Nodes—or just their vertical position if they correspond to Fixed Nodes—is obtained by the digital twin model, particularly by using the information related to height of buildings, potential obstacles, and no-fly zones, among others. Pairs of nodes (both fixed and transition) are connected by Dynamic Links,
dm,L, which belong to the set
DL = {
dm,L} | m = {1, 2…
PL}, where
PL is the total number of links for layer
L. More specifically, the dynamic link set consists of horizontal and vertical link subsets, respectively,
| m = {1, 2…} and
⊂
DL | m = {1, 2…}. Such links are identified by ensuring safe flight conditions with respect to the external features, i.e., urban or extra-urban environment.
The proposed 3D-UAN model also includes a cost function, defined on each link, with the aim of providing minimum cost origin/destination connections, suitable ACV separation and in-flight safety. The following link cost function
has been defined for each link belonging to
DL:
where
j is the
j-th ACV using the dynamic link
dm,L at a given time period;
is the travel time of j on
dm,L;
is the time gap between
j and
j − 1.
Depending on dm,L—horizontal or vertical link—the travel time, , will change. By considering vertical links, if j = 1 the may be climbing () or descent () time depending on the link direction—i.e., to upper layers or to lower layers. If there are several ACVs on the same link, i.e., j > 1, the time gap guarantees suitable separation between two following ACVs along vertical links. For horizontal links, is the running time, , if j = 1, while if j > 1, the time gap guarantees appropriate separation between two following ACVs. To assess the waiting time component, time gap is assigned at a fixed node before ACV departure, to keep safe travel conditions among them.
Equation (3) may be re-written for different types of links as:
Data regarding travel, climbing and descendent times; physical obstacles; day time (related to social economics habits); overflight zones; and environmental conditions—such as wind phenomena or meteorological conditions, which affect flight conditions—should be included in the digital twin model, together with real time information on aerial traffic flows in more advanced versions.
The cost function (4) is used to compute the minimum cost paths that each ACV will use to realize the trip between the origin and destination vertiports, and to ensure appropriate ACV safety separation (defined by
). Shortest paths based on such link cost function may be found by iterative search algorithms—such as Dijkstra [
58] or A* [
59].
Flight operations within the same layer,
L, occur along horizontal dynamic links (connecting fixed and transition nodes) belonging to
Dh,L. The vertical links belonging to
Dv,L guarantee some specific procedures—i.e., landing and take-off operations, as well as layer transitions to/from the upper or lower layers. As for the dynamic nature of both horizontal and vertical links, it consists of enabling/disabling them in compliance with data on environmental conditions and traffic capacity (e.g., operational delays, unfavourable weather conditions). In addition, the features of the dynamic links may change according to ACV size, which requires different features of
dm,L cross sections. For example, large ACVs require a greater distance between the layers and vertical link length increase and changes in transition node positions in order to ensure suitable protection volumes around them [
60].
5.2. Aerial Network Model Simulation Scenario
By considering the digital twin model of the metropolitan area of Bologna—which includes a wider area with respect to the example in
Section 3 and also factors and constraints for implementing the 3D-UAN in the city—three vertiports have been identified (
Figure 5), which are, respectively, at the airport (vertiport 1), at the main station (vertiport 2) and in a city area with high population, job density and median income (vertiport 3). It is worth noting that this result has been obtained by using still freely available data. More accurate results and possibly different vertiport locations and/or number might be obtained by using a more detailed database.
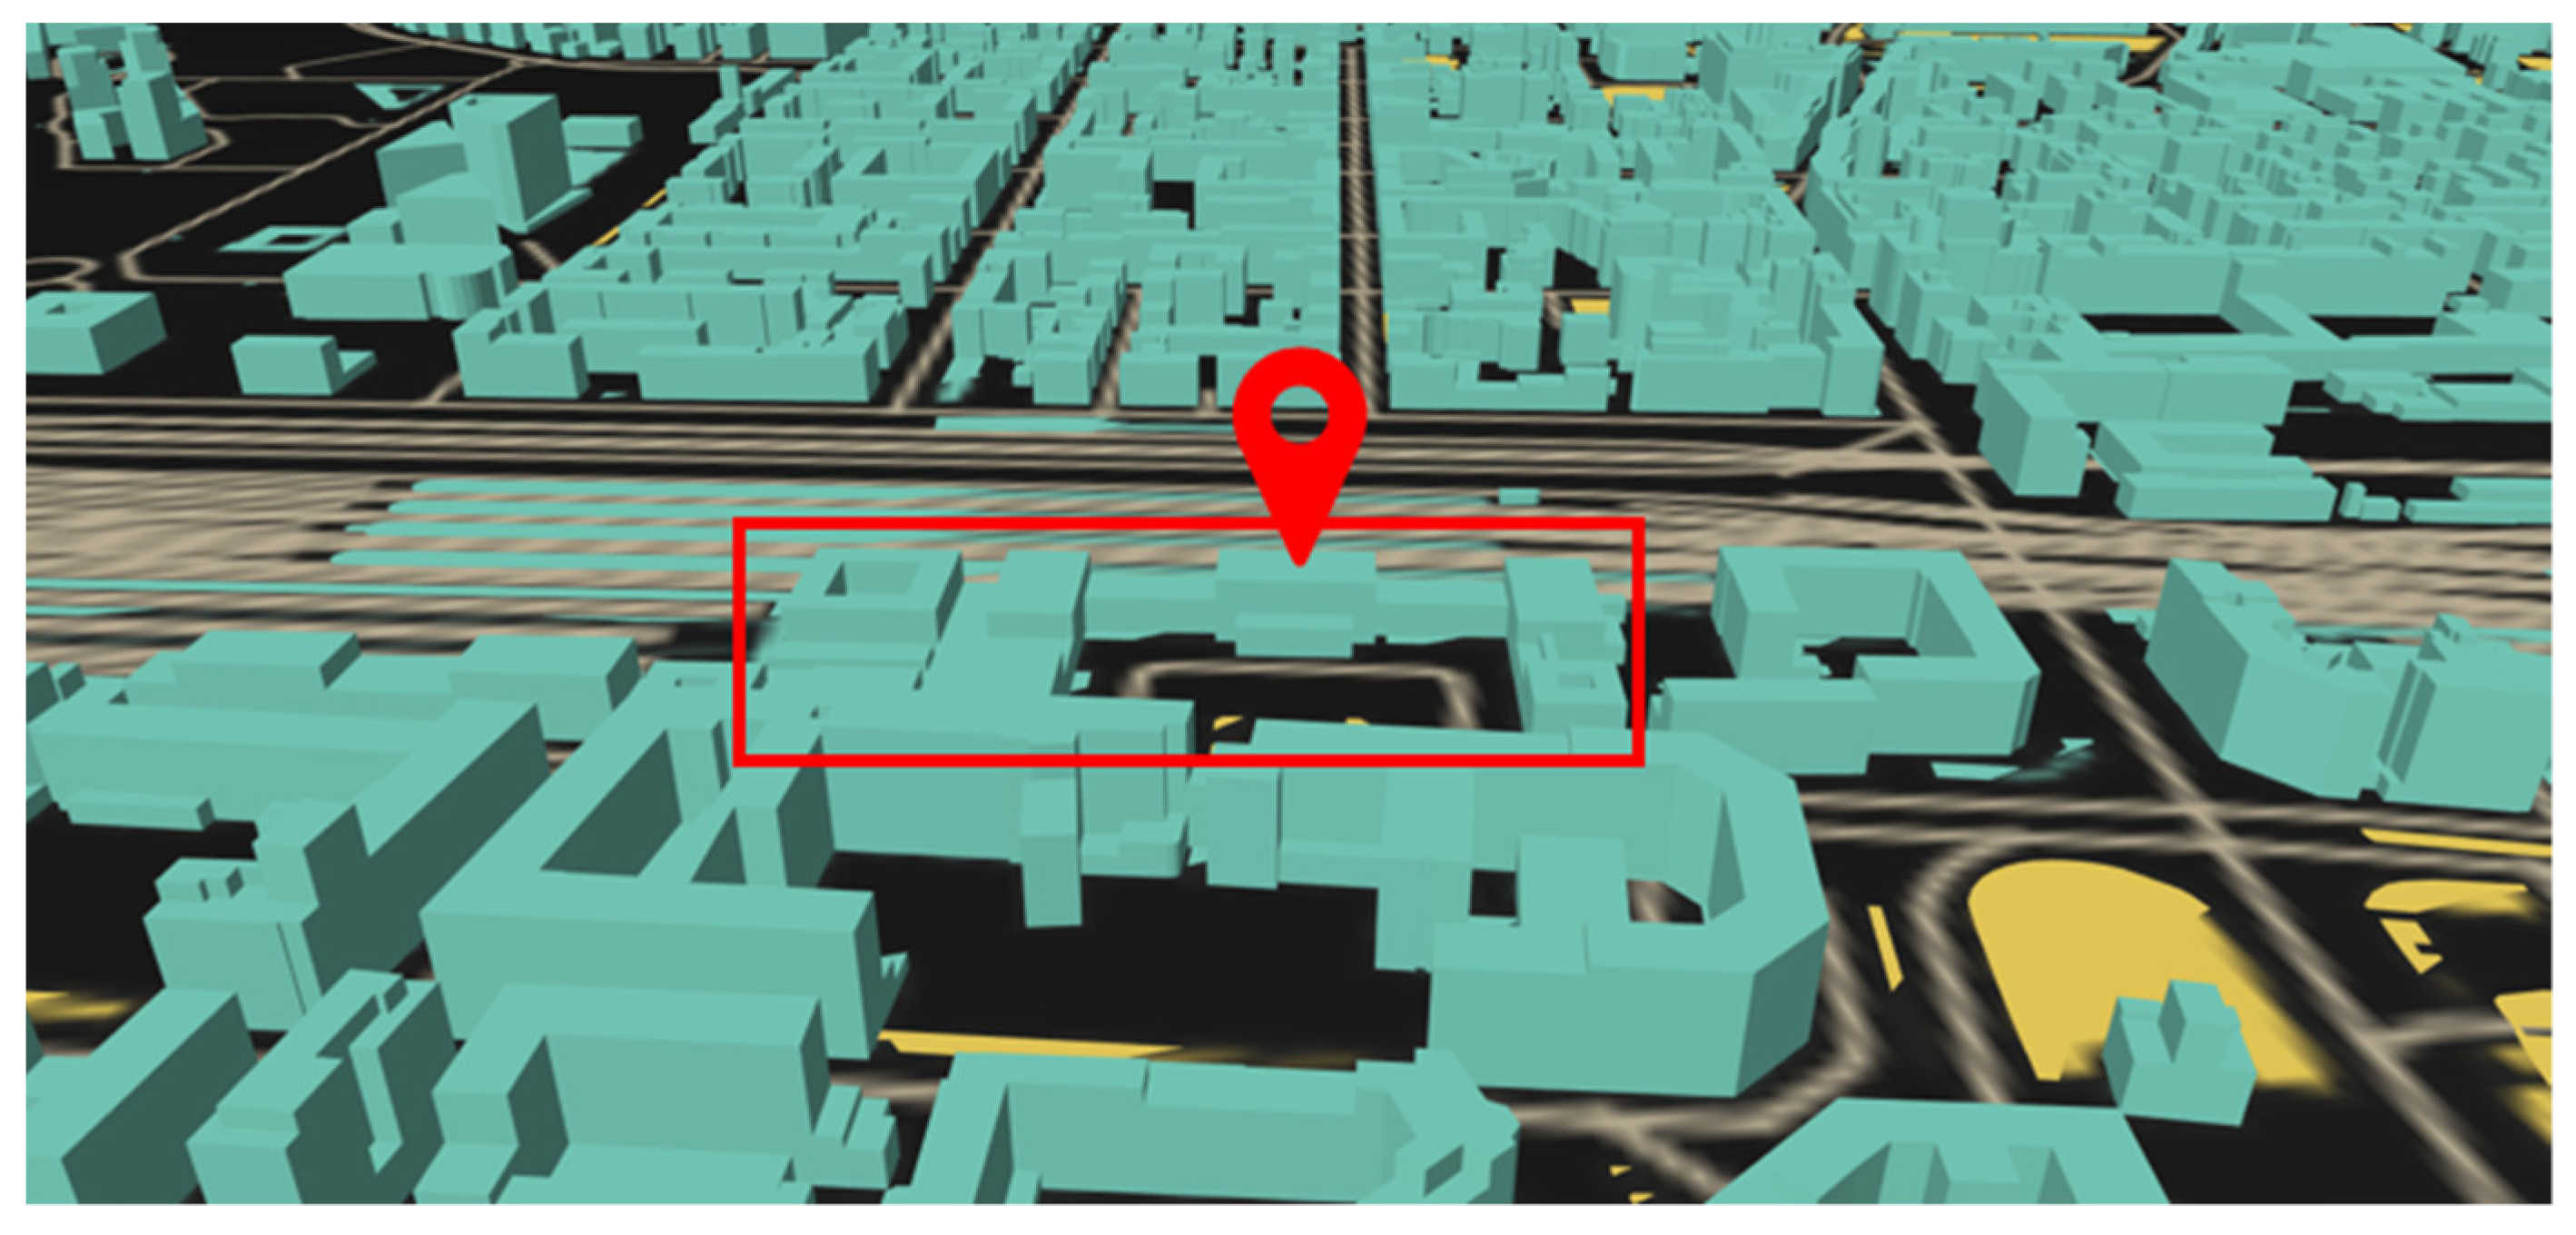
Starting from the vertiport locations, the routes linking them have been set using Equation (1) and the information provided by the digital twin model about local orography and barriers. Where available, data about local environmental features have also been considered. Particularly, some constraints to avoid conflicts with traditional aviation have been introduced in the digital twin model. As for the urban environment, the presence of high buildings—such as historical towers and modern skyscrapers—has prevented the connection of vertiport 1 with the other remaining two with a straight line (see
Figure 5).
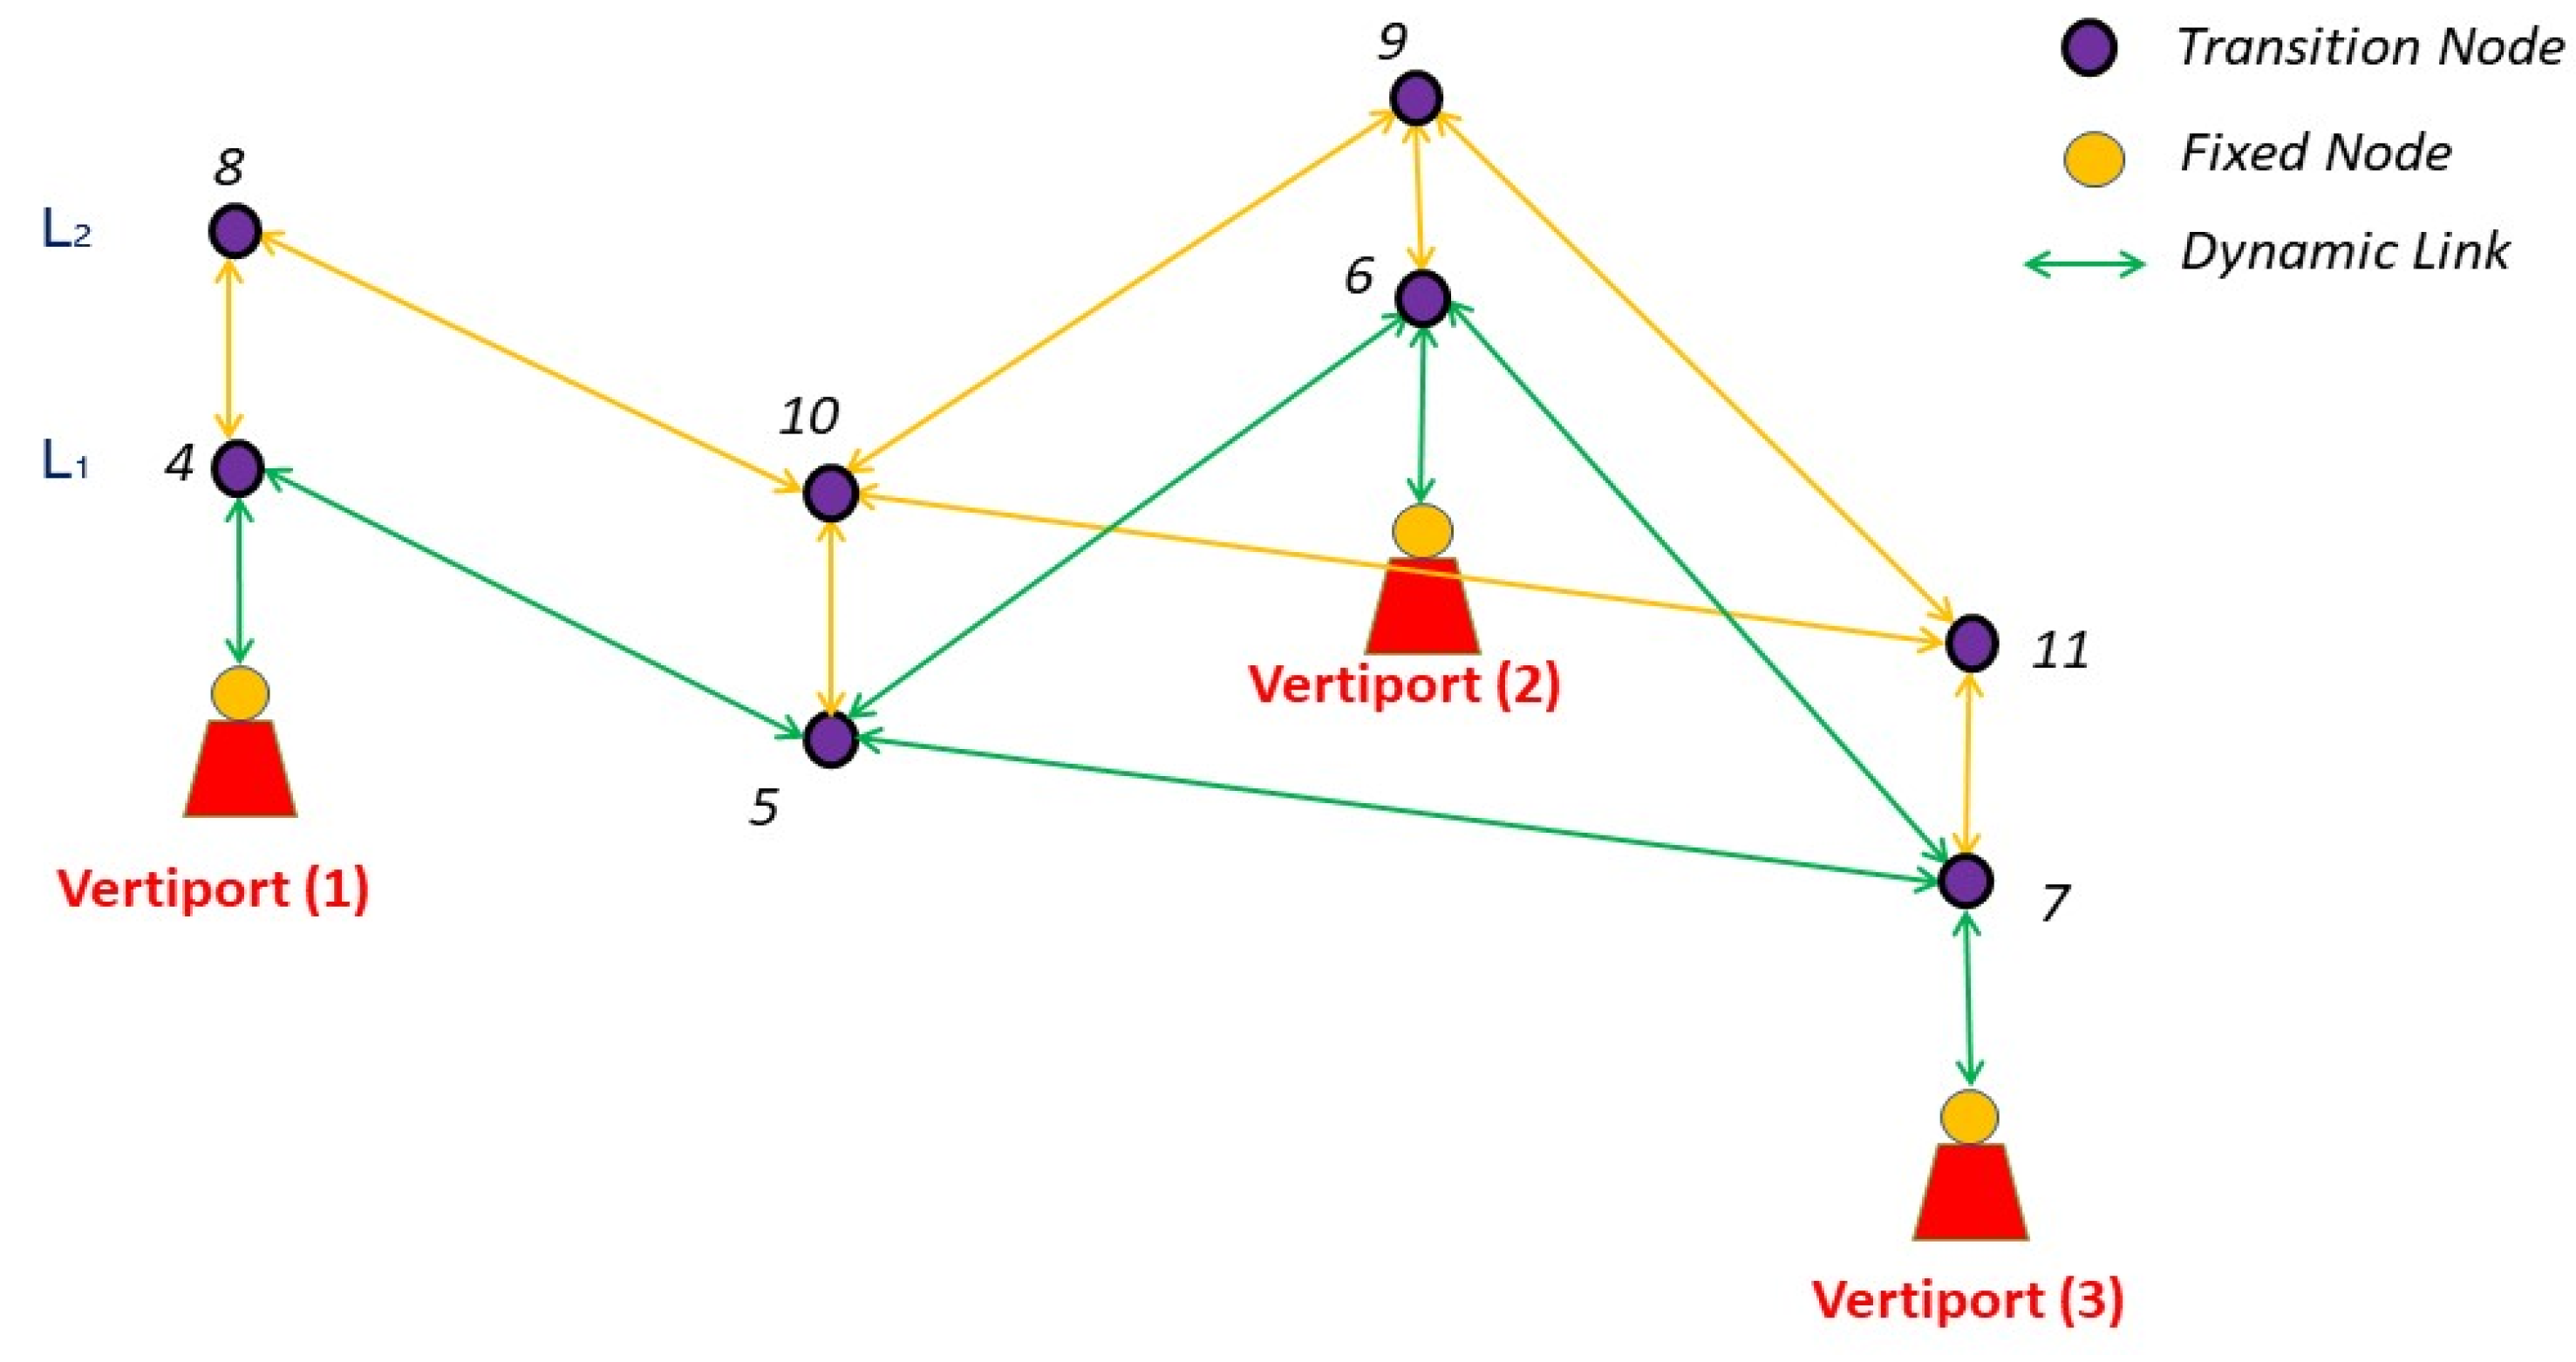
Figure 6 depicts the scheme of the obtained 3D-UAN network, while link and vertiport features are reported in
Table 2 and
Table 3, respectively. Due to the information contained in the digital twin model (i.e., DTM and building heights) and the introduced constraints to avoids obstacles along the dynamic air corridors, the altitude of the first layer (L
1) resulted at 200 m ASL (the highest building roof is at 184 m), while the following one (L
2) is at 250 m ASL (distance between L
1 and L
2 = 50 m).
To provide a preliminary application of the 3D-UAN for the case study, the following hypotheses have been considered, particularly the existence of j on the dm,L; is the time gap between ACVs j and j − 1., i.e., to the upper layers or to the lower layers. If there are multiple ACVs on the same link, i.e., i > 1, the gap time, , guarantees suitable separation between two following ACVs along vertical links.
For horizontal links,
is the running time,
, if
i = 1, while if
i > 1, the gap time is
. To assess the waiting time component, the gap time,
, the following are utilized: (i) advanced communication technologies (V2V, V2I/V2X) [
61,
62]; (ii) high precision ACVs on-board sensors, such as radars, Detection and Avoidance (DAA) [
63]; (iii) data transmission networks (i.e., FANET system [
64]).
The average cruising speed allowed on the horizontal links is considered equal to 90 km/h, while on the vertical links (included take-off and landing phases) it is 50 km/h. This average speed value was chosen based on the data distributed by Volocopter on their first prototypes [
65], which should also support aspects related to flight safety.
Two scenarios have been investigated, which have been set as follows:
- (a)
scenario S1: time gap between successive departures Tg = 180 s
- (b)
scenario S2: time gap between successive departures Tg = 120 s.
For both scenarios, the dynamic link features are reported in
Table 4. Furthermore, for S
1 and S
2, six ACVs have been considered connecting specific origin/destination pairs, and their shortest paths have been computed (
Table 5). Additionally, a
Tg value has been assigned to fixed nodes, particularly for each scenario: ACV
(1) and ACV
(2) takes-off at the same time
t0 and
Tg1 = 0; ACV
(3) and ACV
(4) takes-off at time
t1 and
Tg2 =
t0 +
Tg(1,2); ACV
(5) and ACV
(6) takes-off at time
t2 and
Tg3 =
t1 +
Tg(3,4).
Table 6 reports a detailed analysis of the two scenarios over different periods of time
From
Table 5 and
Table 6, it can be seemed that, in a small urban context (such as the city of Bologna), a time gap
Tg = 180 s between successive departures would not generate air traffic congestion, even if there are crossing routes. A different result is obtained in the case of
Tg = 120 s. In this scenario, the ACV
(5) has to exploit the dynamism of the links and switches to the next layer to ensure flight safety and avoid link congestion. In fact, thanks to the information stored regarding the air traffic conditions, by both the ACV and the control centre, the link (7-5) is disabled for transit, while the vertical links (7-11) and (8-4), and the horizontal links (11-10) and (10-8) are enabled, ensuring a suitable air transport service.
6. Discussion and Conclusions
The previous sections described two main aspects of UAM systems—i.e., vertiport locations and 3D UAN—that may benefit from the digital twin approach. The presented framework, together with the proposed 3D-UAN model, has been applied to the real context of a medium size city and its metropolitan area. Although this is preliminary research, the results obtained are very encouraging.
The first step, i.e., the location of the vertiport close to the main train station in the city area, confirmed some of the suggestions and preliminary results in the literature. The identified area has some interesting features, such as high levels of population and job densities—which would generate demand levels suitable for supporting UAM services—and good ground connections—which would assure great accessibility to the vertiport from the remaining part of the city.
As for the 3D-UAN structure, in the case study the metropolitan area has been considered, which is more suitable to this aim. Three vertiports have been identified and, by using the digital twin information on the most important factors and constraints to set safe aerial routes, a preliminary 3D-UAN structure has been identified. Furthermore, a preliminary simulation of the aerial traffic flows has been provided, based on Equations (2)–(4). In a real operational context, detected traffic data could also be added to the digital twin of the system as time series data useful for figures and off-line scheduling purposes. In fact, in the case of scheduled services, the computation of the shortest path and assignment of ACVs at specific enabled links is performed before the departure of each aerial vehicle, based on pre-trip information regarding the origin and destination points of ACVs. Scheduled minimum paths and vehicle separations may be computed based on Equation (2).
It is worth noting that the data used for feeding the digital twin of the case study were limited, because only freely available data have been used at this stage, and some other data should be added for improving the nature of the information provided by the digital twin, both static and dynamic data. For example, information regarding static and dynamic populations could be relevant for dynamically adapting the 3D-UAN in order to avoid overflying crowded locations. Similarly, information on dynamic and static population density could be used to adjust the dynamic corridors in order to reduce the externalities produced by ACVs, e.g., noise emissions during the day or night, respectively. In the case study of Bologna, the information about the dynamic population is particularly relevant because the city hosts one of the most important universities in Italy, with a student population of about 90,000, which is a high number compared to the whole population of the city. Particularly, many of them often live in Bologna for a limited number of months. In this context, dynamic population density data are probably the best option for safety evaluations of aerial corridors. Moreover, information on how much a location is busy—which might be obtained by several sources (e.g., Google popular times)—can also be useful to design and adapt the 3D network, while information on areas subjected to urban canyon effects may help in refining the optimal routes.
Another important aspect that affects the location of the vertiports and the design and management of the 3D-UAN is the energy consumption of each ACV. While for small urban areas—as, for example, the city of Bologna—this kind of analyses is not necessary because current aerial vehicle prototypes could realize several trips with a single charge; however, for larger cities such as Rome, Paris or London the cost function of the 3D-UAN model should include the energy consumption factor so that the computation of paths between vertiports will also consider the vehicles autonomy. The maximum autonomy range can then be included as relevant information for setting suitable locations of vertiports and routes between them, as ACV energy autonomy affects the length of the links, also depending on the vertiport (fixed node) where the recharging facilities has been located [
66].
To summarize, the opportunity to use a digital twin approach at a high detail level will help system designers and urban planners to evaluate and implement procedures to realize successful aerial networks which can support the existent ground transportation system.
For the effective use of digital twin models in UAM scenarios, several aspects should be considered. First of all, it is important to validate the accuracy and the precision of the gathered data before their integration into the digital model. For example, inaccuracies in the measurement of building heights would compromise safety and produce problems in the risk management process as well as vertiport location, which strongly depends on obstacle clearance. Secondly, continuous digital twin data update is required to reproduce the actual conditions of the represented system. For example, if cranes are introduced inside the city for construction aims, which are possible obstacles to drone operations, the 3D network should be verified and changed, if necessary, in order to avoid these hindrances.
To conclude, this paper proposed a coherent framework based on a digital twin approach in order to deal with the vertiport location problem and the aerial network setting. The digital twin model may significantly support the proposed 3D-UAN, characterized by a high degree of dynamism. Particularly, dynamic links may be enabled or disabled according to real time conditions that are expected to be included in advanced digital twin models of the territorial system. In this perspective, data regarding link traffic volumes, also transmitted in real time among both ACVs and traffic control centres (e.g., UTM), should be included, which will allow one to compute new routes, even in real time. The dynamic requirement of the links represents a considerable advantage and can be utilized to better manage the system and guarantee adequate separations and fast and competitive transport services, especially for medium-long distances.
Further studies will integrate other variables in the localization process, such as environmental capacity, to limit the impacts on population as well as the use of an energy consumption factors in the cost function of the 3D-UAN model.


