1. Introduction
In recent years, there has been growing interest in autonomous UAS, and this is also reflected in the increase in scientific publications on the topic [
1,
2,
3,
4,
5]. The importance of this research area is fundamental since the development of autonomous technologies in drones can guarantee significant benefits for society in the near future. For instance, implementations for the search of missing people and the exploration of post-disaster or inaccessible environments to humans where the use of drones with autonomous decision-making capabilities could play a decisive factor in terms of the number of lives saved [
6,
7].
Nowadays, the topic of human transport in urban contexts through the use of autonomous drones is also becoming more and more interesting, precisely because it would allow to limit ground traffic by moving part of it to the sky. In this regard, the work presented in this article was developed within the European project AURORA (Safe Urban Air Mobility for European Citizens), which has as its ultimate goal the development of autonomous technologies aimed at this type of use. In this regard, a fundamental element that an autonomous driving system must implement on board is the obstacle-detection and avoidance part [
8,
9]. In fact, without it, the aircraft cannot modify the global trajectory to avoid unexpected obstacles and therefore would not be able to be used for applications that instead require high safety and flexibility in terms of automatic recalculation of the desired trajectory. In the literature, there are papers that deal with the development of such systems; many of these are based on the use of stereoscopic cameras capable of depth perception, allowing to carry out the detection of obstacles [
10,
11].
Recently, the scientific community has begun to experiment with the use of radar systems, which have multiple advantages, such as longer detection ranges and being insensitive to light and visibility conditions [
12,
13]. Compared to optical systems, it is important to note that radar technology also has disadvantages, such as a lower spatial resolution and the almost total absence of resolution in height [
12,
14]. However, the two technologies have complementary characteristics and therefore lend themselves well to being used together; in fact, they are able to compensate for each other’s disadvantages. Automotive applications of simultaneous radar and vision systems for obstacle detection [
15,
16,
17] are widely documented in the literature; however, this is not common in the UAS field. In fact, except for some implementations where the 3D perception is obtained by merging together the radar data with the monocular vision [
14], until now and to the authors’ knowledge, there are no documented techniques that use radar and stereoscopic vision in a complementary way.
In this article, an approach for UAS applications that exploits the complementary features of an automotive-derived radar and a stereoscopic optical sensor to increase the reliability of the detection algorithm is presented.
The two systems have been kept completely independent in such a way that a malfunction of one cannot affect the functioning of the other. As it will be detailed in the following sections, the avoidance strategy comes into operation as soon as one of the two systems detects a dangerous obstacle according to the detection policy implemented.
The paper is organized as follows:
Section 2 describes the hardware and software architecture, explains the method of creating environmental maps and defines the algorithm that has the task of detecting dangerous obstacles inside them. Furthermore,
Section 2 also discusses the implemented avoidance strategy which comes into operation only when obstacles considered dangerous are highlighted.
Section 3 shows the results obtained from field tests carried out in an open environment that simulates an urban context. Finally,
Section 4 reports the discussion on results and future developments.
2. Materials and Methods
2.1. UAS Architecture
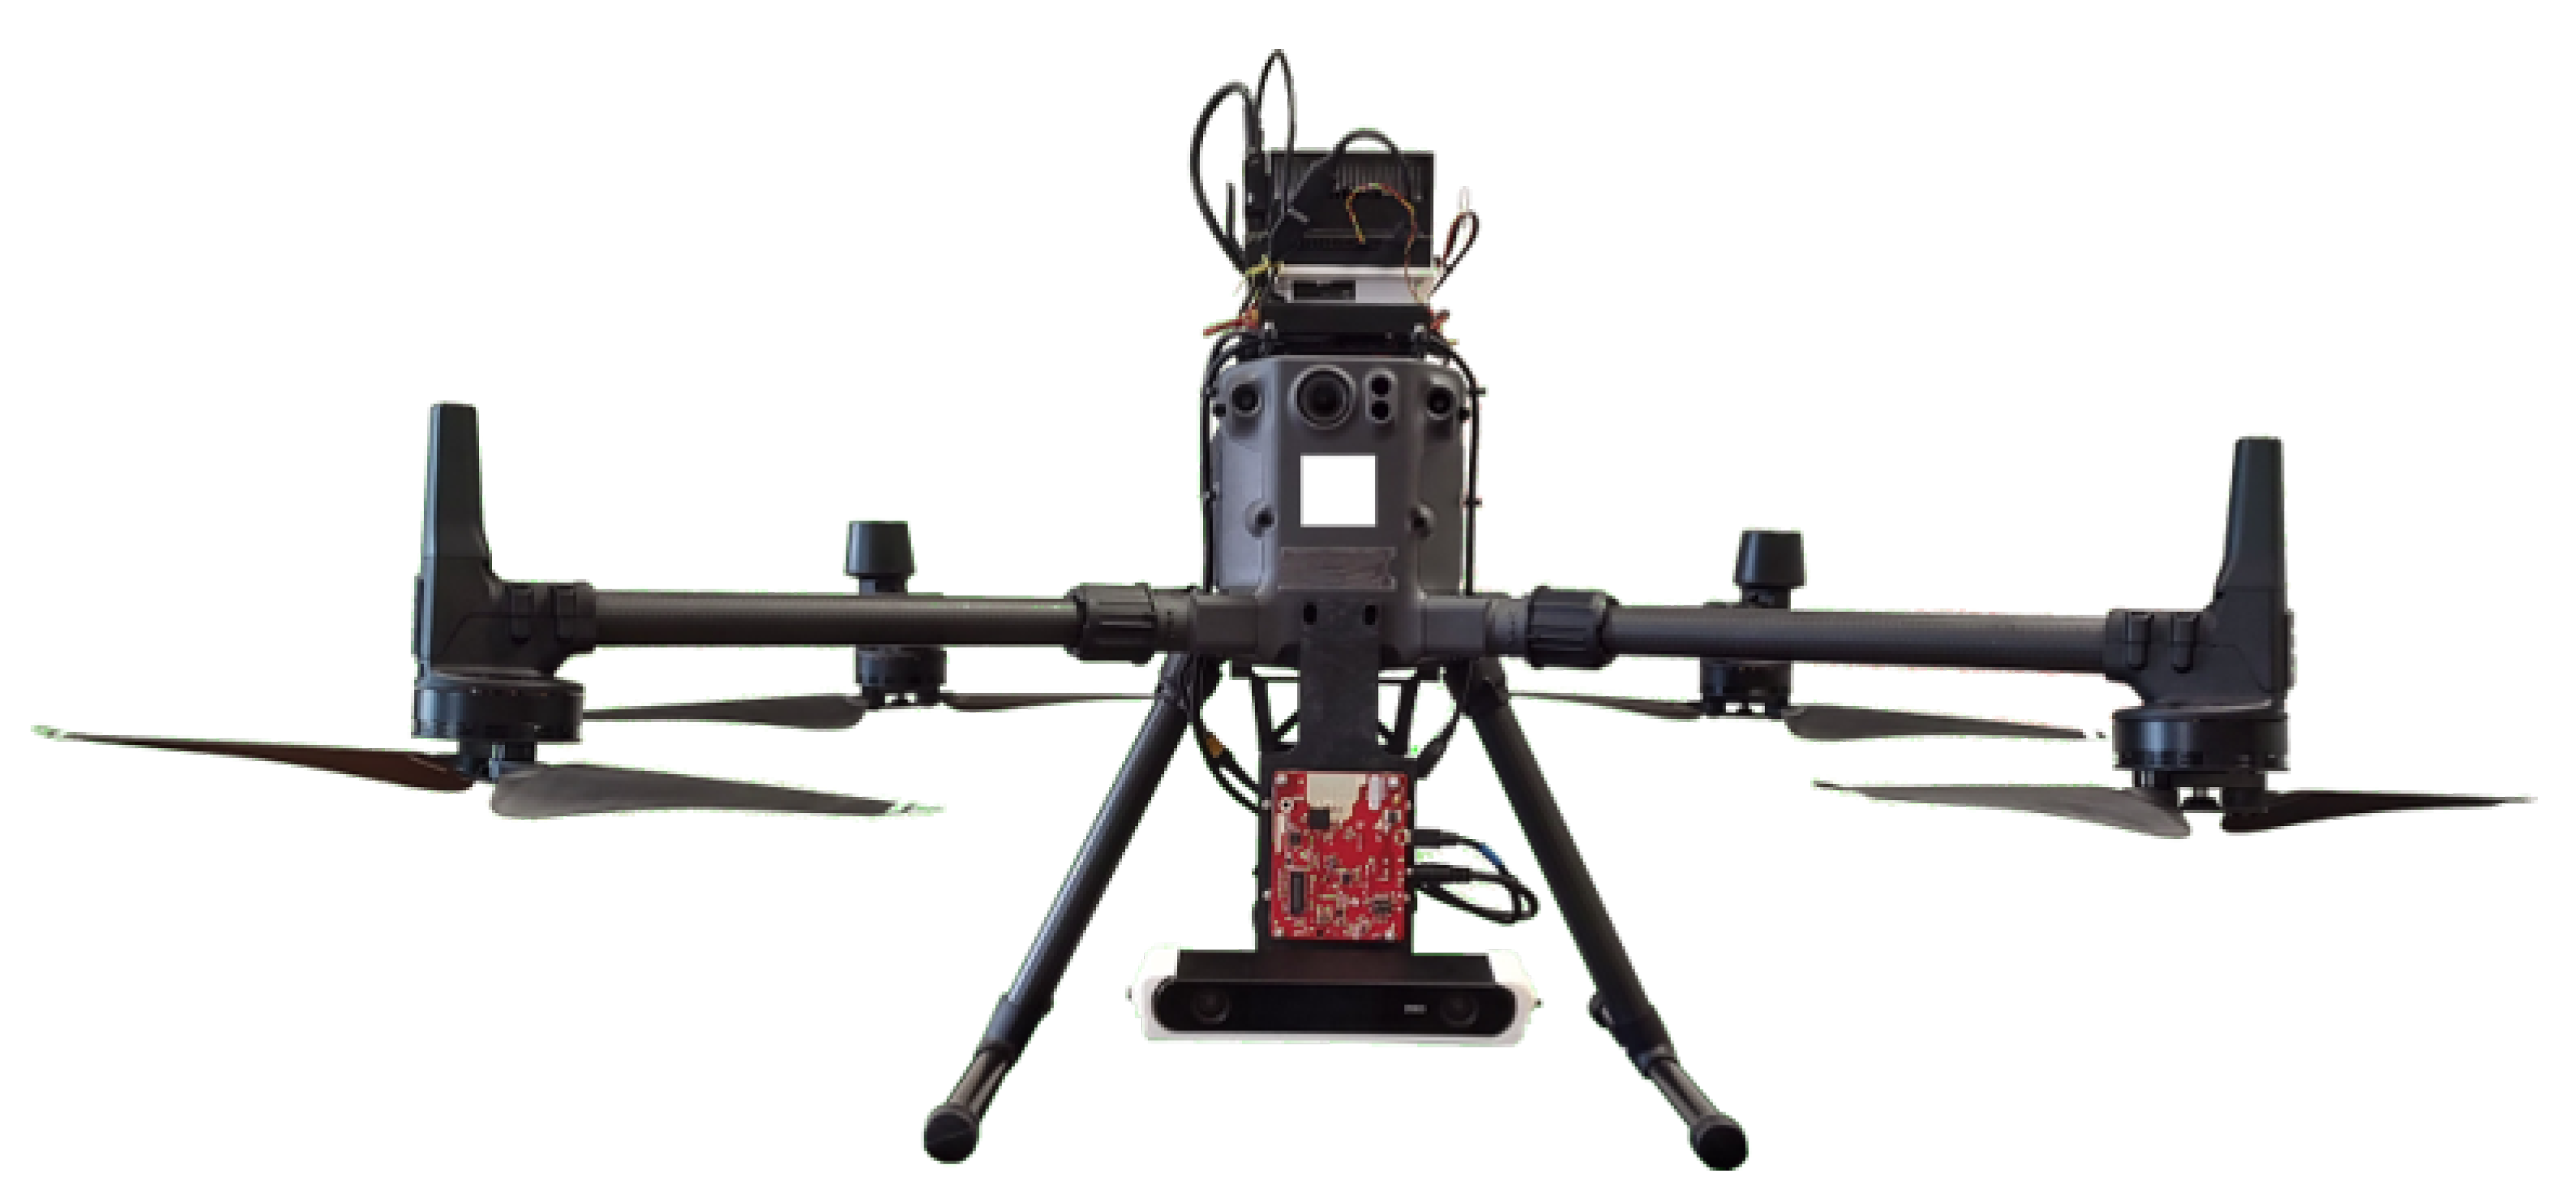
The platform used for the development of the obstacle detection and avoidance system consists of a DJI Matrice 300 RTK drone to which a ZED 2 stereoscopic camera, an AWR1843BOOST radar and an Nvidia Jetson Xavier AGX board have been added as a payload. The obstacle detection algorithm runs on the Jetson board, which is directly interconnected with the camera and the radar. Moreover, through a UART connection, the board is also able to pilot the UAS autonomously.
Figure 1 shows the DJI Matrice 300 RTK equipped with the additional components. In particular, at the top, it is possible to observe the Nvidia Jetson Xavier AGX board, while at the bottom, there are the radar and the optical sensors used for the implementation of the obstacle detection algorithm.
2.2. Stereoscopic Vision
To obtain three-dimensional information on the surrounding environment through the use of computer vision, there are basically two technologies that can be used. The first is based on RGB-D technology, where an RGB optical sensor is used alongside a TOF (time of flight) depth sensor. The second one uses the optical flow coming from two RGB cameras that needs to be processed on board the companion computer to provide 3D data. The TOF sensor mounted on RGB-D cameras uses a laser beam matrix, very sensitive to ambient light conditions, and does not guarantee high operating ranges.
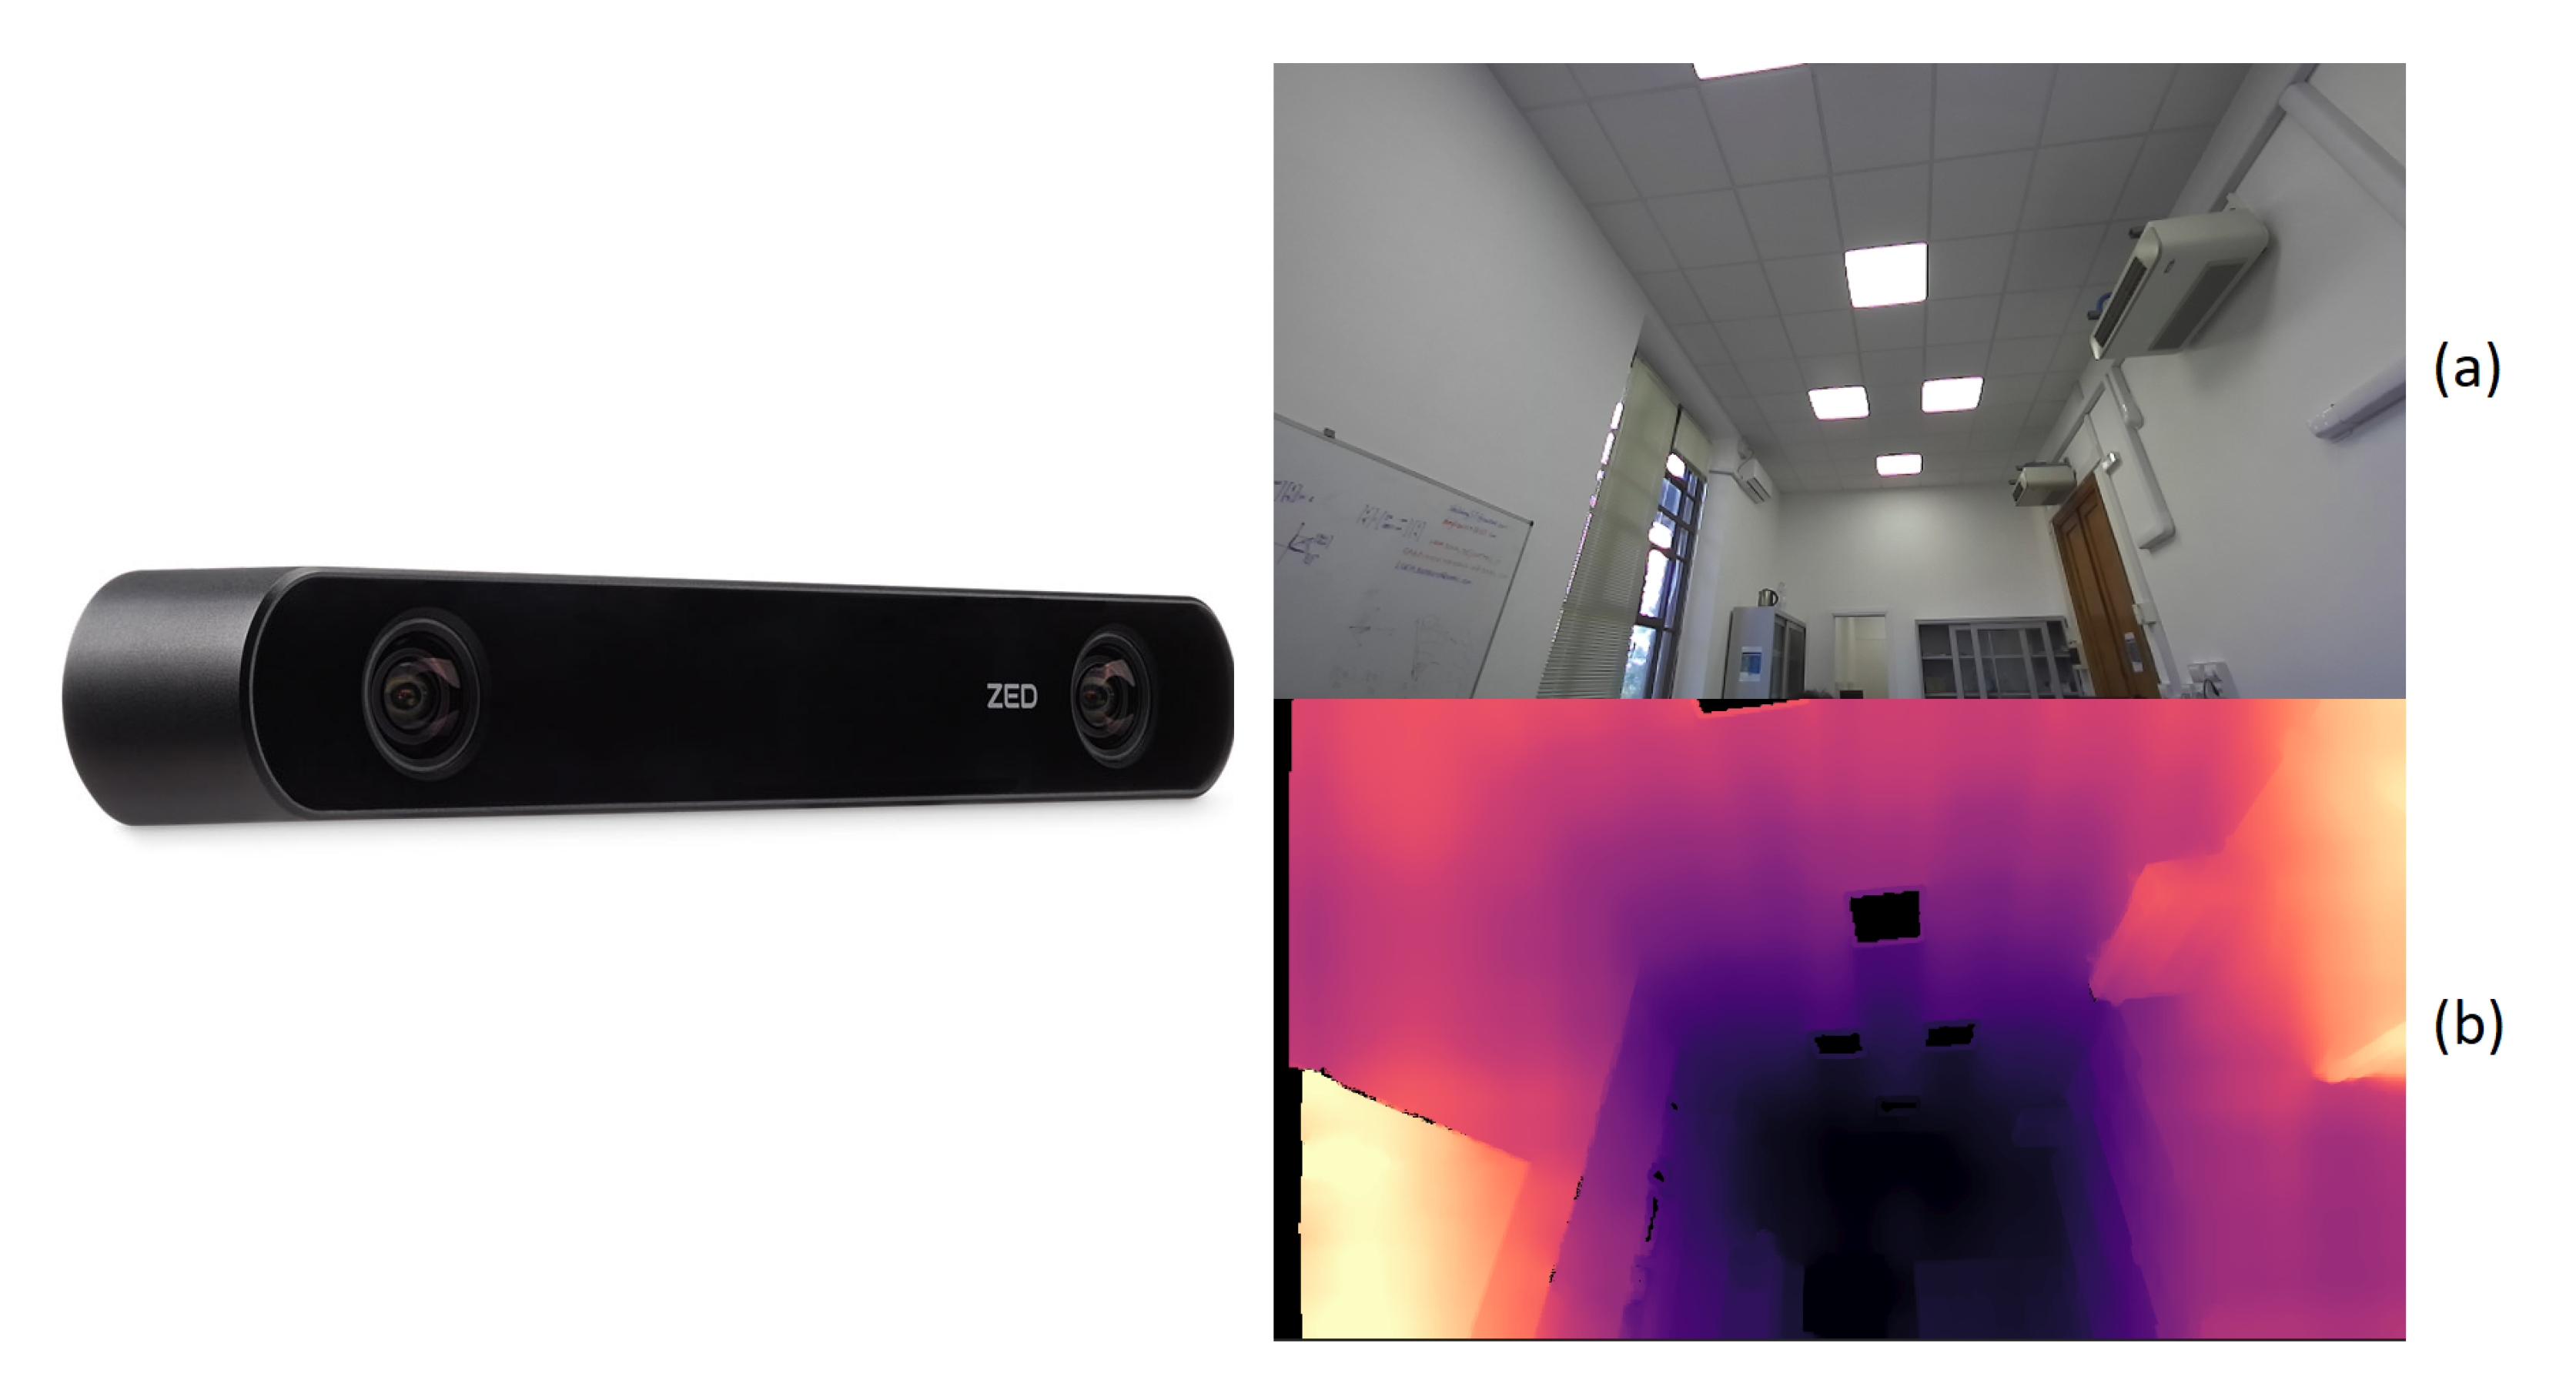
To comply with the specifications imposed by the AURORA project, classical stereoscopy based on two RGB optical streams was chosen, which provides more stable performance, especially in outdoor environments. In particular, the ZED 2 stereoscopic camera by StereoLabs was used, which in addition to providing the point cloud of the surrounding environment defined in the fixed frame, is able to generate an estimate of the trajectory traveled by the camera in 3D space. This estimate was obtained from the SLAM algorithm implemented in the SDK (Software Development Kit) supplied with the camera. Unlike other optical systems (see Intel t-265), the ZED 2 camera does not perform calculations on board, leaving all the computational load to the Nvidia Jetson module. This is a significant limitation since a considerable amount of the hardware resources is already reserved for the camera SDK, leaving less space for user applications. For these limitations, it is important to pay particular attention to the optimization of the detection algorithm in order to minimize the computational cost necessary for the detection of dangerous obstacles. Despite the presence of these problems, currently the ZED 2 camera represents the state of the art for stereoscopic vision systems. In fact, it guarantees an operating range of up to 40 m and performance superior to those offered by other products.
Figure 2 shows a functional example of this camera, where the RGB optical flow (a) and the depth flow, processed on board the Jetson module (b), are visible.
2.3. Radar
The radar used for this work is an AWR1843BOOST by Texas Instruments [
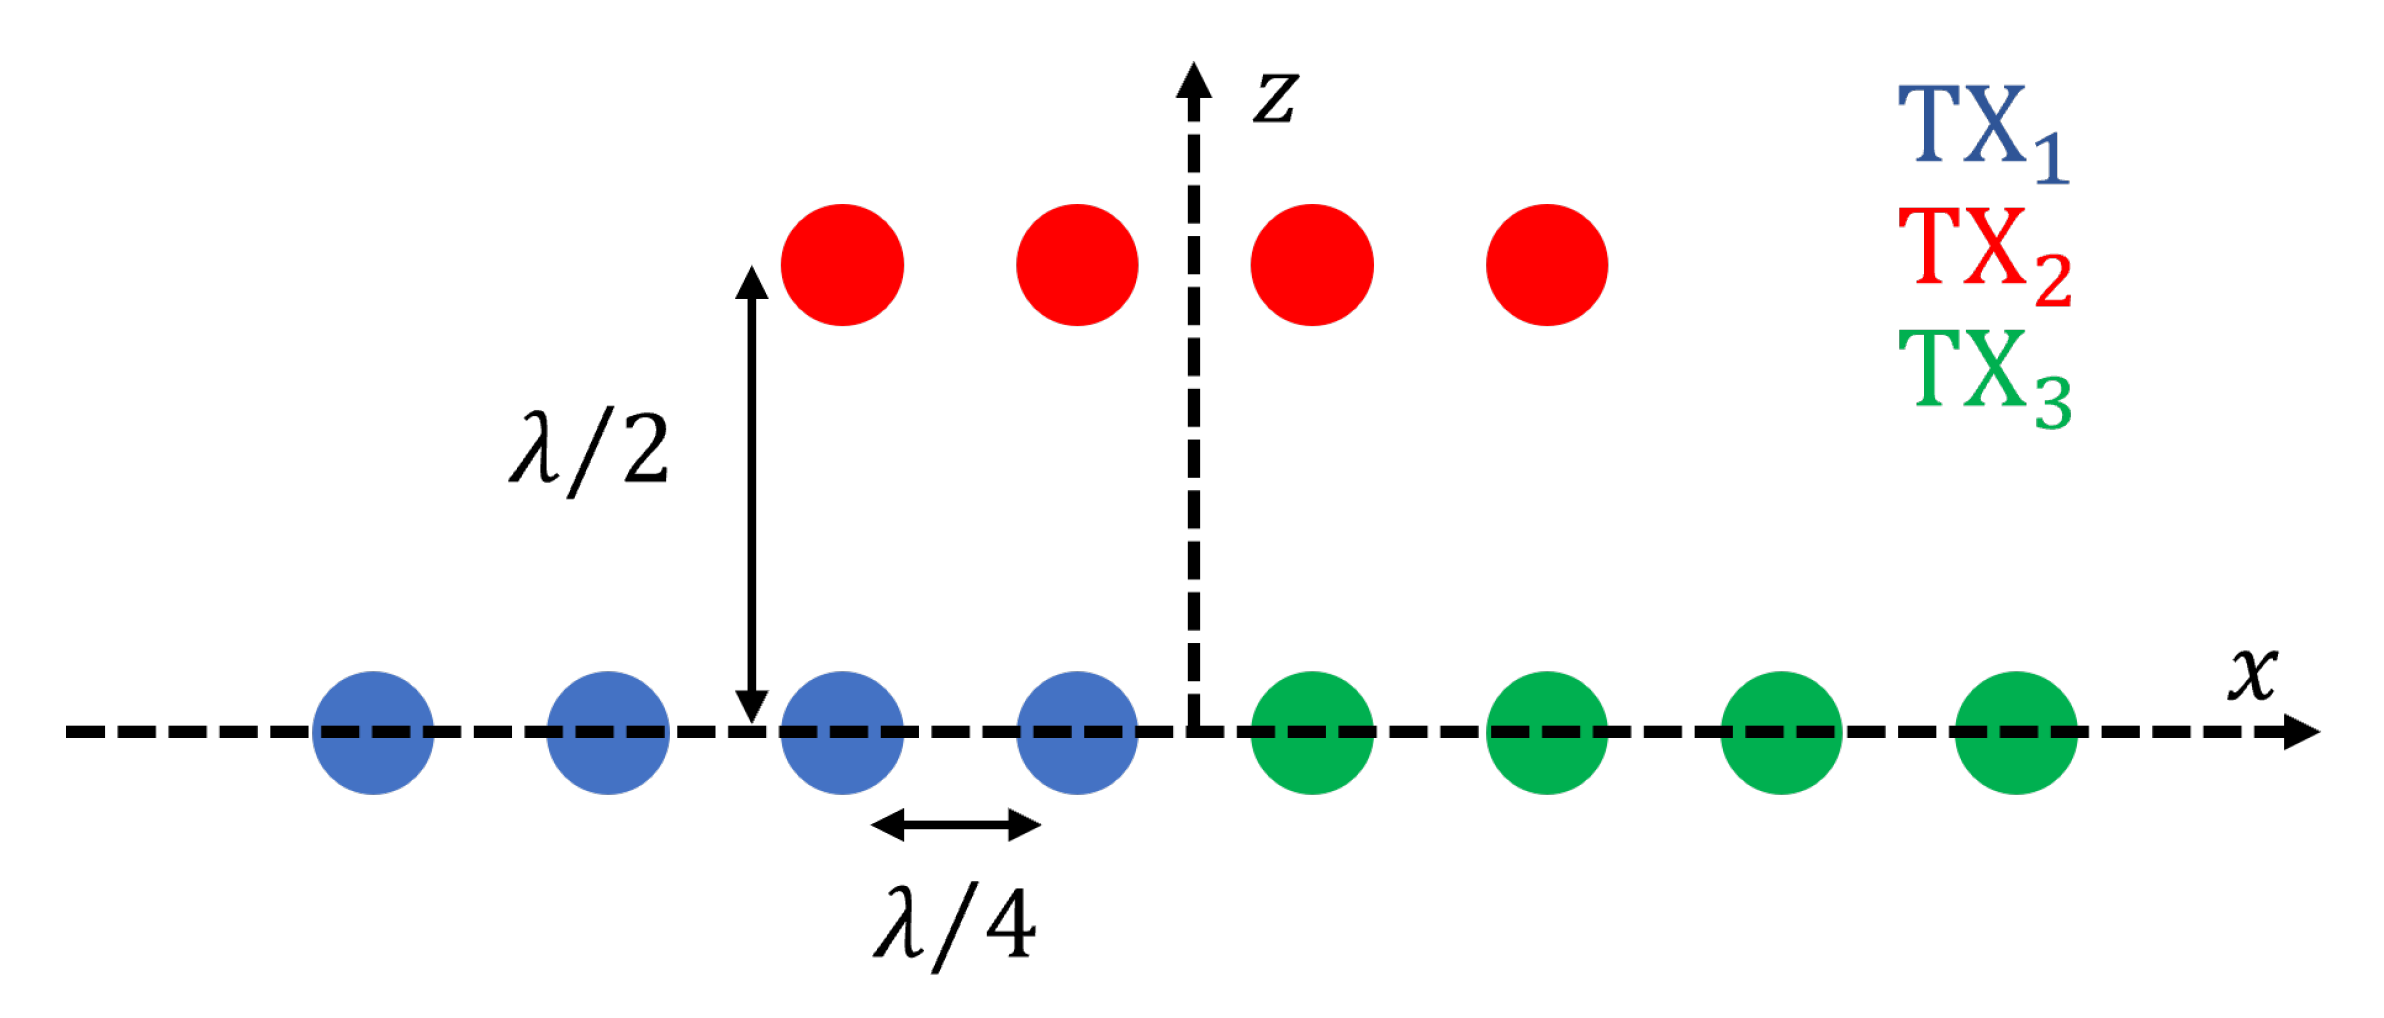
12]. A radar detects the distance of the target by sending and receiving an electromagnetic signal through at least a couple of antennas. Using a multiple input multiple output array, it is also able to retrieve the direction of arrival. The sensor used is equipped with 3 TX and 4 RX antennas, which correspond to 12 virtual antennas, disposed as shown in
Figure 3. In
Figure 3, the
z axis represents the altitude, while the
x axis is left to right, and
is the wavelength of the electromagnetic signal. This arrangement of virtual antennas achieves a good azimuth resolution and a poor elevation resolution, the elevation resolution being related to the inverse of the
z-distance between the antennas.
For the current application, the elevation resolution is used only as an angular cut-off. In other words, the value of elevation measured by the radar is not used for mapping, and it is set equal to zero for each target, but it is used as a spatial filter for rejecting the target outside of a selected angular area. We set the angular field as deg in azimuth and [0, 20] deg in elevation. Therefore, all targets outside this interval are not used for mapping.
Since the radar is not able to provide the elevation of the target, we decided to always consider zero as the elevation of the object. This is equivalent to assuming that each target is on a horizontal plane at the same height of the drone. This hypothesis is not as restrictive as it seems since usually a target at
m (at the same height of the UAS) is the most reflective. Under this hypothesis, the map generated using the radar is bi-dimensional. It becomes three-dimensional by changing the drone altitude [
12].
In order to reduce the number of false alarms, the radar signal was filtered using two constant false alarm rate (CFAR) algorithms [
12]. The first CFAR algorithm discriminates the physical targets from the thermal noise and from possible clutter using a moving threshold on range direction. The second CFAR algorithm was applied in the Doppler direction (which means on the speed) to further discriminate the possible targets from false alarm. The radar provides the coordinates of each target that exceed the CFAR thresholds.
In the current application, the radar range resolution was 0.5 m with a maximum range of 120 m and 10 Hz frame periodicity.
2.4. Framework
The whole framework runs on board the Jetson card, and it was developed through the
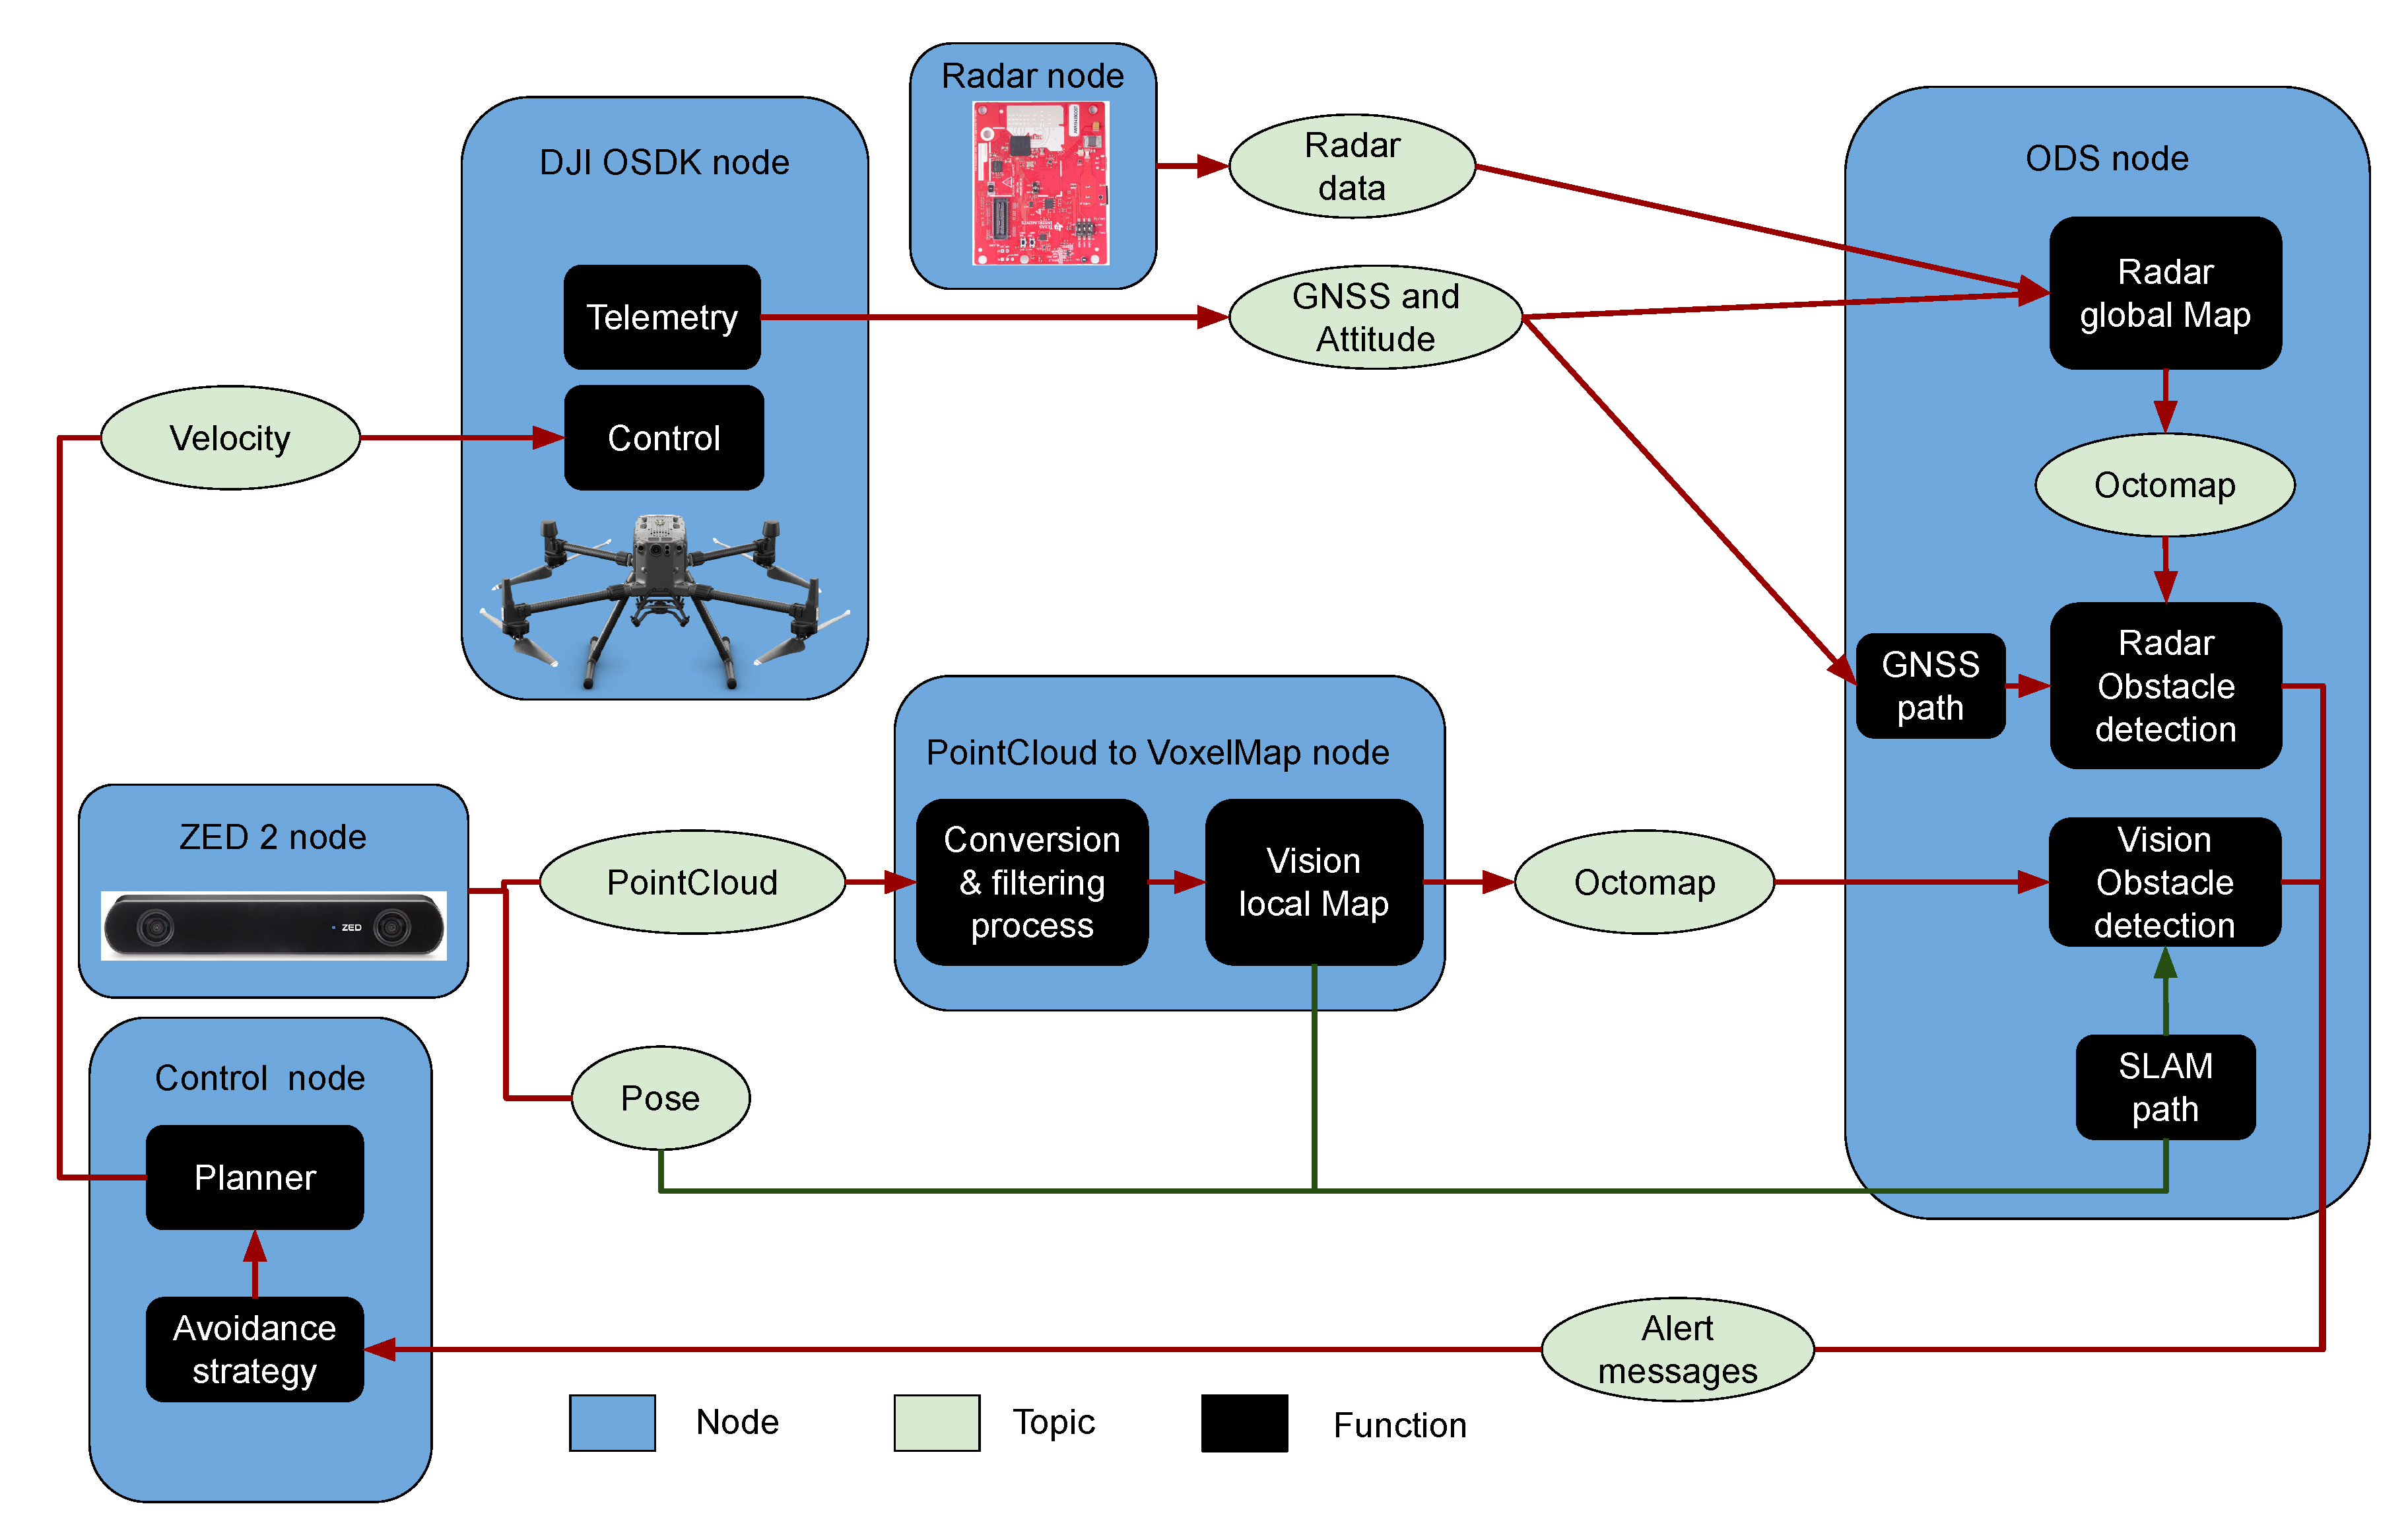
ROS (robot operating system) environment. The main advantage offered by ROS is to guarantee extreme flexibility and modularity: it is possible to interconnect multiple software packages, called nodes, through a publisher–subscriber scheme. The framework developed is shown in
Figure 4, where the nodes are visible in blue, the topics in green, and the functions implemented within the nodes in black. The DJI OSDK node provides a communication interface to the Matrice 300 RTK. In particular, through the telemetry function, it is possible to obtain all the data of interest, while through the control function, it is possible to autonomously fly the drone sending a set-point velocity vector. In the current implementation, the telemetry data that are actually used in the framework are the
GNSS (global navigation satellite system) coordinates and the attitude vector of the drone. This data are then used to build the radar maps, which will be explained in
Section 2.5.
Regarding the radar node, it provides the topic containing the 2D coordinates of the obstacles detected in the radar frame. In fact, as already explained in
Section 2.3, the AWR1843BOOST radar does not reliably provide the relative elevation coordinate. The ZED 2 node creates the interface toward the stereoscopic camera: this node provides the fixed-frame position estimation by processing the vision data, the camera attitude and the topic point cloud that contains the 3D image of the environment. As will be explained in
Section 2.6, by suitably processing this topic, it is possible to create an obstacle-detection system. The
ODS node (obstacle-detection system) implements various functions: in addition to the obstacle-detection task, it is responsible for the creation of the maps [
12] explained in
Section 2.5, exploiting the absolute paths generated from the GNSS data [
12] via the DJI OSDK node and from the SLAM (simultaneous localization and mapping) estimated by the vision process [
18,
19,
20,
21].
Since through the point cloud topic, it is not possible to create vision maps directly, a specific node called “point cloud to voxel map” was developed. This node converts the point cloud topic into a usable data structure [
22] and the processed data are used for the creation of the vision maps.
The last node implemented in the framework is the control node, through which it is possible to define the generating policy (planner) of the desired set points for the autonomous driving algorithm. In addition, the control node implements the avoidance strategy, which is enabled in the event that a potentially dangerous obstacle is detected. In this case, the function that realizes the avoidance strategy bypasses the planner function, which is normally enabled during the autonomous mission.
2.5. Mapping Algorithm
Both vision and radar maps exploit the Octomap library [
23,
24] to create and manage volume maps (defined by sets of voxels) in an efficient and fast way, which is a requirement when performed on embedded devices, such as Jetson boards. Two different type of maps can be employed: local and global maps, both using the same Earth reference system (ENU in this work). In general, we define a map as local when it only contains the obstacles detected at the current time, whereas a global map includes all the objects detected during the entire mission. In either cases, the task for updating the maps is computationally expensive since it requires a transformation of each detected point from the sensor frame to Earth frame, given the UAS attitude and position (pose). As said, for updating a local map, it is necessary to destroy the previous information at each new frame. Conversely, for the creation of the global map, it is sufficient to define a global container, where at each frame, all detected targets are inserted, without, however, deleting previously detected objects, even if they may no longer be present.
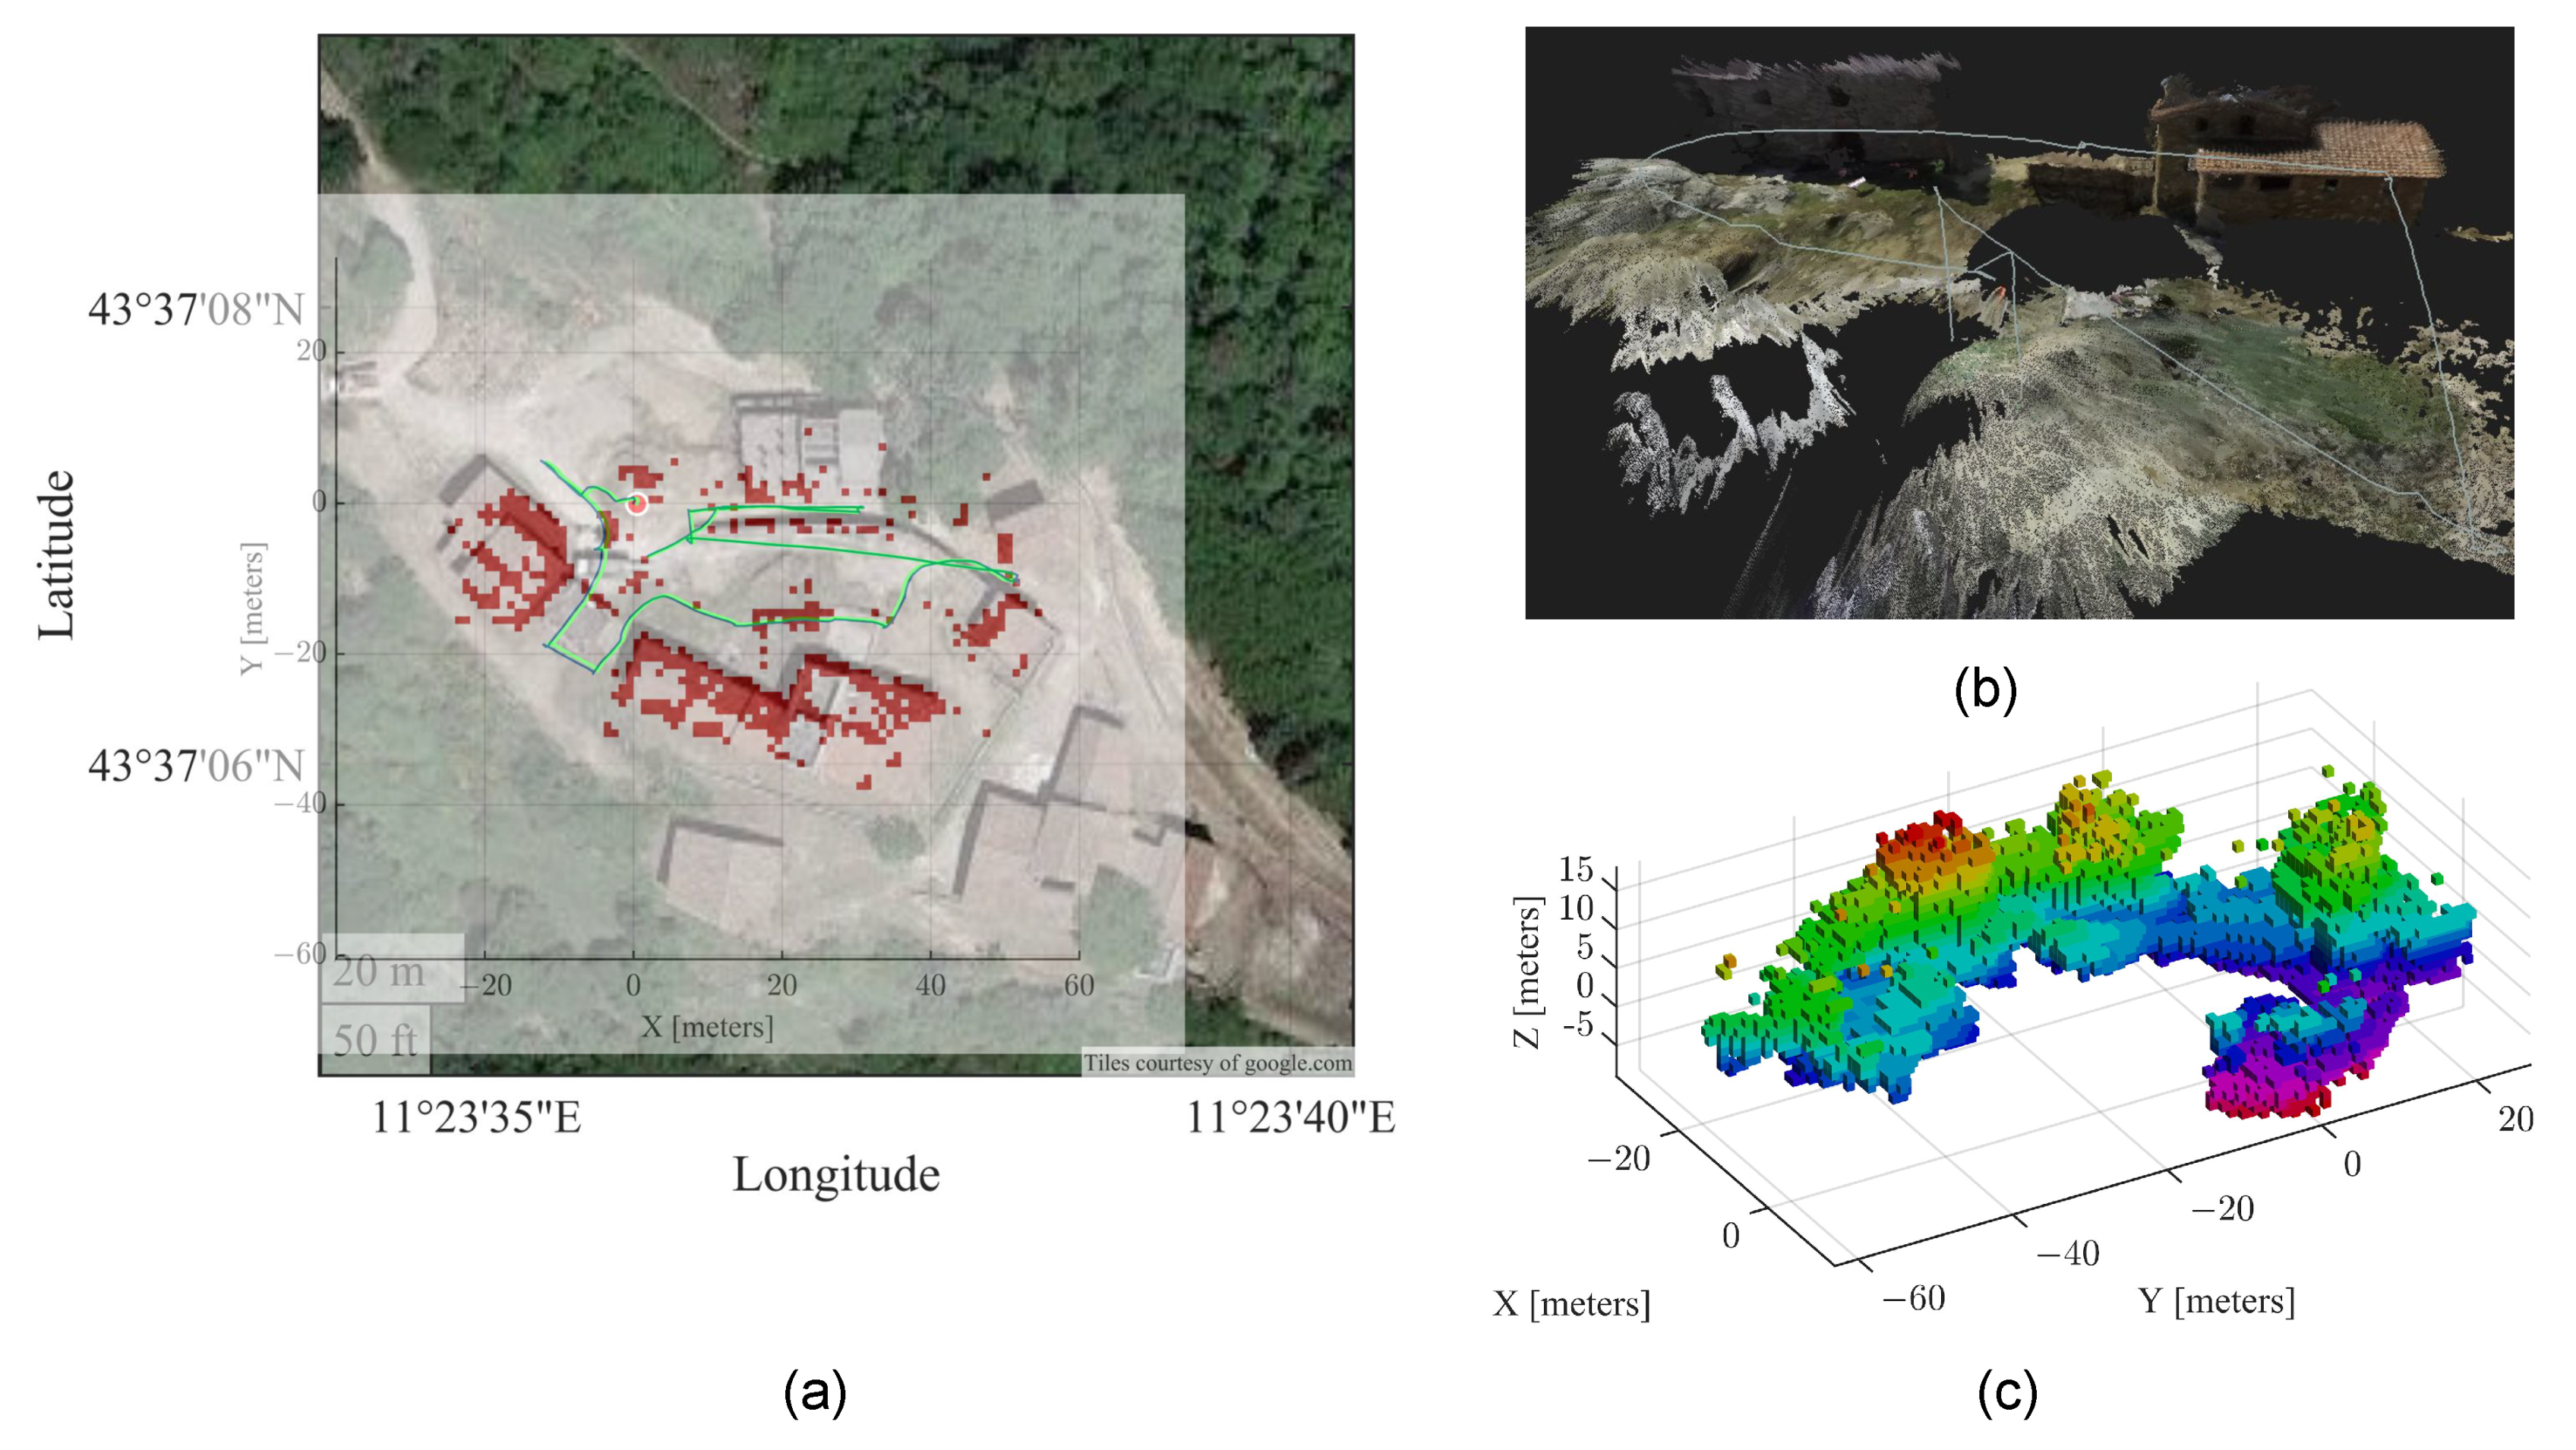
Figure 5 shows the differences between the global map built using the radar sensor and the global map built starting from the optical one.
In order to meet project AURORA specifications, which require independent and complementary sources for the obstacle detection subsystem, the proposed solution exploits two specific maps: a Vision local map and a Radar global map, as shown in the diagram of
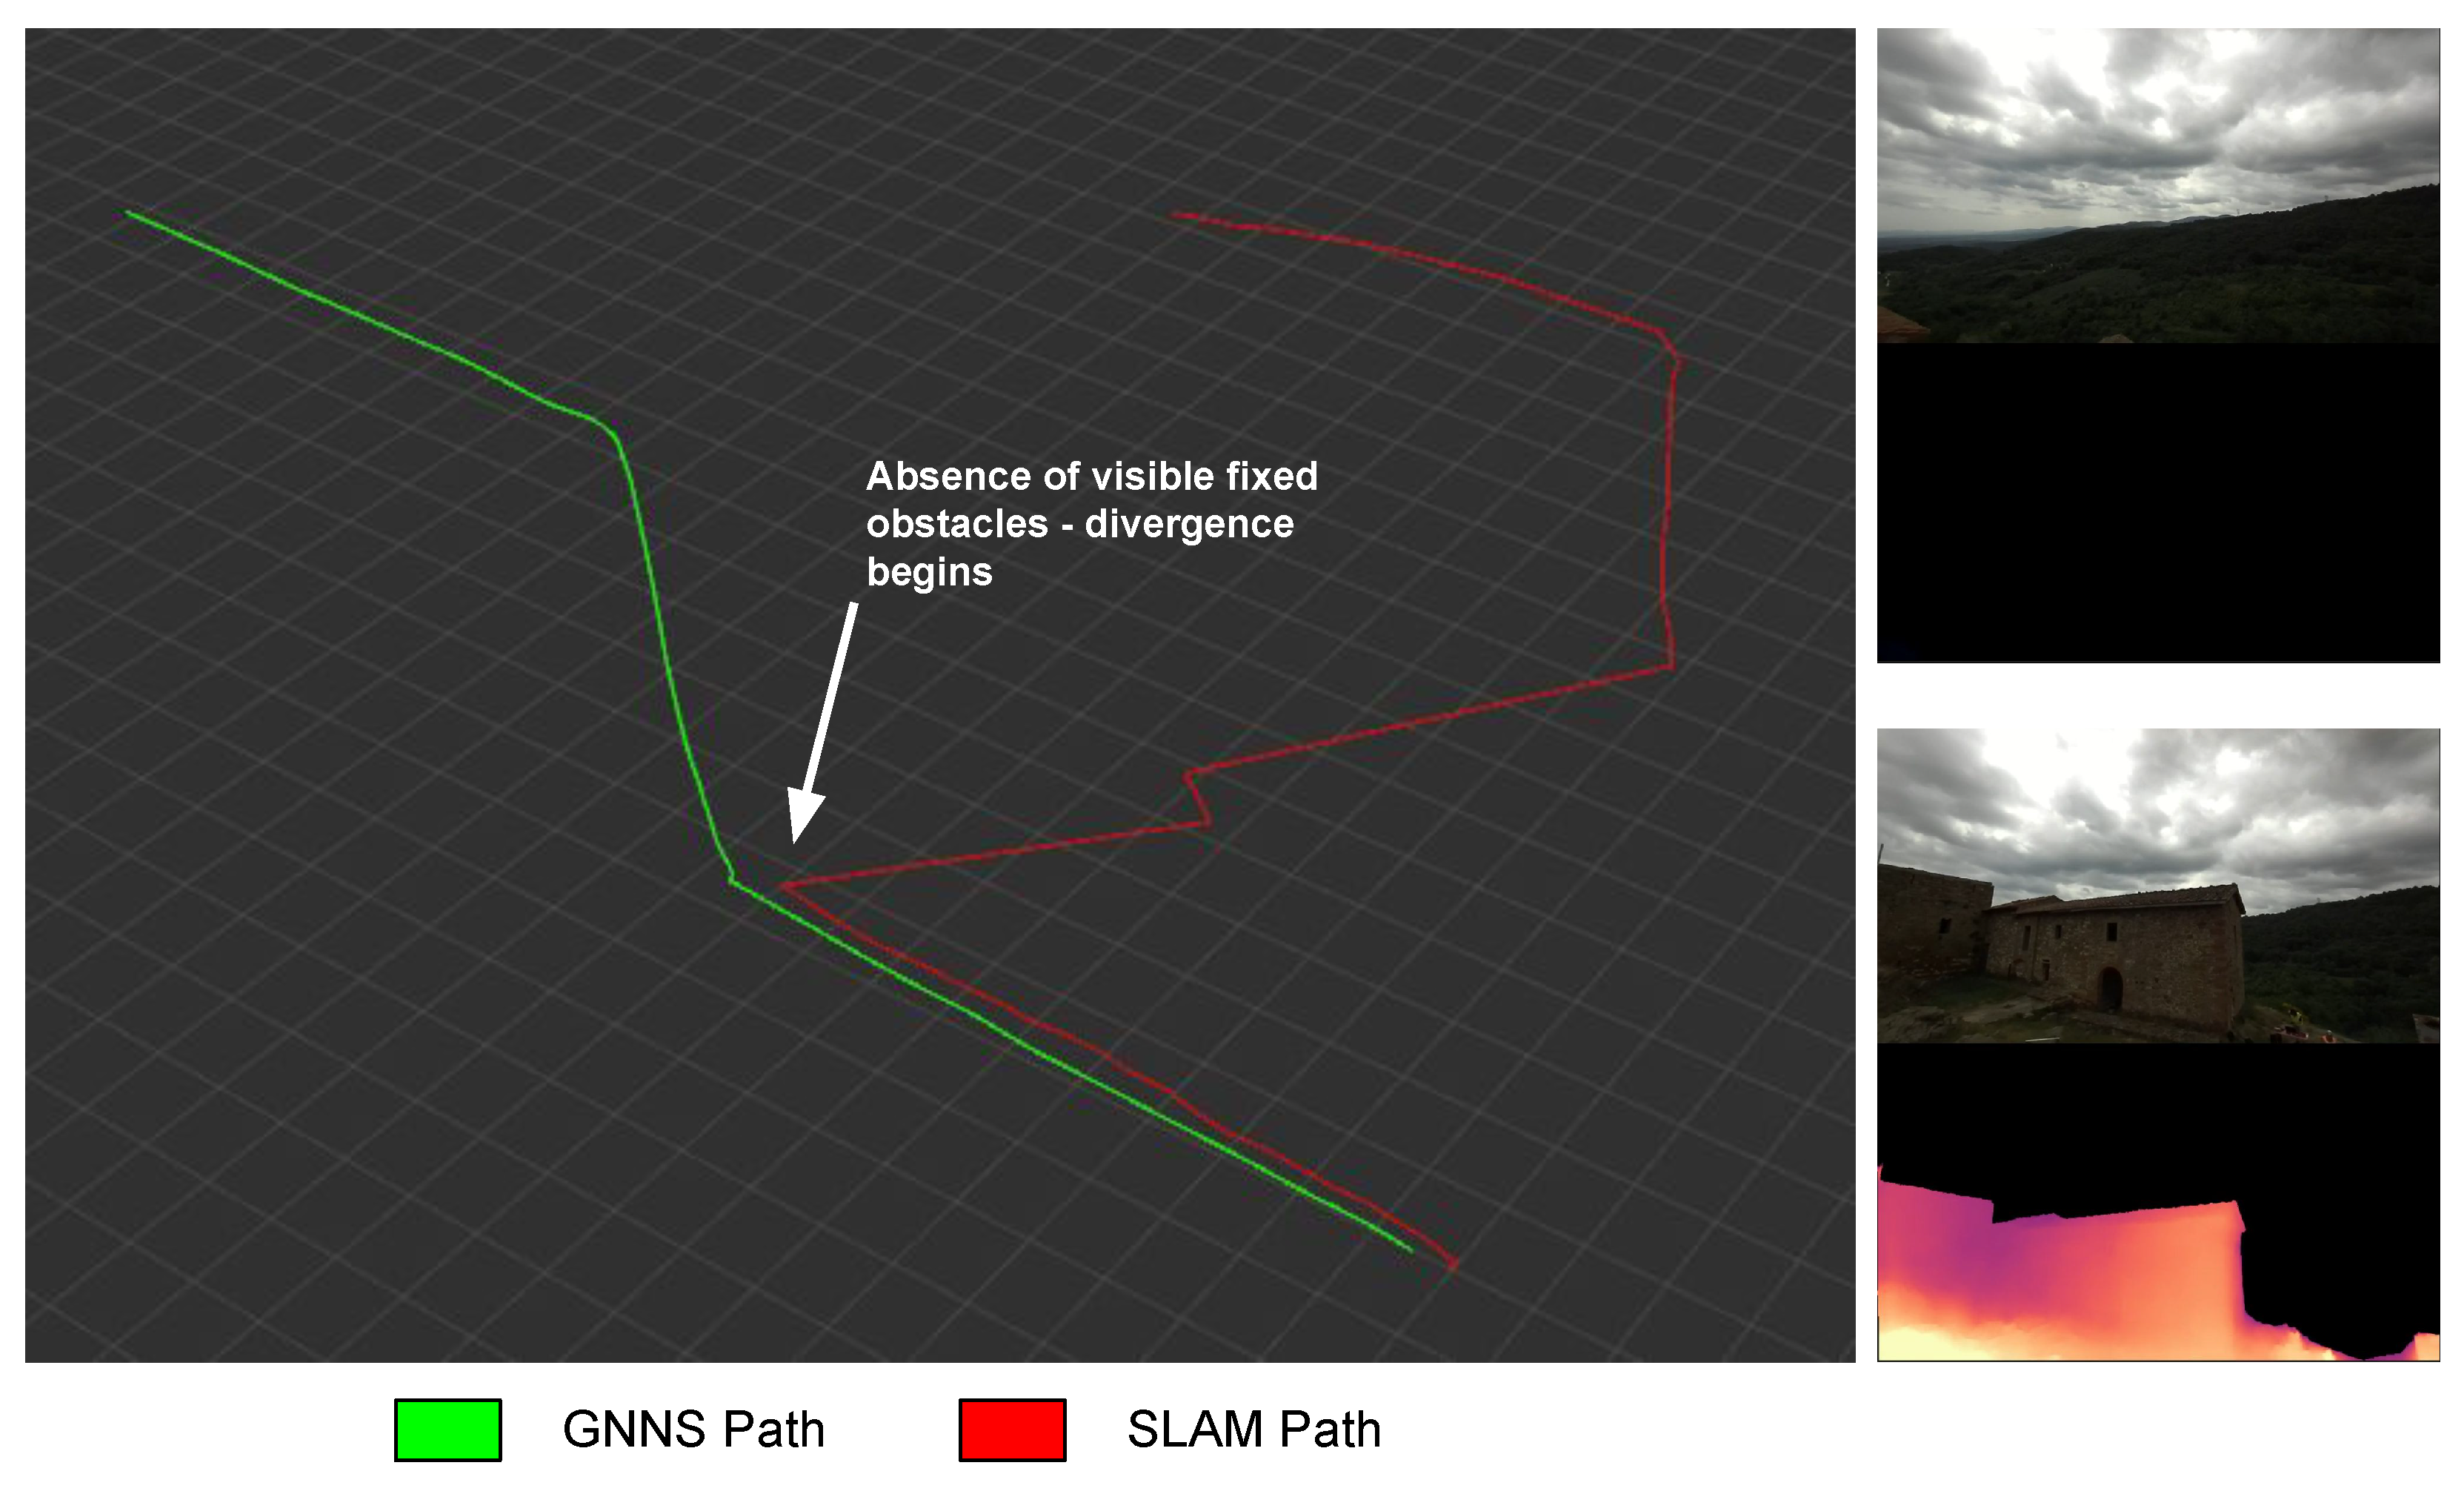
Figure 4. In particular, the vision maps are computed using the position estimate obtained from the vision process as a reference. Due to the camera operating range, it is quite common to have no visible objects during a mission for certain time intervals: in these conditions the SLAM process can diverge, creating inconsistencies between the new coordinates entered at the current time and the old ones, giving origin to distortions within the global map (see
Figure 6). For this reason, the global map is to be considered unreliable, while the local map is the best choice for the task since in the latter, there are only the current obstacles, and these are always consistent with the position estimate provided by the SLAM process.
As for the radar obstacles detection, the reasoning for choosing a global map is different: unlike the stereoscopic vision system, the radar has a much lower resolution, so some obstacles may not always be reflective and consequently they could be detected only in certain time intervals. Therefore, a global map reporting all the targets detected during the mission allows for greater safety. It should be also noted that the radar maps, unlike the vision ones, are created using the path received by the RTK system as a reference [
12], which has no particular divergence problems, being based on GNSS localization.
2.6. Obstacle Detection Methodology
Obstacle detection refers to the task of searching for dangerous obstacles in specific regions of the maps introduced in
Section 2.5 in order to guarantee safe UAS autonomous navigation. As already mentioned, the vision system guarantees high resolution for distances within 40 m, while the radar system provides a lower resolution but an operating range up to 120 m [
12]. Therefore, the visual detection algorithm is typically more effective in urban/indoor environments or in lower UAS speed ranges, whereas in larger open environments, and with few obstacles, the radar detection system guarantees safer operations, allowing for faster flight. In addition to this, it must be considered that in urban or indoor environments, there may be poor or incomplete GNSS coverage. In these conditions, the visual detection system is more reliable, not only in terms of resolution, but also because the vision maps are computed using the position provided by the SLAM process, which does not require geolocation data.
In order to be able to detect the presence of dangerous obstacles starting from the two maps used (vision and radar), it is necessary to define a region of interest (ROI) [
25] as a subset of the maps where the obstacles are searched. The approach followed in this article considers any object (static or dynamic) found inside the ROI to be potentially dangerous. The shape of the ROI is defined to ensure that the global trajectory produced a priori by the planner can be considered safe under the condition that no obstacles are inside the ROI. In order to simplify the computational cost of the obstacle search, we make some assumptions about the UAS navigation which are quite reasonable:
- (i)
The flight occurs with the sensors (radar and vision) facing the direction of motion;
- (ii)
The altitude is kept constant during the flight.
Under these operating conditions, we define the ROI as a cylindrical sector with radius
(maximum search depth along the flight direction), a FOV angle
, and vertical height
. This region can be first computed with respect to a reference frame
B centered in the UAS position
and with Euler angles (0,0,
), i.e., with the
axis aligned with the drone heading angle
, as shown in
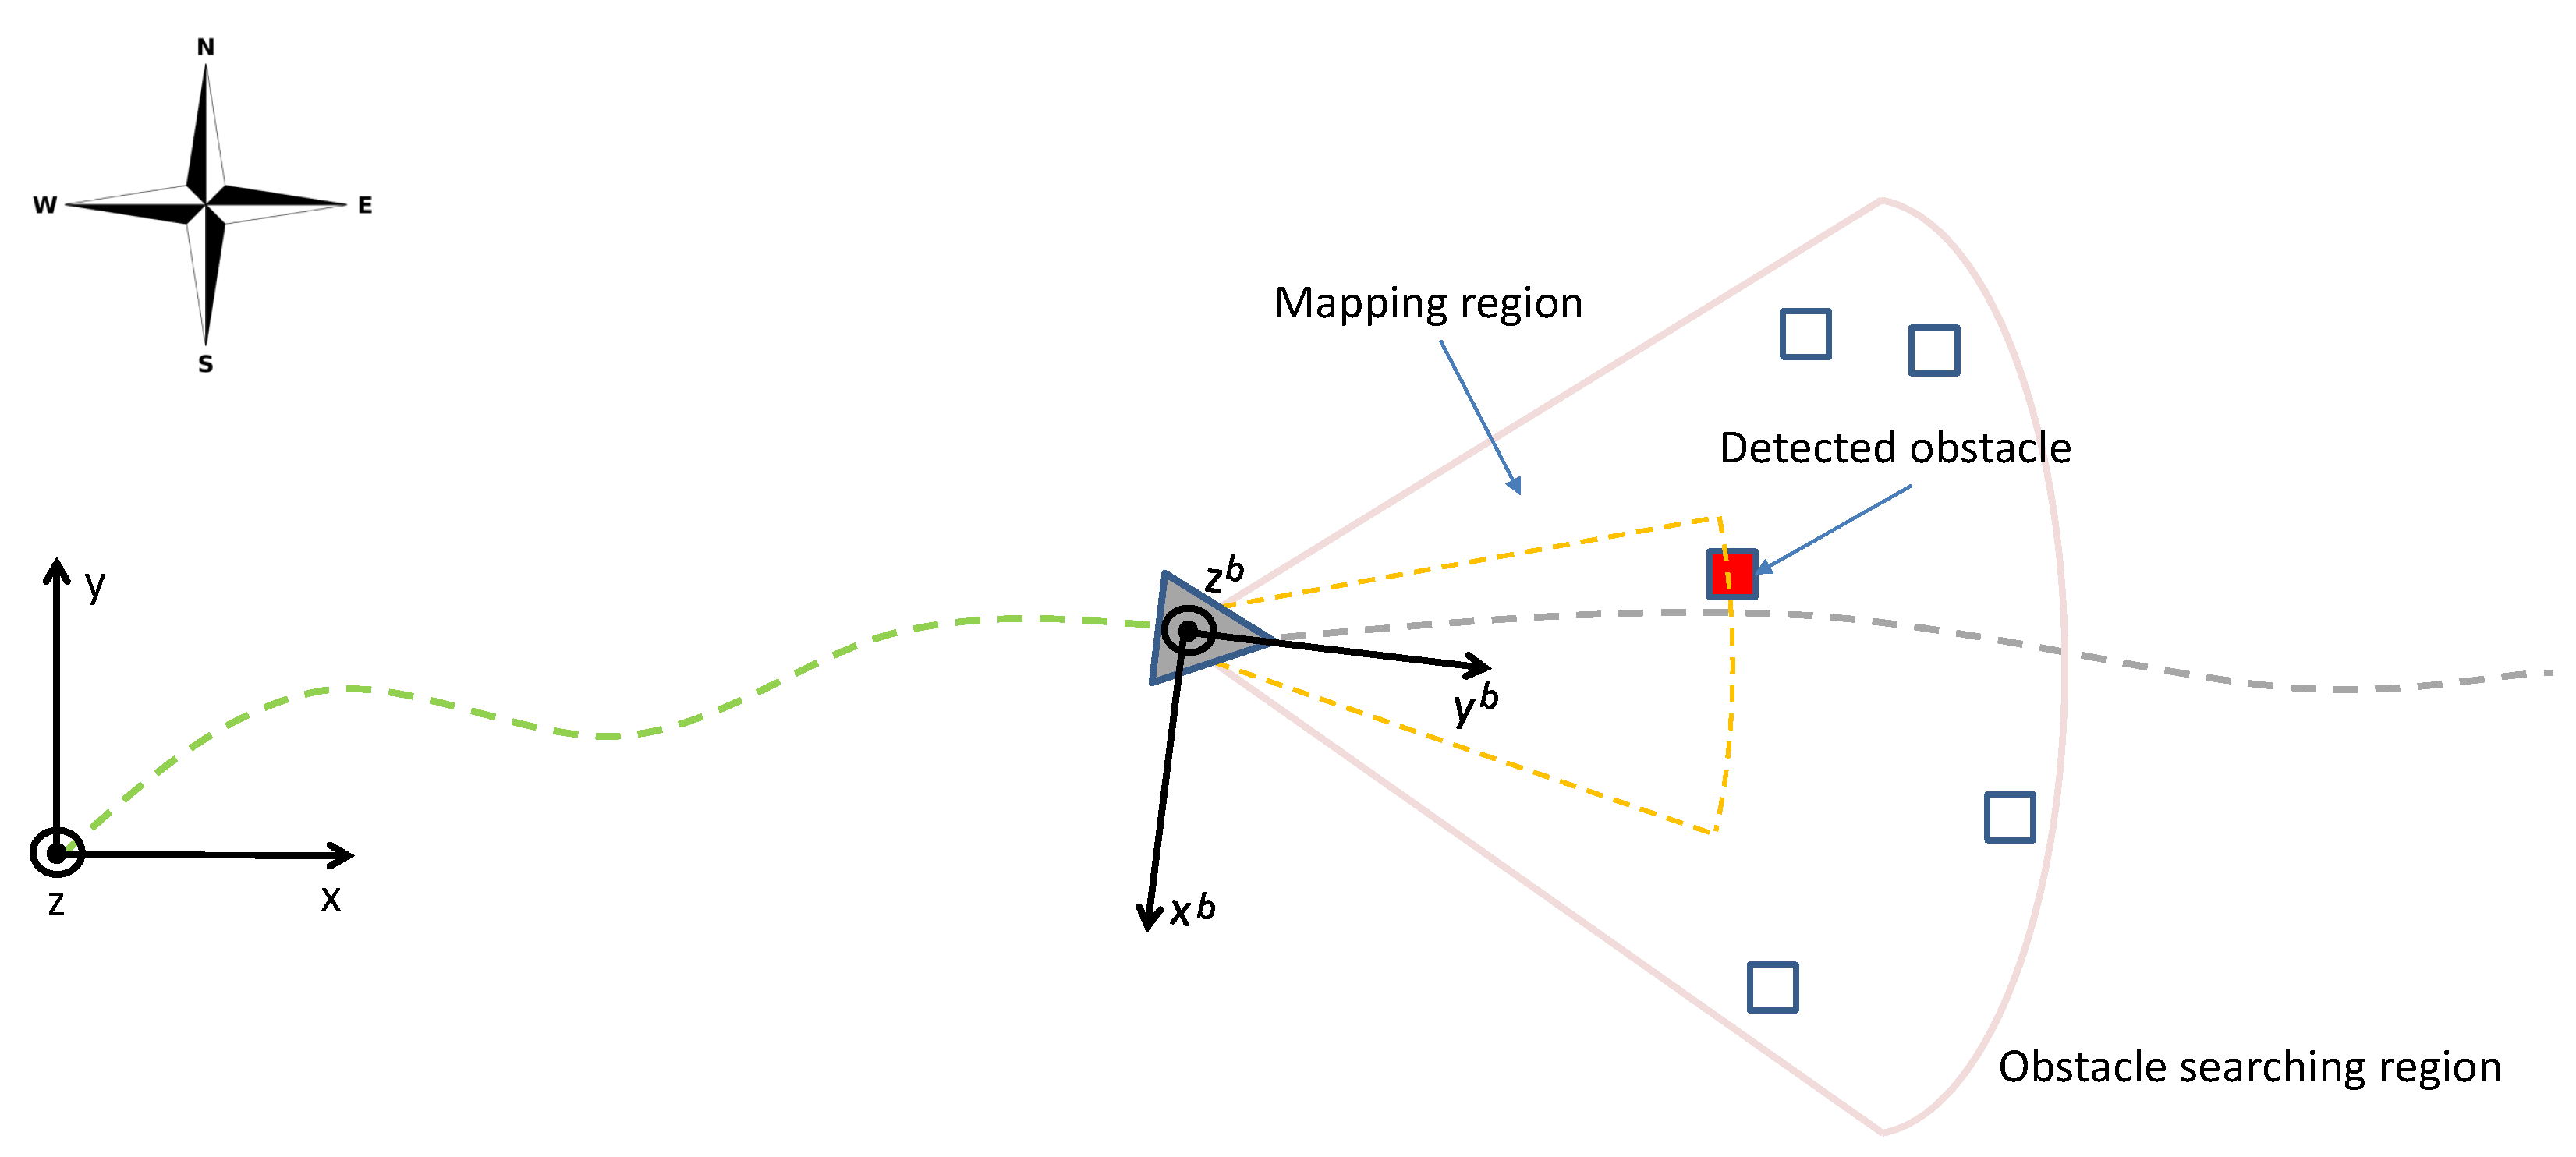
Figure 7. The figure shows a schematic of the detection process applied to the local map: the sensor FOV where obstacles are detected is shown in gray. Instead, the yellow area defines the ROI such that the presence of obstacles in this sub-region is considered dangerous.
As the drone moves along the planned trajectory, the coordinates of the ROI in the fixed reference frame must be updated at each iteration of the algorithm, taking into account the UAS current position and yaw angle through the relation
where
and
are the coordinates of the
i-th point of the ROI in ENU and
B frames, respectively, and
is the corresponding rotation matrix.
This operation can be expensive, and its burden depends on the number
N of points representing the ROI. For this reason, in this article, an efficient algorithm to generate the minimum number of points belonging to the ROI volume, given the map resolution
, is reported in
Appendix A.
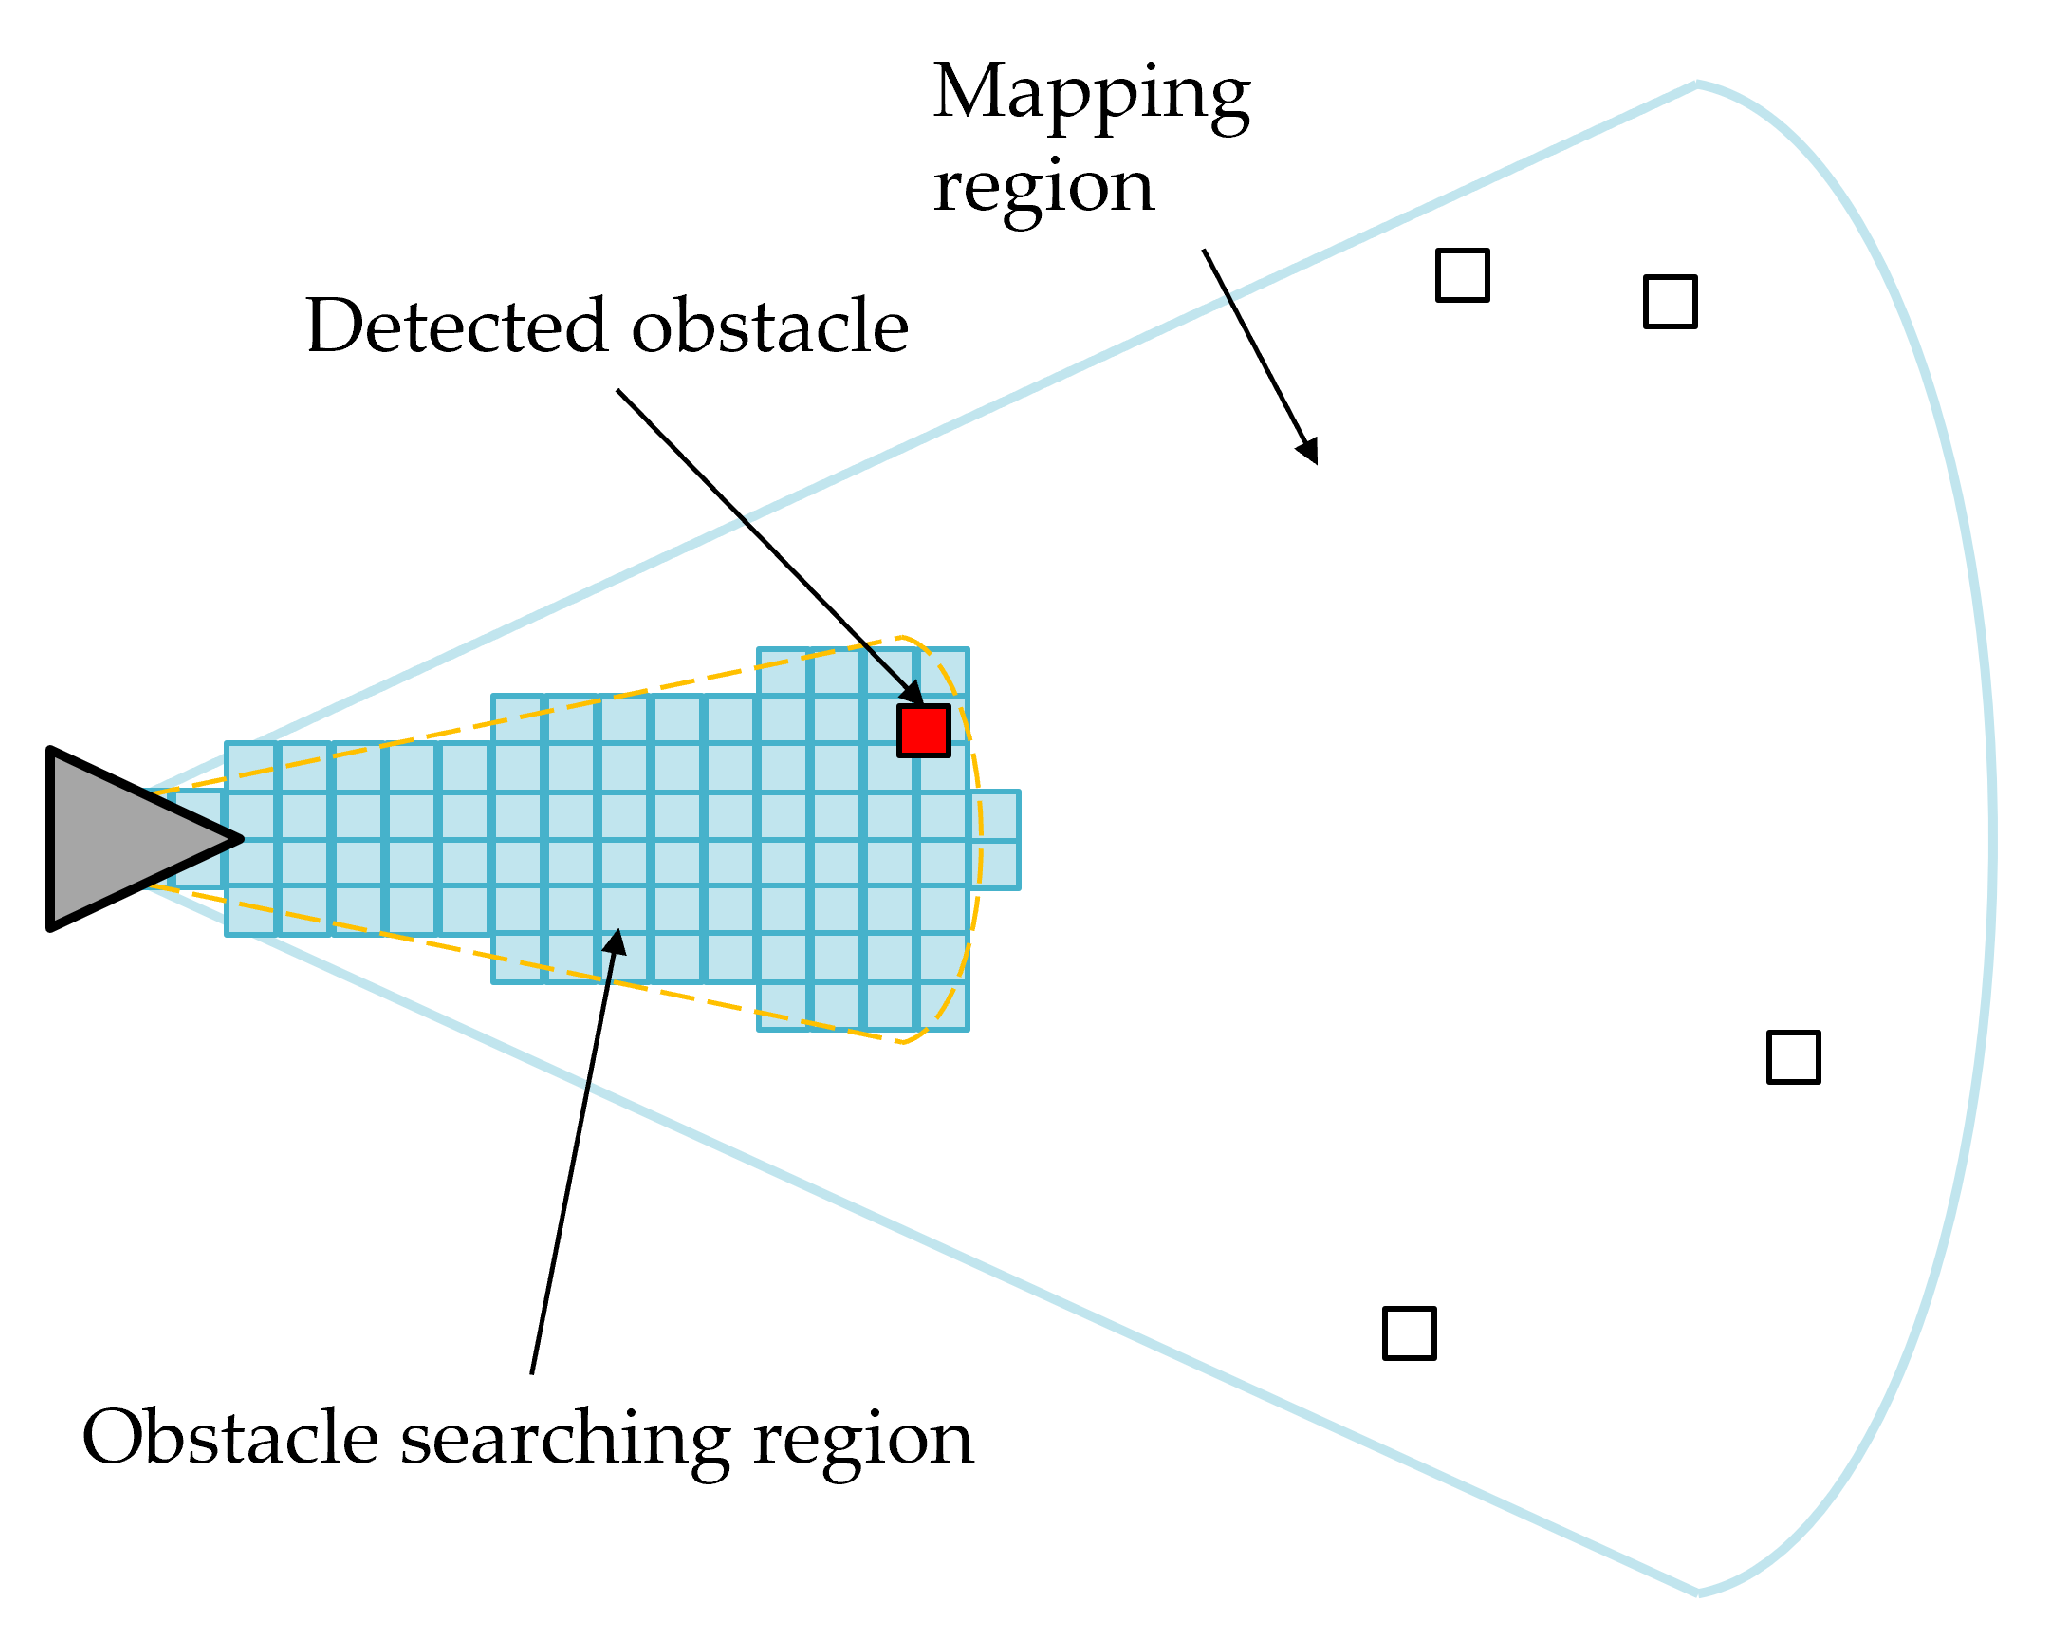
Once all the iterations necessary to update the entire ROI are performed, the result shown in
Figure 8 is obtained, where the relative voxel can be seen for each calculated point. Finally, the last step of the obstacle detection task is to query the radar and vision maps (via the Octomap libraries) using the coordinates of the ROI vectors
in Equation (
1): for each point of the ROI, an occupation probability is returned such that for probabilities greater than a given threshold (
in our experiments), the relative voxel is considered occupied, and an obstacle-avoiding strategy needs to be activated.
It is important to underline that the ROI update algorithm should start calculating the coordinates of the points from those closest to the drone. This is preferable to make sure that the search for dangerous obstacles starts from the most critical points, i.e., those that are closest to the drone.
2.7. Simplified Avoidance Strategy
To carry out the experiments required by the AURORA project, it was useful to design and implement an obstacle avoidance strategy on board the drone. Although in the literature, there are many refined techniques [
26,
27,
28,
29] that could have been used, the main objective of the work package assigned to the University of Florence unit was the development and testing of a fast complementary obstacle detection system exploiting radar and optical sensors. In this context, it was chosen to implement a very simple avoidance strategy able to correctly operate in an open environment.
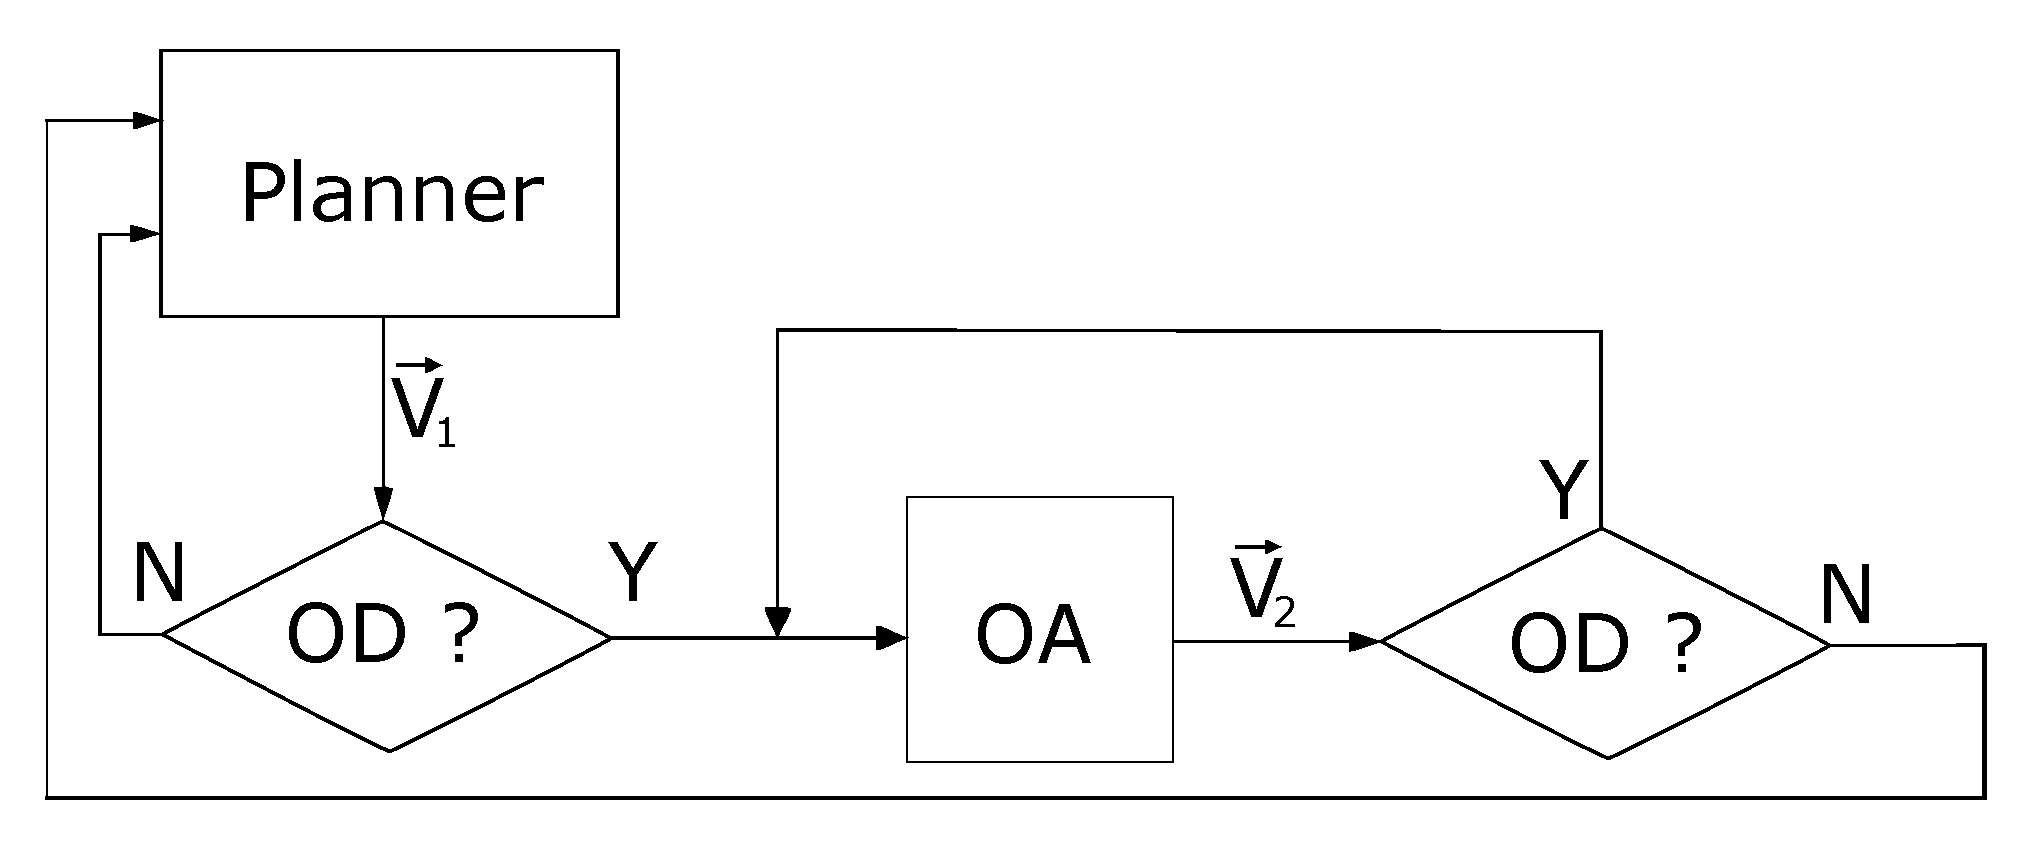
In
Figure 9, a flowchart shows the workflow of the algorithm: during the autonomous mission, the planner and the obstacle detection (OD) blocks are enabled. As long as no obstacles are detected inside the ROI, the OD block keeps the planner generating a trajectory through a velocity reference
. When the OD task detects the presence of one or more obstacles, it disables the planner by interrupting the loop connection and activates the obstacle avoidance (OA) block, which remains active as long as there are obstacles inside the ROI. As already mentioned, a simplified avoidance strategy was implemented by switching to a velocity reference vector
, which corresponds to an increase in altitude. This state persists until no more obstacles are found in the ROI such that the standard mission planner can be re-enabled.
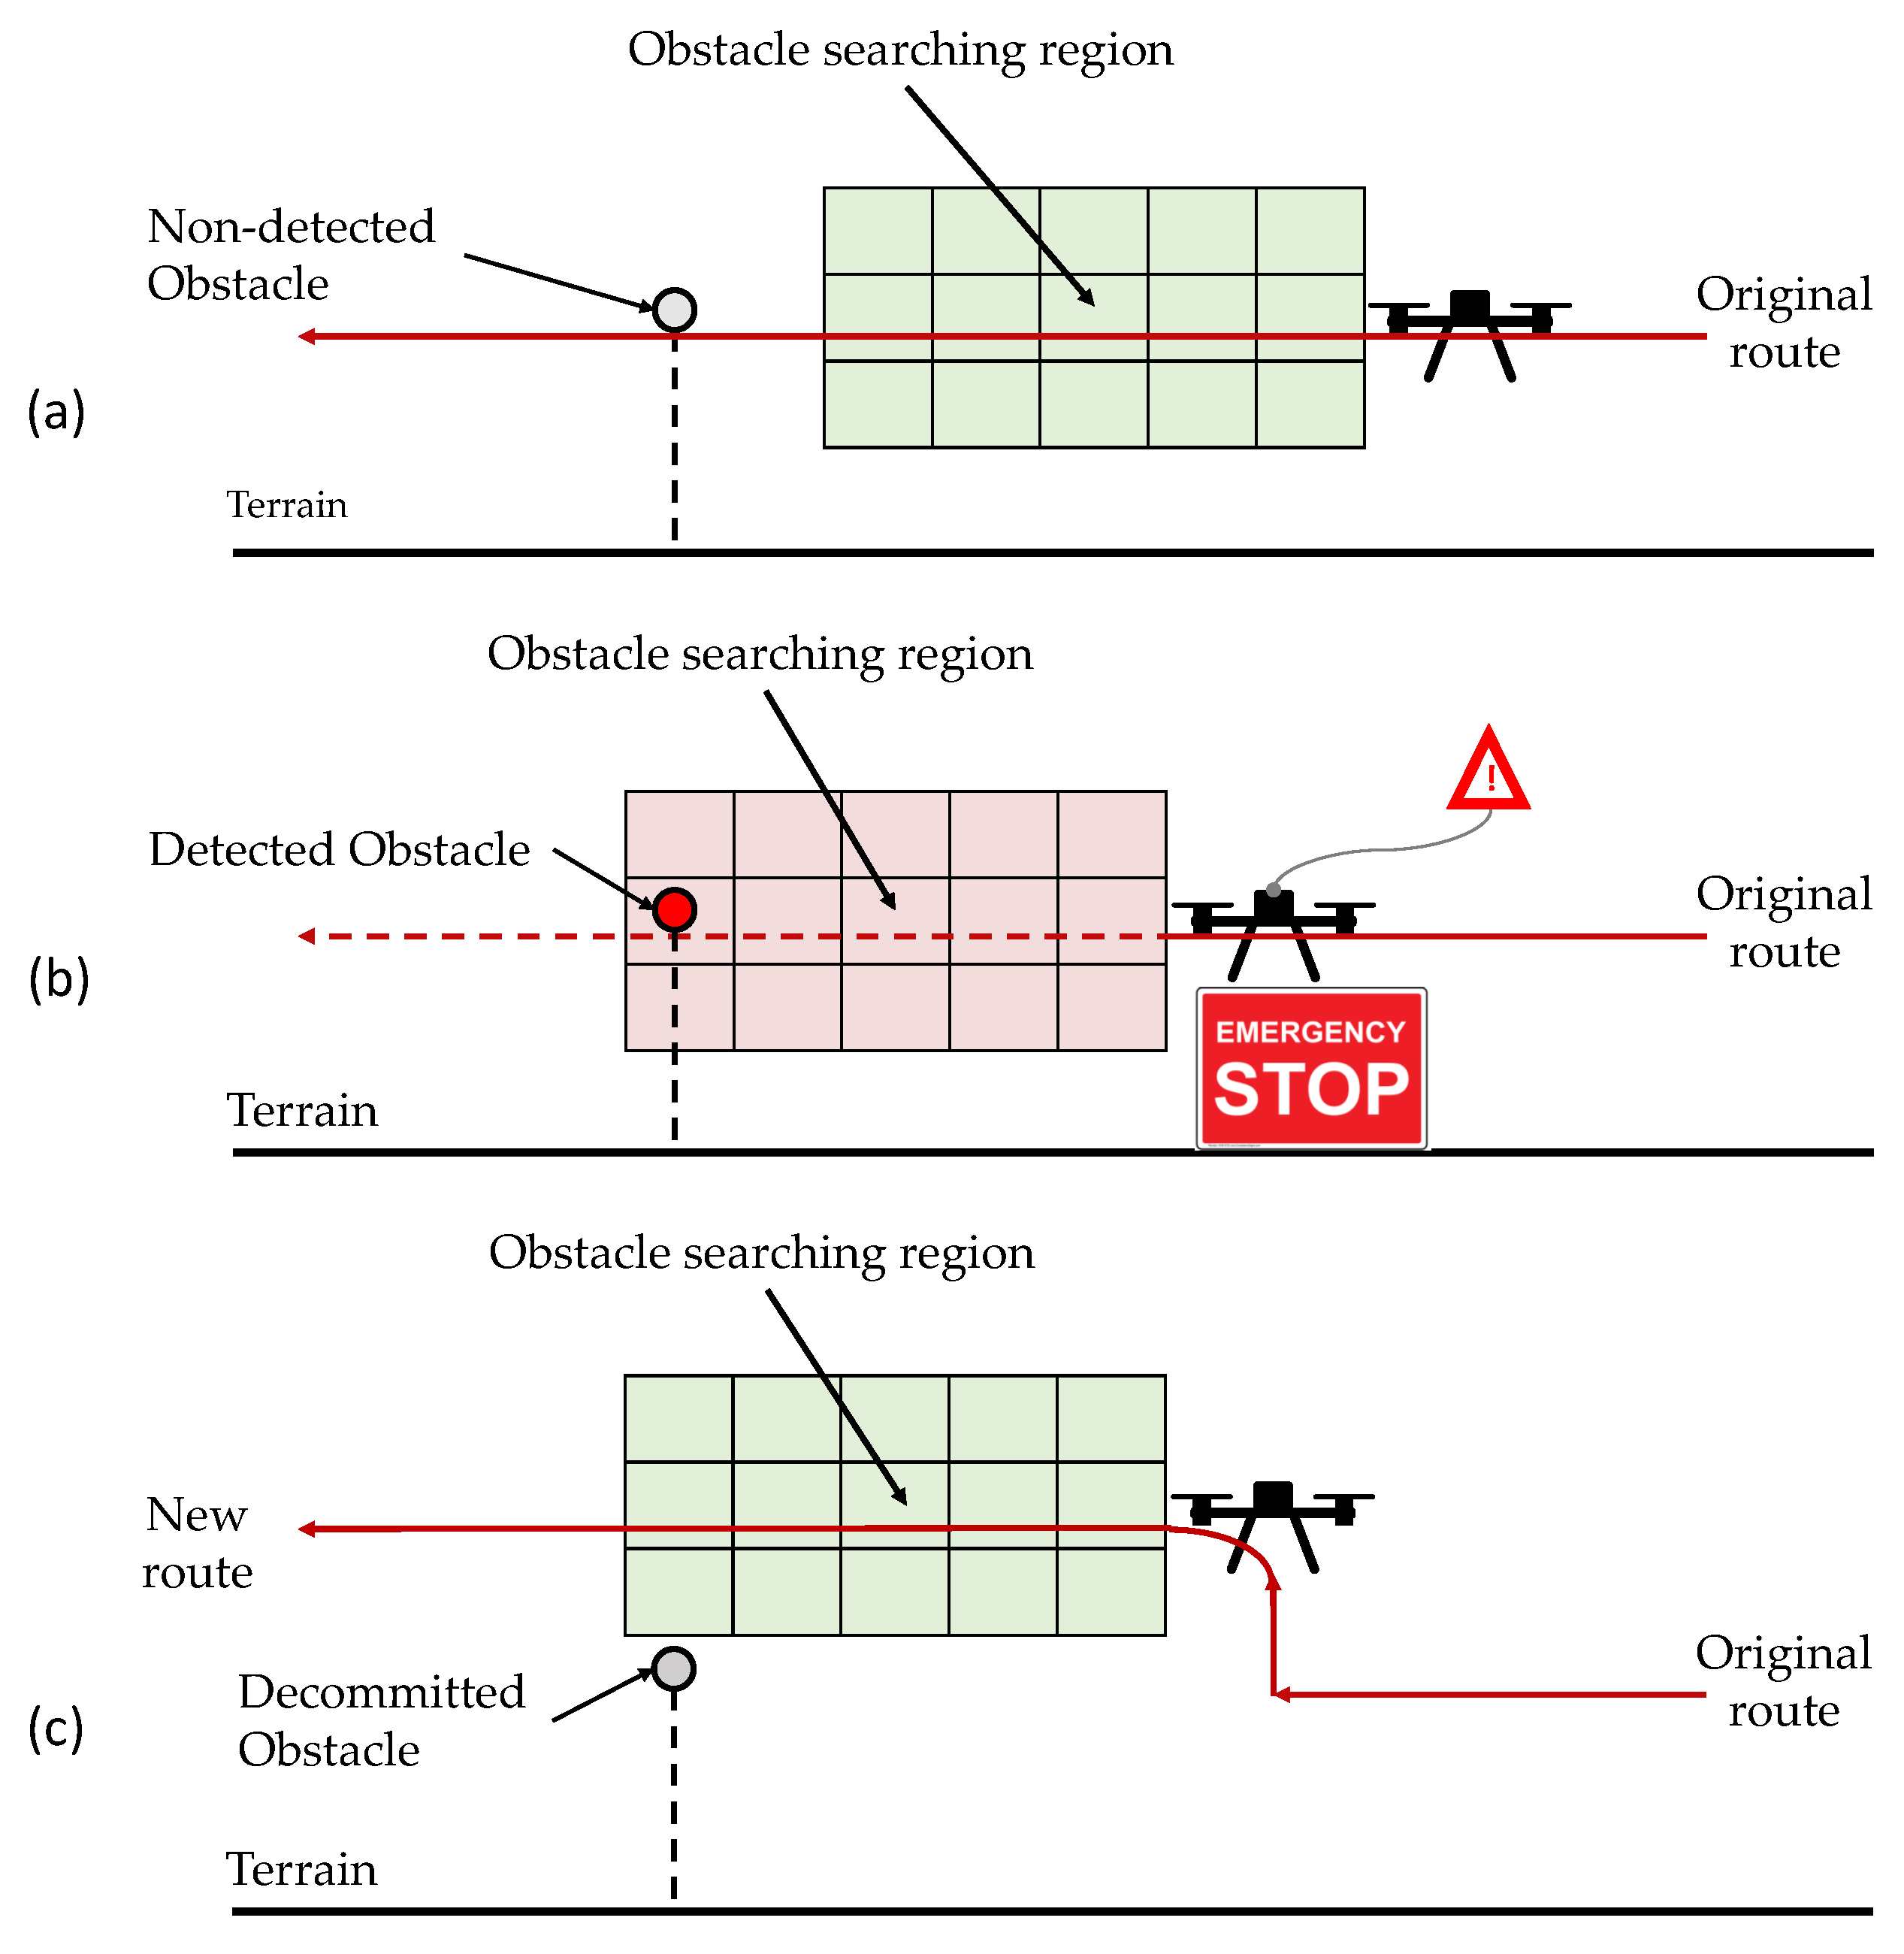
Figure 10 illustrates the different steps of the simplified avoidance strategy.
Notice that this strategy, once enabled, does not allow the subsequent lowering of the altitude for realignment with the global path. This means that the mission will be completed at a higher altitude than that of the path defined a priori. However, this is not a problem since, as already mentioned, the avoidance strategy has been implemented only for testing the detection system.
3. Results
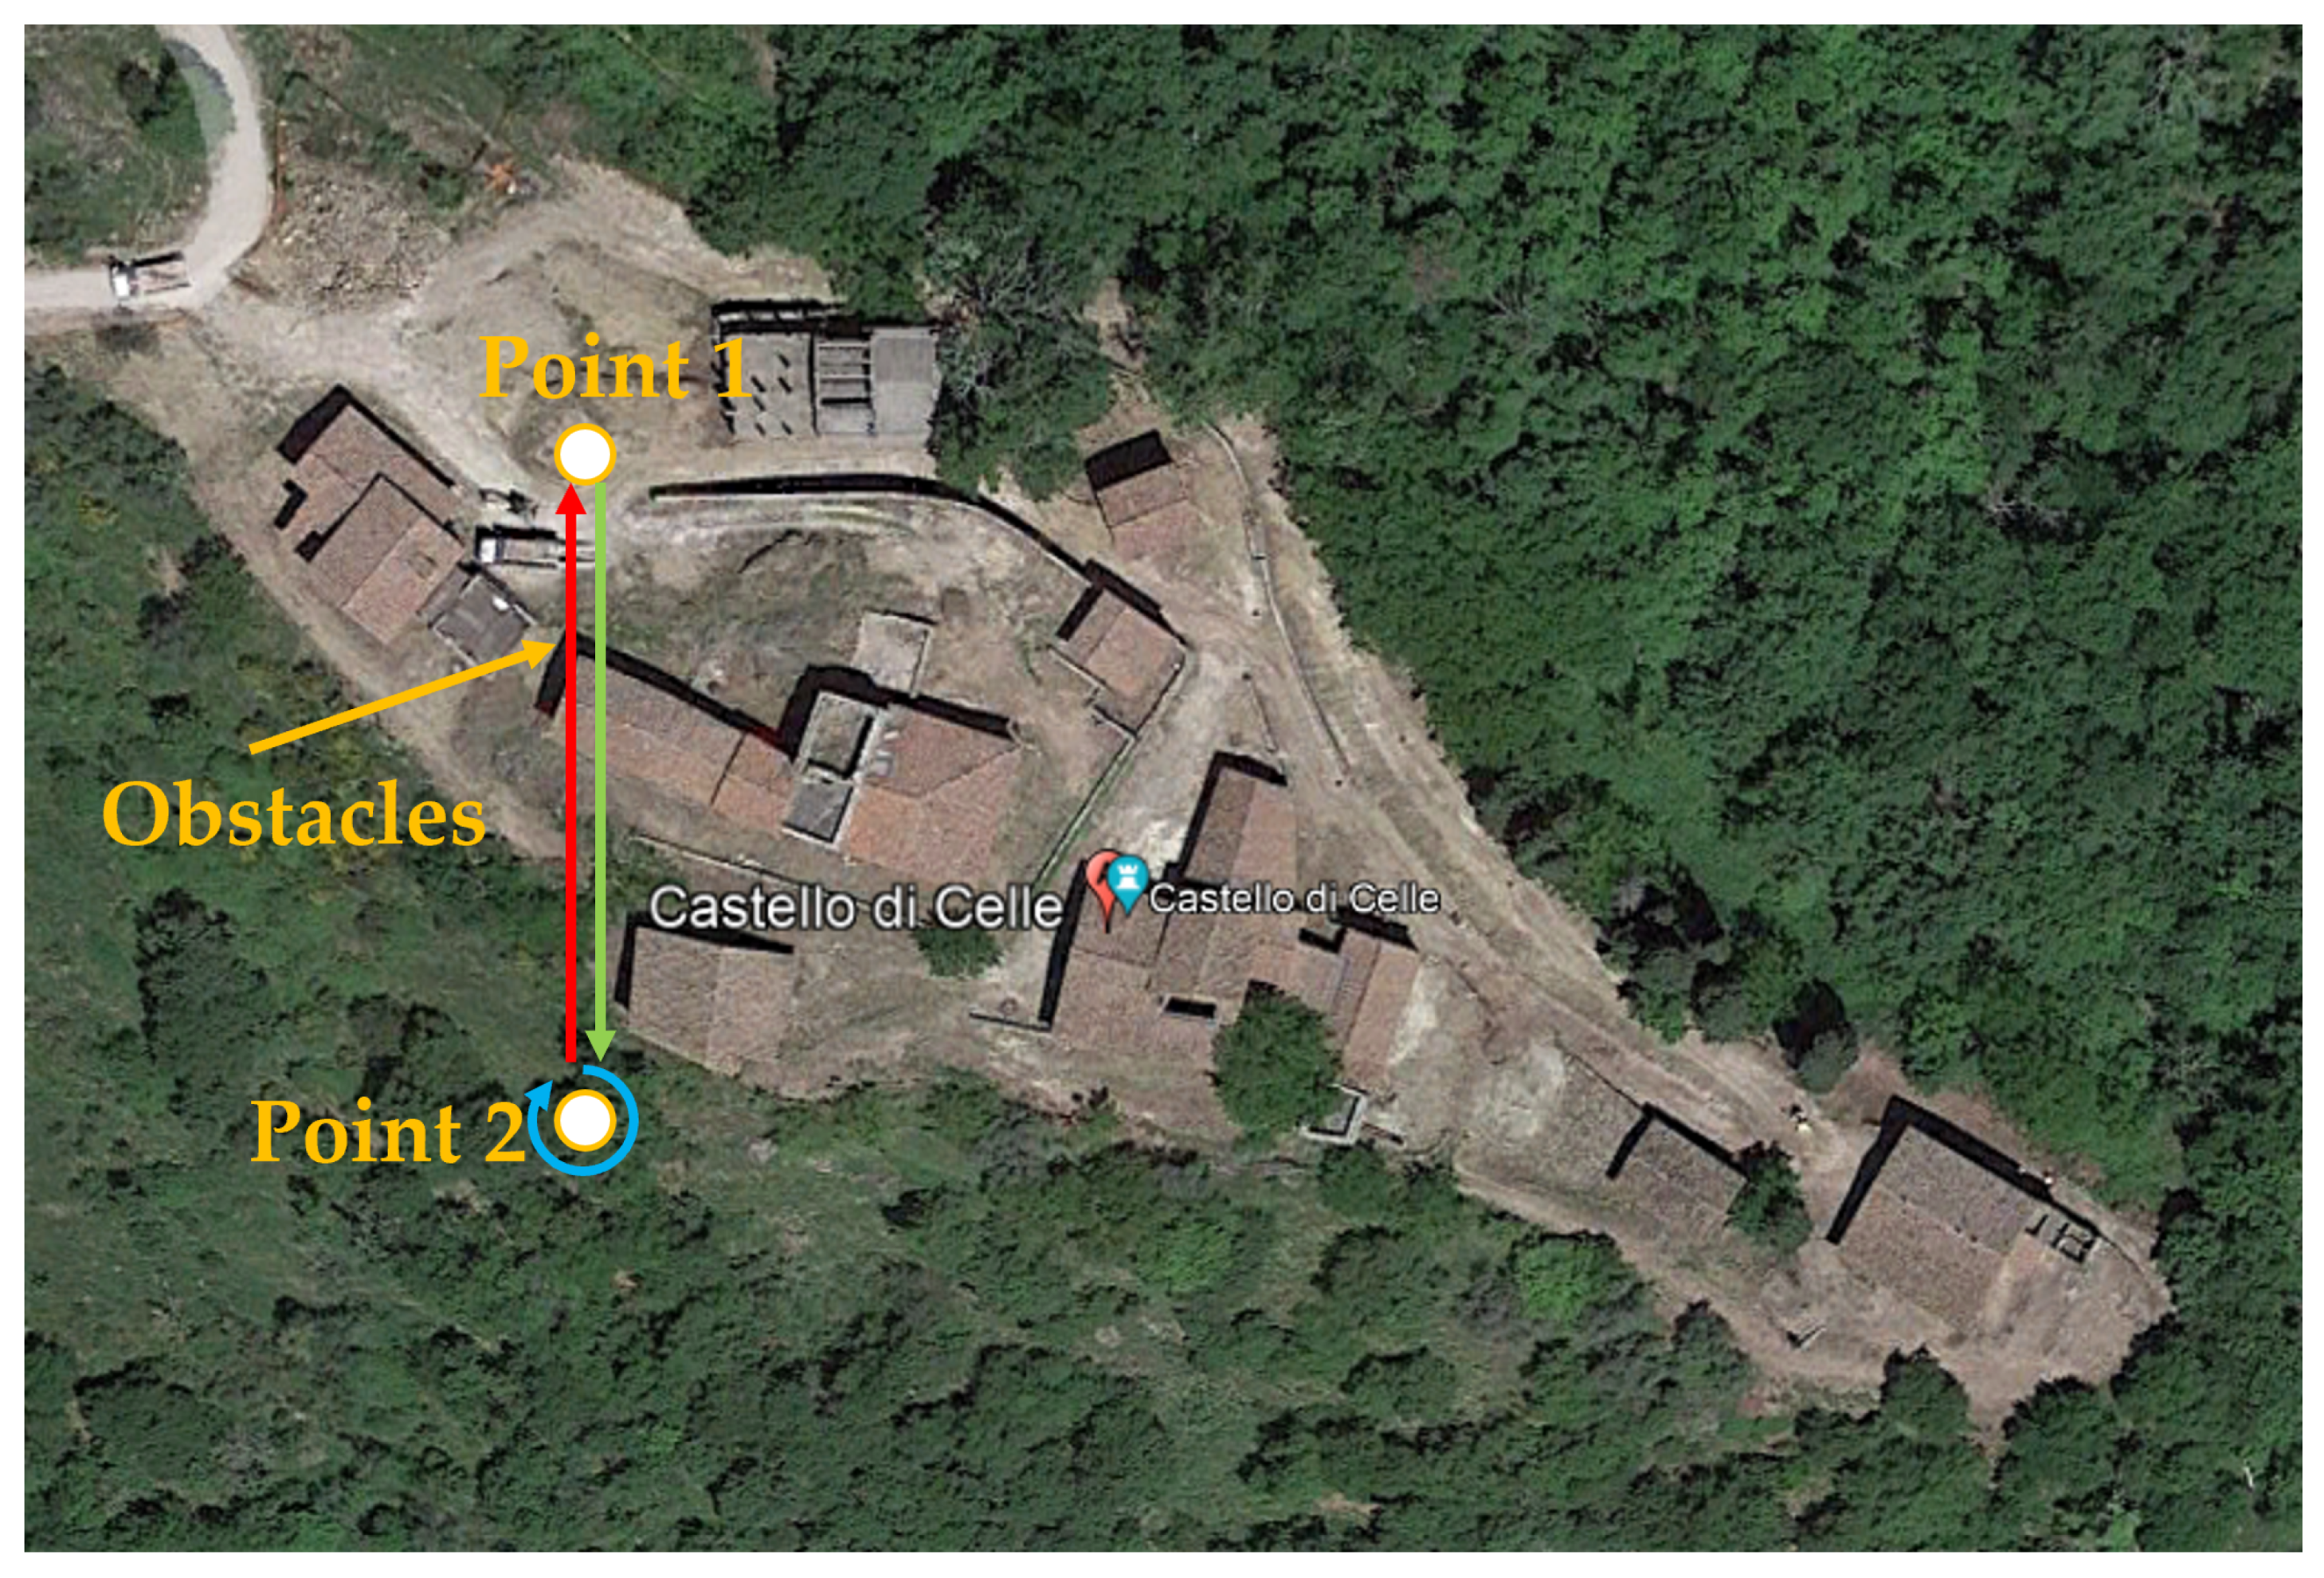
The tests were carried out at the Celle castle at Incisa Valdarno (Italy) visible in
Figure 11. To test the correct functioning of the obstacle detection and avoidance system in the planner, an autonomous mission was preloaded inside the control node, where the global trajectory consists of a straight path that collides with one of the buildings present on the site. Considering the type of environment in which the tests were carried out, to prevent the avoidance strategy from immediately starting to work, the desired depth of the ROI was set at 7 m for the vision and 10 m for the radar.
The trajectory that the drone needs to follow is shown in
Figure 12. This mission foresees an automatic take-off from point 1, an arrival in point 2 and a return to the take-off point with consequent landing. All phases of the mission were managed on board the Jetson, which triggered the avoidance strategy explained in the previous section as soon as the ODS node detected the presence of a building.
Since the two detection systems (radar and optical) are able to work independently, several missions were carried out in order to separately test each sensor.
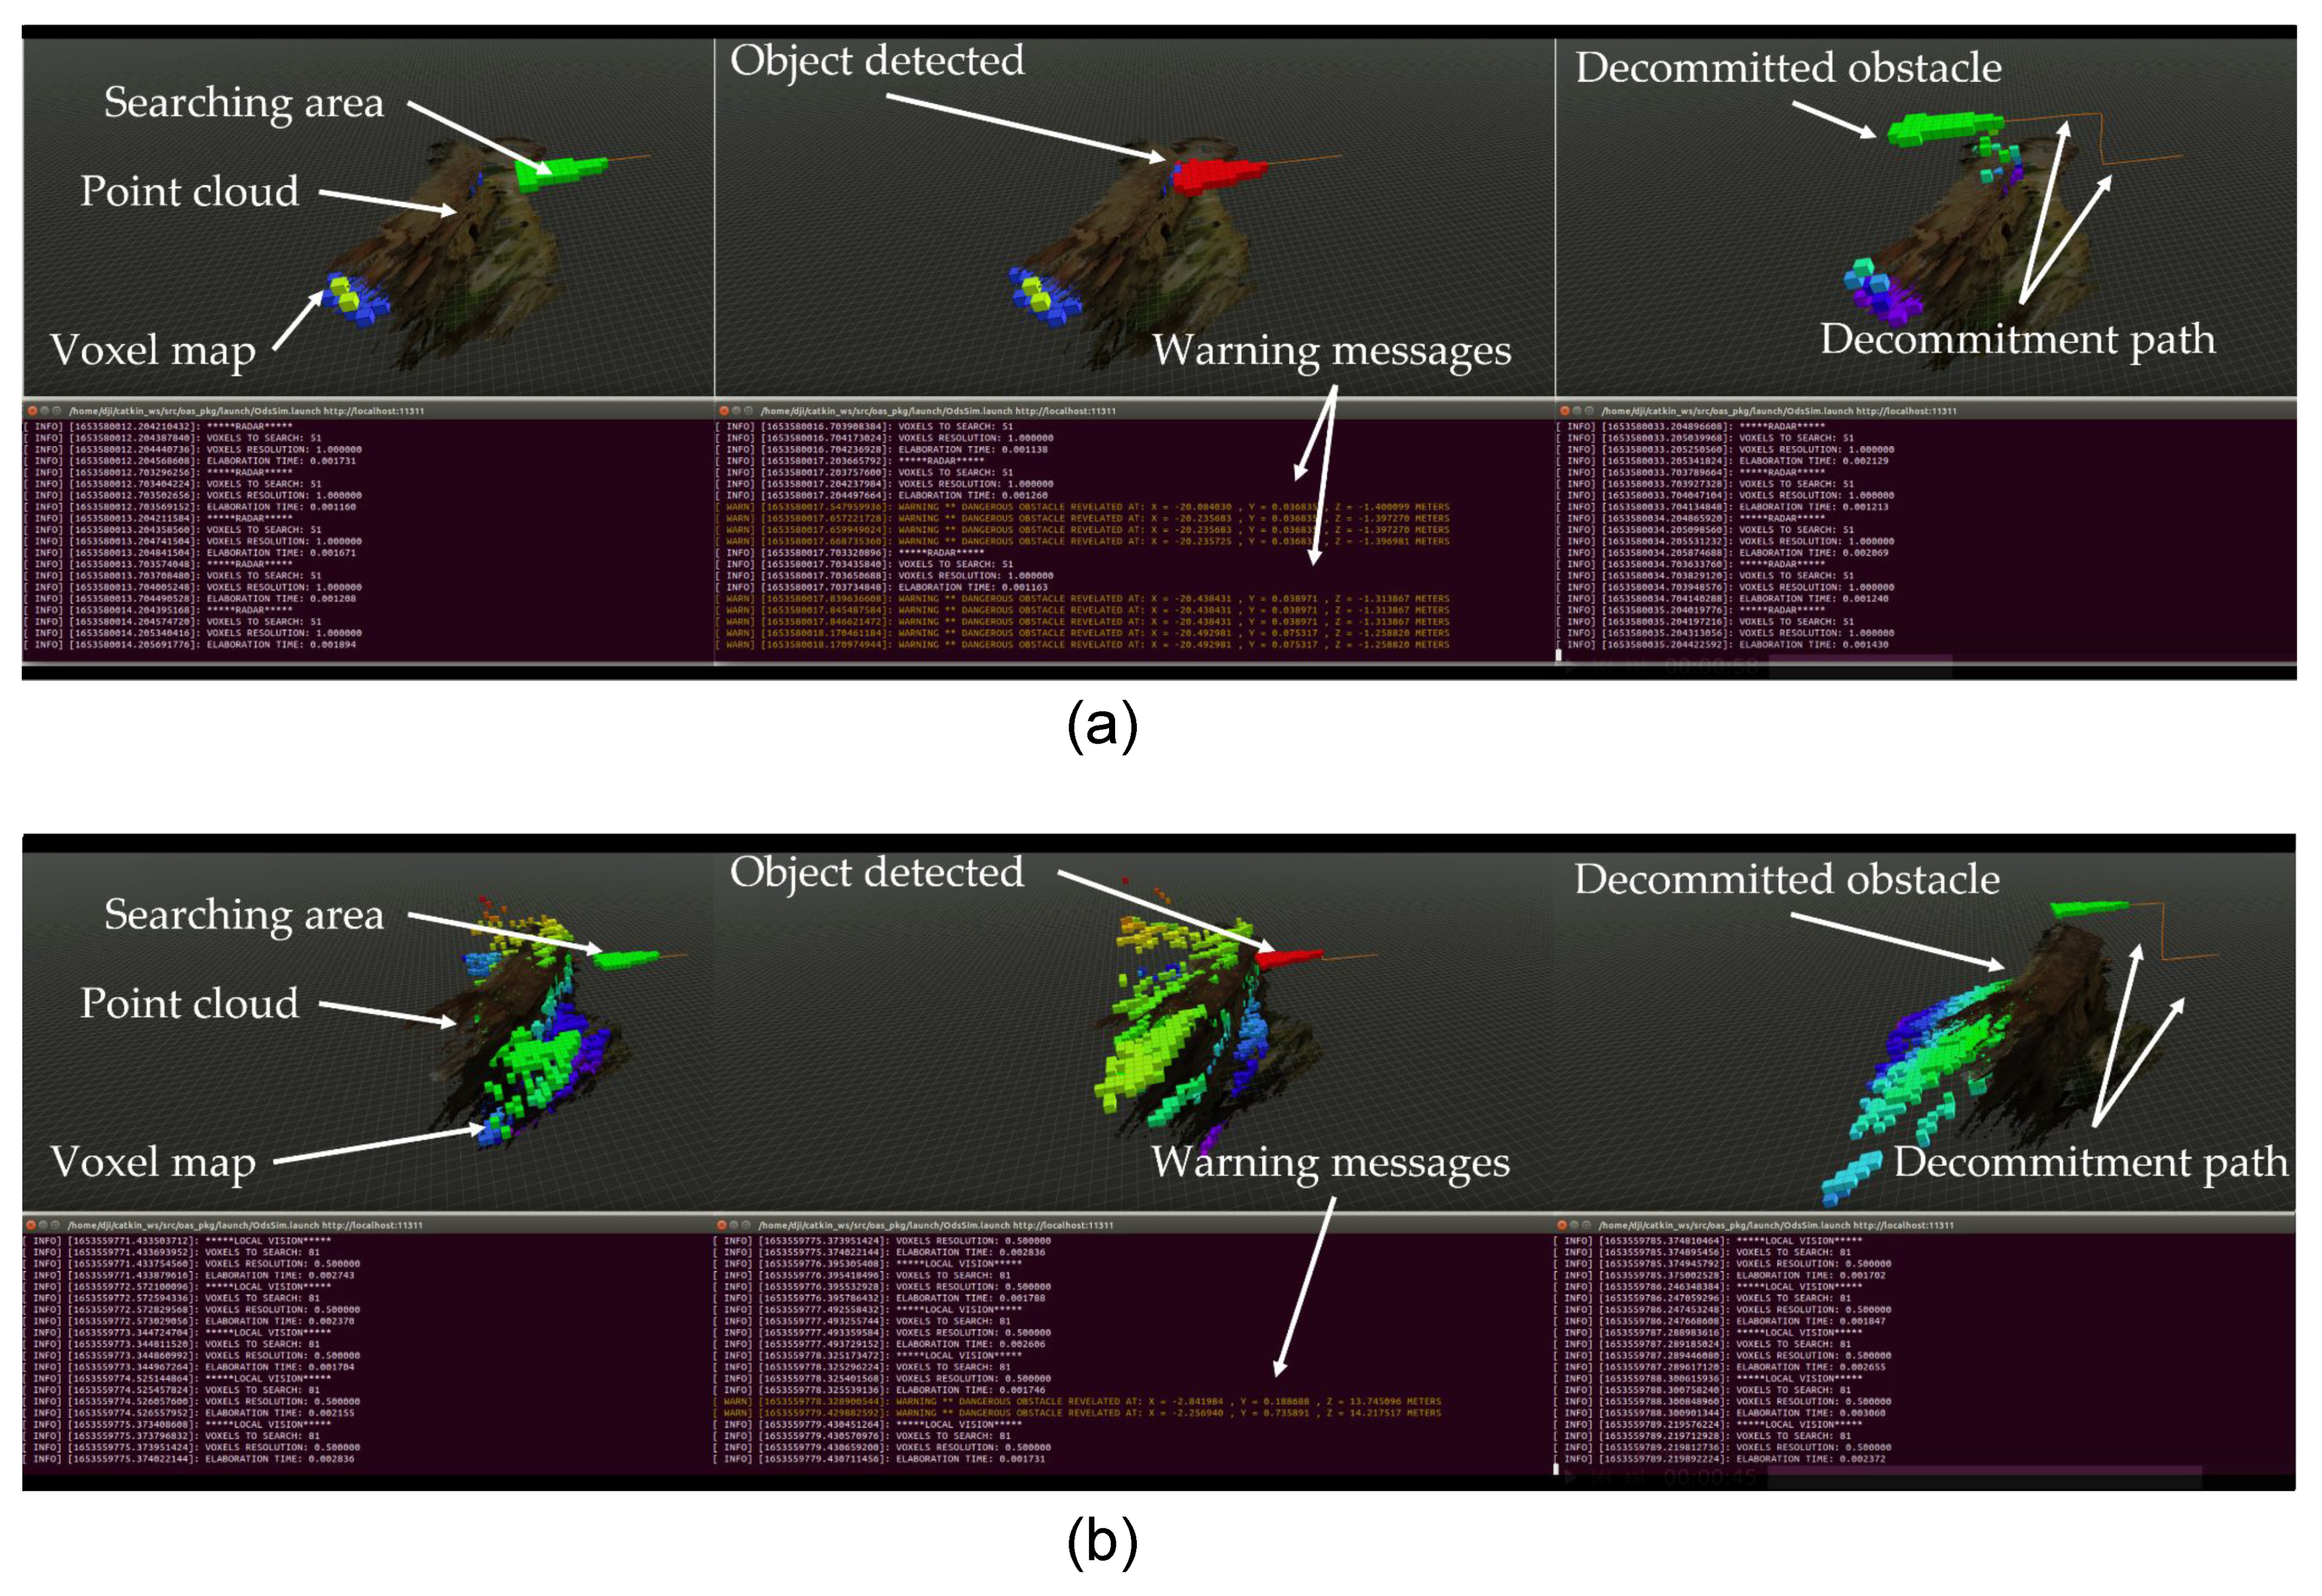
Figure 13 presents the results obtained by enabling first the radar detection system and then the optical one. On the top row of
Figure 13a, three snapshots of a mission for the radar detection system are shown together with the voxels relating to the global map and the voxels that make up the ROI. In the central image, the ROI turns red since the algorithm detects an obstacle (the edge of a building). Instead, the bottom row shows the text area, where the ODS node starts publishing the warning messages with the coordinates of the detected obstacles (central image) and the function that implements the avoidance strategy (right image). This leads the drone to climb in altitude and subsequently to pass the building, avoiding the collision. A similar behavior can also be observed for the optical detection system, visible in
Figure 13b.
As already explained, the resolutions that the two sensors can provide are very different: in fact, for the global radar map, only the voxels relating to the edges of the building are displayed, being more reflective, while in the optical local map, the entire visible wall of the building is filled with voxels. In this regard, the resolution of the radar maps is set at 1 meter, while for the vision maps, it is equal to 0.5 m. Since the radar has less resolution, it is safer to increase the volume associated with the single obstacles detected.
Table 1 shows the average update times for the coordinates of the ROI as a function of different desired depths. Obviously, at greater depths, the algorithm must calculate a larger number of voxels, and consequently, the complexity increases. These timings were achieved by setting a map resolution of 0.5 m and a FOV of 24 degrees.
As can be seen, even at the maximum search depth (120 m), the average update time is only 46.2 ms. This allows for the effective real-time detection of dangerous obstacles, thus maximizing the time available for the implementation of the avoidance strategy.
4. Discussion
The experimental tests presented in this paper have shown how in an urban scenario, the complementary obstacle detection and avoidance system is always able to detect and avoid dangerous static obstacles along the UAS path. Having adopted a redundant architecture consisting of a radar sensor and an optical sensor, which possess complementary operational features, it is possible to guarantee the detection of dangerous obstacles in different operating conditions, significantly increasing the safety of the entire system. In fact, as already discussed in the previous sections, in addition to having different operating ranges and resolutions between the radar and the optical sensor, in low light conditions, the radar can effectively replace the vision, even for short ranges. In conditions of acceptable brightness, vision can guarantee higher resolutions and therefore greater safety in detecting short-range obstacles. Moreover, redundancy can also be found in the different map reference systems employed: radar maps are based on GNSS geolocation data, while the vision maps use an independent position reference obtained from the optical SLAM process. In this way, if the satellite coverage fails, the vision maps will continue to function correctly and vice versa.
It is important to note that research associated with radar maps can involve larger regions of interest than optical ones, as the radar sensor is able to reach longer ranges. This implies that by appropriately scaling the resolutions of the vision and radar maps as a function of the specific sensor range, it is possible to obtain equivalent calculation times for the related regions of interest. This approach allows to add greater complementarity for the two detection systems.
Future research work will focus on the implementation of more complex avoidance strategies, which, eventually with the help of GPUs, can simultaneously compute multiple alternative trajectories in order to find the optimal one, also avoiding moving obstacles. Another interesting aspect that deserves additional work concerns the study of possible different strategies for the creation and management of radar and vision maps, where, for example, the RTK and SLAM references can be merged or replaced if necessary.
Author Contributions
Conceptualization, M.P. and M.B.; methodology, M.B. and E.B.; software, L.B.; validation, L.B., L.M. and T.C.; investigation, L.B, L.M. and T.C.; formal analysis, L.B.; data curation, L.B.; writing–original draft preparation, L.B.; writing—review and editing, M.P.; funding acquisition, M.P. All authors have read and agreed to the published version of the manuscript.
Funding
This research was co-funded by Horizon 2020, European Community (EU), AURORA (Safe Urban Air Mobility for European Citizens) project, ID number 101007134.
Institutional Review Board Statement
Not applicable.
Informed Consent Statement
Not applicable.
Data Availability Statement
The data presented in this study are available on request from the corresponding author.
Conflicts of Interest
The authors declare no conflict of interest.
Abbreviations
The following abbreviations are used in this manuscript:
| FOV | Field Of View |
| ROI | Region Of Interest |
| SLAM | Simultaneous Localization And Mapping |
| UAS | Unmanned Aerial System |
| GNSS | Global Navigation Satellite Systems |
| RTK | Real-Time Kinematic |
| UART | Universal Asynchronous Receiver-Transmitter |
| ROS | Robot Operating System |
| ODS | Obstacle Detection System |
| OSDK | Onboard Software Development Kit |
| OD | Obstacle Detection |
| OA | Obstacle Avoidance |
Appendix A. ROI Generation Algorithm
This appendix presents an algorithm to define a ROI geometry with the shape of a cylindrical sector, depending on the parameters:
The ROI is computed as the following set of
N coordinates
in the reference frame
B
where the indexes
,
,
are integers depending both on the ROI geometry and map resolution:
In brief, the computation of the
N points of the ROI proceeds along the radius (using the
index) from the origin up to the maximum depth, with a step resolution equal to
. For any generic depth, the
index spans the FOV angle
to compute all the points along the corresponding arc of circle. Finally, the third index
computes a copy of the above planar geometry along the vertical dimension. The number
N of the points computed by the algorithm can be approximately estimated by the ratio between the ROI geometrical volume and the voxel volume, such that
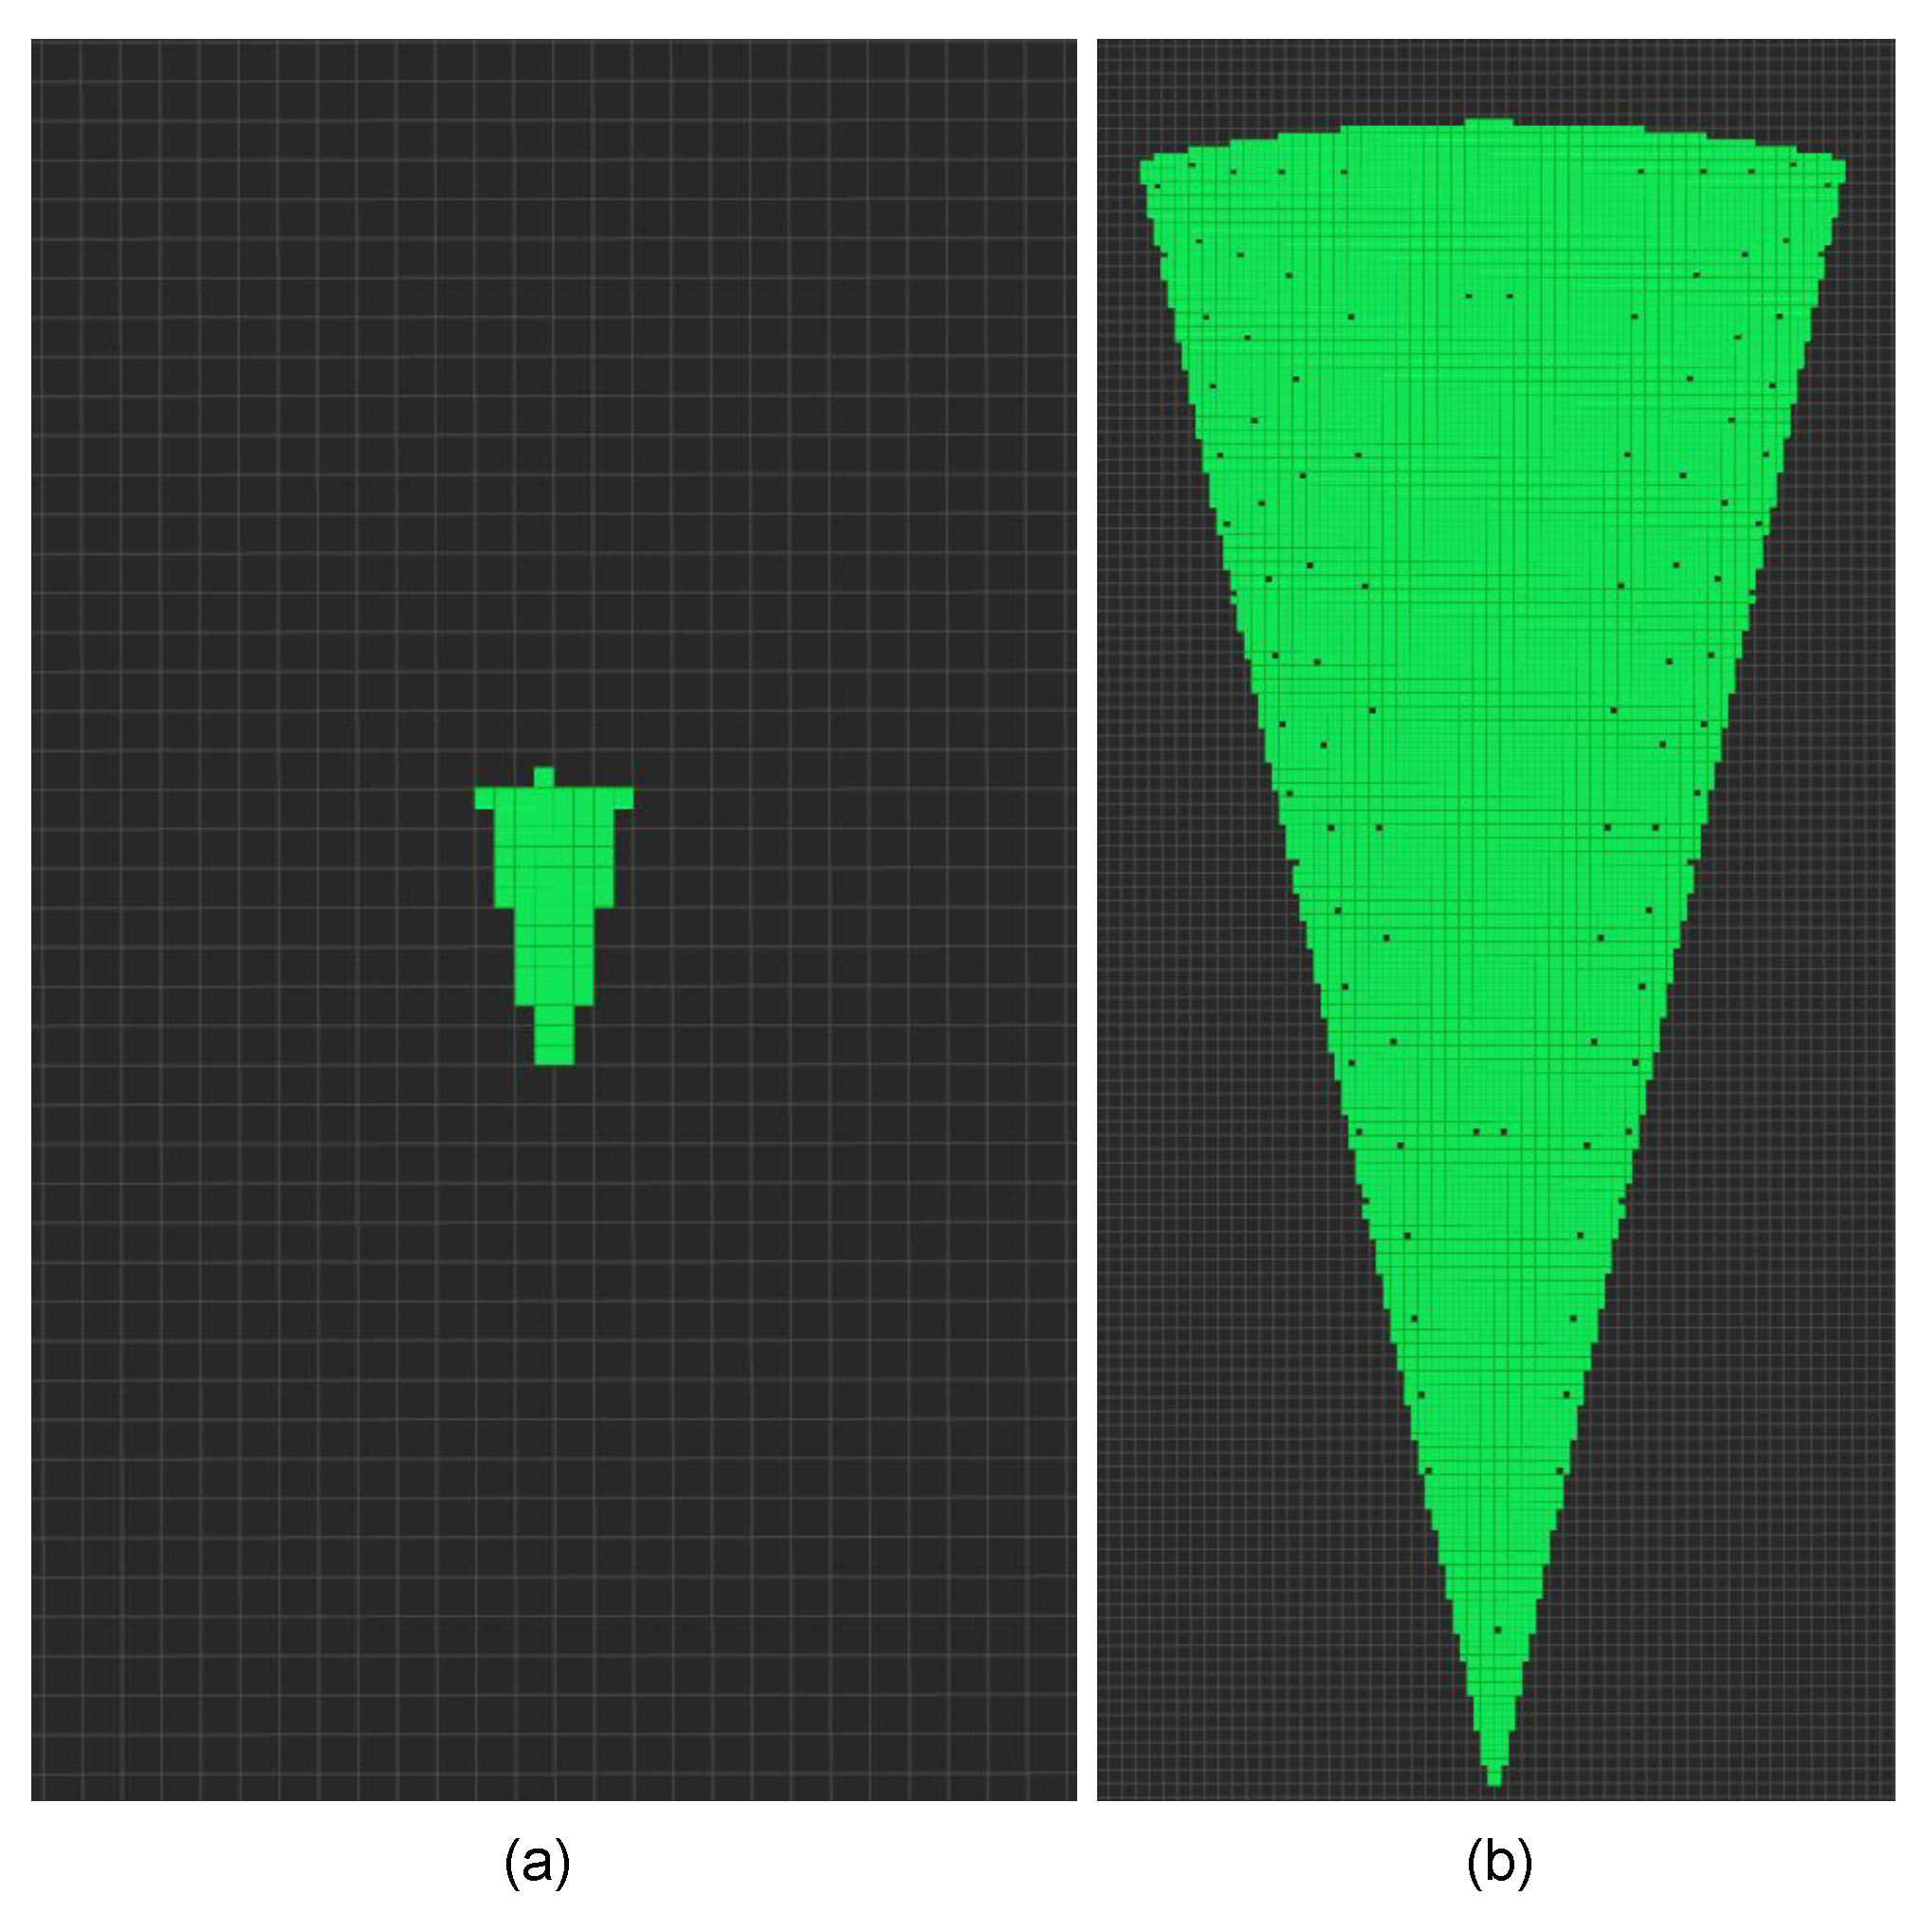
Figure A1 shows two examples of ROI with a common FOV angle of 24 degrees but different depths.
Figure A1.
On the left (a) is the ROI relative to a desired depth of 7 m; on the right (b) is the ROI relative to a desired depth of 120 m. FOV angle is equal to 24 degrees.
Figure A1.
On the left (a) is the ROI relative to a desired depth of 7 m; on the right (b) is the ROI relative to a desired depth of 120 m. FOV angle is equal to 24 degrees.
References
- Samaras, S.; Diamantidou, E.; Ataloglou, D.; Sakellariou, N.; Vafeiadis, A.; Magoulianitis, V.; Lalas, A.; Dimou, A.; Zarpalas, D.; Votis, K.; et al. Deep Learning on Multi Sensor Data for Counter UAV Applications—A Systematic Review. Sensors 2019, 11, 4837. [Google Scholar] [CrossRef] [PubMed]
- Palossi, D.; Loquercio, A.; Conti, F.; Flamand, E.; Scaramuzza, D.; Benini, L. A 64-mW DNN-Based Visual Navigation Engine for Autonomous Nano-Drones. IEEE Internet Things J. 2019, 5, 8357–8371. [Google Scholar] [CrossRef]
- Lo, L.Y.; Yiu, C.H.; Tang, Y.; Yang, A.S.; Li, B.; Wen, C.Y. Dynamic Object Tracking on Autonomous UAV System for Surveillance Applications. Sensors 2021, 21, 7888. [Google Scholar] [CrossRef] [PubMed]
- Bigazzi, L.; Basso, M.; Boni, E.; Innocenti, G.; Pieraccini, M. A Multilevel Architecture for Autonomous UAVs. Drones 2021, 6, 55. [Google Scholar] [CrossRef]
- Bigazzi, L.; Gherardini, S.; Innocenti, G.; Basso, M. Development of Non Expensive Technologies for Precise Maneuvering of Completely Autonomous Unmanned Aerial Vehicles. Sensors 2021, 21, 391. [Google Scholar] [CrossRef] [PubMed]
- Niu, Z.; Liu, H.; Lin, X.; Du, J. Task Scheduling With UAV-Assisted Dispersed Computing for Disaster Scenario. IEEE Syst. J. 2022, 2, 1–12. [Google Scholar] [CrossRef]
- Alex, C.; Vijaychandra, A. Autonomous cloud based drone system for disaster response and mitigation. In Proceedings of the 2016 International Conference on Robotics and Automation for Humanitarian Applications (RAHA), Amritapuri, India, 18–20 December 2016. [Google Scholar]
- Yu, X.; Marinov, M. A Study on Recent Developments and Issues with Obstacle Detection Systems for Automated Vehicles. Sustainability 2020, 12, 3281. [Google Scholar] [CrossRef]
- Gageik, N.; Benz, P.; Montenegro, S. Obstacle Detection and Collision Avoidance for a UAV With Complementary Low-Cost Sensors. IEEE Access 2015, 3, 599–609. [Google Scholar] [CrossRef]
- Yu, Y.; Tingting, W.; Long, C.; Weiwei, Z. A Stereo vision based obstacle avoidance strategy for quadcopter UAV. In Proceedings of the 2018 Chinese Control And Decision Conference (CCDC), Shenyang, China, 9–11 June 2018. [Google Scholar]
- Xiao, Y.; Lei, X.; Liao, S. Research on UAV Multi-Obstacle Detection Algorithm based on Stereo Vision. In Proceedings of the 2019 IEEE 3rd Information Technology, Networking, Electronic and Automation Control Conference (ITNEC), Chengdu, China, 15–17 March 2019. [Google Scholar]
- Miccinesi, L.; Bigazzi, L.; Consumi, T.; Pieraccini, M.; Beni, A.; Boni, E.; Basso, M. Geo-Referenced Mapping through an Anti-Collision Radar Aboard an Unmanned Aerial System. Drones 2022, 3, 72. [Google Scholar] [CrossRef]
- Safa, A.; Verbelen, T.; Keuninckx, L.; Ocket, I.; Hartmann, M.; Bourdoux, A.; Catthoor, F.; Gielen, G. A Low-Complexity Radar Detector Outperforming OS-CFAR for Indoor Drone Obstacle Avoidance. IEEE J. Sel. Top. Appl. Earth Obs. Remote Sens. 2021, 8, 9162–9175. [Google Scholar] [CrossRef]
- Yu, H.; Zhang, F.; Huang, P.; Wang, C.; Yuanhao, L. Autonomous Obstacle Avoidance for UAV based on Fusion of Radar and Monocular Camera. In Proceedings of the 2020 IEEE/RSJ International Conference on Intelligent Robots and Systems (IROS), Las Vegas, NV, USA, 10 February 2021. [Google Scholar]
- Zhang, X.; Zhou, M.; Qiu, P.; Huang, Y.; Li, J. Radar and vision fusion for the real-time obstacle detection and identification. Ind. Robot 2019, 46, 391–395. [Google Scholar] [CrossRef]
- Tsai, Y.; Chen, K.; Chen, Y.; Cheng, J. Accurate and Fast Obstacle Detection Method for Automotive Applications Based on Stereo Vision. In Proceedings of the 2018 International Symposium on VLSI Design, Automation and Test (VLSI-DAT), Hsinchu, Taiwan, 16–19 April 2018. [Google Scholar]
- Kim, J.; Han, D.S.; Senouci, B. Radar and Vision Sensor Fusion for Object Detection in Autonomous Vehicle Surroundings. In Proceedings of the 2018 Tenth International Conference on Ubiquitous and Future Networks (ICUFN), Prague, Czech Republic, 3–6 July 2018. [Google Scholar]
- Basso, M.; Bigazzi, L.; Innocenti, G. DART Project: A High Precision UAV Prototype Exploiting On-board Visual Sensing. In Proceedings of the ICAS 2019: The Fifteenth International Conference on Autonomic and Autonomous Systems, Athens, Greece, 2–6 June 2019. [Google Scholar]
- Bigazzi, L.; Basso, M.; Gherardini, S.; Innocenti, G. Mitigating latency problems in vision-based autonomous UAVs. In Proceedings of the 2021 29th Mediterranean Conference on Control and Automation (MED), Puglia, Italy, 22–25 June 2021. [Google Scholar]
- Memon, S.A.; Ullah, I. Detection and tracking of the trajectories of dynamic UAVs in restricted and cluttered environment. Expert Syst. Appl. 2021, 11, 115309. [Google Scholar] [CrossRef]
- Kim, M.; Memon, S.A.; Shin, M.; Son, H. Dynamic based trajectory estimation and tracking in an uncertain environment. Expert Syst. Appl. 2021, 177, 114919. [Google Scholar] [CrossRef]
- Huang, M.; Wei, P.; Liu, X. An Efficient Encoding Voxel-Based Segmentation (EVBS) Algorithm Based on Fast Adjacent Voxel Search for Point Cloud Plane Segmentation. Remote Sens. 2019, 11, 2727. [Google Scholar] [CrossRef]
- Rho, E.; Jo, S. OctoMap-based semi-autonomous quadcopter navigation with biosignal classification. In Proceedings of the 2018 6th International Conference on Brain-Computer Interface (BCI), Gangwon, Republic of Korea, 15–17 January 2018. [Google Scholar]
- Hornung, A.; Wurm, K.M.; Bennewitz, M.; Stachniss, C.; Burgard, W. OctoMap: An efficient probabilistic 3D mapping framework based on octrees. Auton. Robot. 2013, 34, 189–206. [Google Scholar] [CrossRef]
- Al-Kaff, A.; García, F.; Martín, D.; De La Escalera, A.; Armingol, J. Obstacle Detection and Avoidance System Based on Monocular Camera and Size Expansion Algorithm for UAVs. Sensors 2017, 5, 1061. [Google Scholar] [CrossRef] [PubMed]
- Yasin, J.N.; Mohamed, S.A.; Haghbayan, M.H.; Heikkonen, J.; Tenhunen, H.; Plosila, J. Unmanned Aerial Vehicles (UAVs): Collision Avoidance Systems and Approaches. IEEE Access 2020, 6, 105139–105155. [Google Scholar] [CrossRef]
- Ferrick, A.; Fish, J.; Venator, E.; Lee, G.S. UAV obstacle avoidance using image processing techniques. In Proceedings of the 2012 IEEE International Conference on Technologies for Practical Robot Applications (TePRA), Woburn, MA, USA, 23–24 April 2012. [Google Scholar]
- Budiyanto, A.; Cahyadi, A.; Adji, T.B.; Wahyunggoro, O. UAV obstacle avoidance using potential field under dynamic environment. In Proceedings of the 2015 International Conference on Control, Electronics, Renewable Energy and Communications (ICCEREC), Bandung, Indonesia, 27–29 August 2015; Volume 11. [Google Scholar]
- Wang, L.; Lan, Y.; Zhang, Y.; Zhang, H.; Tahir, M.N.; Ou, S.; Liu, X.; Chen, P. Applications and Prospects of Agricultural Unmanned Aerial Vehicle Obstacle Avoidance Technology in China. Sensors 2019, 2, 642. [Google Scholar] [CrossRef] [PubMed]
Figure 1.
DJI Matrice 300 RTK drone equipped with the additional hardware components.
Figure 1.
DJI Matrice 300 RTK drone equipped with the additional hardware components.
Figure 2.
Functional example of a ZED 2 stereoscopic camera. Image (a) shows an RGB frame coming from the camera, while image (b) shows a depth frame processed by the ZED SDK on board the Jetson module.
Figure 2.
Functional example of a ZED 2 stereoscopic camera. Image (a) shows an RGB frame coming from the camera, while image (b) shows a depth frame processed by the ZED SDK on board the Jetson module.
Figure 3.
Virtual antennas position of AWR1843BOOST [
12].
Figure 3.
Virtual antennas position of AWR1843BOOST [
12].
Figure 4.
Block diagram of the framework that implements the obstacle detection and avoidance algorithm. In particular, the framework is able to communicate with the drone and to receive data from the sensors to search for obstacles in the surrounding environment.
Figure 4.
Block diagram of the framework that implements the obstacle detection and avoidance algorithm. In particular, the framework is able to communicate with the drone and to receive data from the sensors to search for obstacles in the surrounding environment.
Figure 5.
Differences between vision and radar global maps: left (a) is the radar map where detected obstacles are reported on the same plane as the drone; top right (b) is the optical point cloud, while on the bottom right (c), there is the corresponding conversion into a set of voxels used for the detection of dangerous obstacles. In this latter case, the map obtained also allows one to know the altitude of the detected obstacles.
Figure 6.
Path divergence issues: estimated trajectories starting from data provided by the RTK system (green) and by the SLAM algorithm that uses the vision data (red). The latter diverges if there are no fixed objects in the operating range of the camera. This situation is shown in the image on the top right, where, after the avoidance of the building, all the fixed obstacles are out of the range of the optical sensor.
Figure 7.
Mapping region of the local map (gray); searching region where the presence of an obstacle is considered dangerous (yellow); occupied voxels by obstacles (blue).
Figure 7.
Mapping region of the local map (gray); searching region where the presence of an obstacle is considered dangerous (yellow); occupied voxels by obstacles (blue).
Figure 8.
The figure shows the voxels calculated by the detection algorithm within the search region. In particular, the number of points computed by the algorithm depends both on the map resolution and ROI volume.
Figure 8.
The figure shows the voxels calculated by the detection algorithm within the search region. In particular, the number of points computed by the algorithm depends both on the map resolution and ROI volume.
Figure 9.
Flowchart of the obstacle detection (OD) and avoidance algorithm (OA).
Figure 9.
Flowchart of the obstacle detection (OD) and avoidance algorithm (OA).
Figure 10.
Avoidance strategy of dangerous obstacles. The voxels in front of the drone define the ROI where the algorithm searches for dangerous obstacles (a). When an object is detected inside it (b), the avoidance strategy is activated (c).
Figure 10.
Avoidance strategy of dangerous obstacles. The voxels in front of the drone define the ROI where the algorithm searches for dangerous obstacles (a). When an object is detected inside it (b), the avoidance strategy is activated (c).
Figure 11.
Celle castle site used to carry out the tests on the obstacle detection and avoidance system.
Figure 11.
Celle castle site used to carry out the tests on the obstacle detection and avoidance system.
Figure 12.
Example of mission carried out to test the correct functioning of the obstacle detection and avoidance system. This mission involves a trajectory that takes the drone on a collision course with a building on the site.
Figure 12.
Example of mission carried out to test the correct functioning of the obstacle detection and avoidance system. This mission involves a trajectory that takes the drone on a collision course with a building on the site.
Figure 13.
Screenshots of the building detection and avoidance phases through the separate use of the two sensors: radar detection system (a), and optical detection system (b).
Figure 13.
Screenshots of the building detection and avoidance phases through the separate use of the two sensors: radar detection system (a), and optical detection system (b).
Table 1.
Number of voxels automatically calculated by the update algorithm of the ROI, the resolution and the computation time as a function of various desired depths.
Table 1.
Number of voxels automatically calculated by the update algorithm of the ROI, the resolution and the computation time as a function of various desired depths.
| Depth (m) | Resolution (m) | Calculated Voxels | Computation Time (s) |
|---|
| 7 | 0.5 | 81 | 0.0032 |
| 10 | 0.5 | 139 | 0.0053 |
| 20 | 0.5 | 443 | 0.0081 |
| 30 | 0.5 | 915 | 0.0095 |
| 50 | 0.5 | 2361 | 0.0184 |
| 70 | 0.5 | 4477 | 0.0240 |
| 90 | 0.5 | 7261 | 0.0346 |
| 120 | 0.5 | 12699 | 0.0462 |
| Publisher’s Note: MDPI stays neutral with regard to jurisdictional claims in published maps and institutional affiliations. |
© 2022 by the authors. Licensee MDPI, Basel, Switzerland. This article is an open access article distributed under the terms and conditions of the Creative Commons Attribution (CC BY) license (https://creativecommons.org/licenses/by/4.0/).


 ,
, 


