Article

Vegetation Extraction Using Visible-Bands from Openly Licensed Unmanned Aerial Vehicle Imagery

1
Remote Sensing and Geo-Environment Lab, Department of Civil Engineering and Geomatics, Faculty of Engineering and Technology, Cyprus University of Technology, Saripolou 2-8, Limassol 3036, Cyprus
2
Eratosthenes Centre of Excellence, Saripolou 2-8, Limassol 3036, Cyprus
Drones 2020, 4(2), 27; https://doi.org/10.3390/drones4020027
Submission received: 25 May 2020 / Revised: 25 June 2020 / Accepted: 25 June 2020 / Published: 26 June 2020
(This article belongs to the Special Issue Feature Papers of Drones)

Abstract

:
Red–green–blue (RGB) cameras which are attached in commercial unmanned aerial vehicles (UAVs) can support remote-observation small-scale campaigns, by mapping, within a few centimeter’s accuracy, an area of interest. Vegetated areas need to be identified either for masking purposes (e.g., to exclude vegetated areas for the production of a digital elevation model (DEM) or for monitoring vegetation anomalies, especially for precision agriculture applications. However, while detection of vegetated areas is of great importance for several UAV remote sensing applications, this type of processing can be quite challenging. Usually, healthy vegetation can be extracted at the near-infrared part of the spectrum (approximately between 760–900 nm), which is not captured by the visible (RGB) cameras. In this study, we explore several visible (RGB) vegetation indices in different environments using various UAV sensors and cameras to validate their performance. For this purposes, openly licensed unmanned aerial vehicle (UAV) imagery has been downloaded “as is” and analyzed. The overall results are presented in the study. As it was found, the green leaf index (GLI) was able to provide the optimum results for all case studies.

1. Introduction

Unmanned aerial vehicles (UAVs) are widely applied for monitoring and mapping purposes all around the world [1,2,3,4]. The use of relatively low-cost commercial UAV platforms can produce high-resolution visible orthophotos, thus providing an increased resolution product in comparison to the traditional aerial or satellite observations. Throughout the years, the technological development in sensors and the decrease in the cost of the UAV sensors has popularized them both to experts as well as amateurs [5,6]. While several countries have lately adopted restrictions due to safety reasons, UAVs are still being used for mapping relatively small areas (in comparison to aerial and satellite observations) [7].
Today a variety of UAVs and cameras exist in the market, providing a plethora of options to end-users. As [8] mentioned in their work, UAVs can be classified according to the characteristics of the drones, such as their size, ranging from nano (<30 mm) to large size (>2 m) drones, their maximum take-off weight (from less than 1 kg to more than 25 kg), their range of operation, etc. In addition, existing UAVs’ cameras can also be classified into visible red–green–blue (RGB), near-infrared (NIR), multispectral, hyperspectral, and thermal cameras.
Once the stereo pairs of the images are taken from the UAV camera sensors, these are processed using known control points and orthorectified based on the digital surface model (DSM) produced by the triangulation of the stereo pairs [9]. In many applications, the detection of vegetated areas is essential, as in the case of monitoring agricultural areas or forests [10,11,12,13]. Even if vegetation is not a goal of a study, vegetation needs to be masked out to produce a digital elevation model (DEM) and provide realistic contours of the area.
Vegetated areas can usually be detected using the near-infrared part of the spectrum (approximately between 760–900 nm). At this spectral range, healthy vegetation tends to give high reflectance values in comparison to the visible bands (red–green–blue, RGB) [14]. The sudden increase in reflectance at the near-infrared part of the spectrum is a unique characteristic of healthy vegetation. For this reason, the specific spectral window has been widely exploited in remote sensing applications. Indeed, numerous vegetation indices based on different mathematical equations have been developed in the last decades, aiming to detect healthy vegetation, taking into consideration atmospheric effects and the soil background reflectance noise [15]. One of the most common vegetation indexes applied in remote sensing applications is the so-called normalized difference vegetation index (NDVI), which is estimated using the reflectance values of the near-infrared and the red bands of multispectral images [16].
However, in most UAV cameras, the near-infrared part of the spectrum which is sensitive to vegetation is absent. UAVs cameras are normally sensitive to recording the visible part of the spectrum (red–green–blue), thus making the detection of vegetated areas quite challenging. In addition, radiometric calibration of the images is needed to convert the raw digital numbers (DNs) into reflectance values. To do this, calibration targets and field campaigns are essential to have a good approximation of the backscattered radiance of the various targets observed in the orthophotos [17,18].
This study aims to investigate the detection of vegetated areas based on limited metadata information, and with no information regarding the reflectance properties of targets visible in the orthophoto. For this reason, five orthophotos from openly licensed an unmanned aerial vehicle (UAV) imagery repository was used, while simplifying linear regression models were established to convert the DNs of the images to reflectance values. Once this was accomplished, then more than ten (10) different visible vegetation indices were applied, and their results are discussed. The methodology presented here can, therefore, be used in products where knowledge is limited, and the extraction of vegetation is needed to be carried out in a semi-automatic way.

2. Materials and Methods

For the needs of the current study, five different datasets were selected through the OpenAerialMap platform [19]. The OpenAerialMap relies on a set of open-source tools, where users can upload their products, such as orthophotos, filling basic metadata information, to support their re-use. OpenAerialMap provides a set of tools for searching, sharing, and using openly licensed satellite and unmanned aerial vehicle (UAV) imagery. The platform is operated by the Open Imagery Network (OIN). All images uploaded in the platform are publicly licensed under the Creative Commons (CC) license (CC-BY 4.0), thus allowing both sharing and adaptation of the content from third parties and other users.
The case studies were selected based on the following criteria: (1) have a different context, (2) have a different geographical distribution, (3) captured by different UAV/camera sensors, and (4) quality of the final orthophoto. In the end, the following case studies were identified and downloaded for further processing (Table 1). A preview of these areas can be found in Figure 1. Case study 1 was a 6 cm-resolution orthophoto, from a highly urbanized area (Figure 1a), located in the Philippines, where vegetation was randomly scattered. A mixed environment was selected as the second case study from St. Petersburg in Russia (Figure 1b), where both high trees, grassland, and buildings were visible. A UAV corridor mapping along a river near the Arta city, Greece, was the third case study (Figure 1c). At the same time, it should be mentioned that watergrass was also visible in this orthophoto.
The next case study referred to a picnic area at Ohio, USA, with low vegetation (grass) and some sporadic high trees (Figure 1d), while the last case study was an agricultural field near Nîmes, France. All orthophotos have a named resolution of few centimeters (5–6 cm), without the ability to evaluate further geometric distortions of the images (e.g., radial distortion, root mean square error, maximum horizontal and vertical error, and distribution of the control points). Therefore, these orthophotos were further processed “as is”. The first two orthophotos were obtained using the DJI Mavic 2 Pro, while the DJI FC6310 model was used for the case study of Greece. The SONY DSC-WX220 and Parrot Anafi UAV models were used for the last two case studies.
Once the orthophotos were downloaded, the digital numbers (DN) of each band were calibrated using the empirical line method (ELM) [18]. The ELM is a simple and direct approach to calibrate DN of images to approximated units of surface reflectance in the case where no further information is available as in our example. The ELM method aims to build a relationship between at-sensor radiance and at-surface reflectance by computing non-variant spectral targets and comparing these measurements with the respective DNs in the image. The calibration of raw DNs to surface reflectance factor is based on a linear relationship for each image band using reflectance targets of the image. The derived prediction equations can consider changes in illumination and atmospheric effects [20]. In our case study, since no additional information was available, the impact of the atmospheric effects was ignored. The ELM for the RGB UAV sensed data could be estimated using the following equation:
ρ(λ) = A * DN + B,
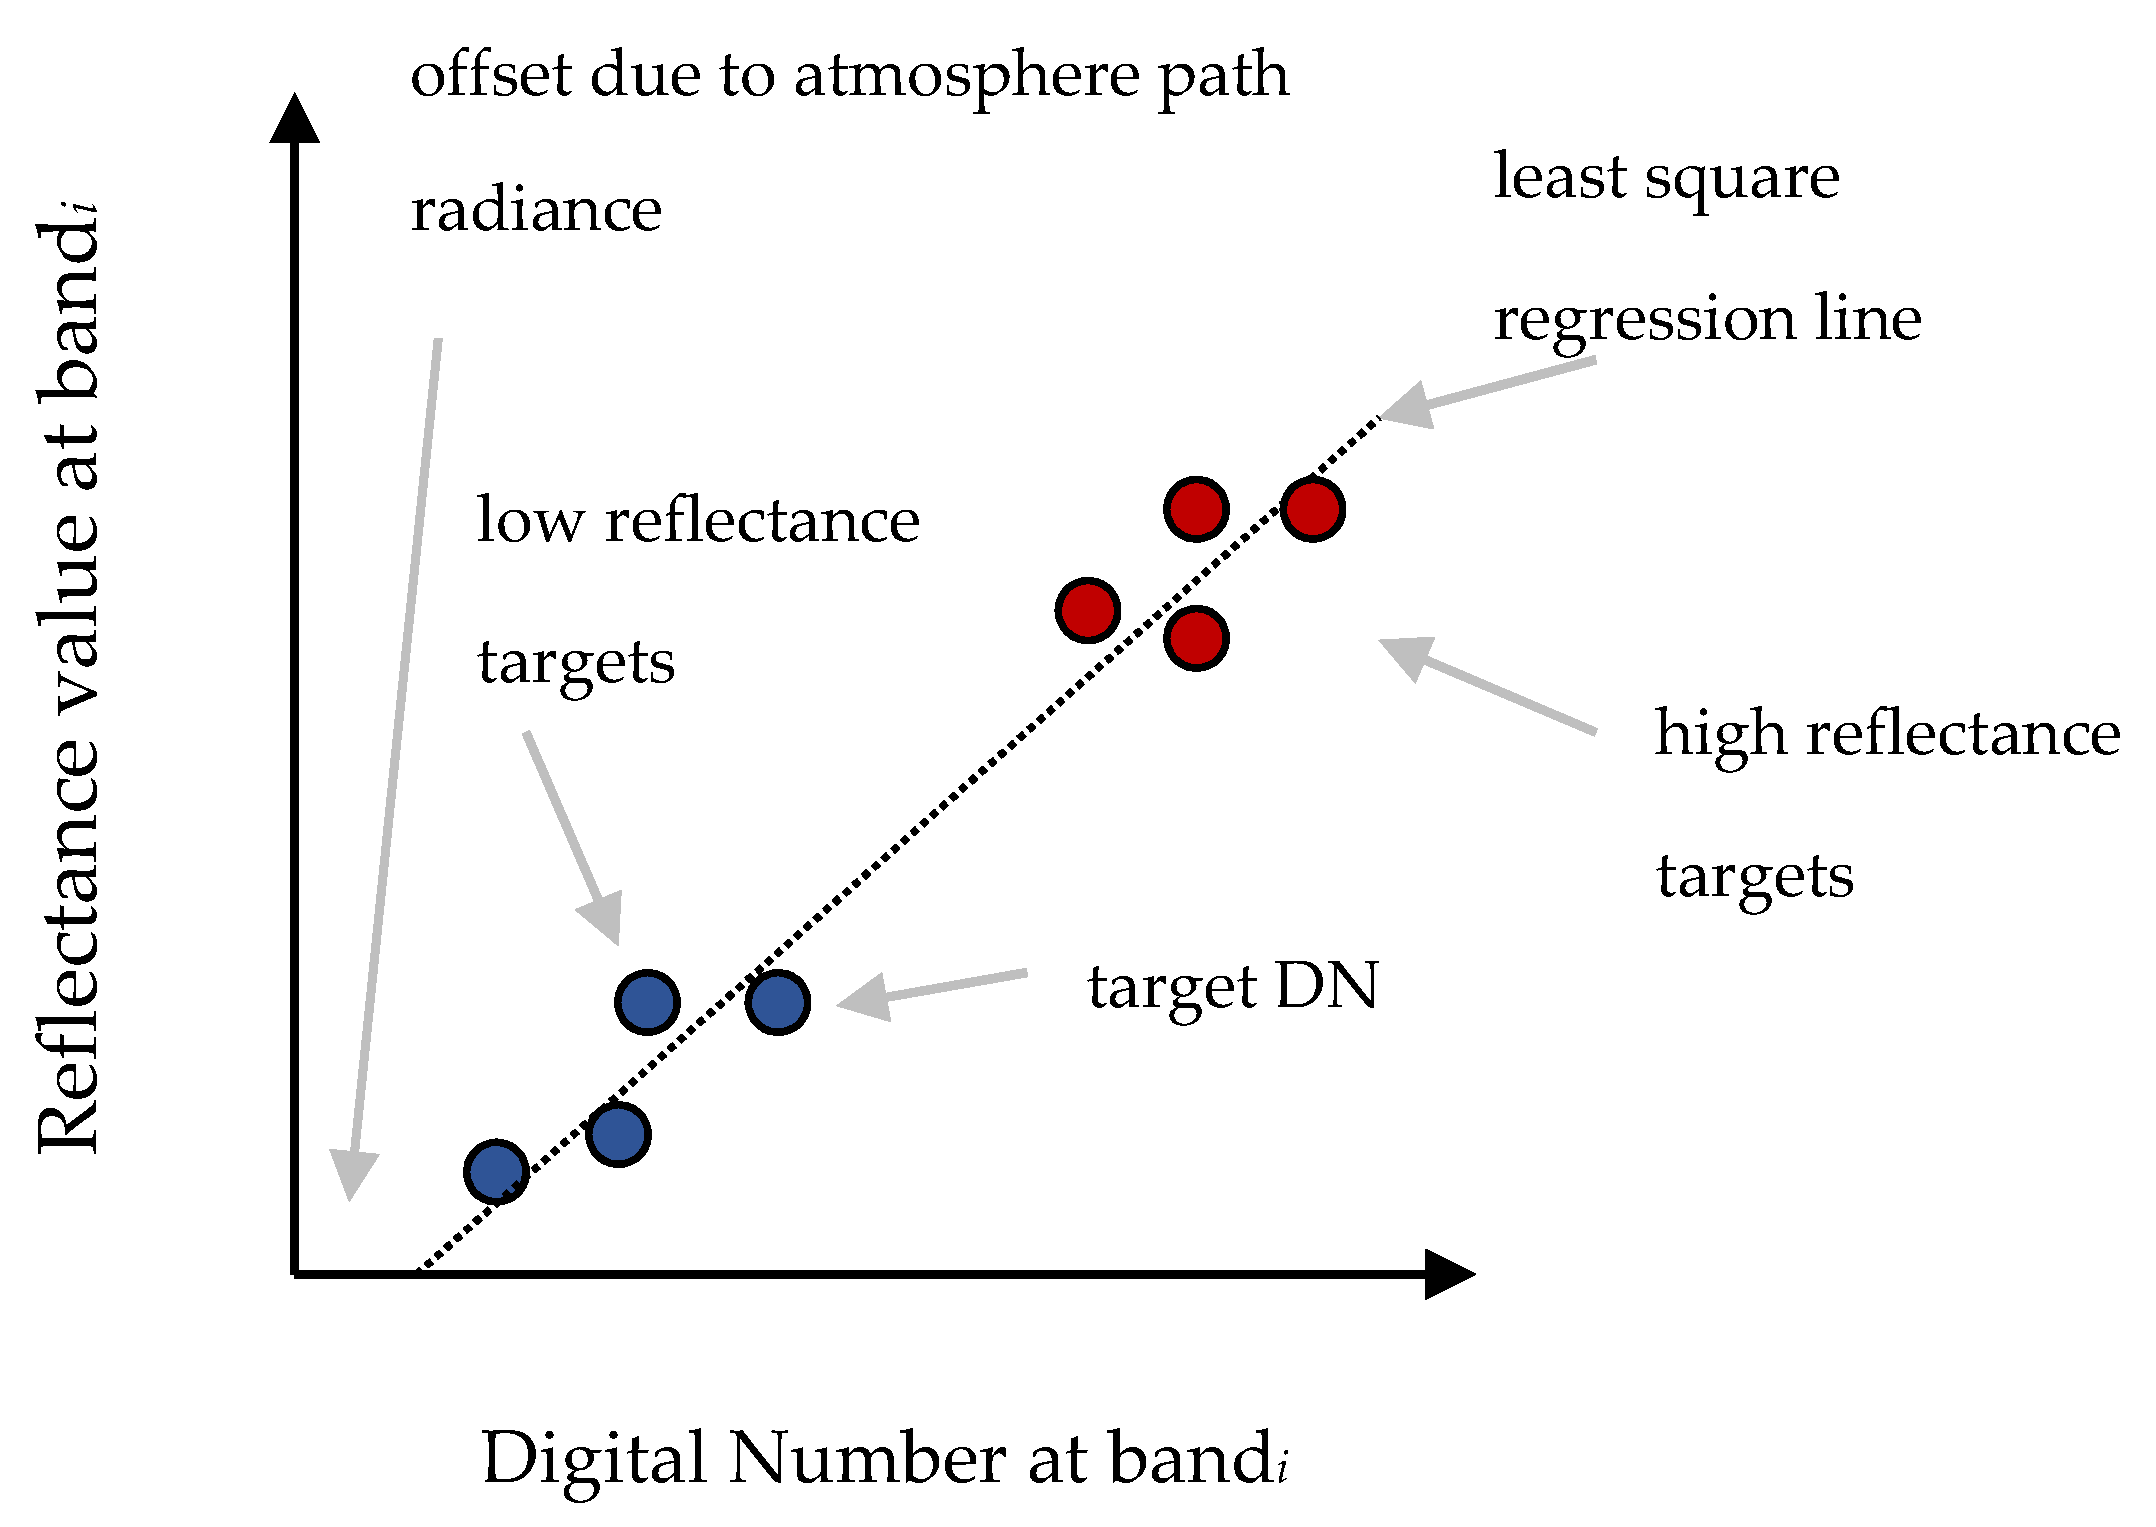
where ρ(λ) is the reflectance value for a specific band (range 0%–100%), DNs are the raw digital numbers of the orthophotos, and A and B are terms which can be determined using a least-square fitting approach. Figure 2 illustrates the basic concept of the ELM calibration.
In the case where no appropriate targets were used, a simple normalization of the orthophotos was followed using image statistics per each band. Once the orthophotos were radiometrically calibrated, with pixel values between 0 and 1, various visible vegetation indices were applied. In specific, we implemented ten (10) different equations, as shown in more detail in Table 2. The following vegetation indices were applied to all case studies: (1) Normalized green–red difference index, (2) green leaf index, (3) visible atmospherically resistant index, (4) triangular greenness index, (5) red–green ratio index, (6) red–green–blue vegetation index, (7) red–green ratio index, (8) modified green–red vegetation index, (9) excess green index, and (10) color index of vegetation. These indices explore in different ways the visible bands (red–green–blue). The outcomes were then evaluated and compared with random points defined in the orthophotos. The overall results are provided in the next section.

3. Results

3.1. Radiometric Calibration of the Raw Orthophotos

After the detailed examination of the selected orthophotos, high target reflectance pixels were identified and mapped in three out of the five case studies. These targets were selected, namely in case study 1 (Figure 3a) and case study 2 (Figure 3b). For both these orthophoto, smooth white roofs were found, and the average DN value per band was extracted. A similar procedure was also implemented for the fourth case study (Figure 3c), where a white high reflectance asphalt area was evident in the southern part of the image. In contrast, no dark objects, such as deep water reservoirs, newly-placed asphalt, or other black targets, were visible in these images. Therefore the ELM was applied using as-known input parameters of the DNs from these high reflectance targets. For the rest orthophotos (case study 3 and case study 5), no visible variant targets could be detected in the images due to their environment. In these cases, an image normalization between 0 and 1, using the image statistics, was implemented.
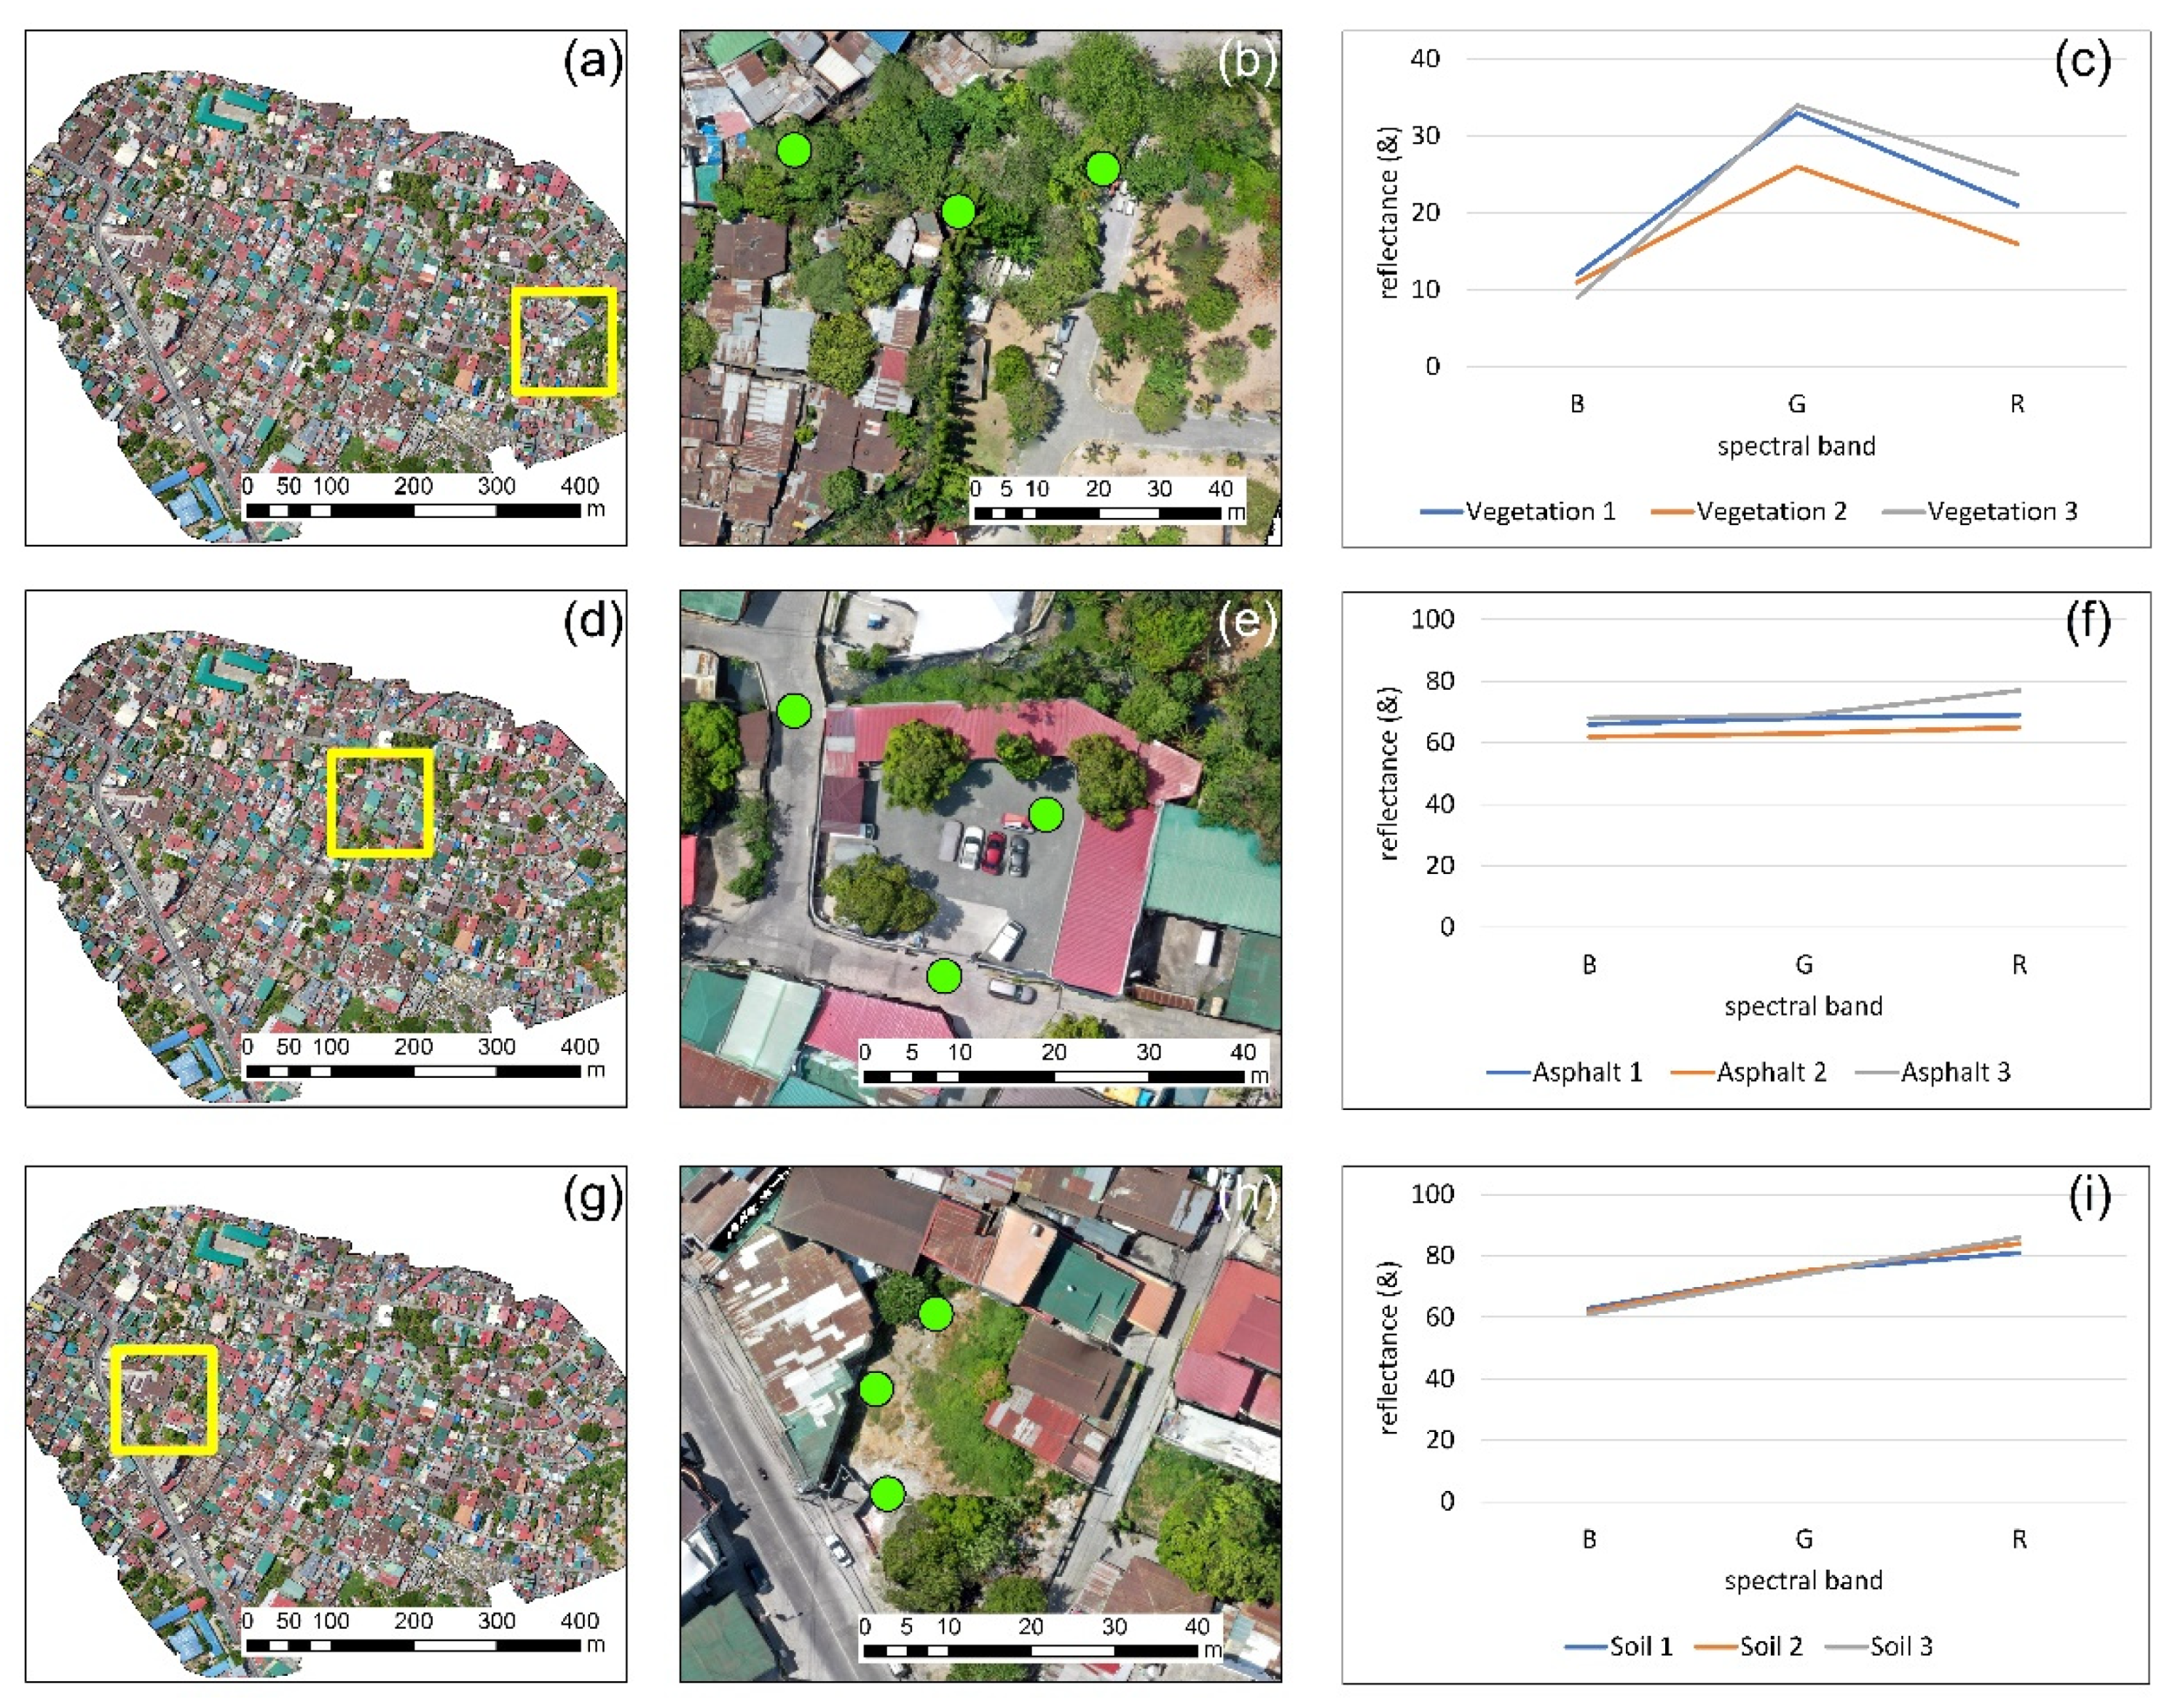
Upon the radiometric calibration, several spectral signatures from different targets in the range of the visible part of the spectrum (i.e., approximately between 450 and 760 nm) were plotted. This is an easy way to understand if the simplified EML and image normalization procedures that we followed here did not distort the reflectance of the targets. Figure 4 presents the results from the reflectance analysis regarding the first case study (similar findings were also reported for the other case studies). Three types of targets are presented here: vegetation (first row of Figure 4), asphalt (second row of Figure 4), and soil (third row of Figure 4). Figure 4a,d,g shows the general location of these targets, while a closer look at these targets is shown in Figure 4b,e,h, respectively. The spectral signature diagram of the three targets can be seen in the last column of Figure 4 (Figure 4c,f,i). The vegetation spectral profile (Figure 4c) followed the typical spectral behavior of healthy vegetation within this part of the spectrum with low reflectance values in the blue and red part of the spectrum and higher reflectance in the green band. Asphalt targets (Figure 4f) had a similar reflectance value for all three bands, while its relatively high reflectance (i.e., between 60%–75%) can be explained due to the type of the asphalt and its age. The soil spectral profile (Figure 4i) showed a similar pattern with the asphalt with a slight increase in the reflectance as we moved from the blue to the red part of the spectrum. Other types of targets (not shown here) had a reflectance pattern as those expected from the literature, which is an indicator that the ELM did not distort any spectral band, and provided, as best as possible, reasonable outcomes.

3.2. Vegetation Indices

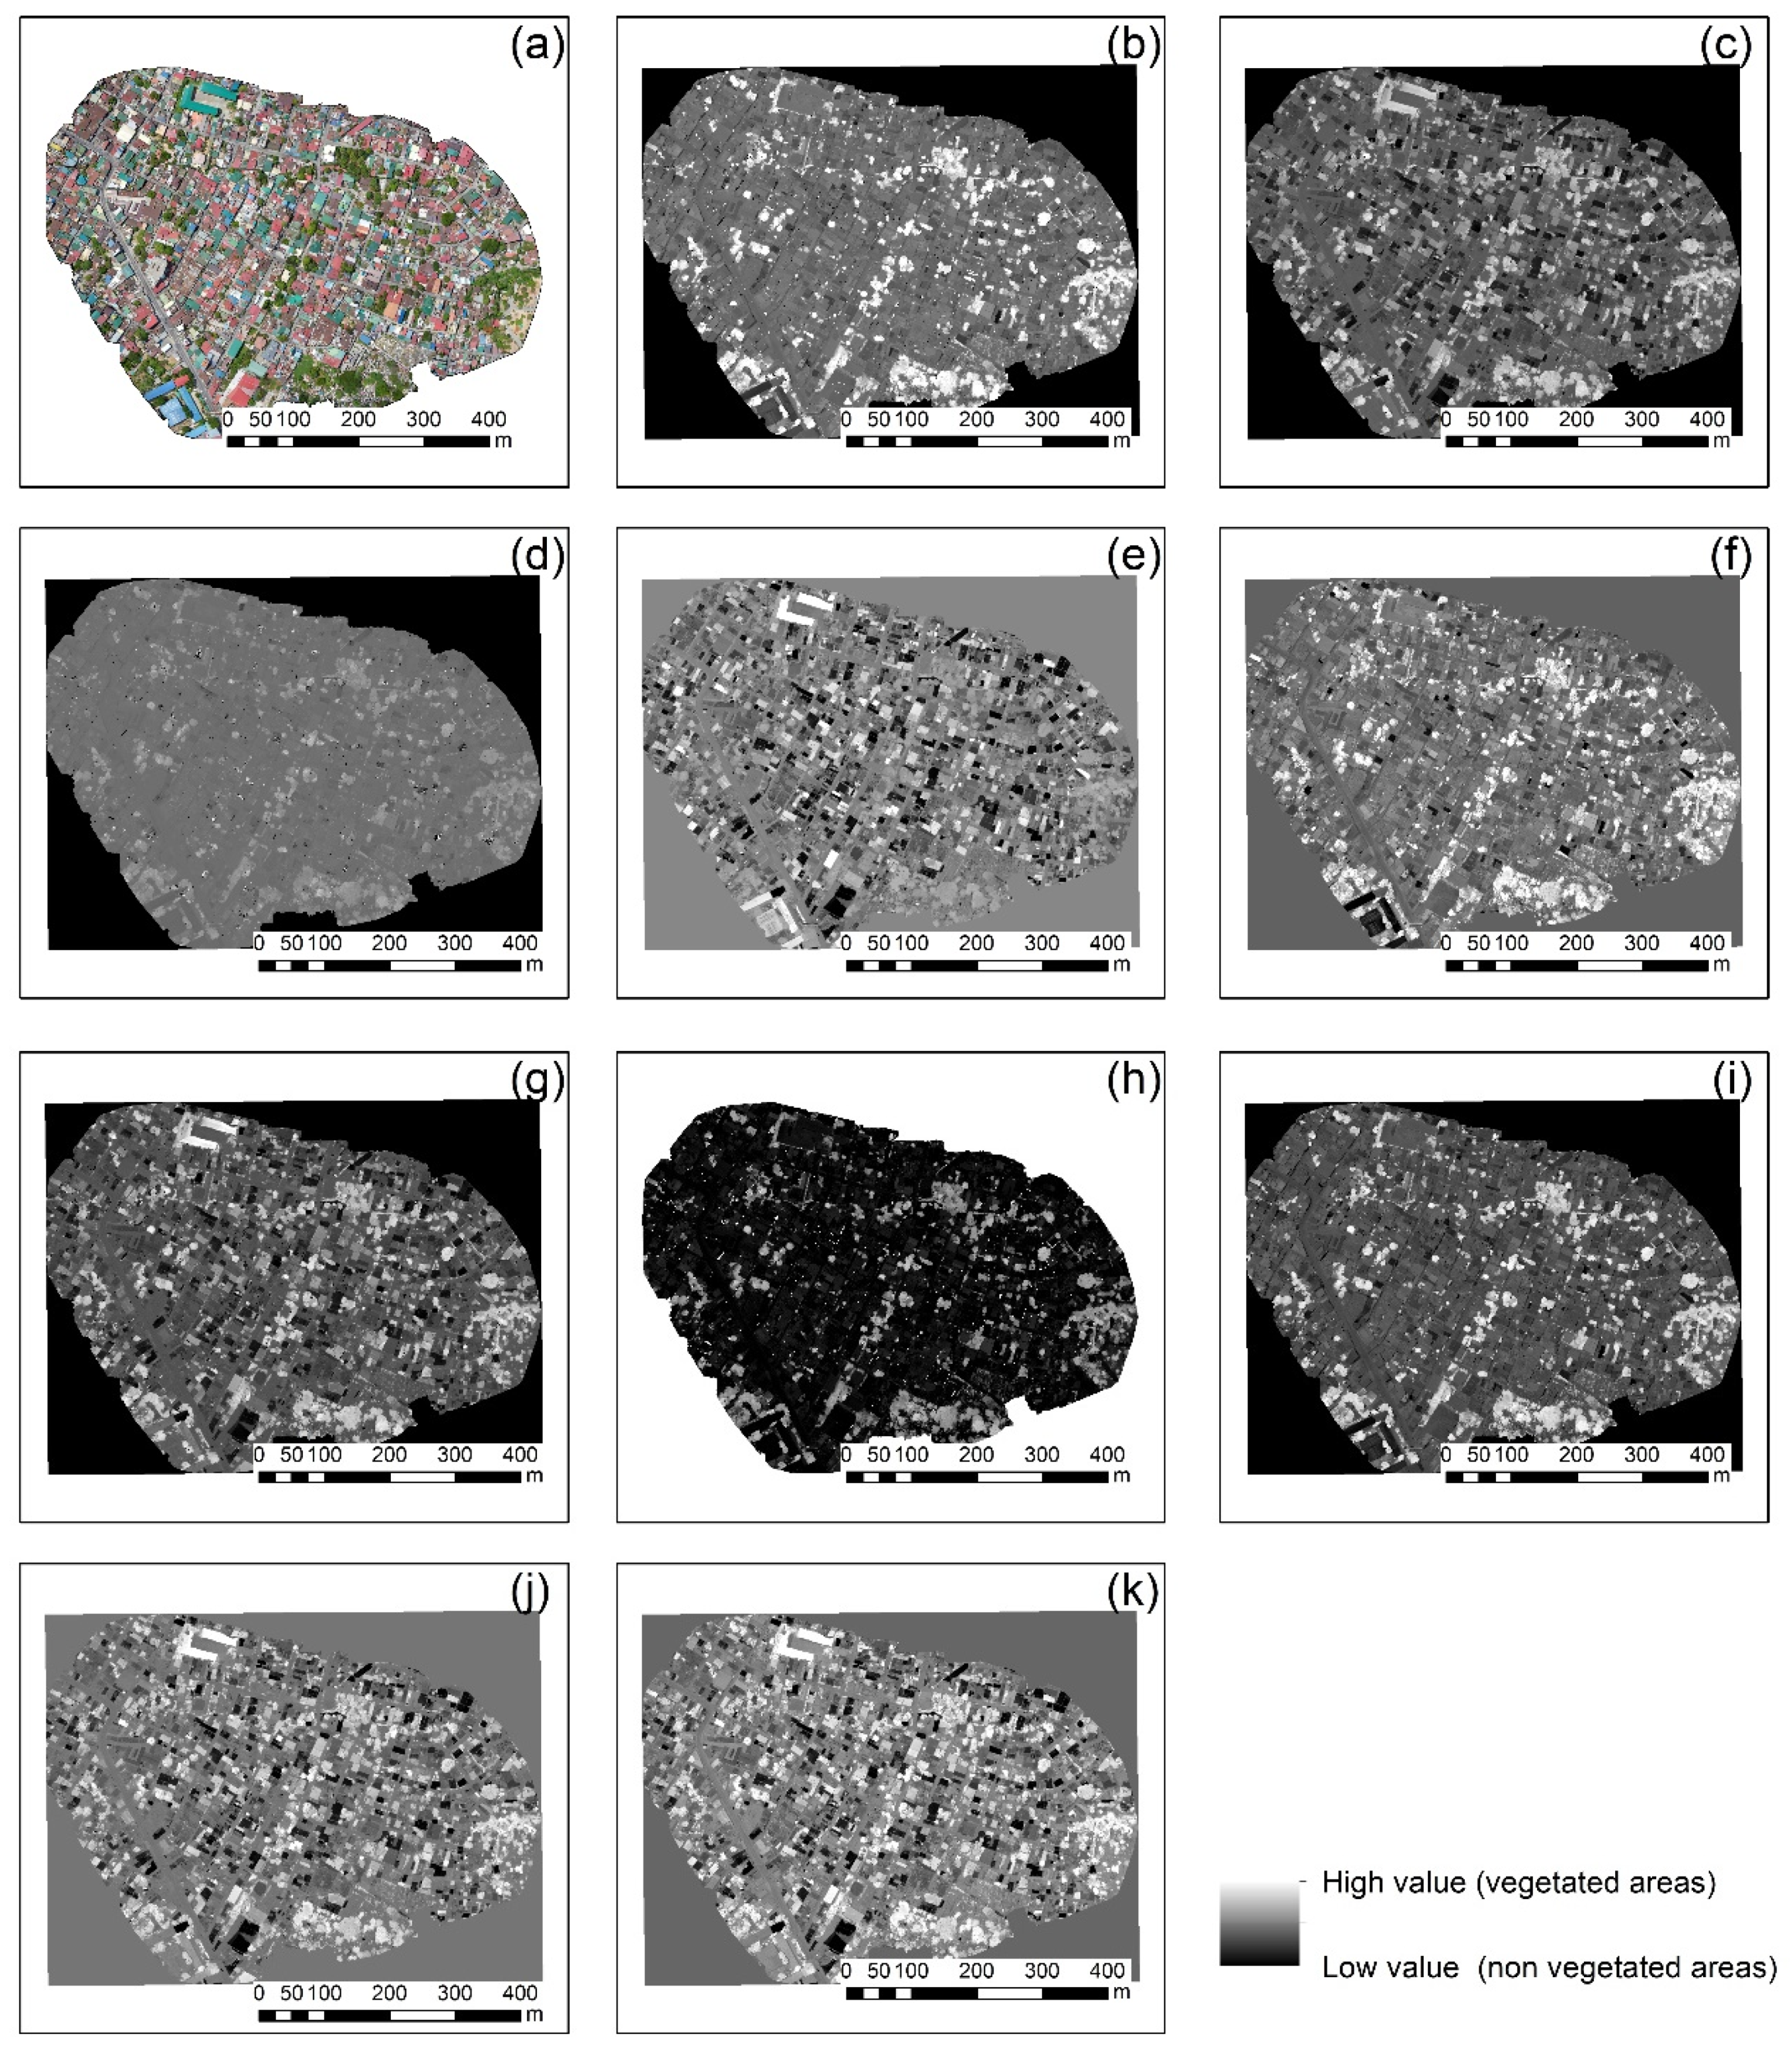
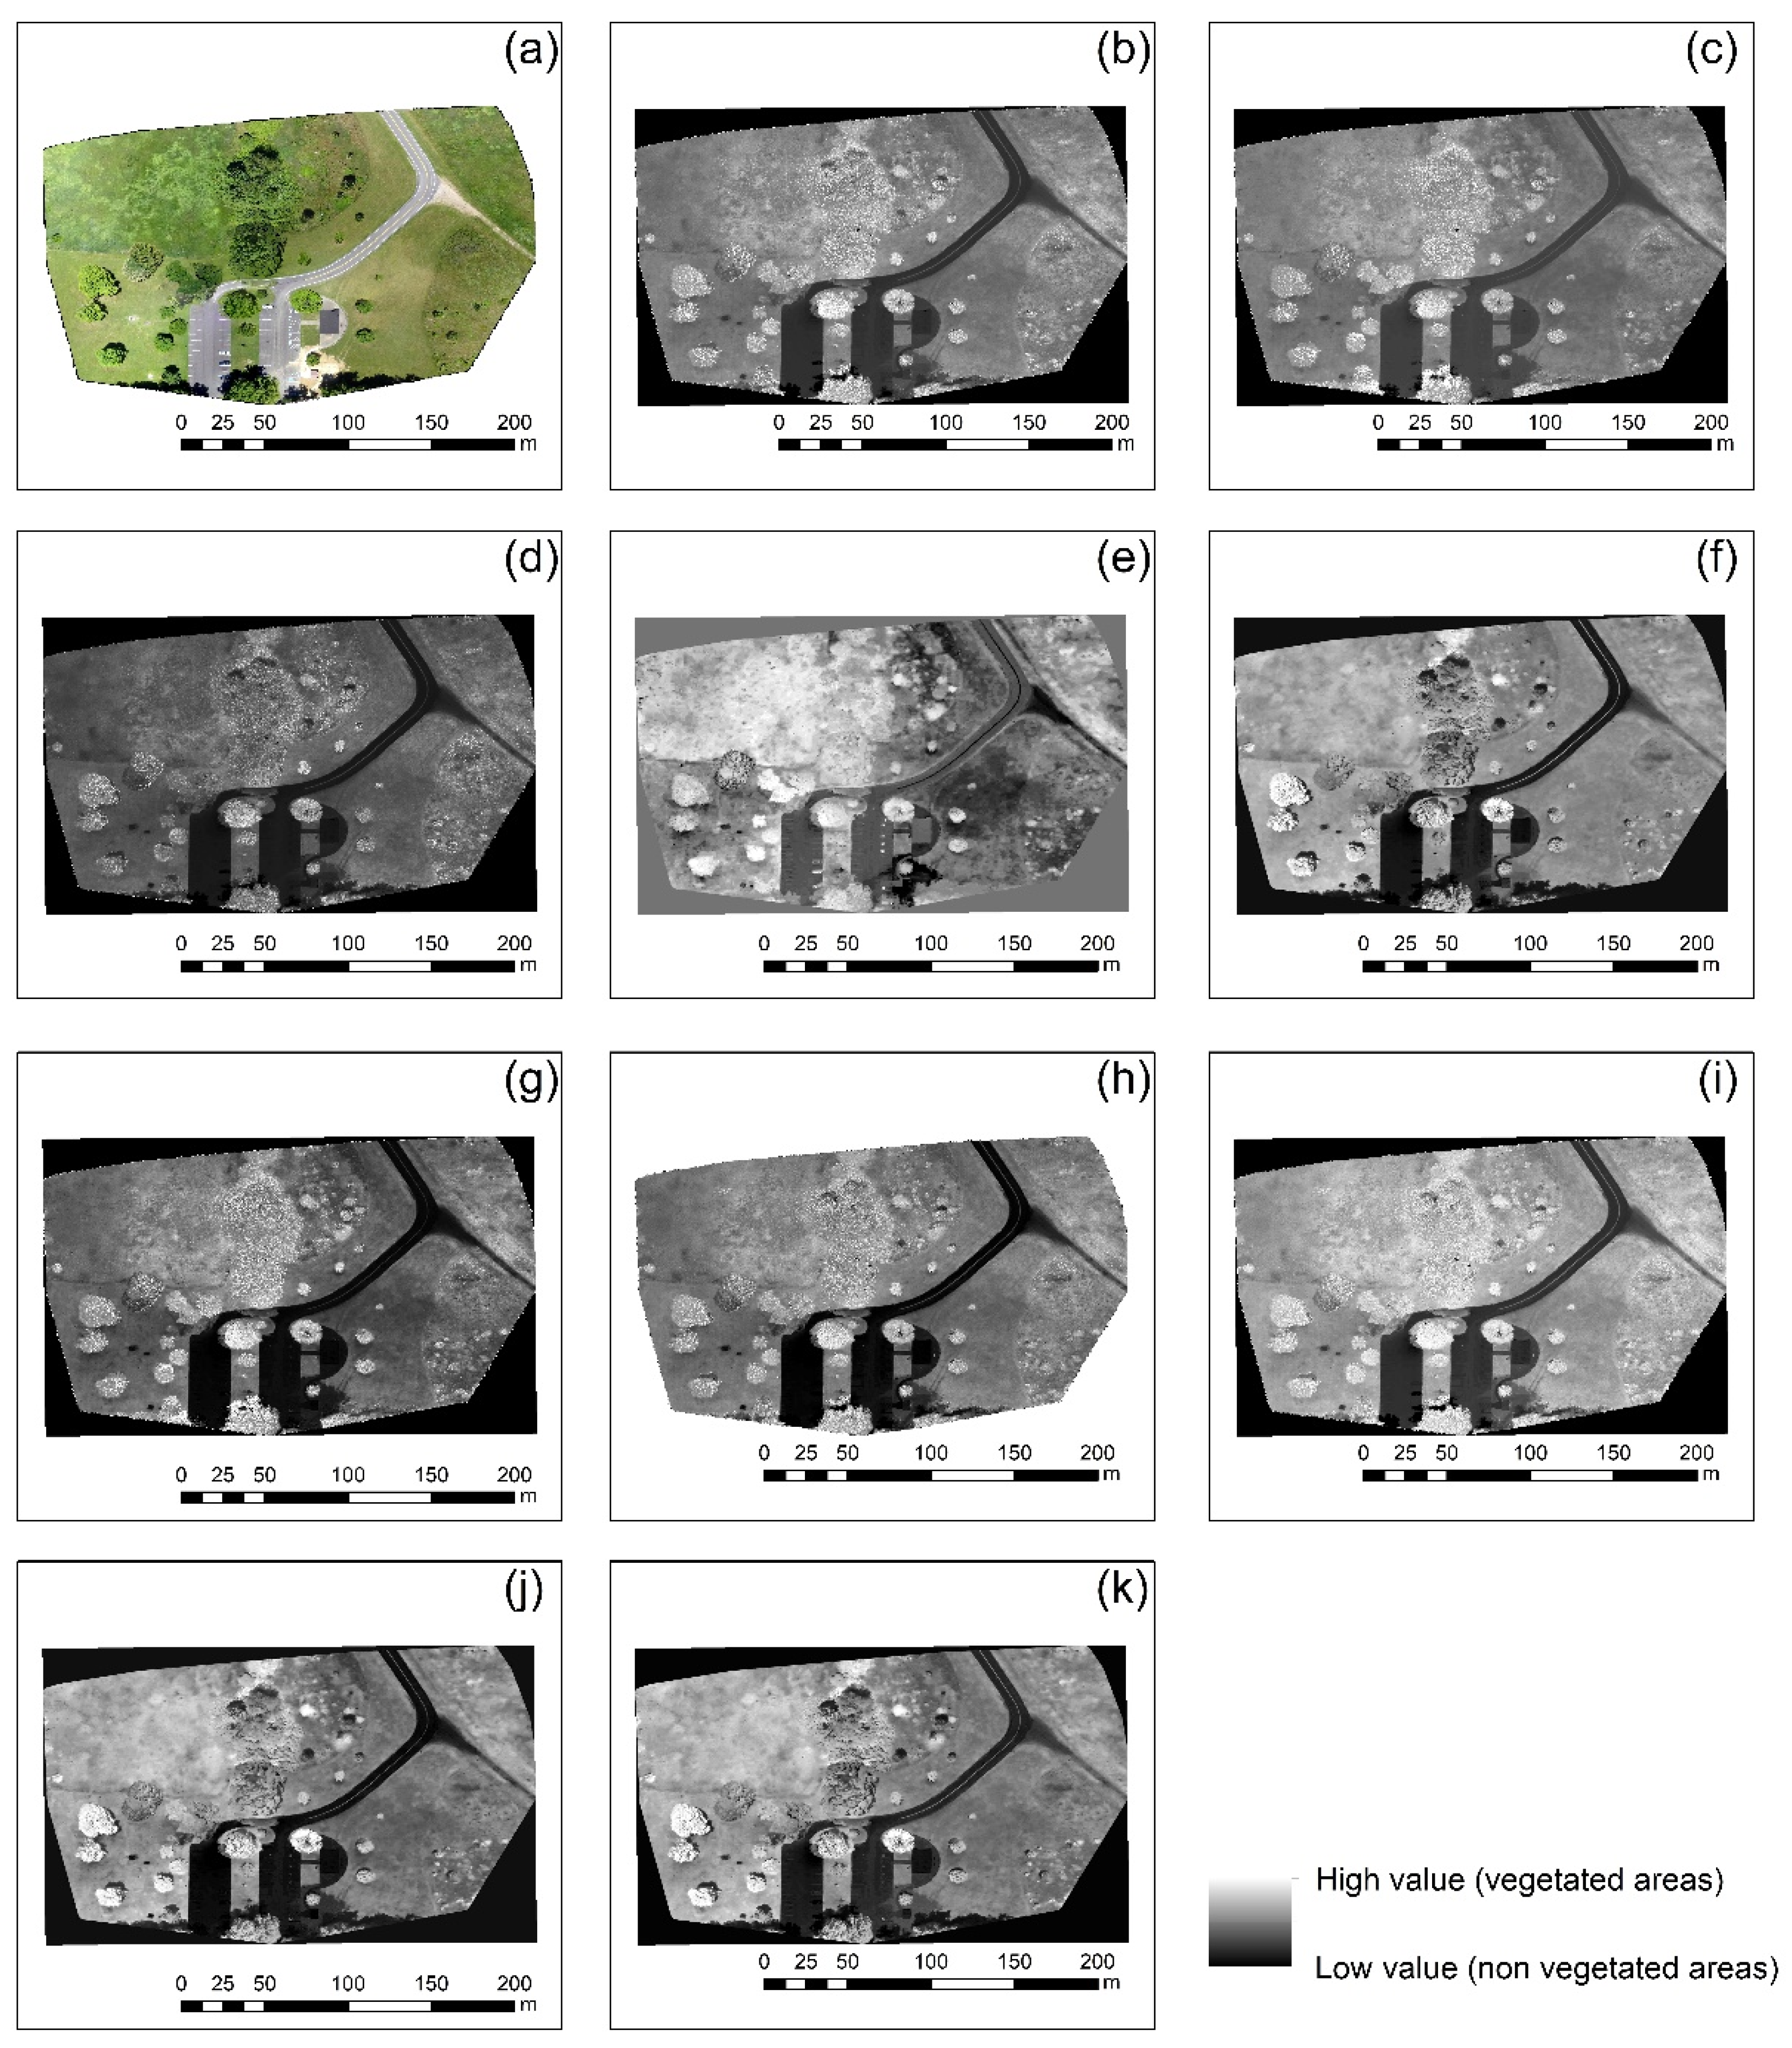
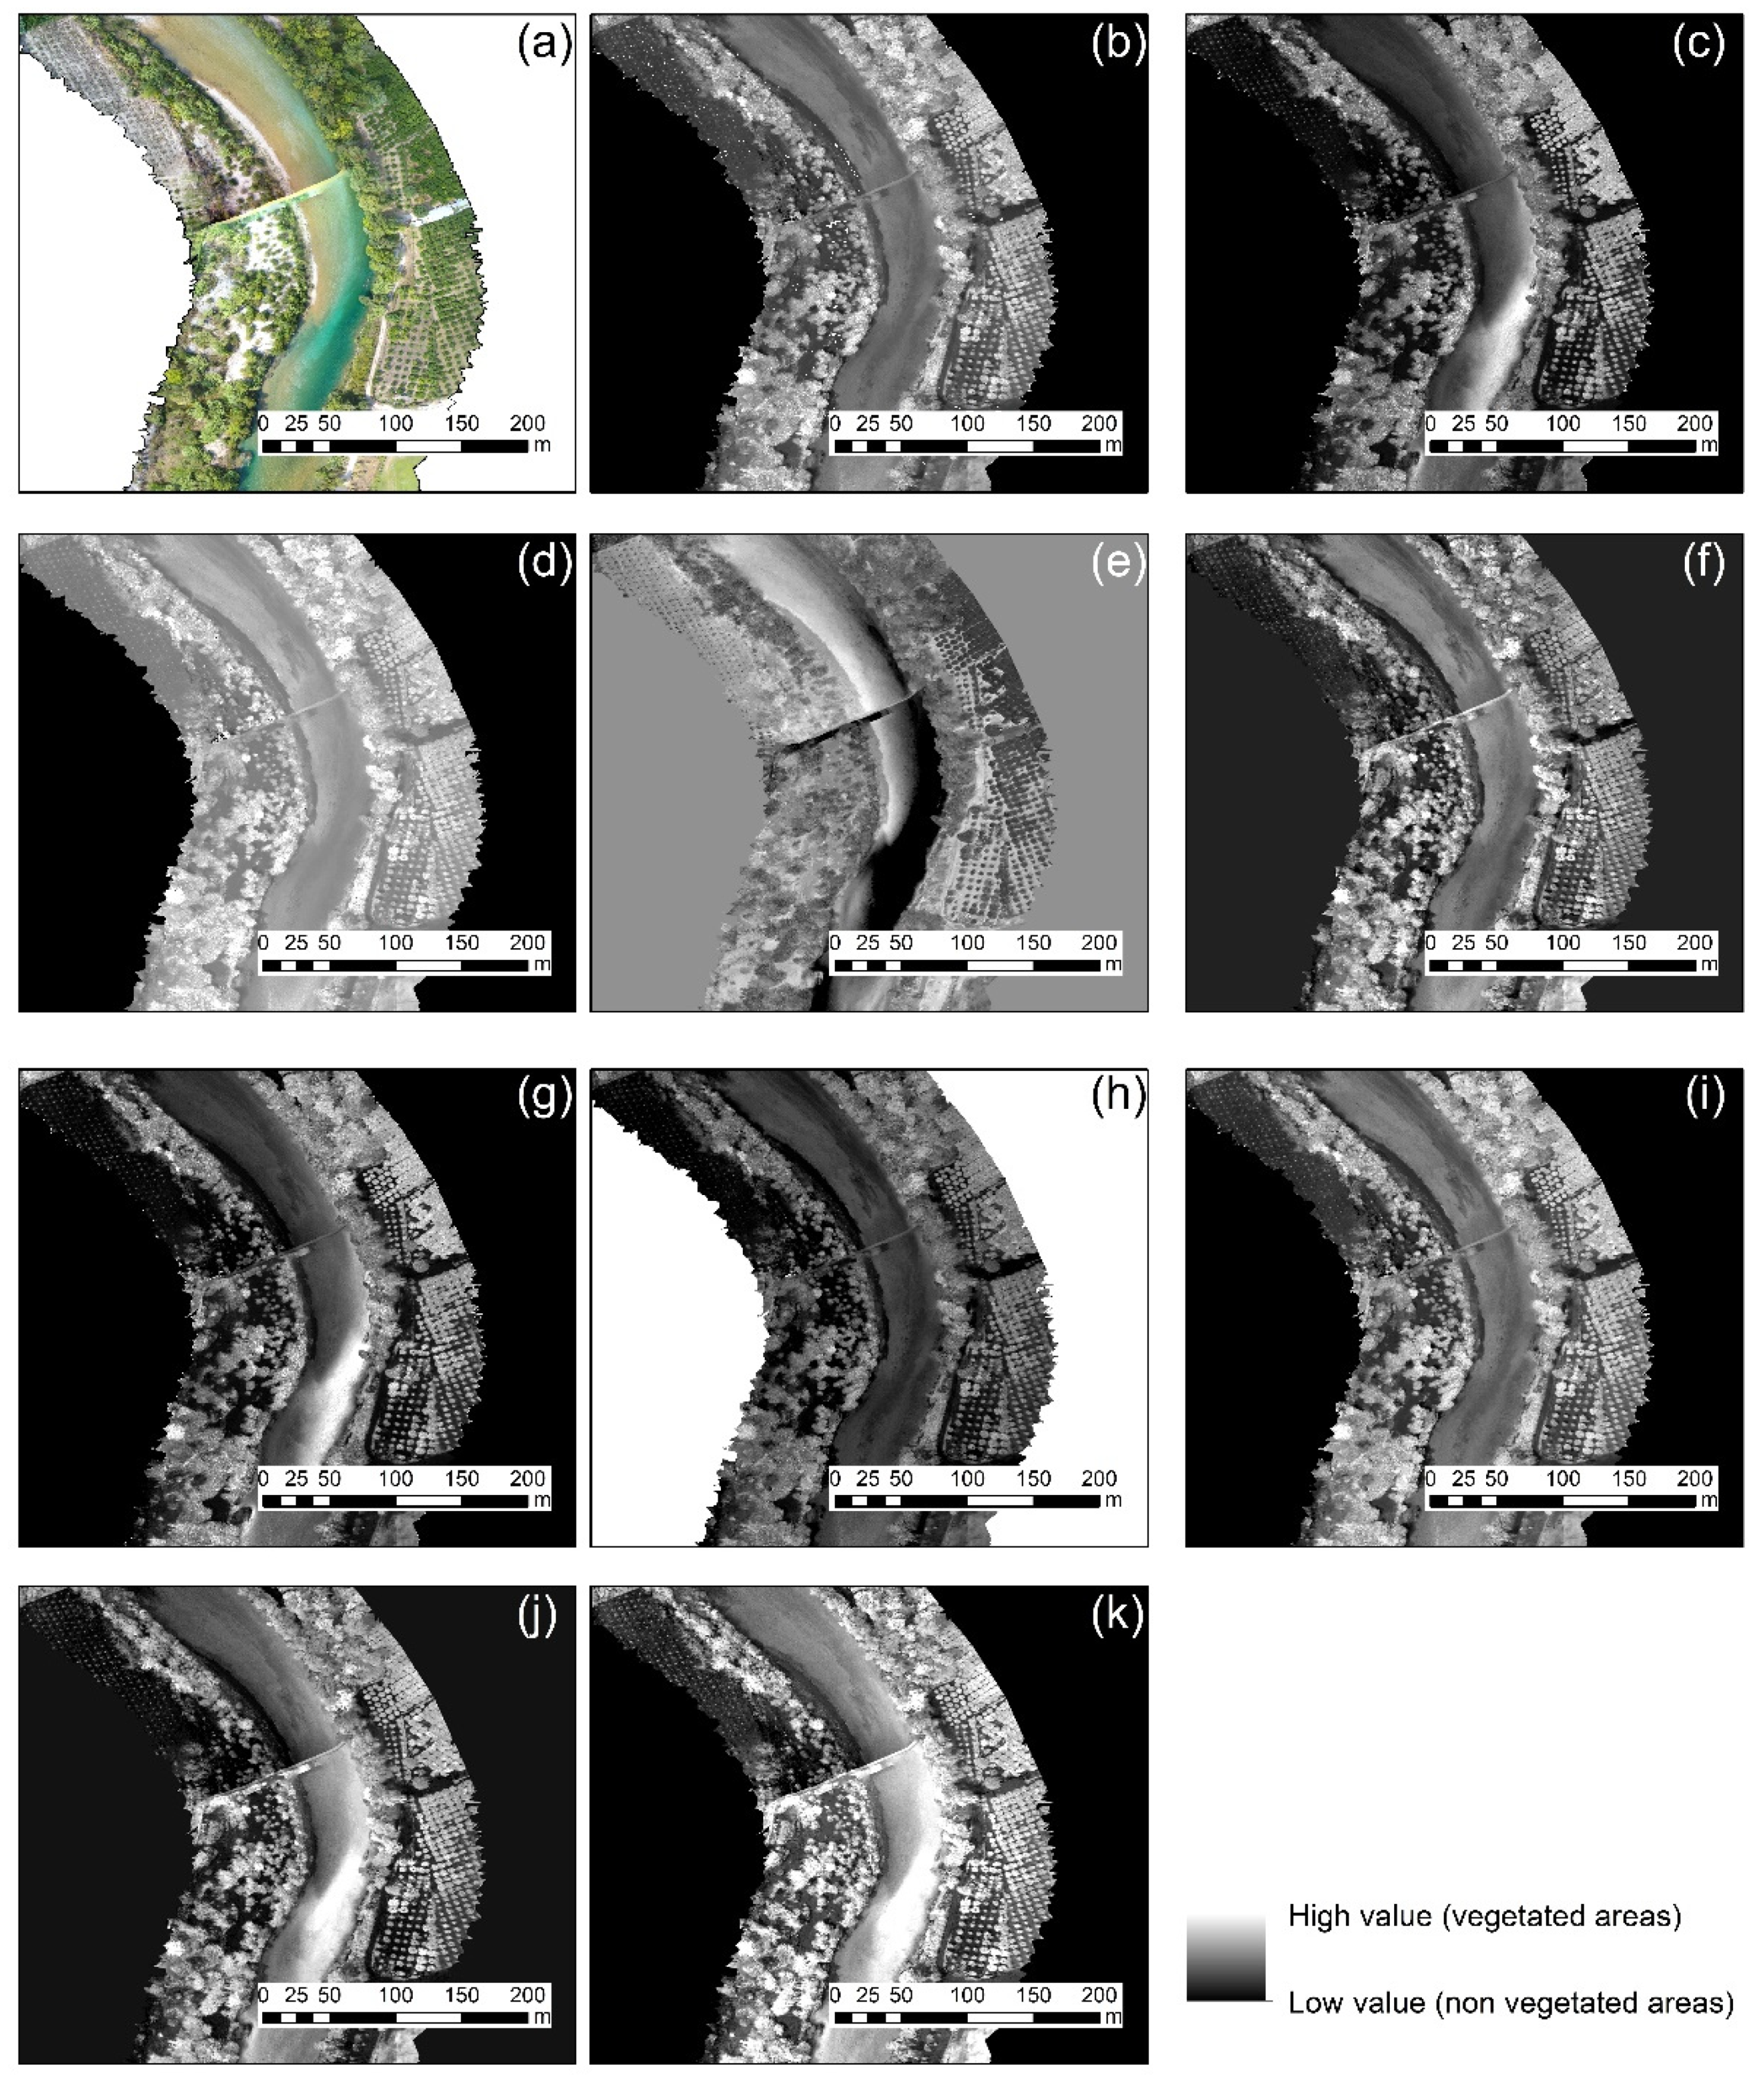
Once the orthophotos were radiometrically corrected, all vegetation indices mentioned in Table 2 were applied. The final results of this implementation for case studies 1 and 4 are shown in Figure 5 and Figure 6, respectively. The calibrated RGB orthophoto of each case study is shown in Figure 5a and Figure 6a, while the normalized green–red difference index is shown in Figure 5b and Figure 6b. Similarly, Figure 5c–k and Figure 6c–k show the results from the green leaf index, visible atmospherically resistant index, triangular greenness index, red–green ratio index, red–green–blue vegetation index, red–green ratio index, modified green–red vegetation index (i), excess green index, and color index of vegetation (k), respectively. Vegetated areas are highlighted with the light grayscale tone, while non-vegetated areas with the darkest tone of grey.
As shown in Figure 5 and Figure 6, all vegetation indices were able to enhance vegetation in both areas; however, the best performance was observed for Figure 5b,f,i. For Figure 6, a clearer view of the vegetated areas can be detected in Figure 6e. Similar findings were also observed in the rest of the case studies not shown here, indicating that visible vegetation indices using the RGB color can enhance healthy vegetation; however, their performance rate is based on the context of the image. Indeed, for instance, the triangular greenness index in Figure 5e tended to give poor results since vegetation was not well enhanced in the urban environment. However, the same index was the best for the picnic area in Figure 6e.
Extraction of the vegetated regions using RGB cameras can be quite problematic, regardless of the vegetation index applied, in an environment similar to the one of case study 3 (along a river). Figure 7 below shows a closer look at the northern part of the river for all ten vegetation indices mentioned in Table 2. While some indices can enhance the vegetation along the river, as the case of the normalized green–red difference index (Figure 7b), the river itself can also be characterized as “vegetated areas”. This is due to the low level of water in the river and the apparent watergrass within the river.
Therefore, as it was found from the visual interpretation of the results, the RGB vegetation indices can enhance vegetated areas. However, they can also give false results. For this reason, a statistical comparison for all vegetation indices and all case studies was applied.

3.3. Statistics

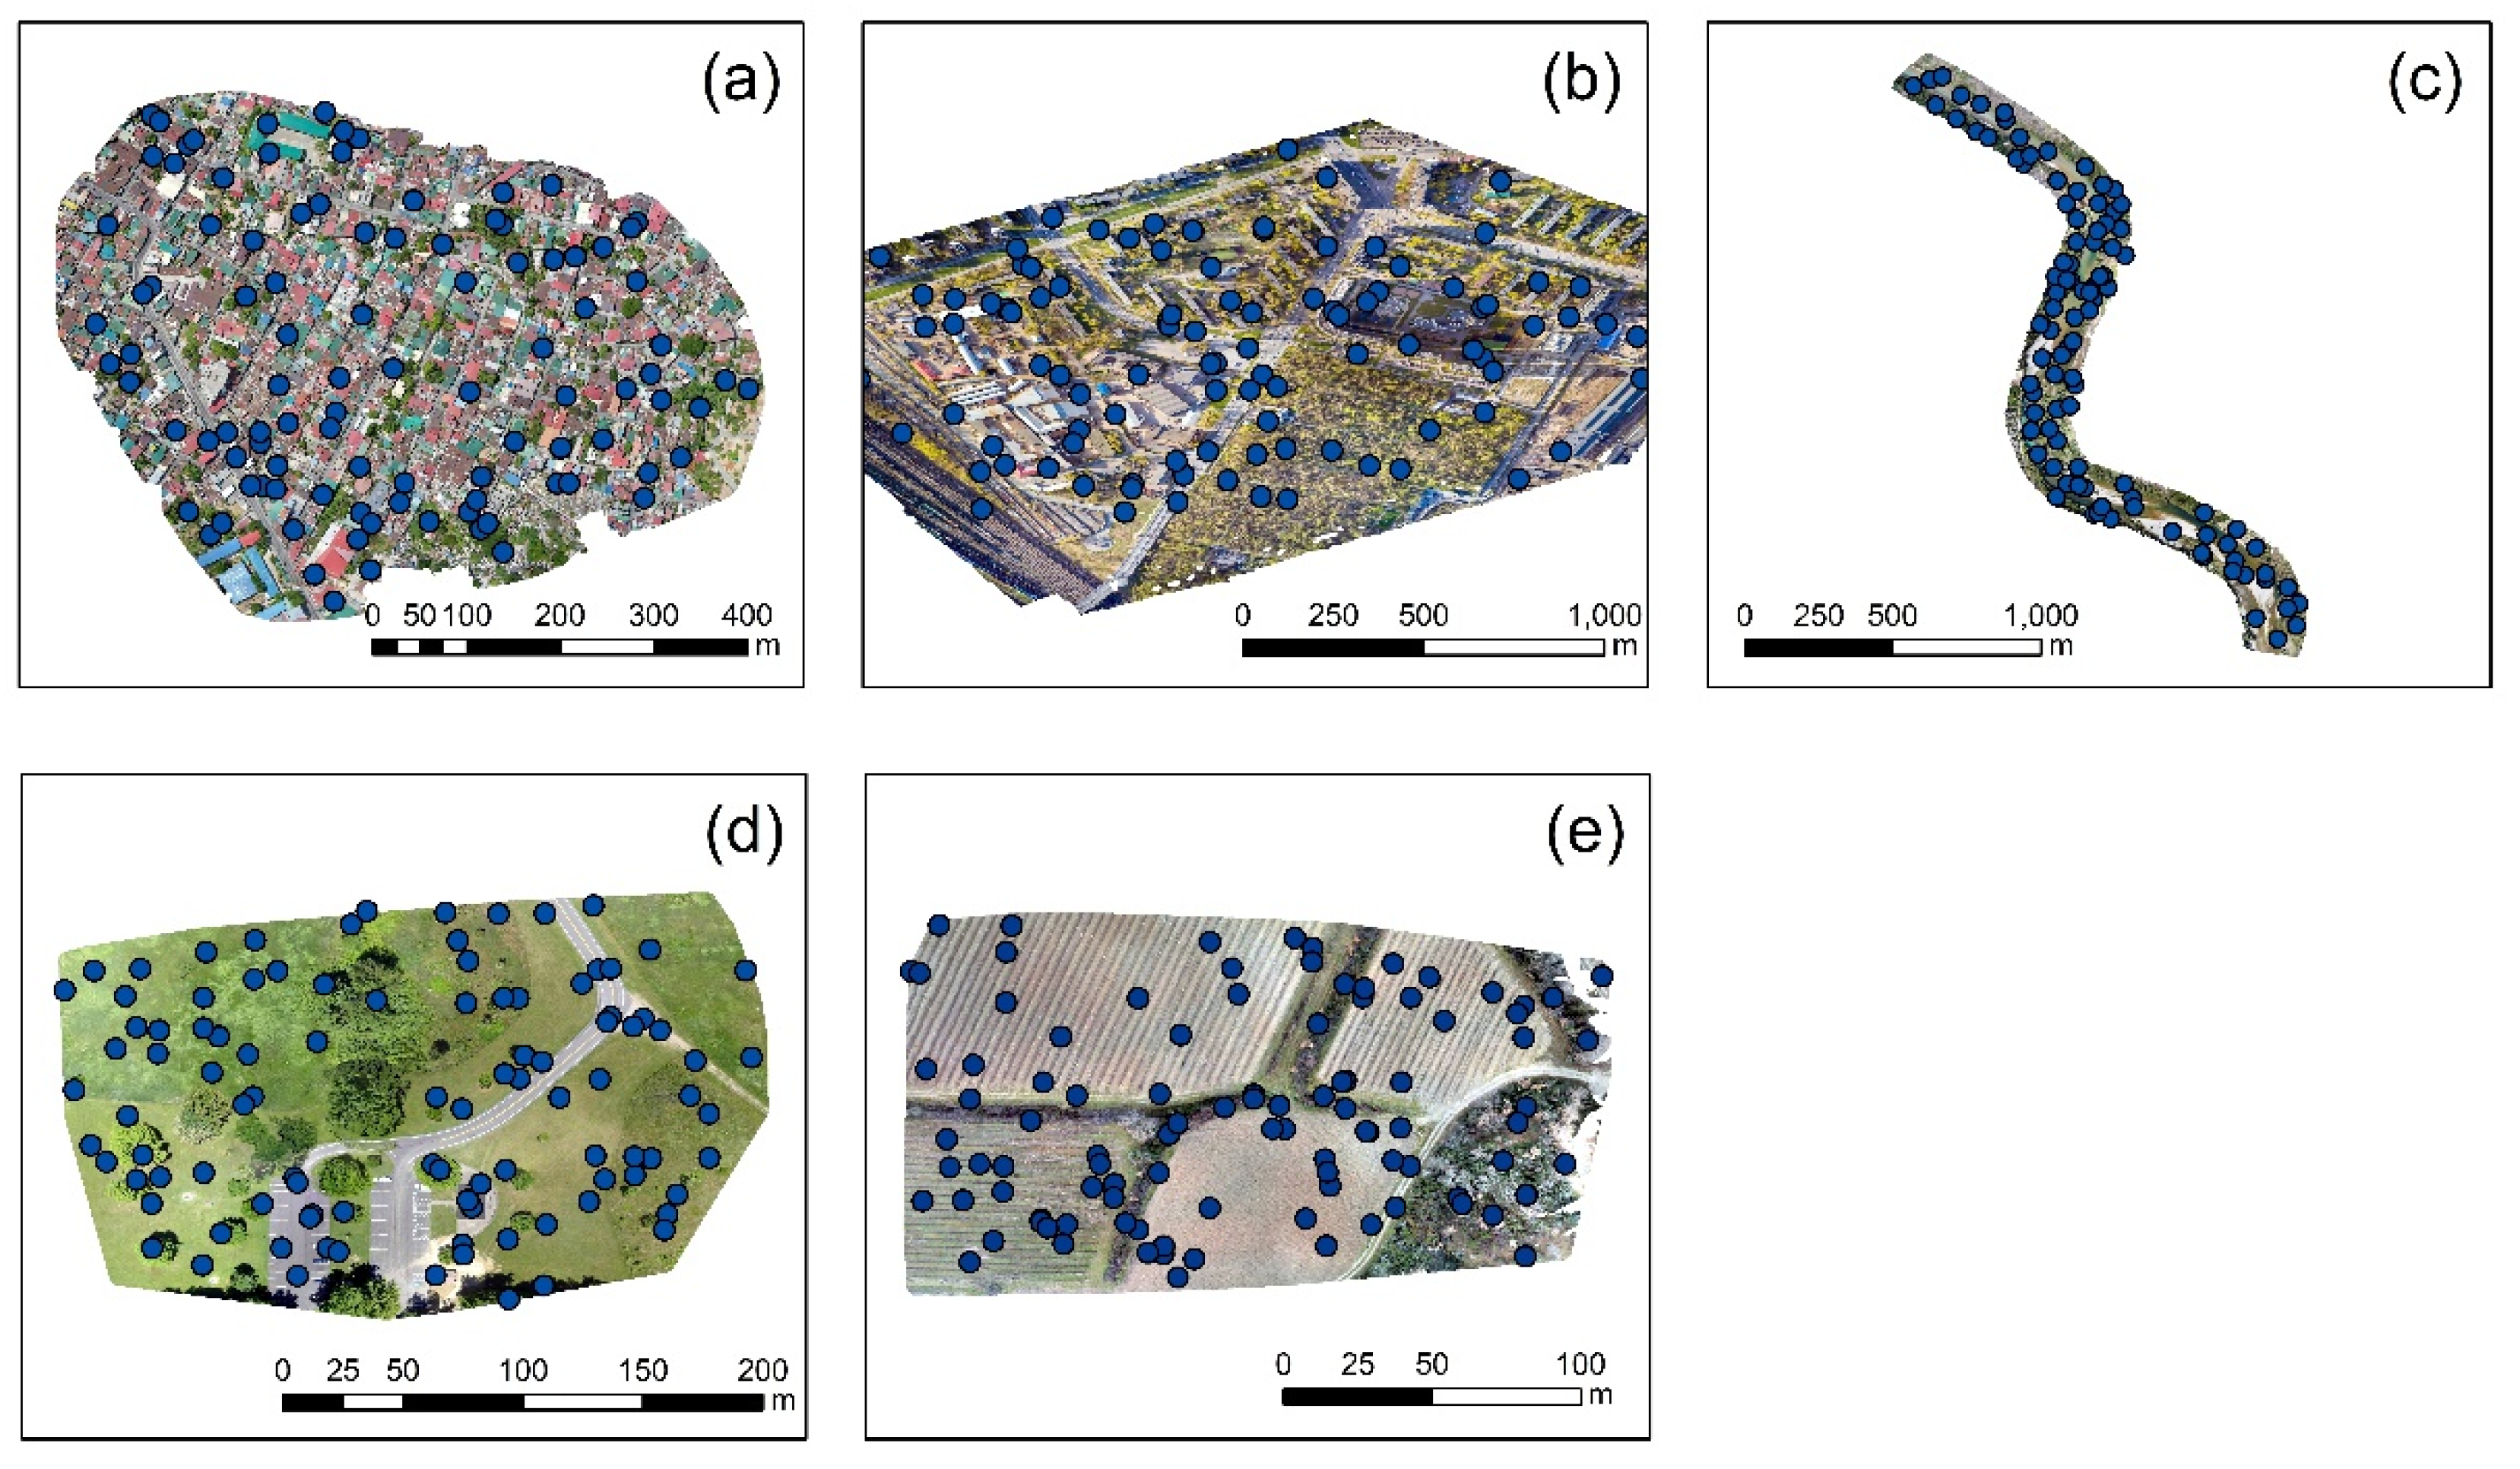
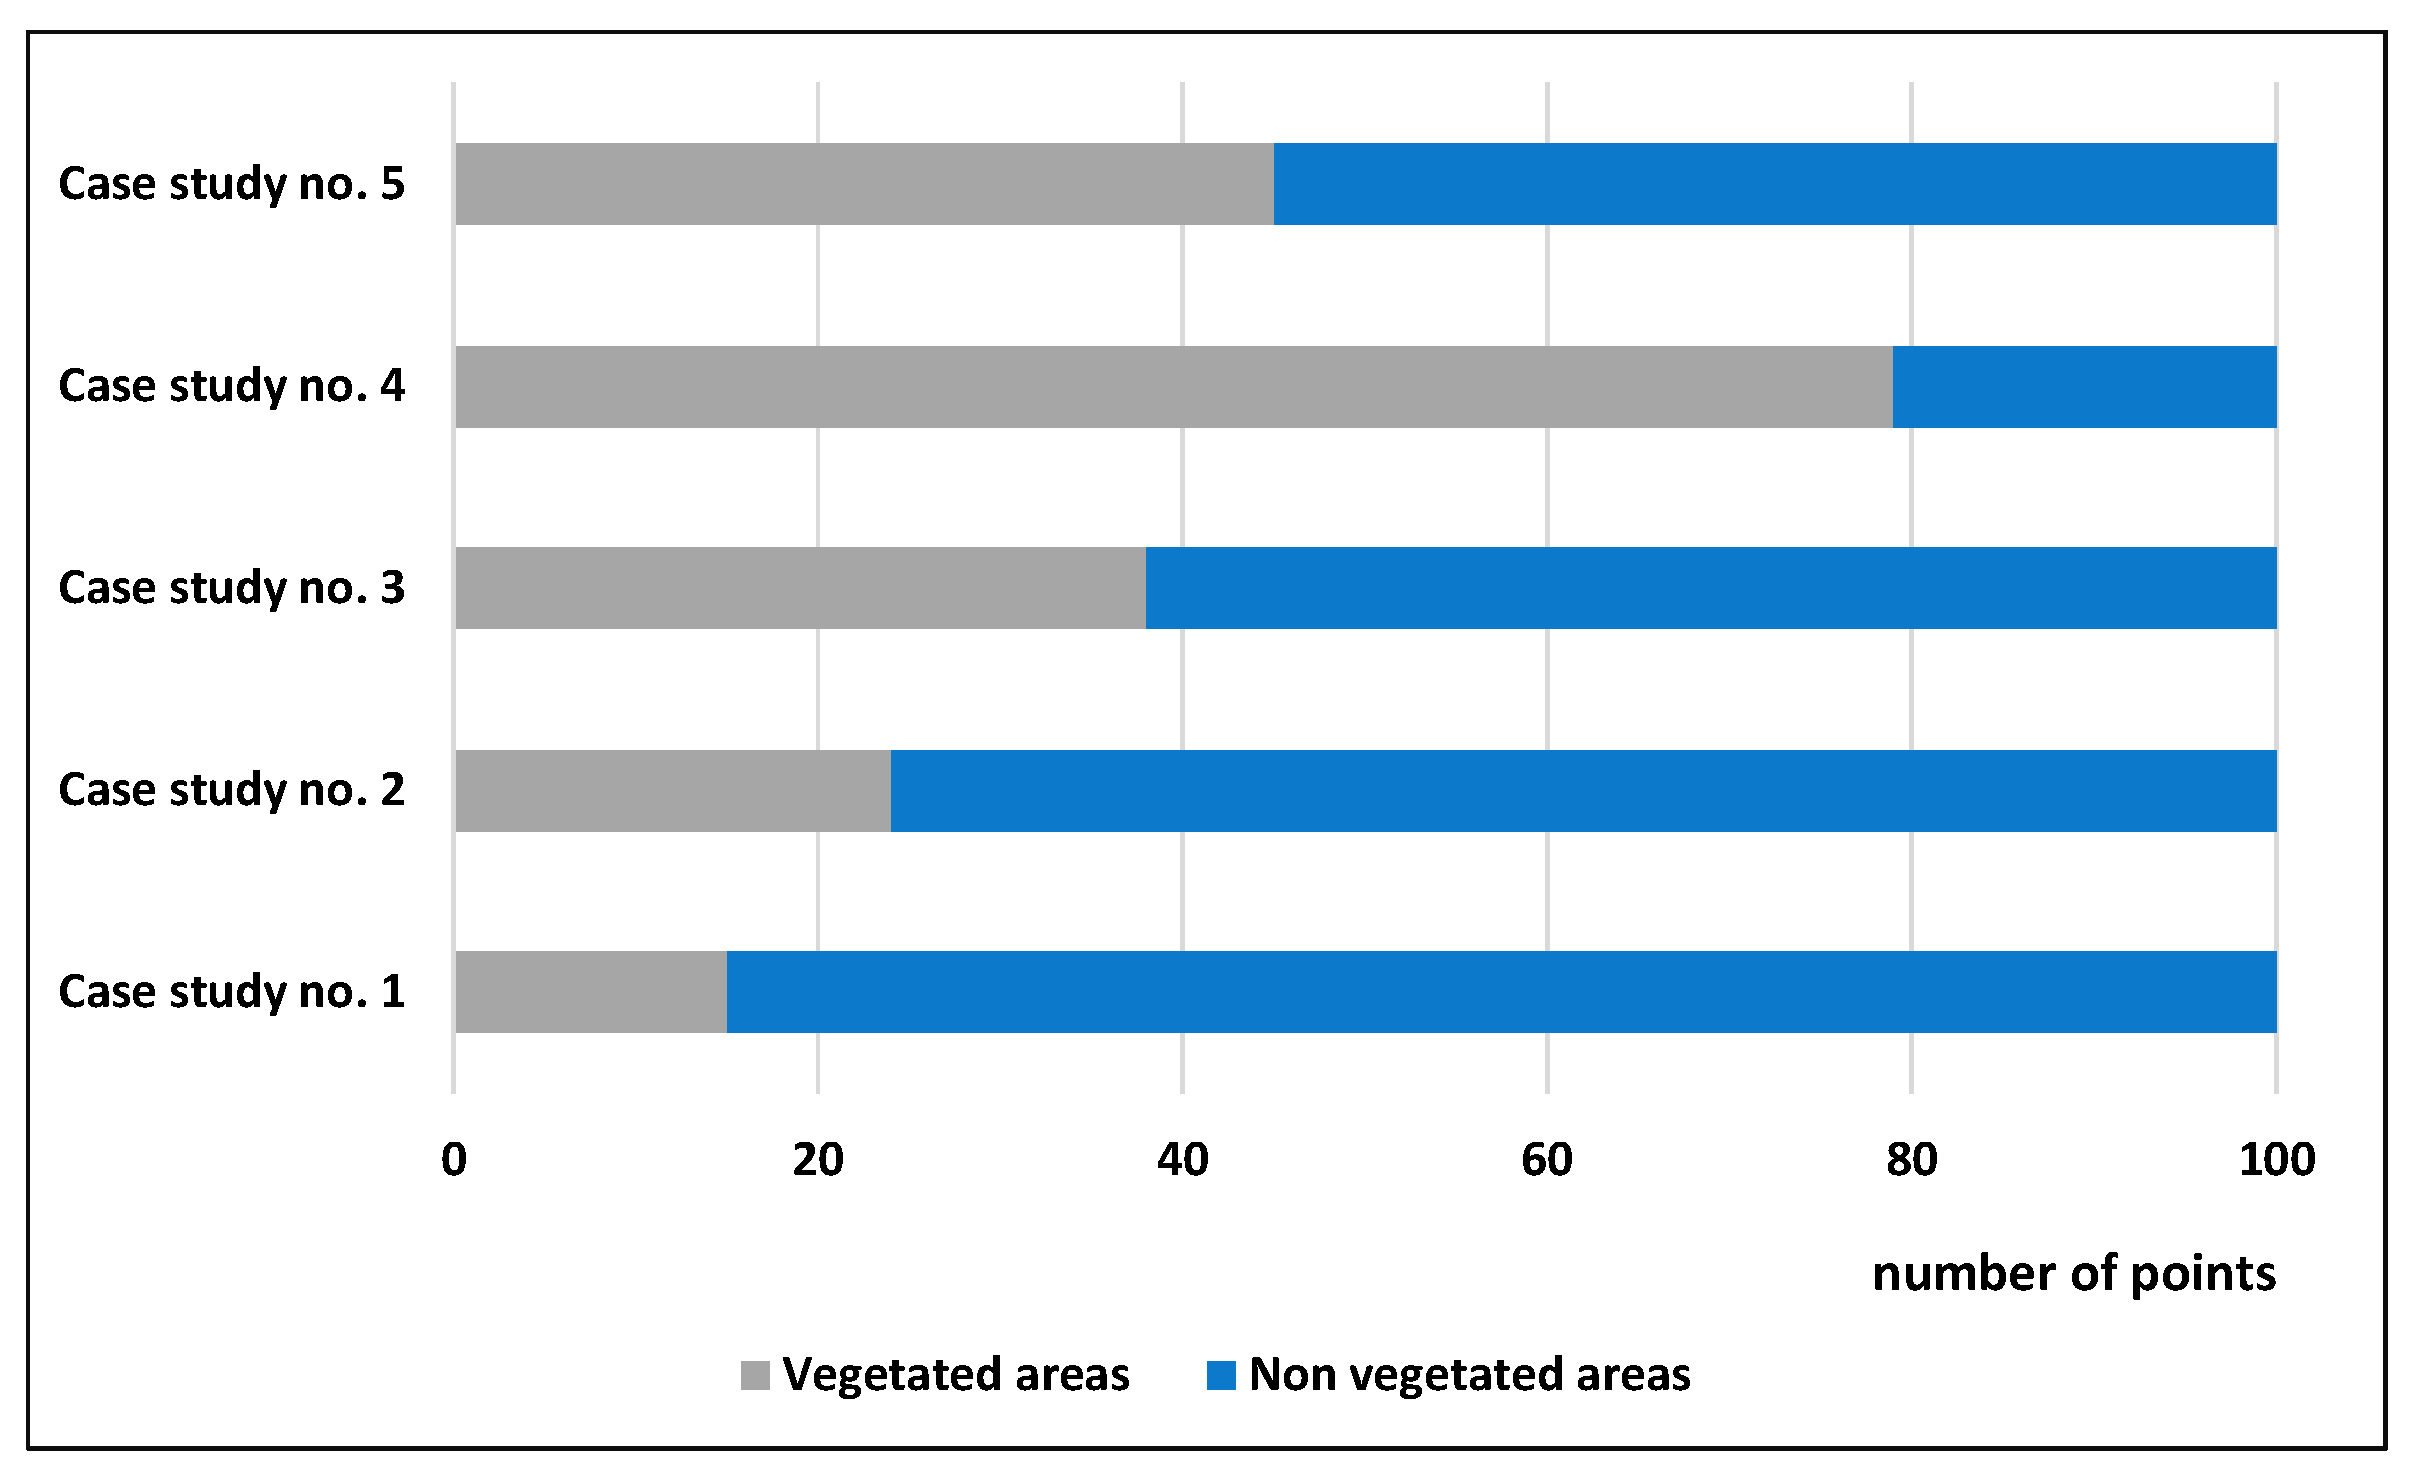
To evaluate the overall performance of the ten vegetation indices (see Table 2) per case study, several points were distributed in each orthophoto (100 in total per case study). These points were randomly positioned either over vegetated areas (trees, grass, etc.) or scattered in other types of targets (e.g., asphalt, roofs, water, etc.). The geographical distributions of the points per case study are visualized in Figure 8, while Figure 9 presents the allocation of the random points for “vegetated” and “non-vegetated areas”. As expected in orthophotos with limited vegetation, such as the case study of No. 1, the number of points characterized as “vegetation” was less than the “non-vegetation” points (14 and 86 points, respectively).
The normalized difference between the mean value for each index over “vegetated areas” and “non-vegetated” areas is presented in Table 3. Blue color indicates the lowest normalized difference value, while red color, the highest value per vegetation index (V1 to V10). Overall the normalized difference spanned from 1.2% to 269% for all indices and case studies. For the NGRDI (Normalized green red difference index, V1 of Table 3), the lowest value was observed for case study No. 3, which visualized an area along a river near Arta, Greece. The highest values were reported for the small agricultural area of case study No. 5. The normalized difference of the NGRDI index for all case studies was between 50% to 107%. Similar observations were reported for the green leaf index (GLI) and Visible atmospherically resistant index (VARI) indies (V2 and V3 of Table 3, respectively). An analogous pattern was also reported for the red–green ratio index (IRG), red–green–blue vegetation index (RGBVI), modified green–red vegetation index (MGRVI), and excess green index (ExG) indices (V5, V6, V8, and V9 of Table 3, respectively). For the triangular greenness index (TGI) (V4 of Table 3), the lowest normalized difference was once again reported for case study No. 3, but the highest one for the urban areas of case study No. 1. The same area also gave the highest relatives values for the red–green ratio index (RGRI) (V7 of Table 3). Finally, for the color index of vegetation (CIVE) (V10 of Table 3), the lowest score was reported for case study No. 5, and the highest at the picnic area in case study No. 4.
In general, we can state that case study No. 3 (river area) tended to give low differences between the vegetated and non-vegetated areas despite the vegetation index applied, indicating that this is by far the most challenging environment to work with and to try to discriminate vegetation from the rest areas. In contrast, high separability for all indices could be seen for case study No. 5 (agricultural area) and case study No. 1 (urban areas).
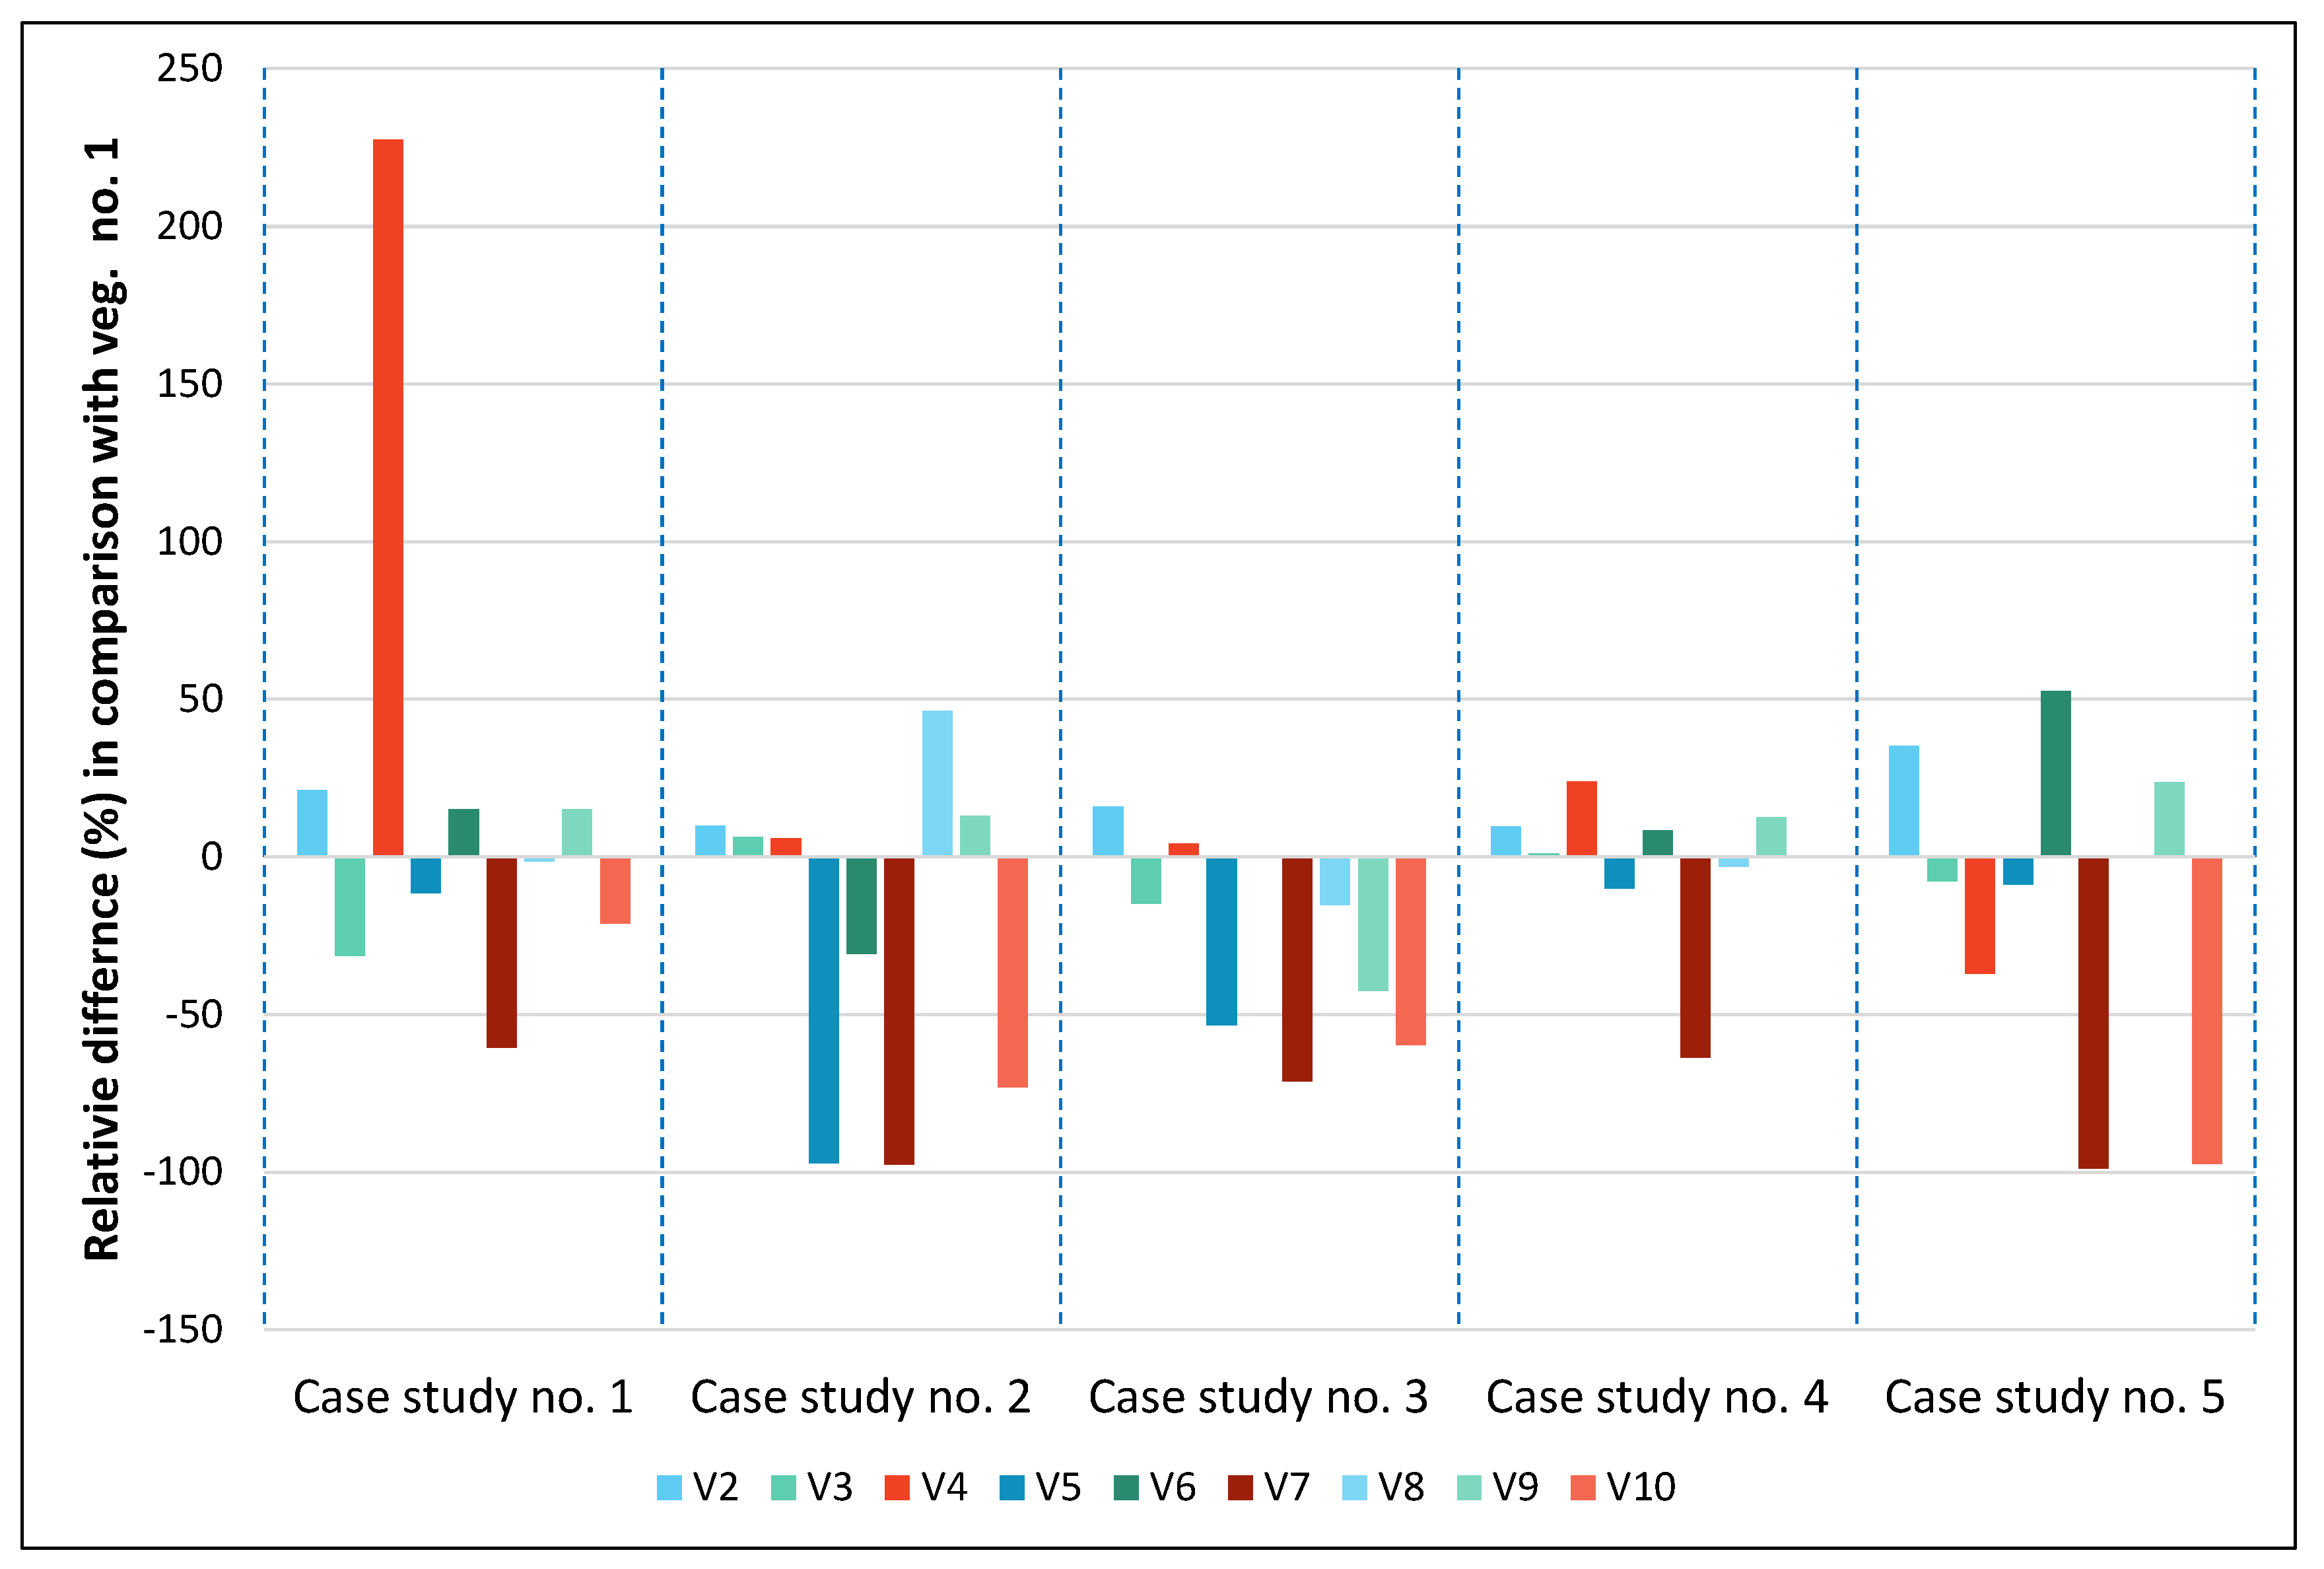
Based on the results of Table 3, we have then relatively compared the normalized difference for all case studies per vegetation index, setting the vegetation No. 1 (NGRDI) as a reference index. The results of this analysis are shown in Figure 10. The normalized difference indicates the percentage difference between (index No. i − index No. 1)/index No. 1. Therefore, the negative values in Figure 10 suggest that the specific index provided the poorest results in comparison with the NGRDI index (vegetation No. 1). In contrast, high values imply that the particular index gives better results compared to the NGRDI index. Vegetation indices that are closed to zero signify that they have similar performance with the reference index (NGRDI).
From the results of Figure 10, we can observe that the most promising index was vegetation No. 2, namely the green leaf index (GLI), which provided better results in comparison with the NGRDI index for all case studies. Its performance ranged from 10% to 35%. This is the only index that provided better results for all case studies. Good performance for all case studies, with the exception of case study No. 3 (a river near Arta, Greece), was the vegetation index No. 9 (excess green index, ExG), as it provides a relative difference in comparison with the NGRDI index between 12% and 23% for case studies 1 and 2, and 4 and 5. In contrast, for case study No. 3, the specific index tended to give the worst performance (42%) in comparison with the reference index. Vegetation indices 5, 7, and 10 (IRG, red–green ratio index; RGRI, red–green ratio index, and CIVE, color index of vegetation, respectively) seemed not to perform better than the reference index for all case studies.
However, it is important to notice that for each case study, the optimum index varied, which is also aligned with the previous findings of Table 3. For case study 1 (a highly urbanized area, at Taytay, Philippines), the best index was No. 4 (TGI, triangular greenness index), for case study 2 (a campus at St. Petersburg, Russia), the best index was vegetation No. 8 (MGRVI, modified green–red vegetation index). For case study 3 (a river near Arta, Greece), the best index was vegetation No. 2 (GLI, green leaf index). Finally, for the last two case studies, No. 4 and No. 5, indicating a picnic area at Ohio, USA, and an agricultural area at Nîmes, France, respectively, the best indices were again vegetation No. 4 (TGI, triangular greenness index) and vegetation No. 6 (RGBVI, red–green–blue vegetation index).

4. Discussion

The results presented in the previous section, provide some very helpful information regarding the extraction of vegetation in visible orthophotos, in various environments. It was shown that the application of vegetation indices based on visible bands could highlight vegetated areas and, therefore, enhance healthy vegetation. Indeed, the results presented in Figure 5 and Figure 6 indicate that several indices could perform a high separability between vegetated and non-vegetated areas, while from the findings of Table 3, itis demonstrated that for each case study there was a unique index that could highlight these two different areas, with a relative difference ranging from 57% up to 269%. The differences between the vegetated and non-vegetated areas were also found to be statistically significant for all case studies, after the application of a t-test with a 95% confidence level.
While this is true, the context of some orthophotos can also be characterized as quite challenging as the case study No. 3. The results from the application of all indices are shown in Figure 7, which shows that the detection of vegetated areas could also have several false positives within the river basin.
Beyond the spectral complexity and heterogeneity of the orthophoto, some other factors, not discussed in the paper, can also influence the overall performance of the indices. Initially, the spectral response filters of each camera used for these orthophotos were different. Differences in the sensitivity of the cameras to capture in specific wavelengths the backscattered reflectance values can be significant, as was demonstrated in the past from other studies [30]. In addition, the resolution of the orthophoto was not always optimum for each case study. Recent studies [31,32] have shown that the optimum resolution for remote sensing applications is connected not only to the spatial characteristics of the targets under investigation but also with their spectral properties. Finally, assumptions made during the radiometric calibration of the orthophotos need to be taken into consideration. At the same time, a pre-flight plan with special targets and spectroradiometric campaigns can minimize these errors.

5. Conclusions

Vegetation extraction has attracted the interest of researchers all around the world due to its importance of monitoring agricultural areas, forests, etc. While their detection is based on the exploitation of the near-infrared part of the spectrum, the tremendous increase in low altitude platforms, such as the UAVs, equipped with only visible cameras, has made this task quite challenging.
In this paper, we explored openly licensed unmanned aerial vehicle (UAV) imagery from the OpenAerialMap platform, selecting five different case studies, with different contexts and UAV sensors. Since these products were downloaded “as is”, it was necessary to apply a radiometric correction before any further processing. For this reason, the EML image-based technique was applied for some case studies (namely case studies Nos. 1, 2, and 4), while for the rest of the case studies (Nos. 3 and 5), normalization of the orthophotos based on image statistics was applied. This procedure does not require any knowledge of either ground targets or field campaigns with spectroradiometers and spectral reflectance targets, which could not be performed in this study (i.e., after the UAV flight). Once the radiometric calibration was applied and verified using spectral signatures profiles of targets on the UAVs, then various visible vegetation indices were applied to all case studies. The results were further elaborated to examine the performance of each index. From the findings of this study, two aspects can be highlighted:
  • Finding 1: The best vegetation index for all case studies was the green leaf index (GLI), which explores all visible bands of the RGB cameras. The specific index was able to provide better results robustly in all different environments. However:
  • Finding 2: The performance of each index varied per case study as expected. Therefore, for each different orthophoto, there was a visible index that highlights better the vegetated areas.
The findings of this study can be applied in any RGB orthophoto, taken either from a low altitude system or even aerial images. Given the wide application of ready-to-fly (RTF) drones with a cost of approximatively less than 2000 euros, RGB cameras will continue to play an important role in the near future for small survey campaigns. While field campaigns and particular targets are necessary to calibrate the reflectance of the images, if these are, for any reason, absent, then a similar approach presented here can be followed. In the future, specialized vegetation indices can be developed for addressing specific needs, thus making the extraction of vegetation an easier and more straightforward procedure. Given the various phenological growth stages of vegetation, a dynamic threshold method can be investigated in the future for specific types of vegetation (e.g., crops) towards the automatic extraction of vegetation from RGB orthophotos. These vegetation-specific optimum thresholds could eventually be use to mask or extract the vegetated areas. Finally, a different approach for the extraction of vegetation based on supervised classification analysis can be performed in the future.

Author Contributions

Conceptualization, methodology, formal analysis, investigation, writing—original draft preparation, A.A. Author has read and agreed to the published version of the manuscript.

Funding

This article is submitted under the NAVIGATOR project. The project is co-funded by the Republic of Cyprus and the Structural Funds of the European Union in Cyprus under the Research and Innovation Foundation grant agreement EXCELLENCE/0918/0052 (Copernicus Earth Observation Big Data for Cultural Heritage).

Acknowledgments

The author acknowledges the use of high resolution openly licensed unmanned aerial vehicle (UAV) imagery. All imagery is publicly licensed and made available through the Humanitarian OpenStreetMap Team’s Open Imagery Network (OIN) Node. All imagery contained in OIN is licensed CC-BY 4.0, with attribution as contributors of Open Imagery Network. All imagery is available to be traced in OpenStreetMap (https://openaerialmap.org). Thanks, are also provided to the Eratosthenes Research Centre of the Cyprus University of Technology for its support. The Centre is currently being upgraded through the H2020 Teaming Excelsior project (www.excelsior2020.eu).

Conflicts of Interest

The authors declare no conflict of interest

References

  1. García-Berná, J.A.; Ouhbi, S.; Benmouna, B.; García-Mateos, G.; Fernández-Alemán, J.L.; Molina-Martínez, J.M. Systematic Mapping Study on Remote Sensing in Agriculture. Appl. Sci. 2020, 10, 3456. [Google Scholar] [CrossRef]
  2. Pensieri, M.G.; Garau, M.; Barone, P.M. Drones as an Integral Part of Remote Sensing Technologies to Help Missing People. Drones 2020, 4, 15. [Google Scholar] [CrossRef]
  3. Feng, Q.; Yang, J.; Liu, Y.; Ou, C.; Zhu, D.; Niu, B.; Liu, J.; Li, B. Multi-Temporal Unmanned Aerial Vehicle Remote Sensing for Vegetable Mapping Using an Attention-Based Recurrent Convolutional Neural Network. Remote Sens. 2020, 12, 1668. [Google Scholar] [CrossRef]
  4. Pinton, D.; Canestrelli, A.; Fantuzzi, L. A UAV-Based Dye-Tracking Technique to Measure Surface Velocities over Tidal Channels and Salt Marshes. J. Mar. Sci. Eng. 2020, 8, 364. [Google Scholar] [CrossRef]
  5. Pajares, G. Overview and current status of remote sensing applications based on unmanned aerial vehicles (UAVs). Photogramm. Eng. Remote Sens. 2015, 81, 281–330. [Google Scholar] [CrossRef] [Green Version]
  6. Cummings, A.R.; McKee, A.; Kulkarni, K.; Markandey, N. The Rise of UAVs. Photogramm. Eng. Remote Sens. 2017, 83, 317–325. [Google Scholar] [CrossRef]
  7. Stöcker, C.; Bennett, R.; Nex, F.; Gerke, M.; Zevenbergen, J. Review of the Current State of UAV Regulations. Remote Sens. 2017, 9, 459. [Google Scholar] [CrossRef] [Green Version]
  8. Jiménez López, J.; Mulero-Pázmány, M. Drones for Conservation in Protected Areas: Present and Future. Drones 2019, 3, 10. [Google Scholar] [CrossRef] [Green Version]
  9. Hashemi-Beni, L.; Jones, J.; Thompson, G.; Johnson, C.; Gebrehiwot, A. Challenges and Opportunities for UAV-Based Digital Elevation Model Generation for Flood-Risk Management: A Case of Princeville, North Carolina. Sensors 2018, 18, 3843. [Google Scholar] [CrossRef] [PubMed] [Green Version]
  10. Yang, M.-D.; Tseng, H.-H.; Hsu, Y.-C.; Tsai, H.P. Semantic Segmentation Using Deep Learning with Vegetation Indices for Rice Lodging Identification in Multi-date UAV Visible Images. Remote Sens. 2020, 12, 633. [Google Scholar] [CrossRef] [Green Version]
  11. Marino, S.; Alvino, A. Agronomic Traits Analysis of Ten Winter Wheat Cultivars Clustered by UAV-Derived Vegetation Indices. Remote Sens. 2020, 12, 249. [Google Scholar] [CrossRef] [Green Version]
  12. Lima-Cueto, F.J.; Blanco-Sepúlveda, R.; Gómez-Moreno, M.L.; Galacho-Jiménez, F.B. Using Vegetation Indices and a UAV Imaging Platform to Quantify the Density of Vegetation Ground Cover in Olive Groves (Olea Europaea L.) in Southern Spain. Remote Sens. 2019, 11, 2564. [Google Scholar] [CrossRef] [Green Version]
  13. Yeom, J.; Jung, J.; Chang, A.; Ashapure, A.; Maeda, M.; Maeda, A.; Landivar, J. Comparison of Vegetation Indices Derived from UAV Data for Differentiation of Tillage Effects in Agriculture. Remote Sens. 2019, 11, 1548. [Google Scholar] [CrossRef] [Green Version]
  14. Hennessy, A.; Clarke, K.; Lewis, M. Hyperspectral Classification of Plants: A Review of Waveband Selection Generalisability. Remote Sens. 2020, 12, 113. [Google Scholar] [CrossRef] [Green Version]
  15. Agapiou, A.; Hadjimitsis, D.G.; Alexakis, D.D. Evaluation of Broadband and Narrowband Vegetation Indices for the Identification of Archaeological Crop Marks. Remote Sens. 2012, 4, 3892–3919. [Google Scholar] [CrossRef] [Green Version]
  16. Rouse, J.W.; Haas, R.H.; Schell, J.A.; Deering, D.W.; Harlan, J.C. Monitoring the Vernal Advancements and Retrogradation (Greenwave Effect) of Nature Vegetation; NASA/GSFC Final Report; NASA: Greenbelt, MD, USA, 1974. [Google Scholar]
  17. Xu, K.; Gong, Y.; Fang, S.; Wang, K.; Lin, Z.; Wang, F. Radiometric Calibration of UAV Remote Sensing Image with Spectral Angle Constraint. Remote Sens. 2019, 11, 1291. [Google Scholar] [CrossRef] [Green Version]
  18. Iqbal, F.; Lucieer, A.; Barry, K. Simplified radiometric calibration for UAS-mounted multispectral sensor. Eur. J. Remote Sens. 2018, 51, 301–313. [Google Scholar] [CrossRef]
  19. OpenAerialMap (OAM). Available online: https://openaerialmap.org (accessed on 19 May 2020).
  20. Pompilio, L.; Marinangeli, L.; Amitrano, L.; Pacci, G.; D’andrea, S.; Iacullo, S.; Monaco, E. Application of the empirical line method (ELM) to calibrate the airborne Daedalus-CZCS scanner. Eur. J. Remote Sens. 2018, 51, 33–46. [Google Scholar] [CrossRef] [Green Version]
  21. Tucker, C.J. Red and photographic infrared linear combinations for monitoring vegetation. Remote Sens. Environ. 1979, 8, 127–150. [Google Scholar] [CrossRef] [Green Version]
  22. Louhaichi, M.; Borman, M.M.; Johnson, D.E. Spatially located platform and aerial photography for documentation of grazing impacts on wheat. Geocarto Int. 2001, 16, 65. [Google Scholar] [CrossRef]
  23. Gitelson, A.A.; Kaufman, Y.J.; Stark, R.; Rundquist, D. 2002. Novel algorithms for remote estimation of vegetation fraction. Remote Sens. Environ. 2002, 80, 76–87. [Google Scholar] [CrossRef] [Green Version]
  24. Hunt, E.R.; Daughtry, C.S.T.; Eitel, J.U.H.; Long, D.S. Remote sensing leaf chlorophyll content using a visible band index. Agron. J. 2011, 103, 1090–1099. [Google Scholar] [CrossRef] [Green Version]
  25. Gamon, J.A.; Surfus, J.S. Assessing leaf pigment content and activity with a reflectometer. New Phytol. 1999, 143, 105–117. [Google Scholar] [CrossRef]
  26. Bendig, J.; Yu, K.; Aasen, H.; Bolten, A.; Bennertz, S.; Broscheit, J.; Gnyp, M.L.; Bareth, G. Combining UAV-based plant height from crop surface models, visible, and near infrared vegetation indices for biomass monitoring in barley. Int. J. Appl. Earth Obs. Geoinf. 2015, 39, 79–87. [Google Scholar] [CrossRef]
  27. Verrelst, J.; Schaepman, M.E.; Koetz, B.; Kneubuehler, M. Angular sensitivity analysis of vegetation indices derived from chris/proba data. Remote Sens. Environ. 2008, 112, 2341–2353. [Google Scholar] [CrossRef]
  28. Woebbecke, D.M.; Meyer, G.E.; Vonbargen, K.; Mortensen, D.A. Color indexes for weed identification under various soil, residue, and lighting conditions. Trans. ASAE 1995, 38, 259–269. [Google Scholar] [CrossRef]
  29. Kataoka, T.; Kaneko, T.; Okamoto, H.; Hata, S. Crop growth estimation system using machine vision. In Proceedings of the 2003 IEEE/ASME International Conference on Advanced Intelligent Mechatronics, Kobe, Japan, 20–24 July 2003; pp. 1079–1083. [Google Scholar]
  30. Agapiou, A.; Alexakis, D.D.; Hadjimitsis, D.G. Spectral sensitivity of ALOS, ASTER, IKONOS, LANDSAT and SPOT satellite imagery intended for the detection of archaeological crop marks. Int. J. Dig. Earth 2012, 7(5), 351–372. [Google Scholar] [CrossRef]
  31. Tran, T.-B.; Puissant, A.; Badariotti, D.; Weber, C. Optimizing Spatial Resolution of Imagery for Urban Form Detection—The Cases of France and Vietnam. Remote Sens. 2011, 3, 2128–2147. [Google Scholar] [CrossRef] [Green Version]
  32. Agapiou, A. Optimal Spatial Resolution for the Detection and Discrimination of Archaeological Proxies in Areas with Spectral Heterogeneity. Remote Sens. 2020, 12, 136. [Google Scholar] [CrossRef] [Green Version]
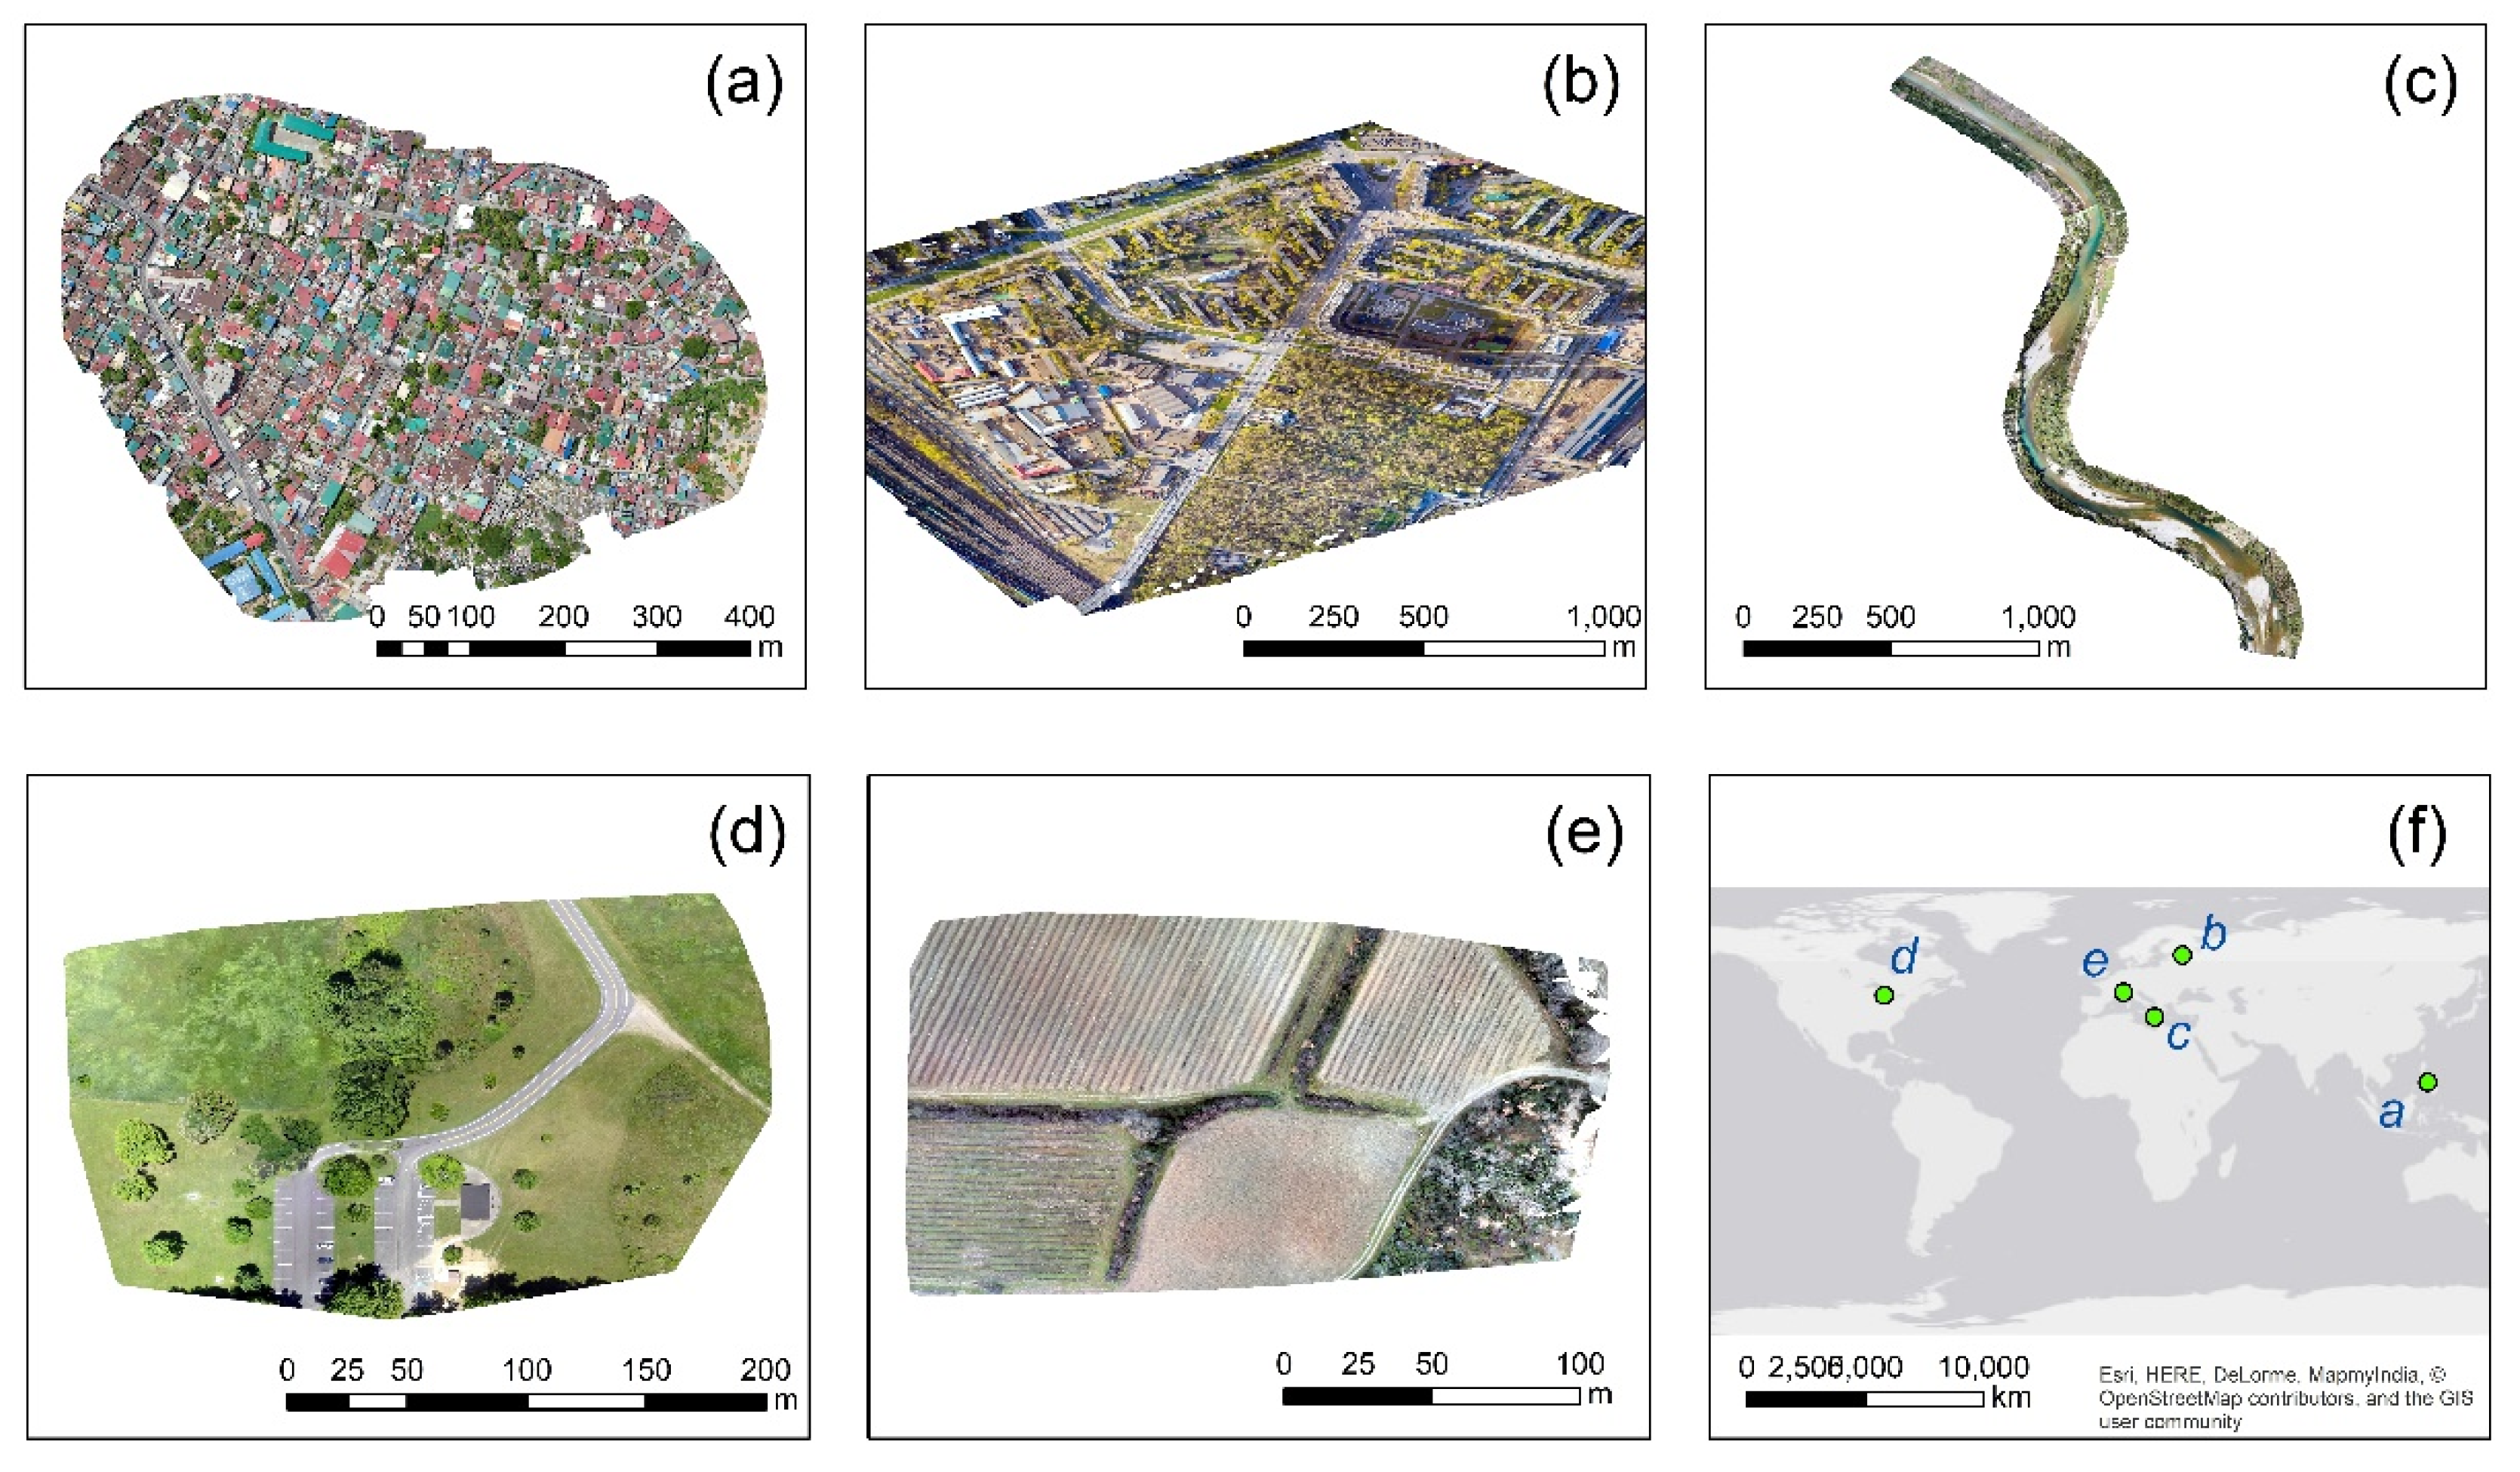
Figure 1. Case studies selected through the OpenAerialMap [19]. (a) a highly urbanized area, at Taytay, Philippines, (b) a campus at St. Petersburg, Russia, (c) a river near Arta, Greece, (d) a picnic area at Ohio, USA, (e) an agricultural area at Nîmes, France, and (f) the geographical distribution of the selected case studies.
Drones 04 00027 g001
Figure 2. Empirical line method (ELM) schematic diagram.
Drones 04 00027 g002
Figure 3. High reflectance targets selected for case study 1 (a), case study 2 (b), and case study 4 (c). For case studies 3 and 5, no appropriate targets were found, and an image-based normalization was applied.
Drones 04 00027 g003
Figure 4. High reflectance targets selected for case study 1 (a), case study 2 (b), and case study 4 (c). For case studies 3 and 5, no appropriate targets were found, and an image-based normalization was applied.
Drones 04 00027 g004
Figure 5. Vegetation indices results applied in the red–green–blue (RGB) orthophoto of the case study No. 1 (a), normalized green–red difference index (b), green leaf index (c), visible atmospherically resistant index (d), triangular greenness index (e), red–green ratio index (f), red–green–blue vegetation index (g), red–green ratio index (h), modified green–red vegetation index (i), excess green index (j), and color index of vegetation (k). Vegetated areas are highlighted with the light grayscale tone, during non-vegetated areas with darkest tone of gray.
Drones 04 00027 g005
Figure 6. Vegetation indices results applied in the RGB orthophoto of the case study No. 4 (a), normalized green–red difference index (b), green leaf index (c), visible atmospherically resistant index (d), triangular greenness index (e), red–green ratio index (f), red–green–blue vegetation index (g), red–green ratio index (h), modified green–red vegetation index (i), excess green index (j), and color index of vegetation (k). Vegetated areas are highlighted with the light grayscale tone while non-vegetated areas with the darkest tone of grey.
Drones 04 00027 g006
Figure 7. Vegetation indices results applied in the RGB orthophoto of the case study No. 3 (close look) (a), normalized green–red difference index (b), green leaf index (c), visible atmospherically resistant index (d), triangular greenness index (e), red–green ratio index (f), red–green–blue vegetation index (g), red–green ratio index (h), modified green–red vegetation index (i), excess green index (j), and color index of vegetation (k). Vegetated areas are highlighted with the light grayscale tone while non-vegetated areas with the darkest tone of grey.
Drones 04 00027 g007
Figure 8. Case studies selected through the OpenAerialMap. (a) a highly urbanized area, at Taytay, Philippines, (b) a campus at St. Petersburg, Russia, (c) a river near Arta, Greece, (d) a picnic area at Ohio, USA, (e) an agricultural area at Nîmes, France.
Drones 04 00027 g008
Figure 9. Overall distribution of the 100 random points over “vegetated” and “non-vegetated” areas for the five different case studies.
Drones 04 00027 g009
Figure 10. The relative difference of vegetation indices No. 2 to No. 10 in comparison to vegetation index No. 1.
Drones 04 00027 g010
Table 1. Case studies selected through the OpenAerialMap [19].
No.Case StudyLocationUAV Camera SensorNamed ResolutionPreview
1Highly urbanized areaTaytay, PhilippinesDJI Mavic 2 Pro6 cmFigure 1a
2CampusSt. Petersburg, RussiaDJI Mavic 2 Pro5 cmFigure 1b
3River-corridorArta, GreeceDJI FC63105 cmFigure 1c
4Picnic areaOhio, USASONY DSC-WX2206 cmFigure 1d
5Agricultural areaNîmes, FranceParrot Anafi5 cmFigure 1e
Table 2. Vegetation indices used in this study.
No.Vegetation IndexEquationRef.
1NGRDINormalized green red difference indexg − ρR)/(ρg + ρr)[21]
2GLIGreen leaf index(2 * ρg − ρr − ρb)/(2 * ρg + ρr + ρb)[22]
3VARIVisible atmospherically resistant indexg − ρr)/(ρg + ρr − ρb)[23]
4TGITriangular greenness index0.5 * [(λr − λb)(ρr − ρg) − (λr − λg)(ρr − ρb)][24]
5IRGRed–green Ratio indexρr − ρg[25]
6RGBVIRed–green–blue vegetation indexg * ρg) − (ρr * ρb) /(ρg * ρg) + (ρr * ρb)[26]
7RGRIRed–green ratio indexρr / ρg[27]
8MGRVIModified green–red vegetation indexg2 − ρr2)/ (ρg2 + ρr2)[26]
9ExGExcess green index2 * ρg − ρr − ρb[28]
10CIVEColor index of vegetation0.441* ρr − 0.881 * ρg + 0.385 * ρb + 18.787[29]
where ρb is the reflectance at the blue band, ρg is the reflectance at the green band, ρr is the reflectance at the red band, λb is the wavelength of the blue band, and λr is the wavelength of the red band.
Table 3. The normalized difference for “vegetated” and “non-vegetated” areas for all vegetation indices (V1 to V10) mentioned in Table 2 for each case study.
V1V2V3V4V5V6V7V8V9V10
Case study No. 182.299.756.5269.172.794.732.581.094.664.8
Case study No. 278.786.683.883.42.254.51.9115.389.021.2
Case study No. 349.857.842.552.023.250.014.442.328.720.1
Case study No. 480.788.581.6100.072.587.529.378.190.980.4
Case study No. 5107.2144.898.967.497.6163.71.2107.2132.52.9