Technical Note

Temperature Profiling of Waterbodies with a UAV-Integrated Sensor Subsystem

Department of Agricultural Sciences, Clemson University, Clemson, SC 29634, USA
*
Author to whom correspondence should be addressed.
Drones 2020, 4(3), 35; https://doi.org/10.3390/drones4030035
Submission received: 21 June 2020 / Revised: 18 July 2020 / Accepted: 19 July 2020 / Published: 21 July 2020
(This article belongs to the Special Issue Feature Papers of Drones)

Abstract

:
Evaluation of thermal stratification and systematic monitoring of water temperature are required for lake management. Water temperature profiling requires temperature measurements through a water column to assess the level of thermal stratification which impacts oxygen content, microbial growth, and distribution of fish. The objective of this research was to develop and assess the functions of a water temperature profiling system mounted on a multirotor unmanned aerial vehicle (UAV). The buoyancy apparatus mounted on the UAV allowed vertical takeoff and landing on the water surface for in situ measurements. The sensor node that was integrated with the UAV consisted of a microcontroller unit, a temperature sensor, and a pressure sensor. The system measured water temperature and depth from seven pre-selected locations in a lake using autonomous navigation with autopilot control. Measurements at 100 ms intervals were made while the UAV was descending at 2 m/s until it landed on water surface. Water temperature maps of three consecutive depths at each location were created from the measurements. The average surface water temperature at 0.3 m was 22.5 °C, while the average water temperature at 4 m depth was 21.5 °C. The UAV-based profiling system developed successfully performed autonomous water temperature measurements within a lake.

1. Introduction

Evaluation of the physiochemical parameters of lake water is crucial for lake management and water quality monitoring. Water temperature is one of the physiochemical parameters that has a significant impact on water chemistry. Change in water temperature can trigger several phenomena in a waterbody. Some of these phenomena can occur naturally, causing no harm to the aquatic system, while others can cause negative impacts on water quality. Thermal stratification occurs at a depth of 3.6 m in many lakes where layers are formed with different temperatures [1]. These layers are categorized from top to bottom where the warmest layer is on the top and the coolest layer is at the bottom as the epilimnion, the thermocline, and the hypolimnion [2]. A lake can be considered as stratified when the temperature difference between the epilimnion and the hypolimnion is greater than 1 °C [3]. An inverse stratification, where coolest layer forms on the top while the warmer layer rests at the bottom, occurs during winter [4]. This phenomenon can impact many aspects of the lake, such as spatial distribution of fish, microbial growth, and oxygen content [5]. Other than the thermal stratification, water temperature can be the direct indicator of dissolved oxygen (DO), toxic absorption, and salinity [6]. The growth rate of algae and aquatic plants are influenced by change in temperature, where reduced DO due to increased temperature can cause harmful effects to the aquatic life [7]. Other factors such as discharge of industrial wastes, forest harvesting, and agricultural runoff can affect water temperature [8]. Therefore, periodic evaluation of the thermal stratification, as well as systematic monitoring of water temperature, are important for water quality monitoring and lake management.
Water temperature monitoring systems vary depending on the size of the targeted waterbody. The most common water temperature monitoring systems are manual sampling with multi-parameter sensors and buoy-based submersible sensor systems that can provide real time water temperature measurements from water columns [5,9]. The multi-parameter sensors and the buoy-based temperature sensors come with different configurations depending on the desired monitoring depth and sampling conditions [10]. Buoy-based temperature sensors are formed by thermistors that are embedded along a single cable, forming a thermistor chain [11]. The total number of thermistors and the distance between each thermistor vary depending on the depth, width, and other hydrological properties of the lake [12,13]. A buoy-based thermistor chain can make synchronous water temperature measurements at various depths, thus providing information for water column profiling. Multi-parameter sensors are useful for rapid water temperature monitoring from shore; however, they require transport vehicles and extensive labor. Buoy-based thermistors are at a fixed location and the spatial resolution of the measurements depends on the number of thermistors. Buoy-based systems must be installed for a longer period with limited numbers due to cost and maintenance constraints. Because shallow lakes stratify for short periods of time, the installation of buoy-based systems can be impractical and expensive [14]. An easily deployable system that can collect water temperature measurements with high spatial resolution within a short period of time could be applicable in shallow waters.
Unmanned aerial vehicles (UAVs) offer advantages over current multi-parameter sensors and buoy-based systems for water temperature profiling when it comes to lake management and water quality monitoring. UAVs are mobile and easily deployable from nearby location to a waterbody. Recent studies have utilized remote sensing and UAVs for monitoring the surface temperature of waterbodies. Thermal infrared remote sensing has been used for measuring surface water temperature in rivers and lakes for practical applications [15]. UAV-based thermal infrared mapping to assess groundwater discharge into coastal zones has been studied [16]. In addition to remote sensing, temperature sensor-integrated UAVs have been tested for water temperature measurements in lakes [17,18]. These UAV-based systems acquire temperature measurements from an applicable depth while hovering above water surface. Aerial measurements with a UAV while hovering above a water surface increases the battery use, thereby limiting the number of samples that can be taken [19]. UAV systems rely on sensitive navigational sensor technology to fix their position in the air. When it comes to water sampling at a lower altitude, many things can go wrong, resulting in crash landing into the water. The hover altitude of UAV depends on wind speed, sensor calibration, and payload swing motion. These factors prevent the precise depth of the water temperature measurements [20]. Therefore, more reliable UAV-based water temperature measurement approach is required to provide water column temperature data.
Our previous studies introduced the development, application, and evaluation of UAVs for water quality monitoring. First, a water sampling UAV for aerial water sample collection was designed and evaluated [21]. Second, an in situ water quality measurement UAV was designed and utilized for autonomous water quality measurements within an agricultural pond [19]. Third, the water collection apparatus and the sensor node were combined in the same UAV with a relatively larger payload capacity [22]. Fourth, the combined UAV was re-designed for adaptive water sampling where the decision for water collection was made based on in situ water quality measurements with the onboard sensor node.
The objective of this research was to develop and test a water temperature measurement system UAV for lake temperature profiling and monitoring. The in situ water quality measurement UAV reported in Koparan et al. [19] was re-modeled by replacing the sensor node with a depth and temperature sensors and the buoyancy apparatus on the UAV was modified for safer water-landing. The novelty of the system presented here is that the UAV starts measuring the temperature and depth when the temperature and pressure probes are in the water while descending. Another key feature of the system is that the UAV can land on the water surface and take off from the water surface rather than hovering during measurements.

2. Materials and Methods

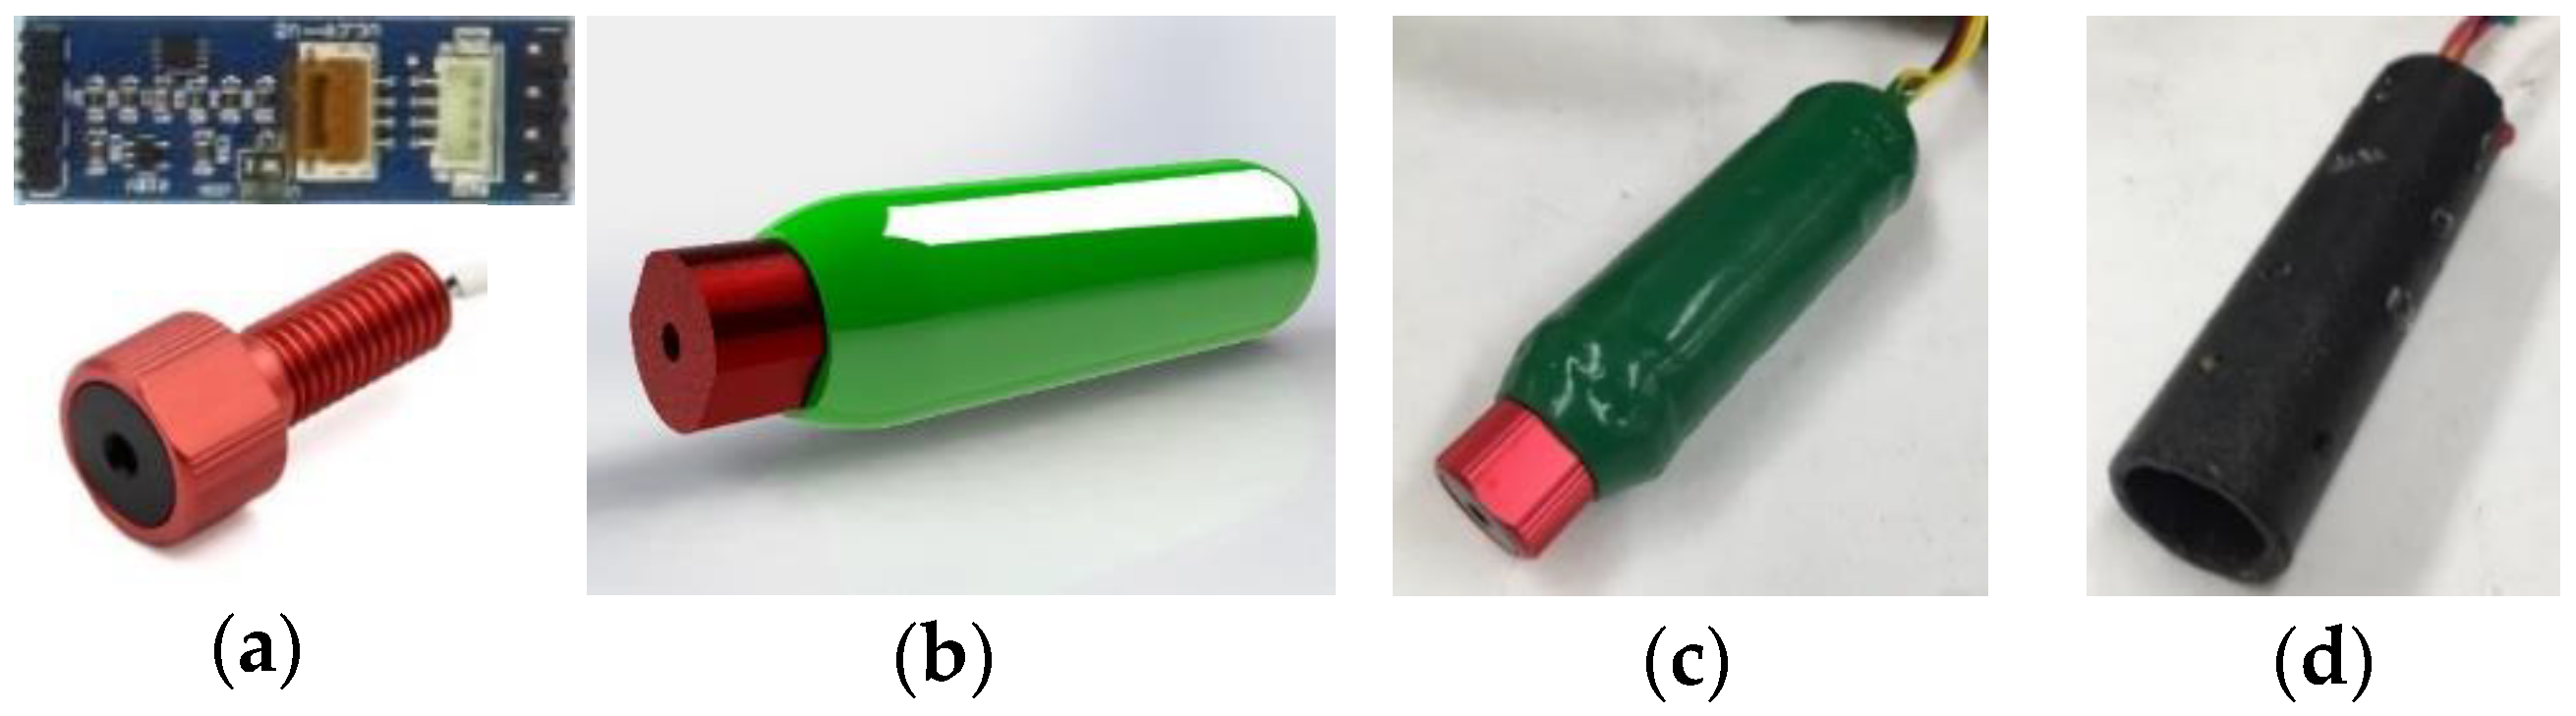
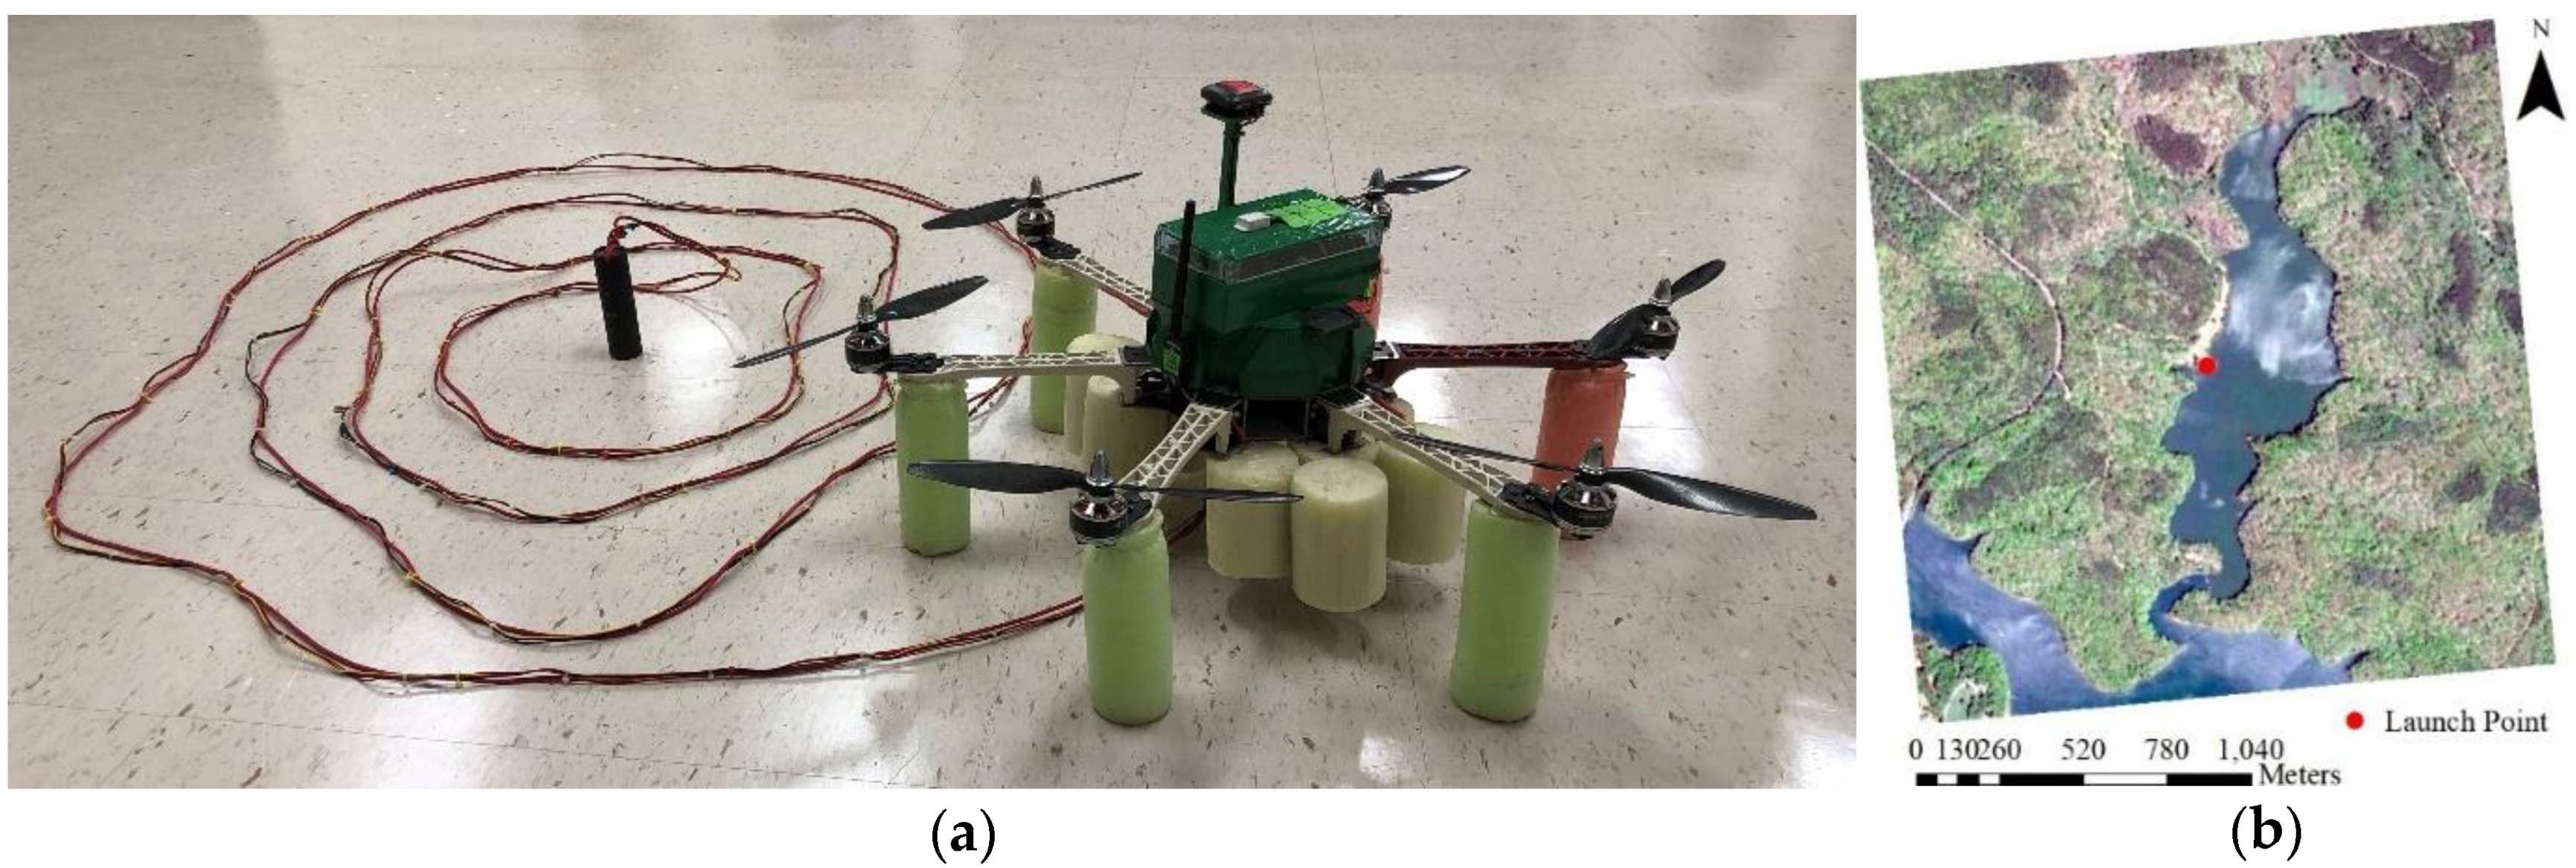
2.1. UAV and Sensor Node Components

The system developed for water temperature profiling consisted of a hexacopter UAV and a sensor node. The UAV was custom designed and the technical specifications were provided in a previous publication [19]. The gross weight of the aircraft was 3100 g (UAV and payload). The weight of the UAV was 2300 g and the payload (sensor node) was 800 g including a second battery, microcontroller unit with protective case, temperature and pressure probes, extension cord (10 m), and protective steel case for the probes. The second battery was a Li-Po battery (7.4 V, 2.200 mAh, Venom, Rathdrum, ID, USA). The voltage to the microcontroller was regulated using a second battery with a battery eliminator circuit (BEC). A separate battery for the sensor node allowed dismounting the unit for standalone measurements without using the UAV.
The pressure and temperature sensors were embedded as a single unit by the manufacturer (Bar02, Blue Robotics, Torrance, CA, USA). An integration of this single unit with a microcontroller unit (Arduino Mega 2560, Ivrea, Italy) was made for calibration, control, and data recording. The pressure measurements were used to determine the depth at which temperature measurements were made. The measurements were recorded in a secure digital card (SD card) (SunFounder, Shenzhen City, Guangdong Province, China) that was inserted with the microcontroller unit. A voltage converter circuit (I2C Level Converter, Blue Robotics, Torrance, CA, USA) was used with the pressure sensor to regulate voltage and to enable communication with the microcontroller unit. The pressure sensor and voltage converter circuit were waterproofed in a custom designed 3D printed case and sealed with epoxy. (Figure 1). The 3D printed case was placed in a steel tube to ensure that the pressure sensor would submerge rapidly in the water. The steel tube was coated with Flex Seal (Flex Seal, Weston, FL, USA) to prevent corrosion. The microcontroller platform was sealed in a box and mounted on the UAV. The pressure sensor was suspended with a 10 m long tether.

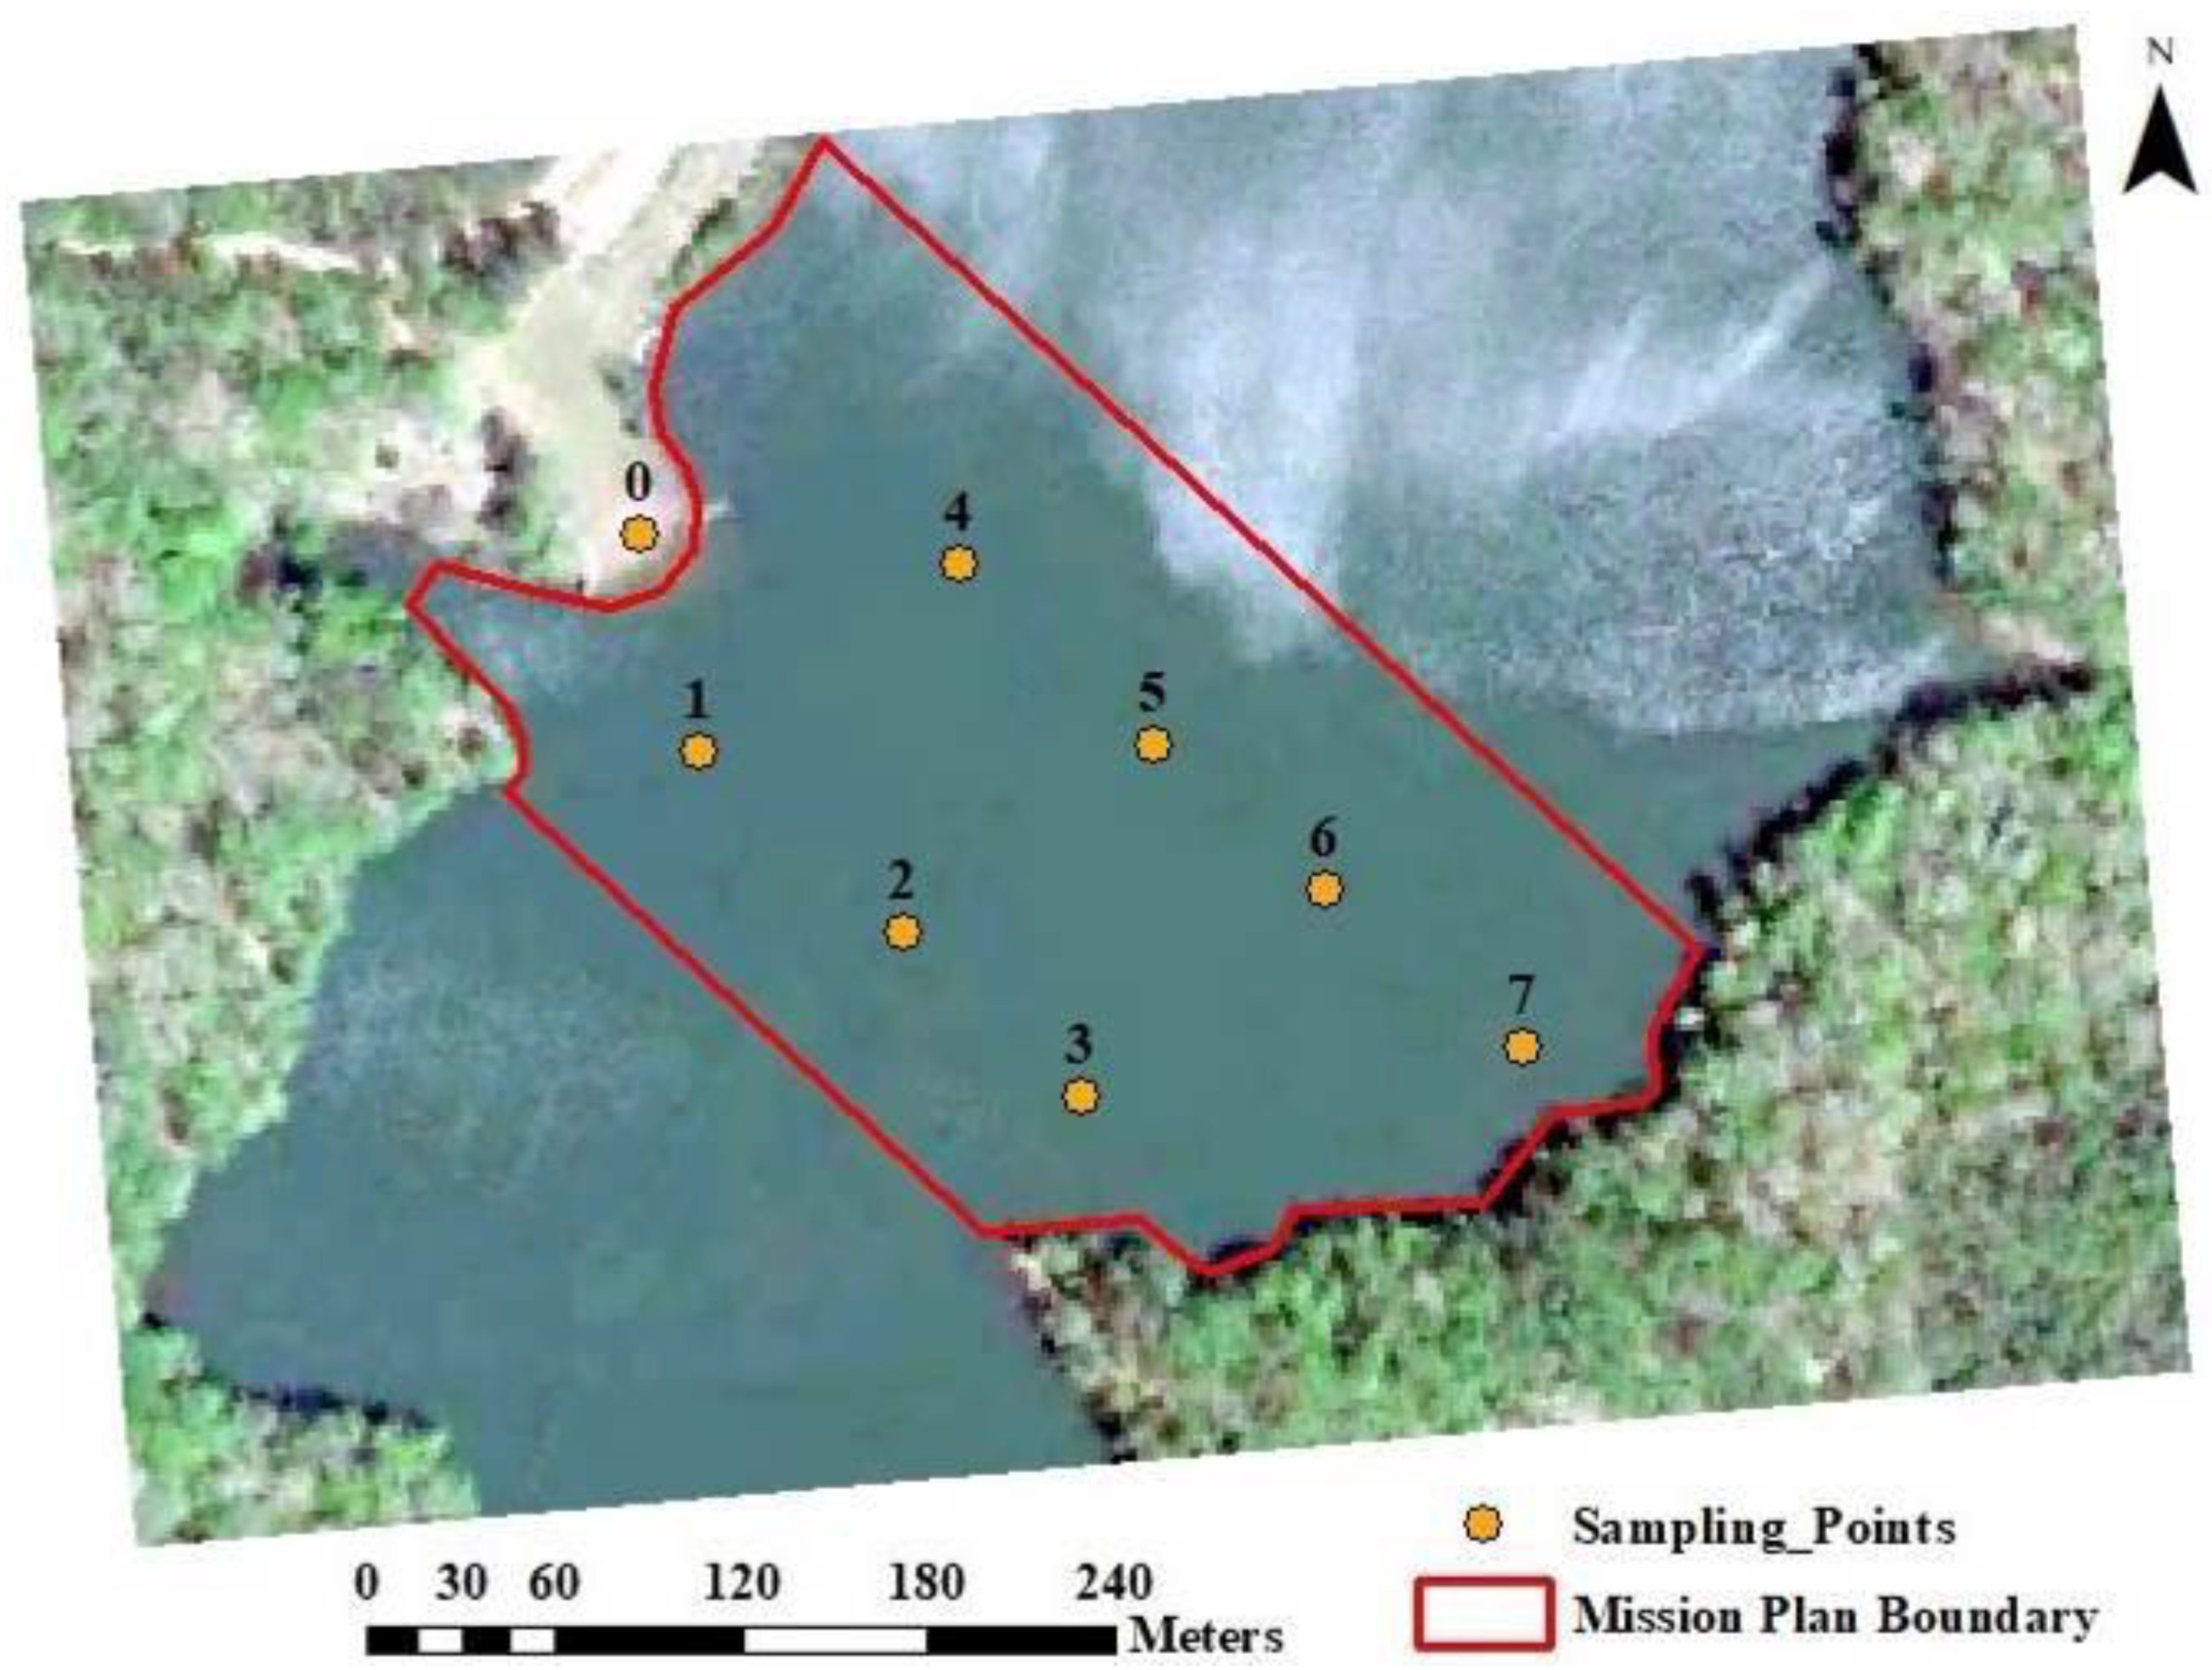
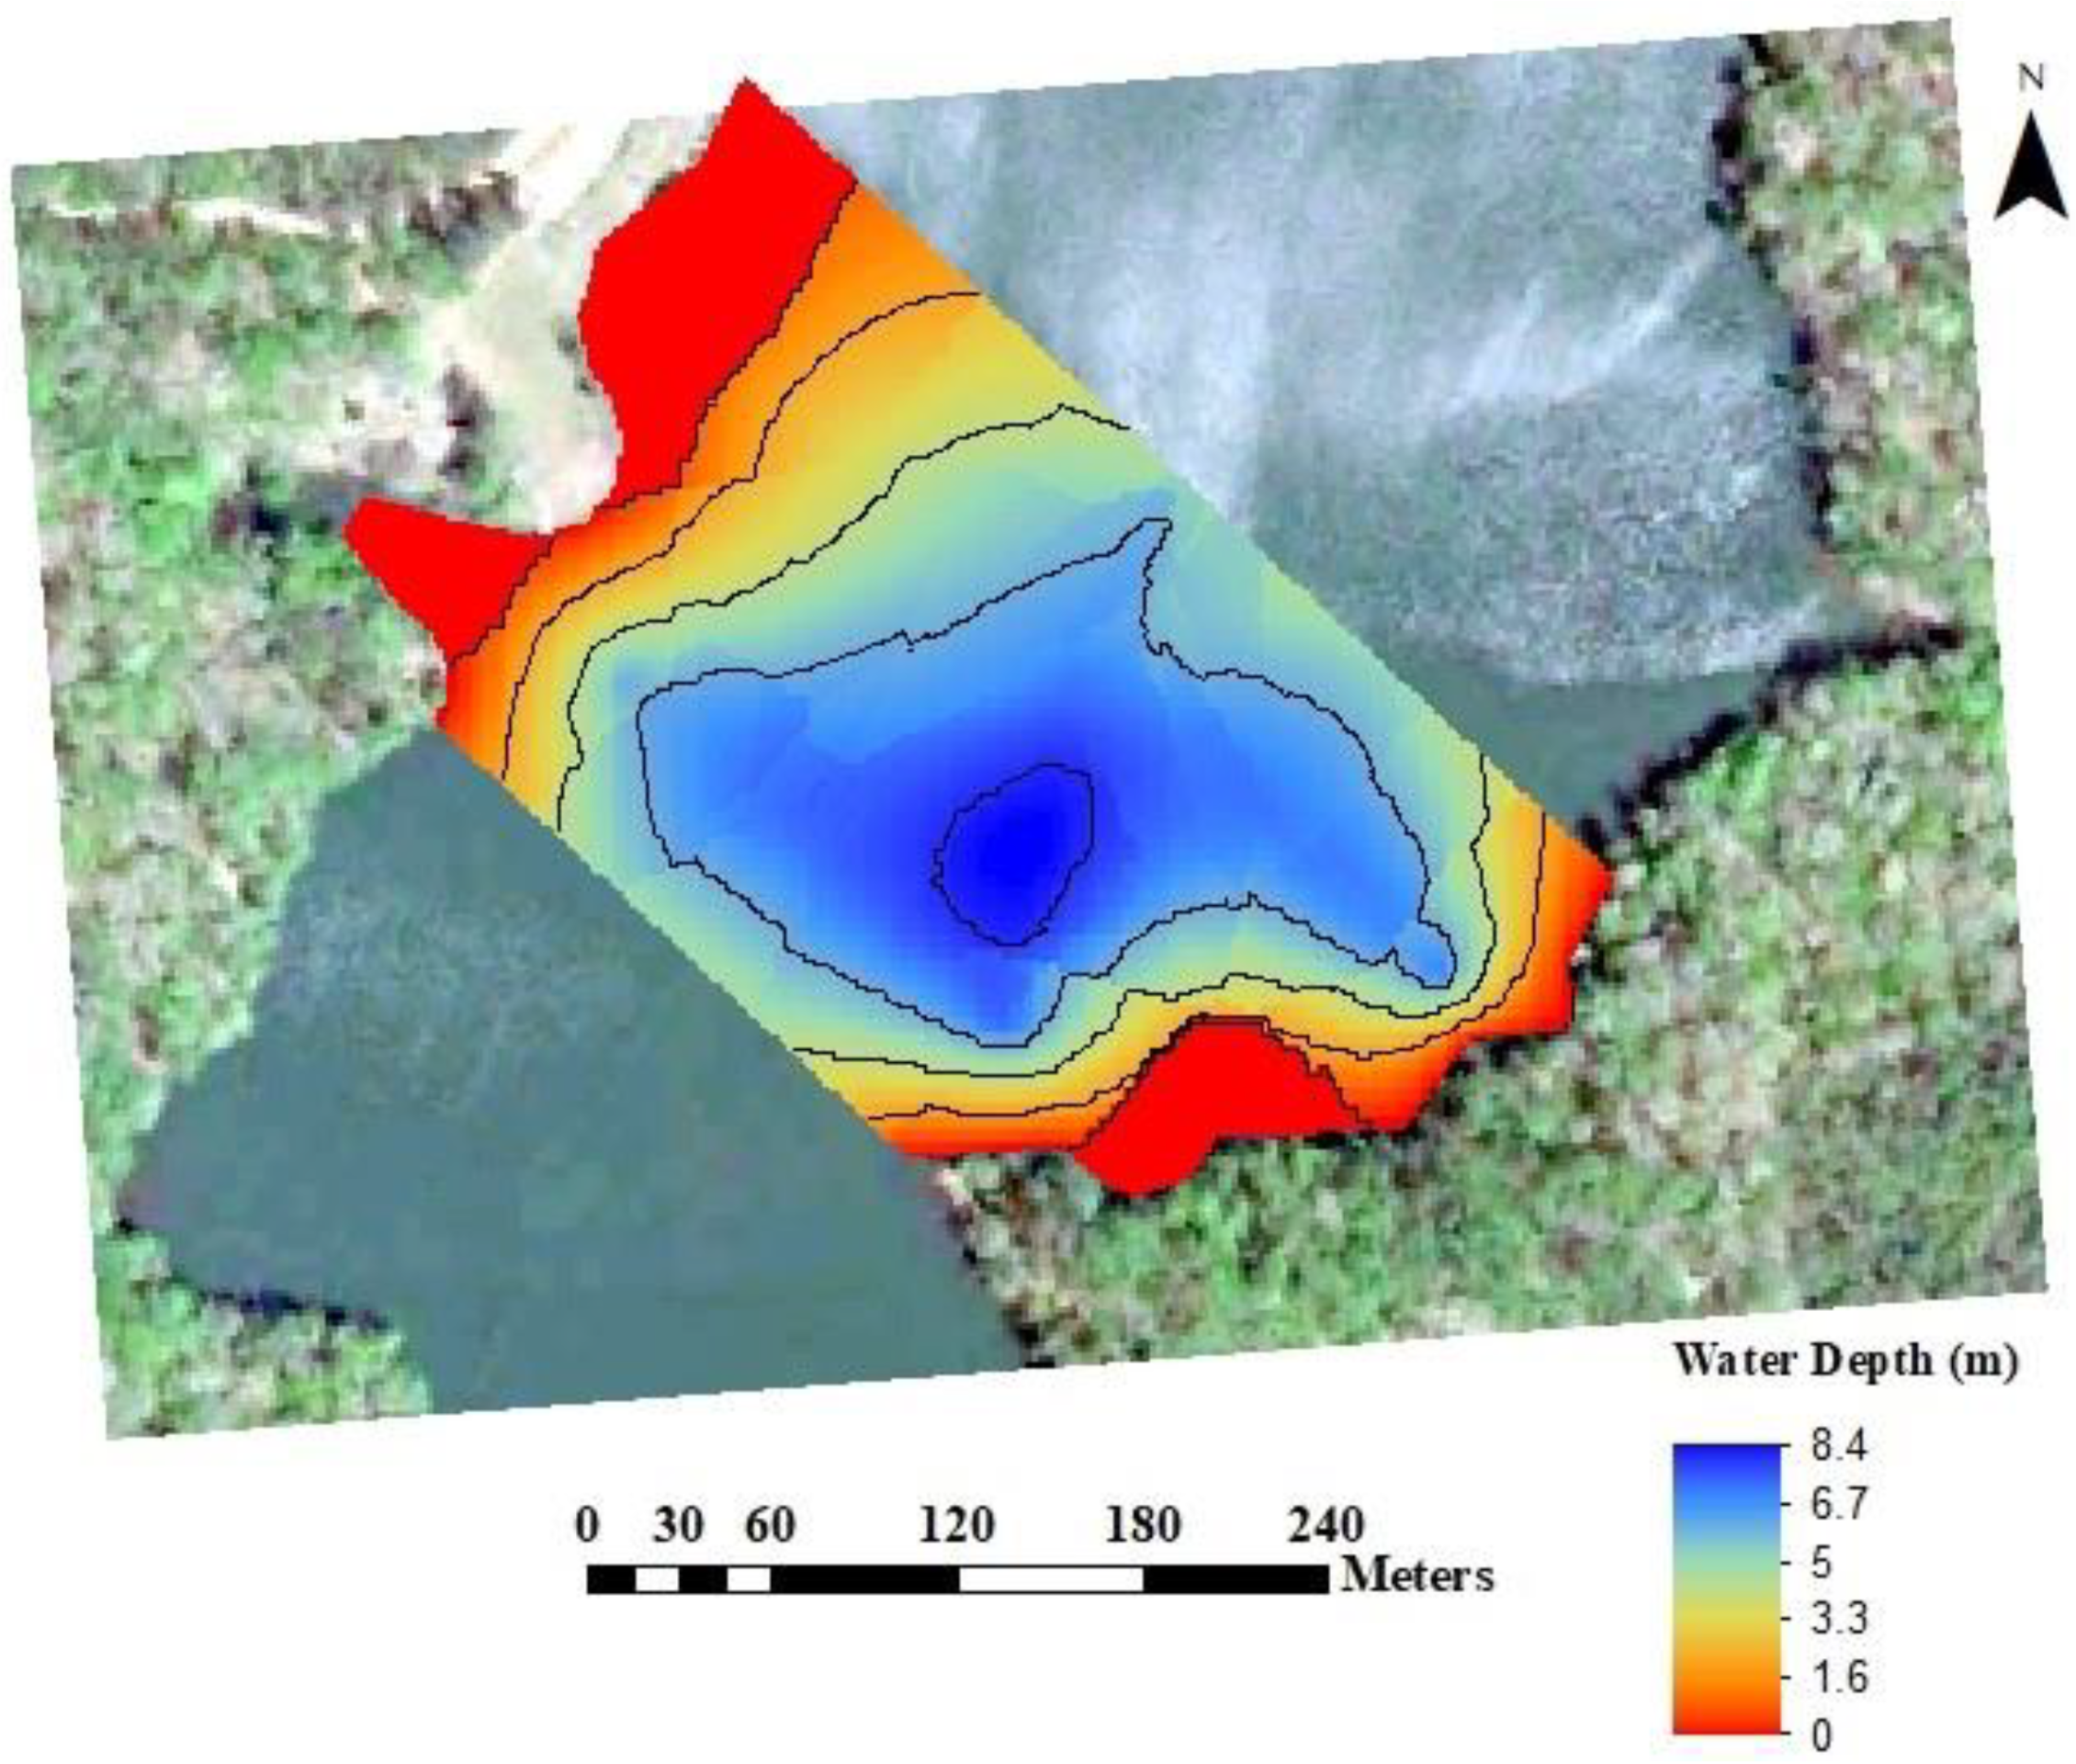
2.2. Experiment Site and Sampling Locations

The UAV-based water temperature profiling system was evaluated and tested in Lake Issaqueena (Pickens County, South Carolina). The length of the lake is 13 km, with an approximate surface area of 36 ha. The width of the lake at the largest section is 400 m. The top of the dam at Lake Issaqueena is about 15.7 m above bedrock. The water temperature averages 21.9 °C in summer, and 4 °C in winter [23]. In 2005, The South Carolina Department of Health and Environmental Control (SCDHEC) reported that water quality parameters meet the standards at this lake [24]. This lake was chosen for the experiments because the results could be used to generate new data sets for water quality monitoring. Lake Issaqueena has no boat access from neighboring Keowee River, thereby providing safe UAV flight conditions for the experiments. Figure 2 shows the UAV integrated sensor node and launch locations at the lake.
Due to the flight restrictions imposed by Federal Aviation Administration (FAA) and limited battery power, the water temperature profiling experiments were conducted in a smaller portion of the lake. The FAA mandates UAV flights to be within the line of sight at a maximum altitude of 120 m above ground level [25]. Because of these limitations, the sampling locations were selected in areas where the UAV can access with the limited battery power while staying within line of sight. The UAV launch location was marked as zero and the water sampling locations were marked with numbers one to seven in the map in Figure 3. The UAV launch location was free of trees and provided flat ground for safe takeoff and landing. Water sampling locations were assigned in grid sampling fashion while scattered to provide water temperature measurements to represent the entire area within the mission plan boundary. The distance between the sampling locations were 80 m to 90 m apart from each other. The shortest flight distance was 73 m, from launch location to sampling location one, and the longest flight distance was 290 m, from launch location to sampling location seven.

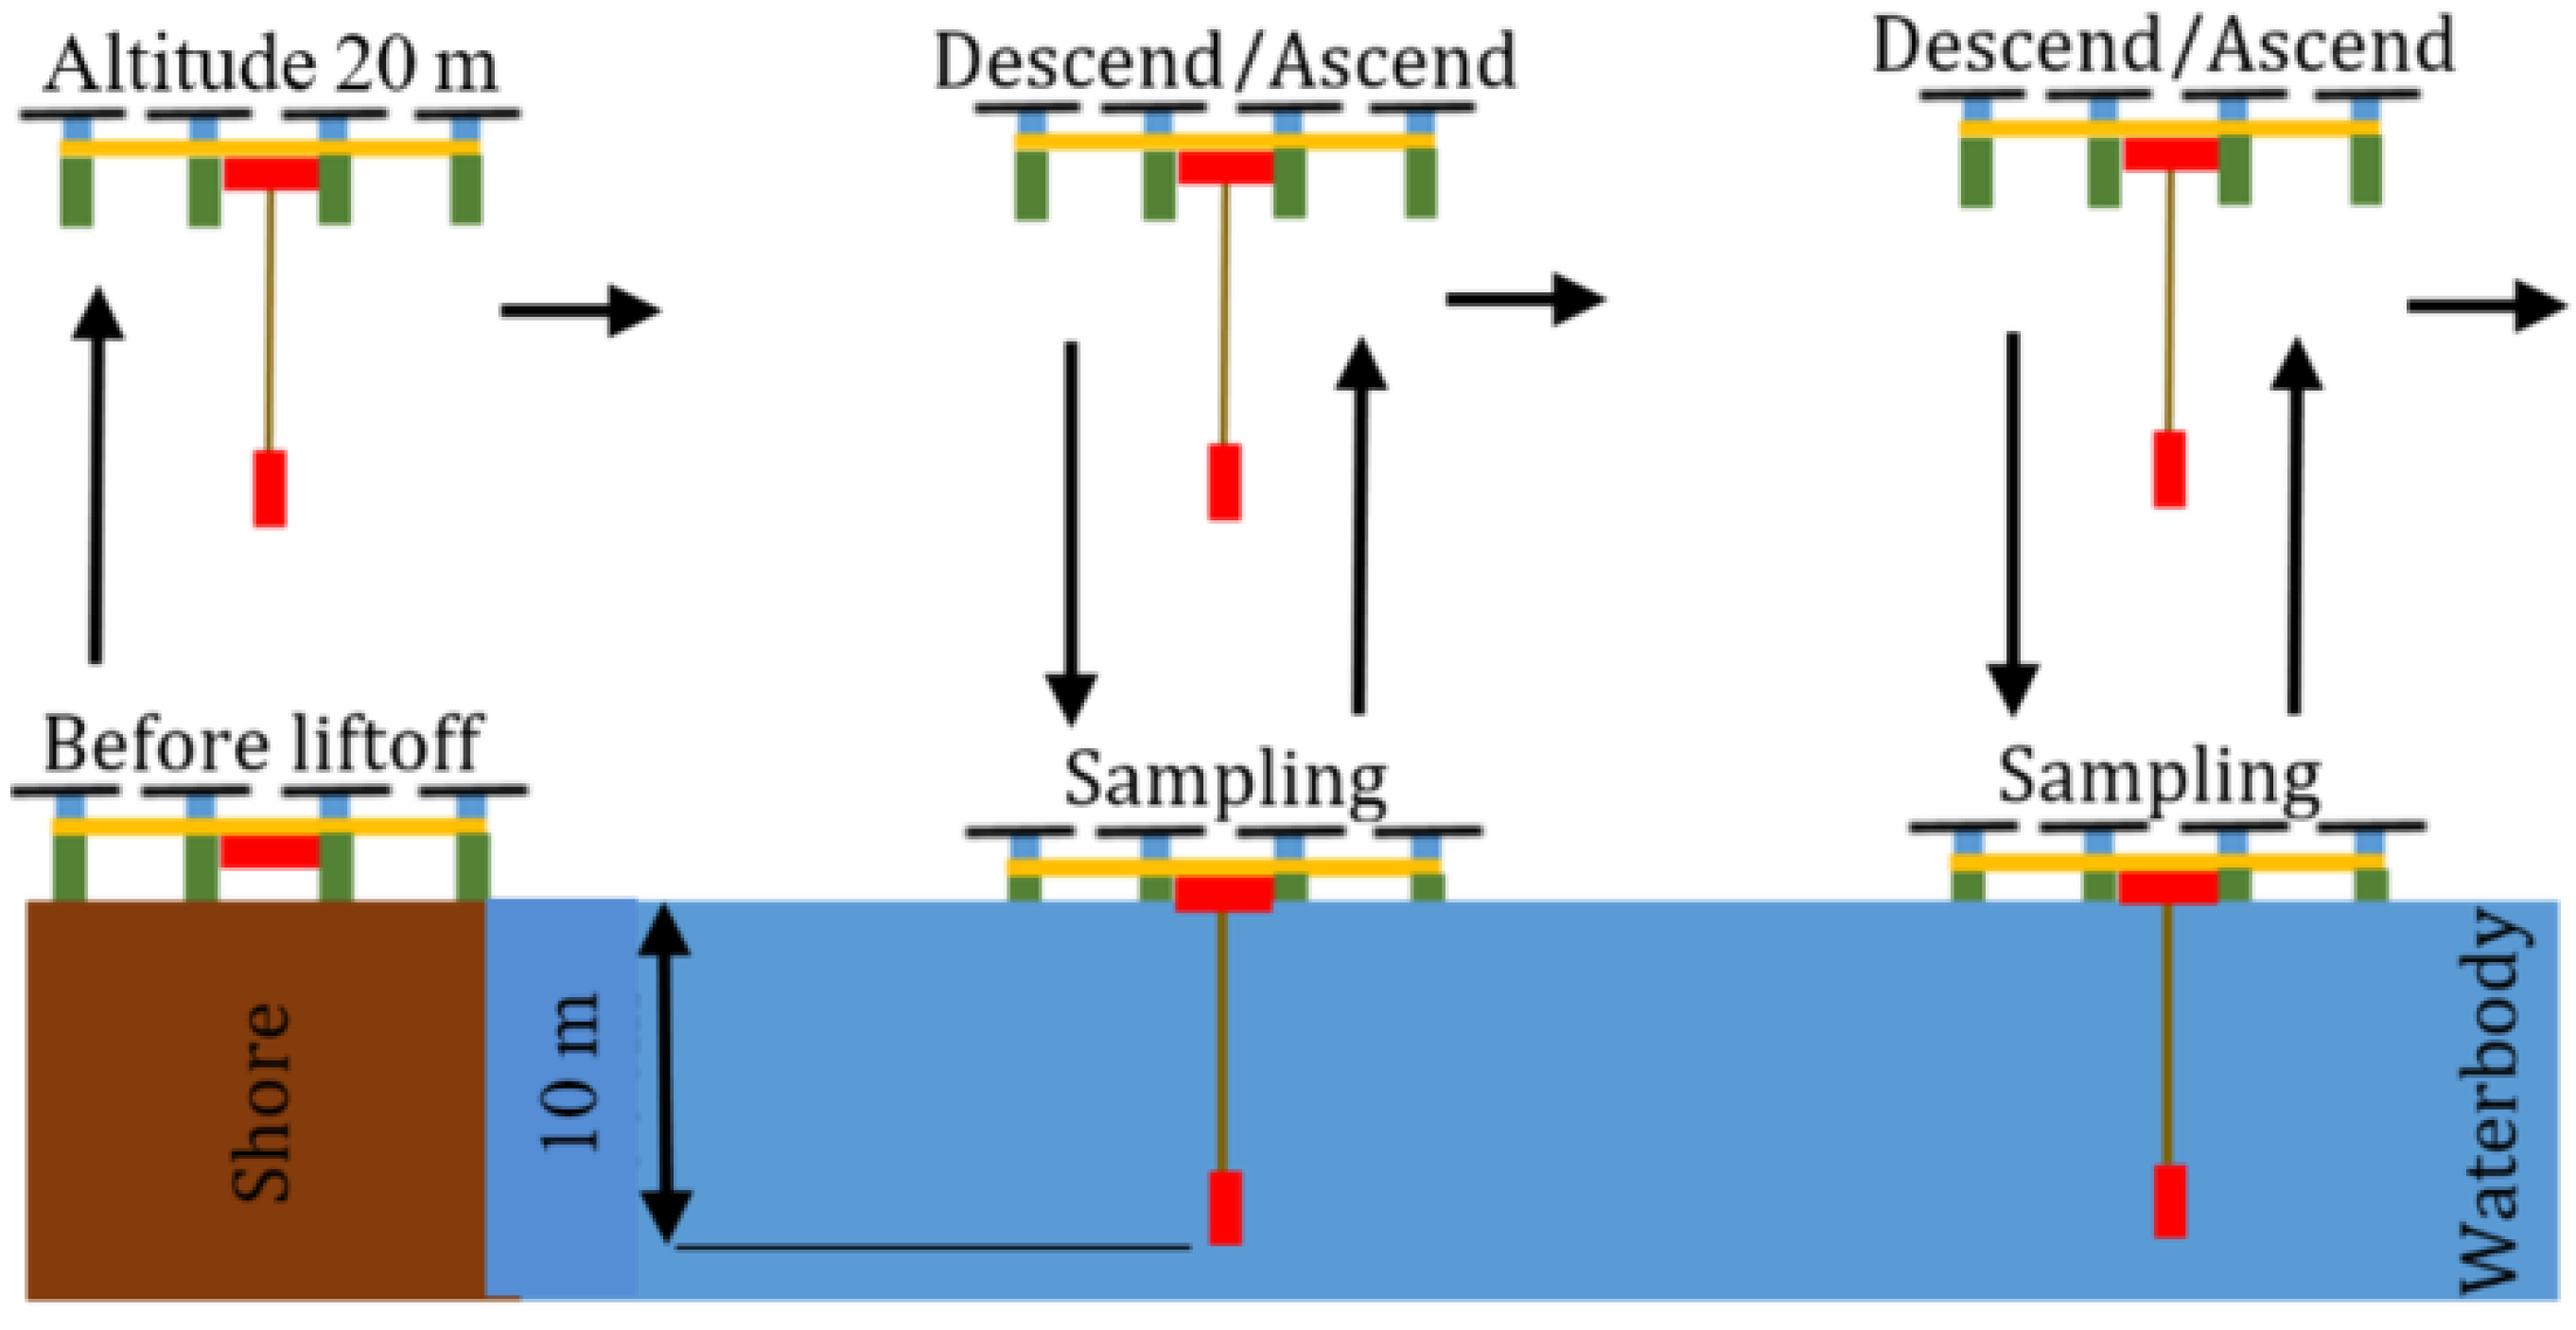
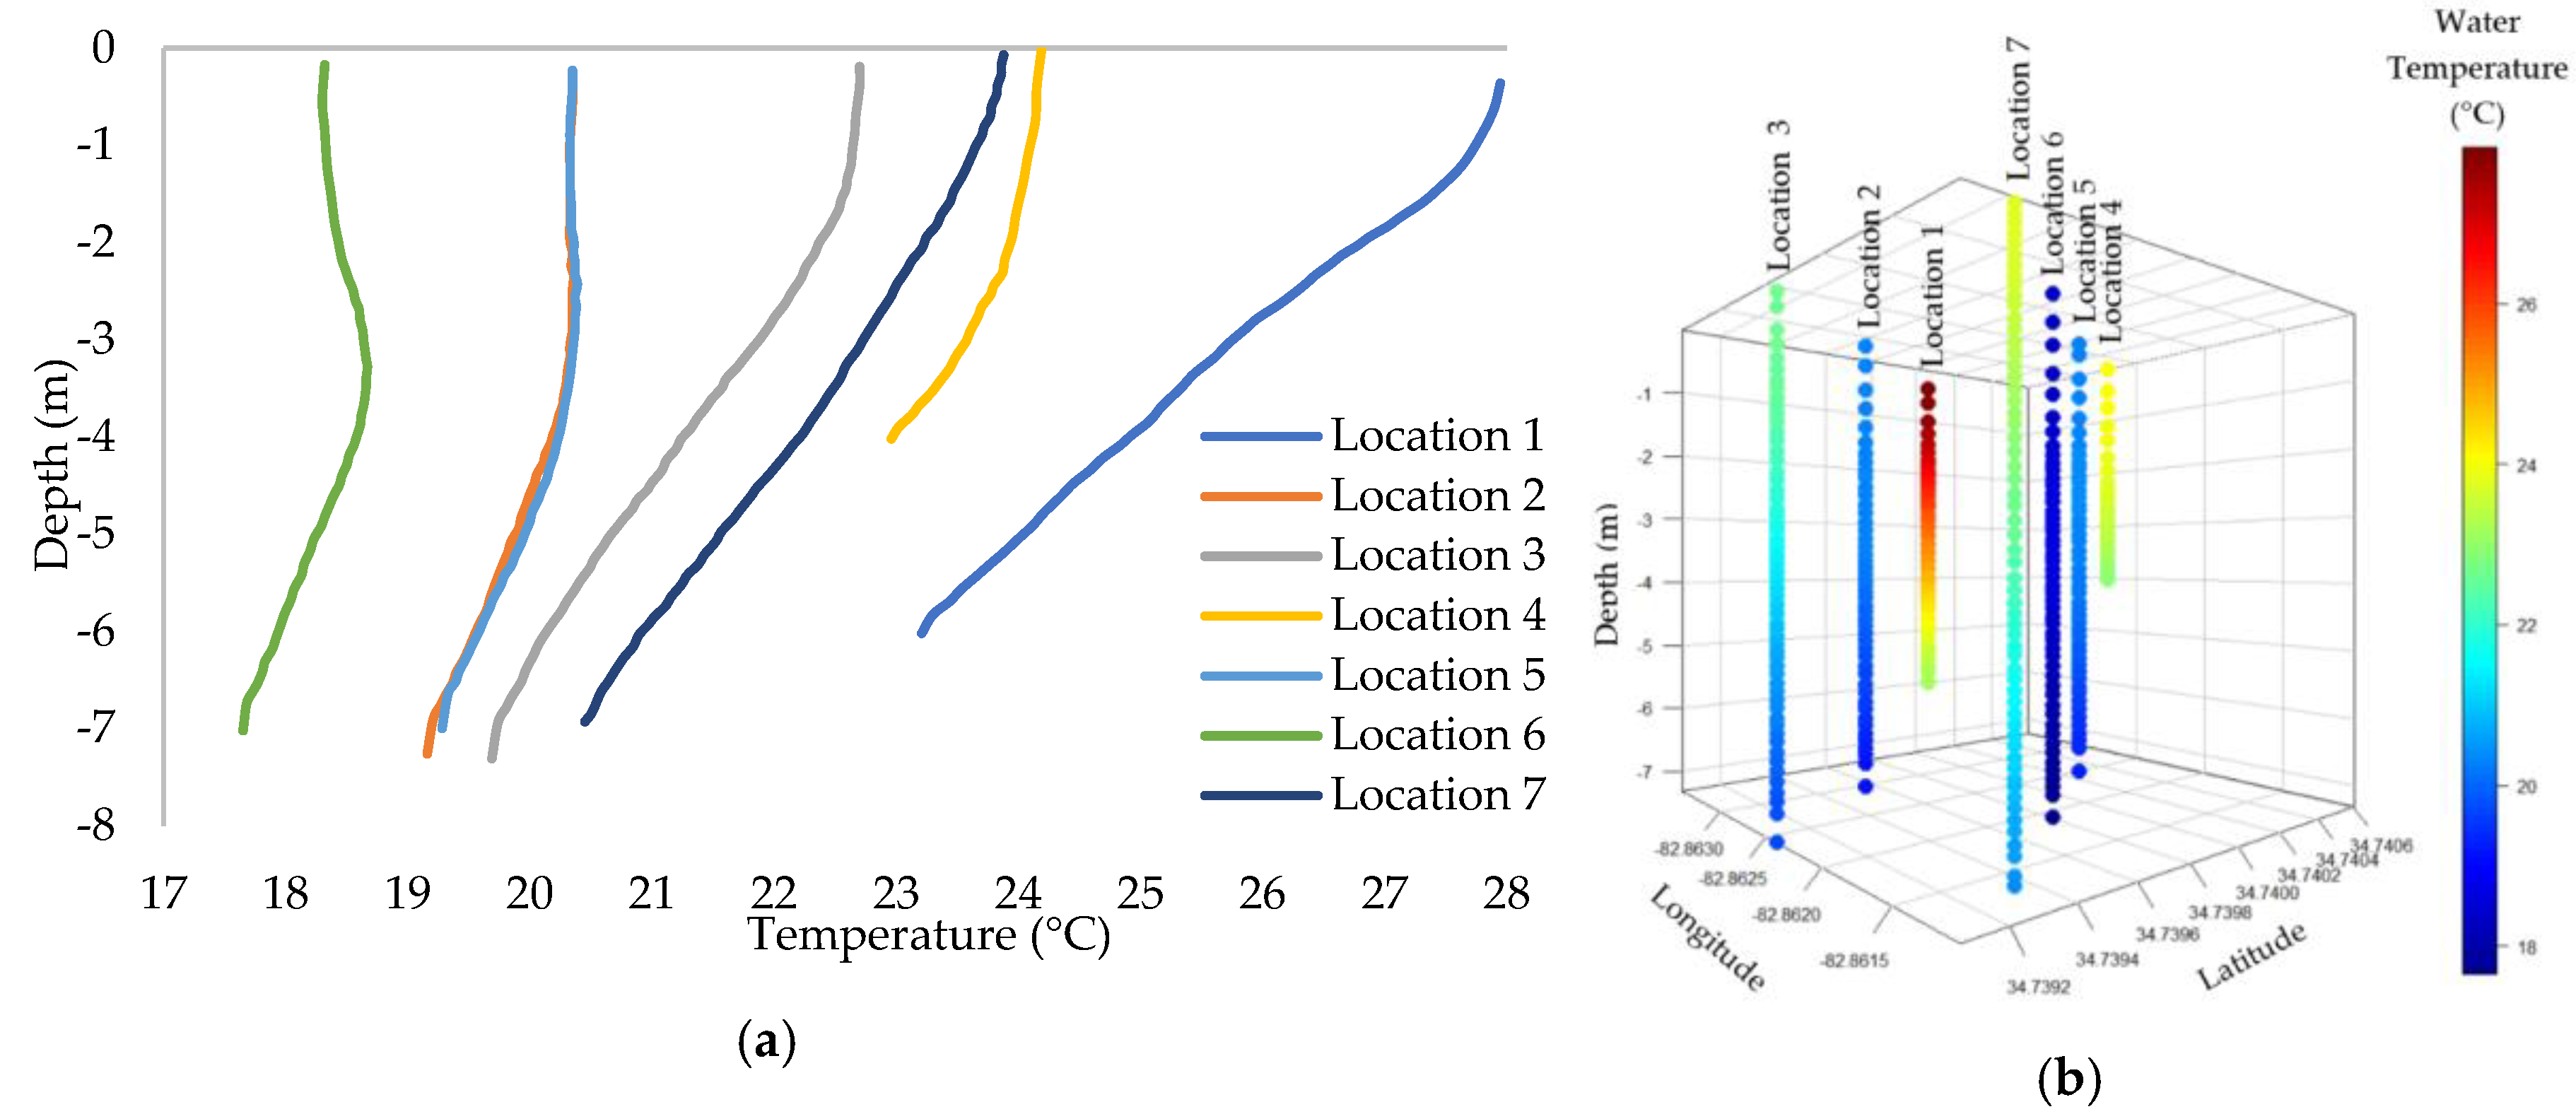
2.3. Water Temperature Profiling Data Collection

The experiments for water temperature profiling were conducted on 25 April 2019 at 3:00 p.m. The average air temperature from 20 m altitude to water surface was 24 °C within the mission plan boundary. The air temperature measurements were obtained from the UAV’s internal temperature sensor. The UAV with integrated sensor node was deployed to each of the sampling points with autopilot-controlled autonomous flights. The navigation altitude was set as 20 m to provide safe flight during travel as the probe was mounted on a 10 m long tether. After the navigation destination was been reached, the autopilot let the UAV slowly descend and land on the water surface for 5 s. The temperature and water depth measurements were made during the descent until landing. After completing measurements, the UAV took off and continued with the mission plan to measure water temperature and depth at the next sampling location (Figure 4). The autonomous flights were programmed with a ground control station using the open source Mission Planner (MP) software and each individual flight was assigned as a mission plan [26]. The limited battery power and long flight distances made it necessary to divide the selected area into individual mission plans. Locations one and two were included in the first mission plan, location three was included in the second, locations four and five were included in the third, location six was included in the fourth, and location seven was included in the fifth mission plan.
The water depth and temperature measurements were initiated by the autopilot when the UAV arrived at the predefined sampling location at 20 m altitude. Water depth and temperature measurements were recorded at 100 ms intervals while the UAV was descending at a rate of 2 m/s for landing. A flare altitude of 10 m was assigned in the autopilot’s configurations for safe, smooth, and steady landing. Flare altitude is the final stage of the auto-landing procedure where autopilot decreases the throttle and slows down the UAV to readjust the descent speed prior to landing [26].
The number of measurements at each location varied depending on the water depth. The depth measurements indicated the depth of the probe during descent; therefore, repeated measurements were expected once the probe had reached the bottom of the water column. Measurements that repeated themselves after a certain depth were assigned as the maximum water depth at that sampling location. The collected water depth and temperature data were used to create a bathymetric map and water temperature maps for visualization of water temperature distribution at the surface (0.3 m) and at the depths of 2 m and 4 m. The Inverse Distance Weighted Interpolation (IDW) method was used for processing and interpolating in ArcMap (ESRI, Redlands, CA, USA). Raster maps were developed by interpolating vector data in the Geographic Information System (GIS) to illustrate data values for intermediate locations [27]. The relationship between water depth, water temperature, and location was evaluated. The water temperature distribution was illustrated in R software (R-GUI, Vienna, Austria) driven 3D scatter plot [28].

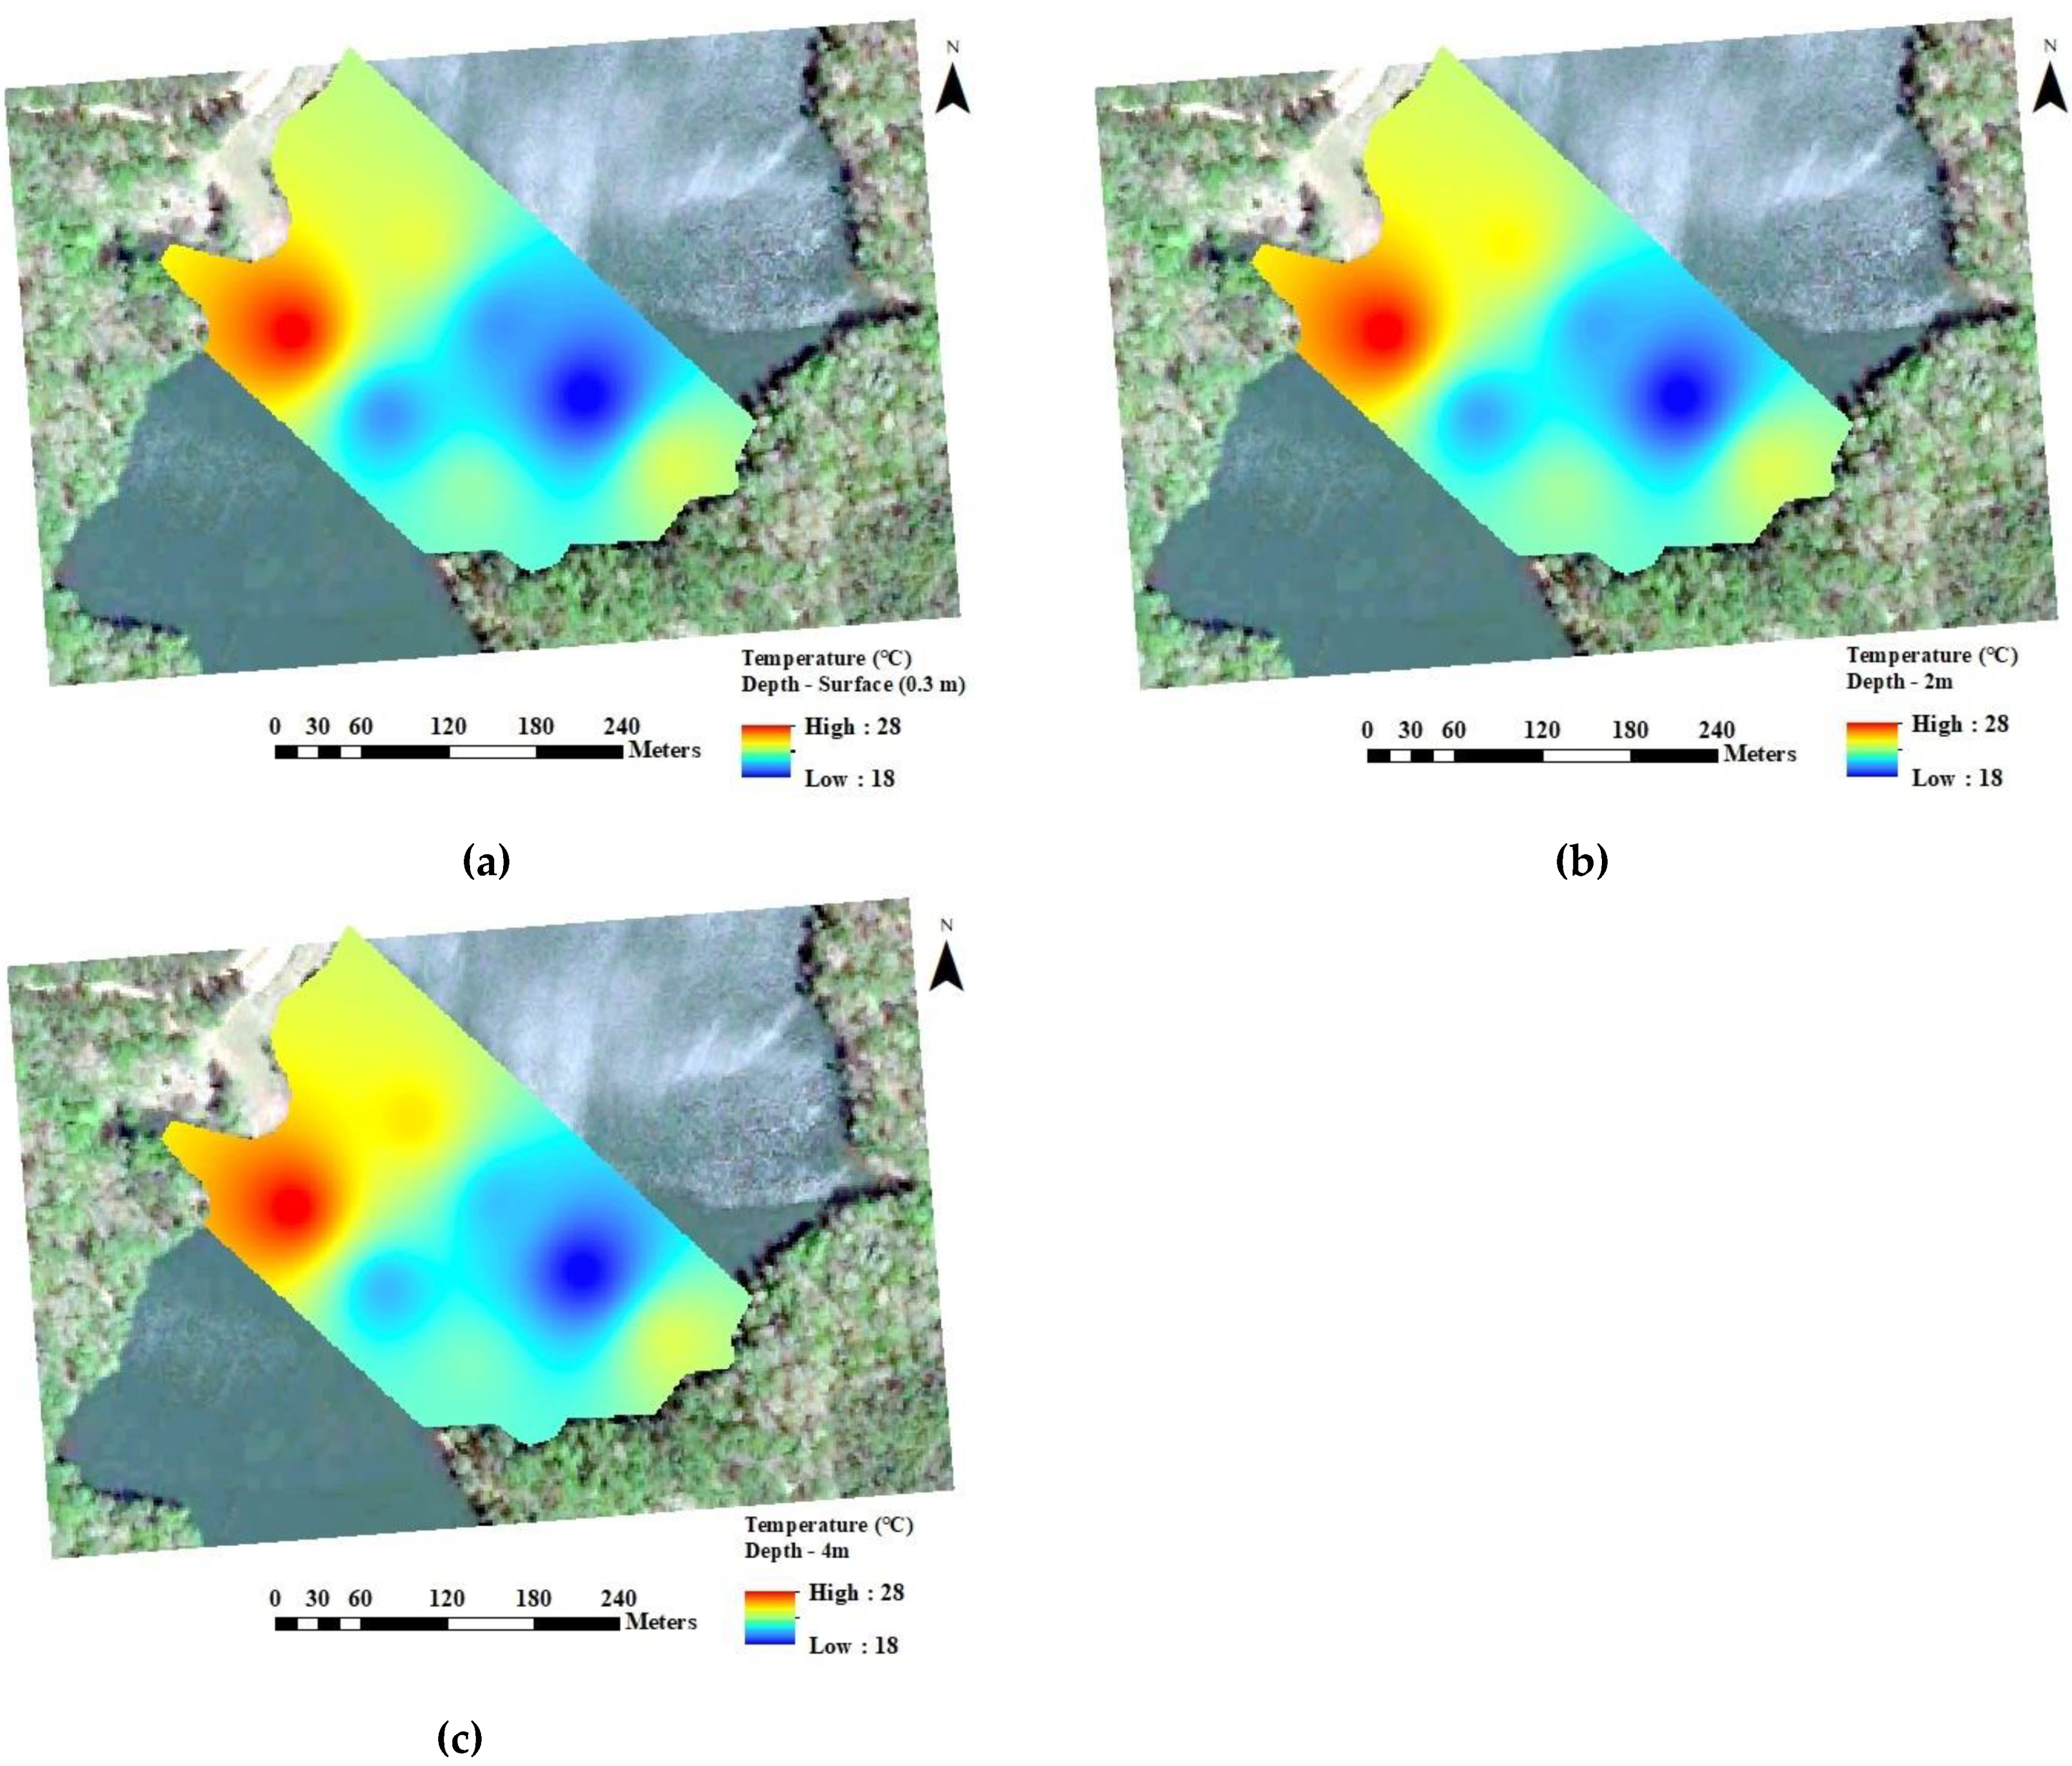
3. Results and Discussion

The indoor depth measurements with the sensor node were 100% accurate when compared to the reference depth values within a water column. The 3D printed watertight case protected the probe and the circuits from water damage. The indoor experiments showed that the probe was submersible in water and provided reliable water depth and temperature measurements. Table 1 shows the summary statistics of indoor tests to evaluate whether the 3D printed case affected the sensor depth measurements. The difference between the actual sensor depth values and measured sensor depth values was not significant using 0.05 level of significance (t (18) = 2.03, p = 0.57). The difference between the two depth measurements show less than a 1 percent error. The accuracy of water temperature measurements from the sensor was not investigated, because temperature measurements are reported to be within 2 °C in the manufacturer’s specifications. Visual observations were made for confirming the sensor temperature measurements.
The steel tube-enclosed sensor probe descended rapidly into the bottom of the lake as was expected. The rapid descent of the pressure sensor reduced the time that the UAV had to stay at the water surface and increased the speed of data collection. Reduction of floating time on the water surface minimized battery use because the UAV’s idle mode duration was reduced. The idle mode of the flight controller kept the propellers spinning at the slowest rate to ensure that UAV could take off immediately when requested to either by the mission plan or the ground control station. The water depth evaluations estimated the maximum water depth as 8.4 m within the experiment boundary near the center (Figure 5). The water depth was 7.3 m at sampling location three, as it was the deepest sampling point, while the water depth was 4 m at sampling location four.
Water temperature varied at each location across the mission plan boundary and water depth. The temperature profiling experiments showed that water temperature was highest at location one, both at the water surface and at the bottom (Figure 6). The water temperature was 28 °C at the surface and 23 °C at the bottom in location one, with the highest temperature variation. The water temperature was 18.3 °C at the surface and 17.6 °C at the bottom in location six. Water temperature at locations two and five followed the same trend, with the water temperature at the surface being 20 °C and the water temperature at the bottom being 19 °C. The trend in water temperature was the same in these two locations, because they were both located at the center in the downstream direction from northeast to southwest. A similar trend was observed at locations three and seven with a 1 °C difference in water temperature. The water temperature measurements from water columns indicate a sudden temperature change at locations two, five, and six at the depths of 3.67 m, 3.93 m, and 3.67 m, respectively. A rapid and steady water cooling was observed at these depths and the cooling continued until the bottom of the lake was reached at each location. The water temperature was steady until the depth of 1.4 m at location three. A sudden temperature drop was observed after this depth, indicating the cooling depth at the location three was less than at locations two, five, and six. Thermal stratification occurs at a depth of 3.6 m in many lakes and the temperature difference between the epilimnion and the hypolimnion must be at least greater than 1 °C [1,3]. While there was a temperature drop of more than 1 °C at an average depth of 3.8 m, it was not clear that if a thermal stratification occurred according to these measurements.
Sampling location one was closest to a stream that was located at the west corner of the experiment boundary. Increase in the water temperature might have been due to runoff after a rain event that occurred before field experiments. Change in water temperature by intermediate locations and sampling depths is illustrated in the water temperature maps in Figure 7. The maps represent the water temperature at the surface (0.3 m) and at depths of 2 m and 4 m, respectively. The average surface water temperature was recorded as 22.5 °C, while the average water temperature at the 4 m depth was 21.5 °C. The water temperature remained at around 18 °C at all depths at sampling location six. The largest water temperature drop was recorded as 3 °C at sampling location one. The difference in water temperature between sampling locations one and six was the highest at the surface, at 10 °C, and the lowest at the sampling depth of 4 m, at 6 °C.

4. Conclusions

The UAV-based water temperature profiling system described here provides a different perspective to water quality monitoring practices. Its ability to remotely access waterbodies and the ease of deployment provided better and faster data collection when compared to other water quality monitoring methods. The UAV-based water temperature profiling system successfully navigated to pre-defined water sampling locations and executed mission plans for water temperature and depth measurements. The 3D printed pressure sensor case successfully prevented water leak and kept the sensors’ components safe while allowing it to descend quickly throughout the water column. The maximum depth of water was 8.4 m within the selected boundary in Lake Issaqueena. A rapid water temperature drop at sampling location one was due to the stream entry into the waterbody. A rapid water temperature drop of greater than 1 °C at an average depth of 3.8 m at locations two, five, and six was observed. However, a wider data collection experiment that covers the entire lake is necessary to justify whether thermal stratification might have occurred. The length of the extension cable of the probe can be readjusted, depending on the depth of the waterbody under study, while taking the endurance and the thrust performance of the UAV and the maximum operational depth of the sensor node into consideration. Water temperature profiling with this system could be achieved within a relatively short time span, providing great advantages over other methods such as traditional sampling by boat. The UAV-assisted temperature profiling option could also reduce the costs by minimizing the required time on a site while providing coverage of a larger area with ease. Considering the maintenance time, cost, and lack of spatial resolution of fixed sensor stations, the UAV-assisted temperature profiling system here described provides unique advantages, including advanced mobility, high spatial resolution, low cost, and fast response to disasters and other natural events.

Author Contributions

Conceptualization, C.K. and A.B.K.; Methodology, C.K., A.B.K., C.P. and C.S.; Software, C.K.; Validation, C.K., A.B.K., and C.S.; Formal Analysis, C.K.; Resources, A.B.K. and C.P.; Data Curation, C.K.; Writing—Original Draft Preparation, C.K.; Writing—Review and Editing, A.B.K., C.S. and C.P.; Visualization, C.K.; Supervision, A.B.K.; Project Administration, A.B.K.; Funding Acquisition, A.B.K. All authors have read and agreed to the published version of the manuscript.

Funding

This research received no external funding.

Conflicts of Interest

The Authors declare no conflict of interest.

References

  1. Li, D.; Liu, S. (Eds.) Chapter 8—Water Quality Detection for Lakes. In Water Quality Monitoring and Management; Academic Press: Cambridge, MA, USA, 2019; pp. 221–231. [Google Scholar] [CrossRef]
  2. Boehrer, B.; Schultze, M. Stratification of lakes. Rev. Geophys. 2008, 46. [Google Scholar] [CrossRef] [Green Version]
  3. Foley, B.; Jones, I.A.N.; Maberly, S.; Rippey, B. Long-term changes in oxygen depletion in a small temperate lake: Effects of climate change and eutrophication. Freshw. Biol. 2011, 57, 278–289. [Google Scholar] [CrossRef]
  4. Wang, J.; Huang, L.; Ju, J.; Daut, G.; Ma, Q.; Zhu, L.; Haberzettl, T.; Baade, J.; Mäusbacher, R.; Hamilton, A.; et al. Seasonal stratification of a deep, high-altitude, dimictic lake: Nam Co, Tibetan Plateau. J. Hydrol. 2020, 584, 124668. [Google Scholar] [CrossRef]
  5. Liu, M.; Zhang, Y.; Shi, K.; Zhu, G.; Wu, Z.; Liu, M.; Zhang, Y. Thermal stratification dynamics in a large and deep subtropical reservoir revealed by high-frequency buoy data. Sci. Total Environ. 2019, 651, 614–624. [Google Scholar] [CrossRef]
  6. Kurtuluş, T.; Kurtuluş, B.; Avşar, Ö.; Avşar, U. Evaluating the thermal stratification of Köyceğiz Lake (SW Turkey) using in-situ and remote sensing observations. J. Afr. Earth Sci. 2019, 158, 103559. [Google Scholar] [CrossRef]
  7. Rucinski, D.K.; Beletsky, D.; DePinto, J.V.; Schwab, D.J.; Scavia, D. A simple 1-dimensional, climate based dissolved oxygen model for the central basin of Lake Erie. J. Great Lakes Res. 2010, 36, 465–476. [Google Scholar] [CrossRef]
  8. Yang, K.; Yu, Z.; Luo, Y.; Yang, Y.; Zhao, L.; Zhou, X. Spatial and temporal variations in the relationship between lake water surface temperatures and water quality—A case study of Dianchi Lake. Sci. Total Environ. 2018, 624, 859–871. [Google Scholar] [CrossRef]
  9. Mziray, P.; Kimirei, I.A.; Staehr, P.A.; Lugomela, C.V.; Perry, W.L.; Trolle, D.; O’Reilly, C.M.; Mgana, H.F. Seasonal patterns of thermal stratification and primary production in the northern parts of Lake Tanganyika. J. Great Lakes Res. 2018, 44, 1209–1220. [Google Scholar] [CrossRef]
  10. Kirillin, G.; Shatwell, T. Generalized scaling of seasonal thermal stratification in lakes. Earth-Sci. Rev. 2016, 161, 179–190. [Google Scholar] [CrossRef] [Green Version]
  11. Consi, T.; Anderson, G.; Barske, G.; Bootsma, H.; Hansen, T.; Janssen, J.; Klump, J.; Paddock, R.; Szmania, D.; Waples, J. Measurement of Spring Thermal Stratification in Lake Michigan with the GLUCOS Observing System; IEEE: New York City, NY, USA, 2009; pp. 1–5. [Google Scholar]
  12. Biddanda, B.A.; Weinke, A.D.; Kendall, S.T.; Gereaux, L.C.; Holcomb, T.M.; Snider, M.J.; Dila, D.K.; Long, S.A.; VandenBerg, C.; Knapp, K.; et al. Chronicles of hypoxia: Time-series buoy observations reveal annually recurring seasonal basin-wide hypoxia in Muskegon Lake—A Great Lakes estuary. J. Great Lakes Res. 2018, 44, 219–229. [Google Scholar] [CrossRef]
  13. Woolway, R.I.; Maberly, S.C.; Jones, I.D.; Feuchtmayr, H. A novel method for estimating the onset of thermal stratification in lakes from surface water measurements. Water Resour. Res. 2014, 50, 5131–5140. [Google Scholar] [CrossRef] [Green Version]
  14. Gorham, E.; Boyce, F.M. Influence of Lake Surface Area and Depth Upon Thermal Stratification and the Depth of the Summer Thermocline. J. Great Lakes Res. 1989, 15, 233–245. [Google Scholar] [CrossRef]
  15. Handcock, R.N.; Torgersen, C.E.; Cherkauer, K.A.; Gillespie, A.R.; Tockner, K.; Faux, R.N.; Tan, J. Thermal infrared remote sensing of water temperature in riverine landscapes. Fluv. Remote Sens. Sci. Manag. 2012, 1, 85–113. [Google Scholar]
  16. Lee, E.; Yoon, H.; Hyun, S.P.; Burnett, W.C.; Koh, D.-C.; Ha, K.; Kim, D.-J.; Kim, Y.; Kang, K.-M. Unmanned aerial vehicles (UAVs)-based thermal infrared (TIR) mapping, a novel approach to assess groundwater discharge into the coastal zone. Limnol. Oceanogr. Methods 2016, 14, 725–735. [Google Scholar] [CrossRef]
  17. Chung, M.; Detweiler, C.; Hamilton, M.; Higgins, J.; Ore, J.-P.; Thompson, S. Obtaining the Thermal Structure of Lakes from the Air. Water 2015, 7, 6467. [Google Scholar] [CrossRef] [Green Version]
  18. DeMario, A.; Lopez, P.; Plewka, E.; Wix, R.; Xia, H.; Zamora, E.; Gessler, D.; Yalin, A.P. Water Plume Temperature Measurements by an Unmanned Aerial System (UAS). Sensors 2017, 17, 306. [Google Scholar] [CrossRef] [PubMed] [Green Version]
  19. Koparan, C.; Koc, A.; Privette, C.; Sawyer, C. In Situ Water Quality Measurements Using an Unmanned Aerial Vehicle (UAV) System. Water 2018, 10, 264. [Google Scholar] [CrossRef] [Green Version]
  20. Ore, J.-P.; Detweiler, C. Sensing water properties at precise depths from the air. J. Field Robot. 2018, 35, 1205–1221. [Google Scholar] [CrossRef]
  21. Koparan, C.; Koc, A.; Privette, C.; Sawyer, C.; Sharp, J. Evaluation of a UAV-Assisted Autonomous Water Sampling. Water 2018, 10, 655. [Google Scholar] [CrossRef] [Green Version]
  22. Koparan, C.; Koc, A.B.; Privette, C.V.; Sawyer, C.B. Autonomous In Situ Measurements of Noncontaminant Water Quality Indicators and Sample Collection with a UAV. Water 2019, 11, 604. [Google Scholar] [CrossRef] [Green Version]
  23. Pilgrim, C.M.; Mikhailova, E.A.; Post, C.J.; Hains, J.J. Spatial and temporal analysis of land cover changes and water quality in the Lake Issaqueena watershed, South Carolina. Environ. Monit. Assess. 2014, 186, 7617–7630. [Google Scholar] [CrossRef] [PubMed]
  24. South Carolina Department of Health and Environmental Control (SCDHEC). State of South Carolina Monitoring Strategy for Calender Year 2018; SCDHEC: Columbia, SC, USA, 2018. [Google Scholar]
  25. Freeman, P.K.; Freeland, R.S. Agricultural UAVs in the U.S.: Potential, policy, and hype. Remote Sens. Appl. Soc. Environ. 2015, 2, 35–43. [Google Scholar] [CrossRef]
  26. Ardupilot. Automatic Landing; Setting the Flare Point. Available online: http://ardupilot.org/plane/docs/automatic-landing.html (accessed on 28 May 2020).
  27. Ahmad, H.R.; Aziz, T.; Rehman, Z.R.; Saifullah. Chapter 15—Spatial Mapping of Metal-Contaminated Soils A2 - Hakeem, Khalid Rehman. In Soil Remediation and Plants; Sabir, M., Öztürk, M., Mermut, A.R., Eds.; Academic Press: San Diego, CA, USA, 2015; pp. 415–431. [Google Scholar] [CrossRef]
  28. Ligges, U.; Mächler, M. Scatterplot3d-an r Package for Visualizing Multivariate Data. Available online: https://www.econstor.eu/handle/10419/77160 (accessed on 28 May 2020).
Figure 1. The sensor node assembly: (a) pressure sensor and voltage converter circuit, (b) computer aided design (CAD) of the case in SolidWorks, (c) pressure sensor in 3D printed and sealed case, and (d) steel tube to enable rapid submerge and sensor protection.
Drones 04 00035 g001
Figure 2. (a) Sensor node integrated with the aircraft and (b) the launch location in Lake Issaqueena.
Drones 04 00035 g002
Figure 3. A section of the lake was used as the experiment site for measurements.
Drones 04 00035 g003
Figure 4. Applied method of water temperature measurements with the UAV.
Drones 04 00035 g004
Figure 5. Water depth map of Lake Issaqueena within the mission plan boundary.
Drones 04 00035 g005
Figure 6. Water temperature distribution by location and water depth: (a) 2D scatter plot illustration and (b) 3D scatter plot illustration.
Drones 04 00035 g006
Figure 7. Water temperature maps representing change in water temperature by intermediate locations and sampling depth.
Drones 04 00035 g007
Table 1. Summary statistics for evaluation of sensor depth measurement.
ReferenceSensorDifference (%)t Value (DF)p Value
MeanSDMeanSD
Probe Depth (m)0.9730.5511.070.5510.0092.03 (18)0.57

