Drone Geologic Mapping of an Active Sand and Gravel Quarry, Desoto County, Mississippi

 ,
,
Abstract
:1. Introduction
2. Materials and Methods
3. Results
4. Discussion
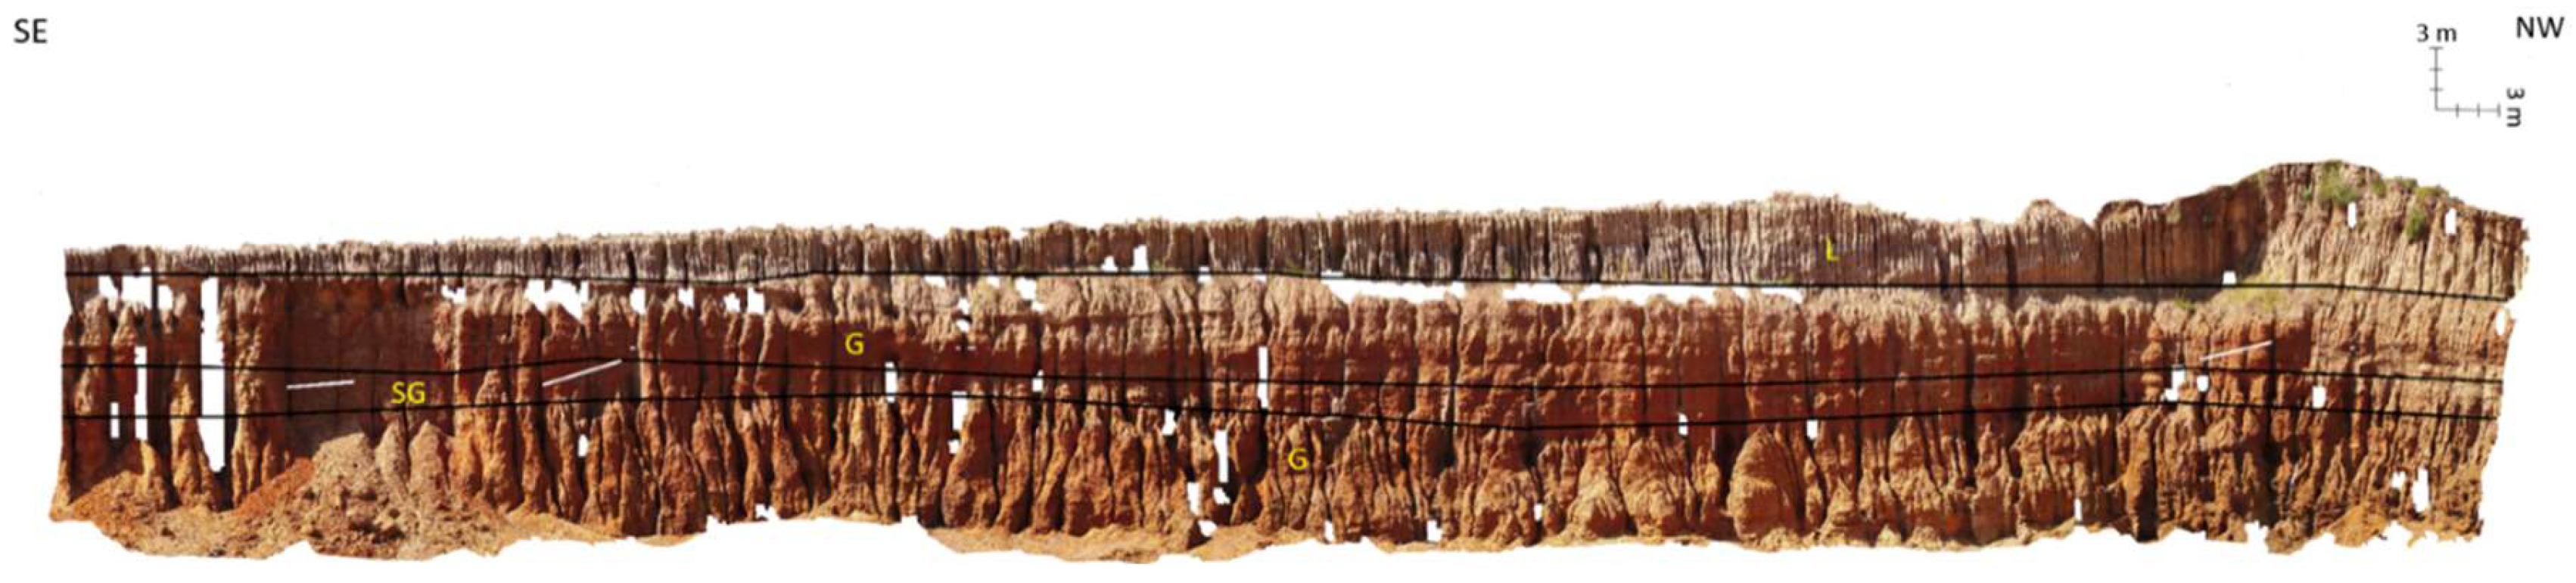
4.1. Highwall 1
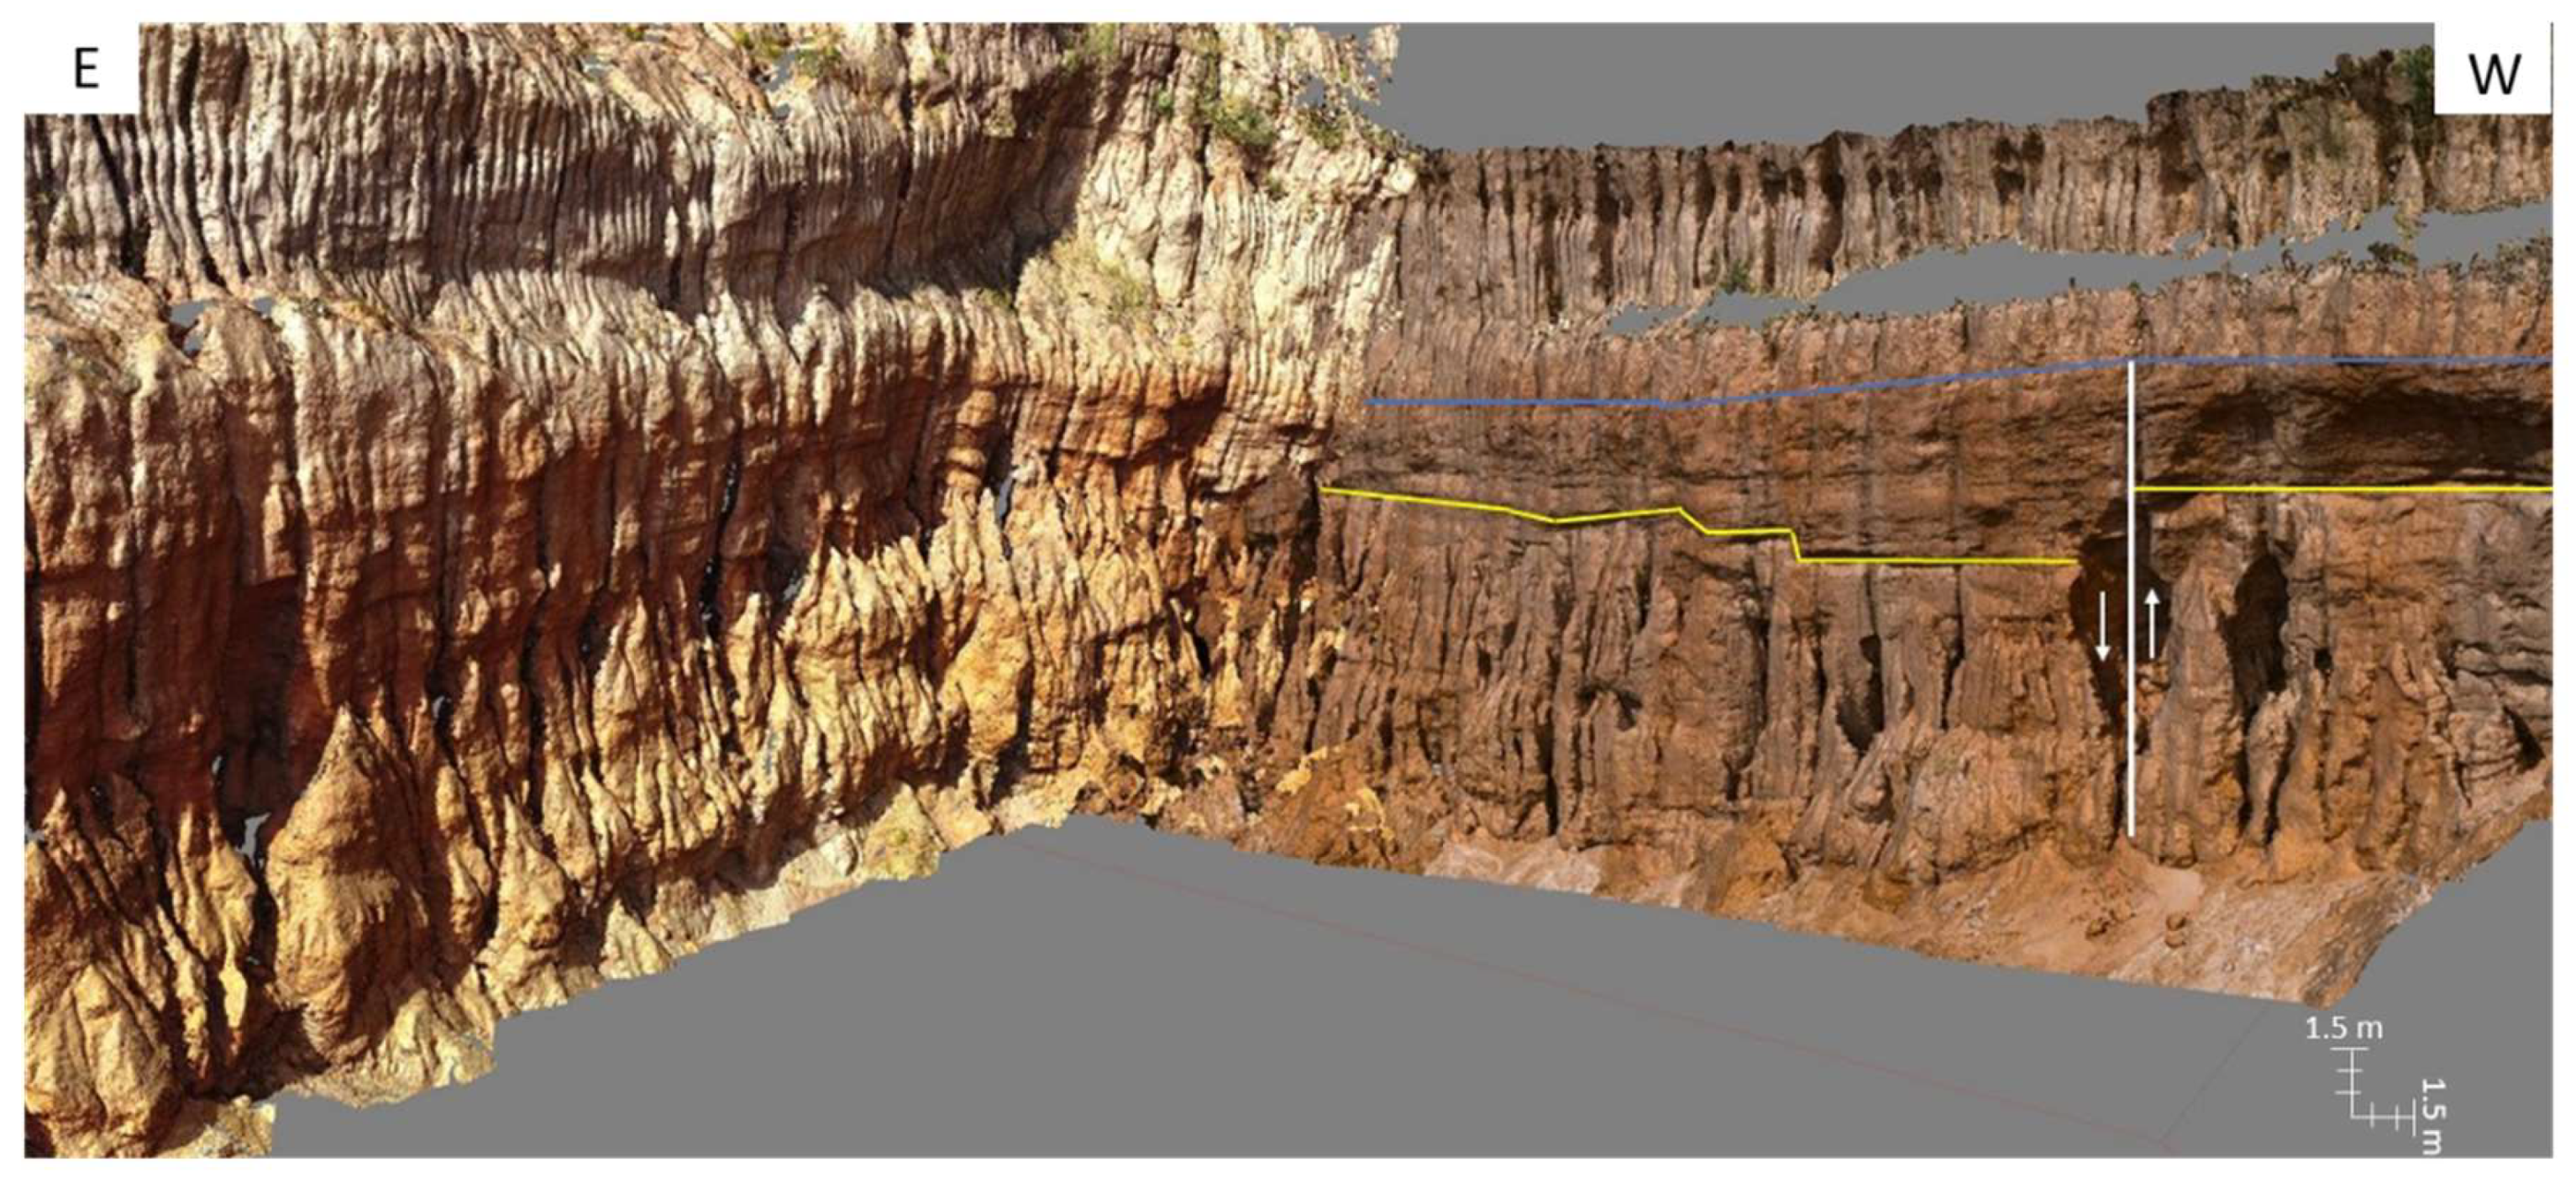
4.2. Highwall 2
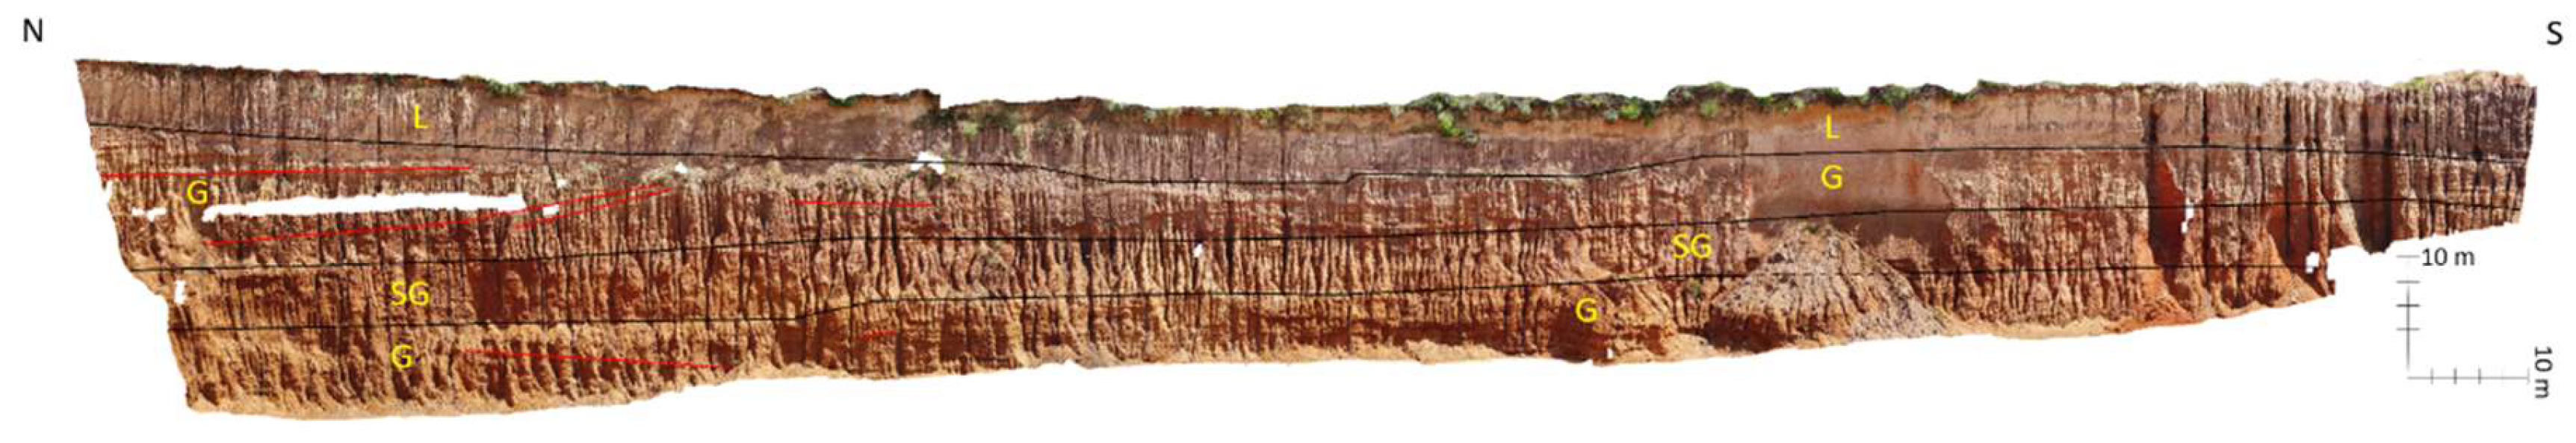
4.3. Highwall 3
4.4. Highwall 4
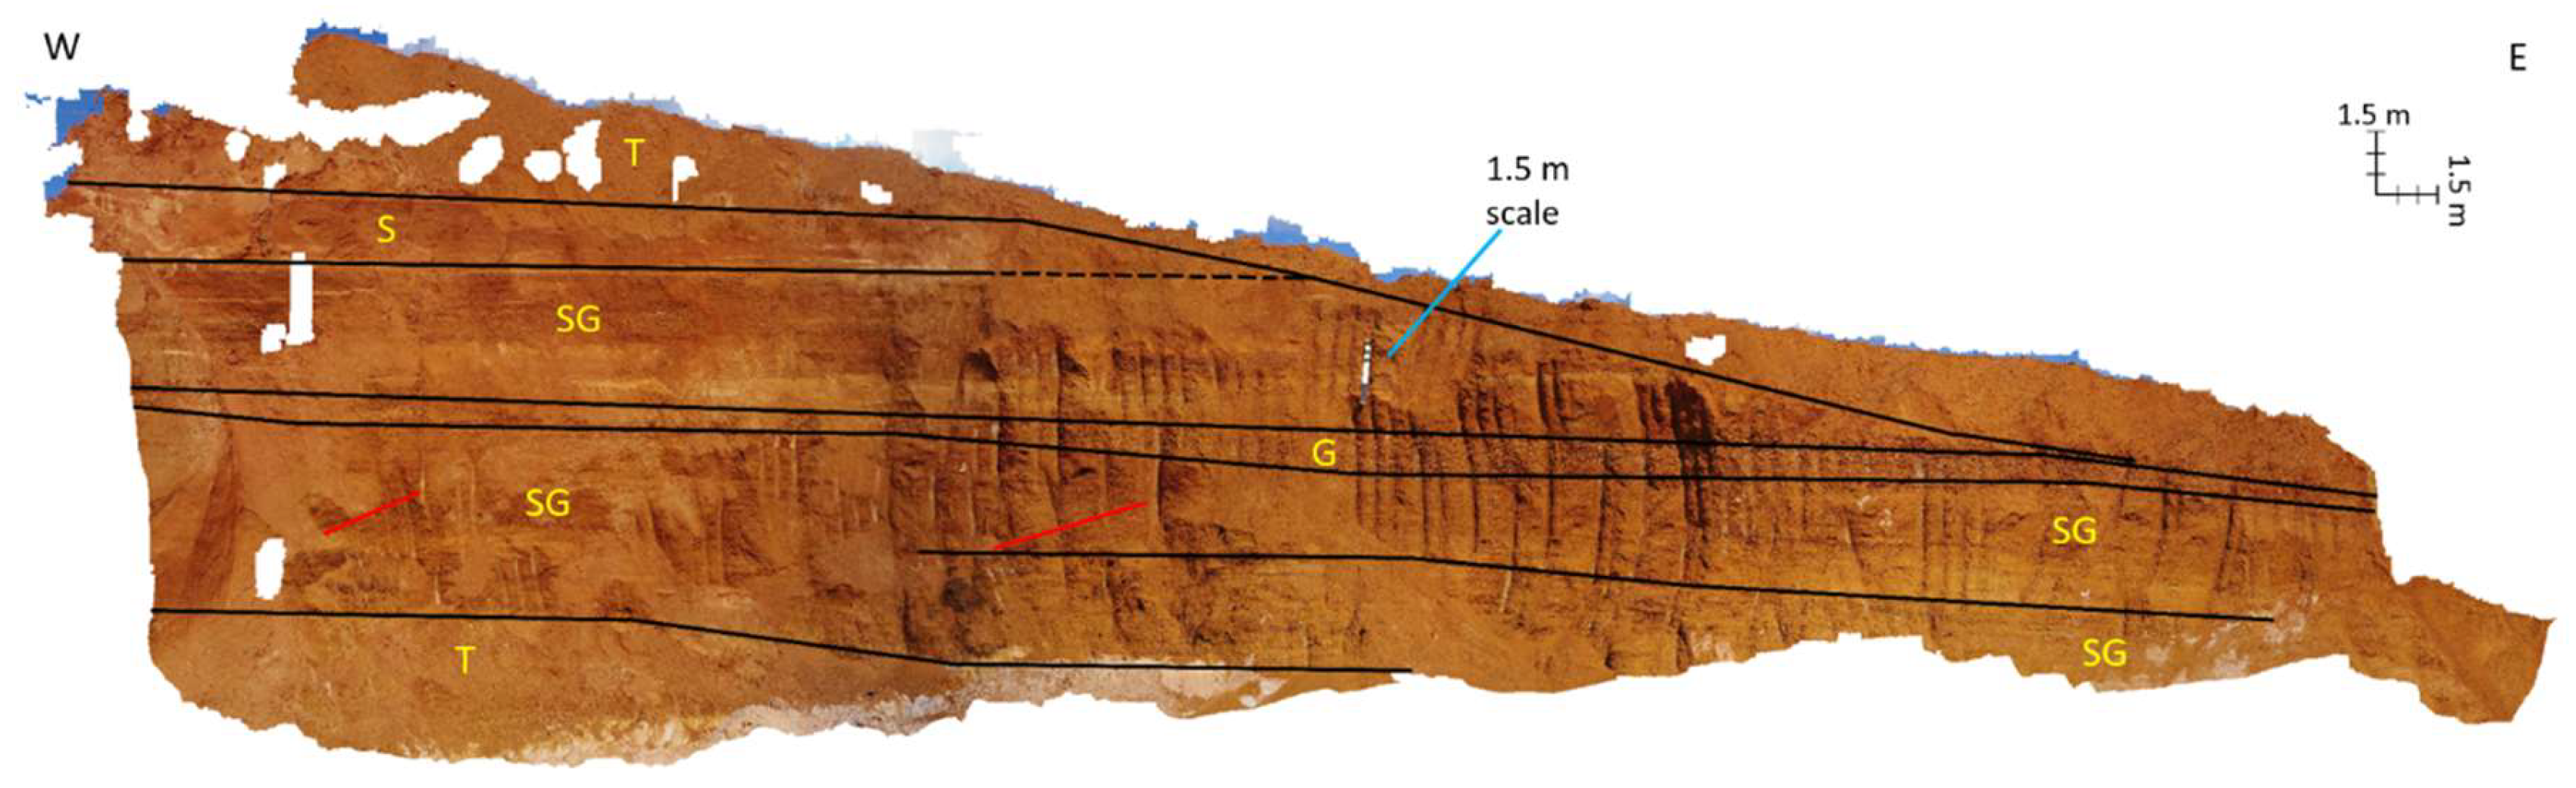
4.5. Highwall 5
4.6. Highwall 6
4.7. Highwall 7
4.8. Recommendations
5. Conclusions
Supplementary Materials
Author Contributions
Funding
Acknowledgments
Conflicts of Interest
References
- Cox, R.T.; Van Arsdale, R.B. Hotspot origin of the Mississippi embayment and its possible impact on contemporary seismicity. Eng. Geol. 1997, 46, 5–12. [Google Scholar] [CrossRef]
- Cox, R.T.; Van Arsdale, R.B. The Mississippi embayment, North America: A first order continental structure generated by the Cretaceous superplume mantle event. J. Geodyn. 2002, 34, 163–176. [Google Scholar] [CrossRef]
- Van Arsdale, R.; Cox, R. The Mississippi’s curious origins. Sci. Am. 2007, 296, 76–82. [Google Scholar] [CrossRef] [PubMed]
- Van Arsdale, R.B.; Bresnahan, R.P.; McCallister, N.S.; Waldron, B. The Upland Complex of the central Mississippi river valley: Its origin, denudation, and possible role in reactivation of the New Madrid seismic zone. In Continental Intraplate Earthquakes: Science, Hazard, and Policy Issues; Special Paper 425; Stein, S., Mazzotti, S., Eds.; Geological Society of America: Boulder, CO, USA, 2007; pp. 177–192. [Google Scholar]
- Van Arsdale, R.B.; Cox, R.T.; Lumsden, D.N. Quaternary isostatic uplift in the Northern Mississippi embayment. J. Geol. 2019, 127, 1–13. [Google Scholar] [CrossRef]
- Rittenour, T.M.; Blum, M.D.; Goble, R.J. Fluvial evolution of the lower Mississippi river valley during the last 100 k.y. glacial cycle: Response to glaciation and sea-level change. Geol. Soc. Am. Bull. 2007, 119, 586–608. [Google Scholar] [CrossRef]
- Cupples, W.; Van Arsdale, R. The Preglacial “Pliocene” Mississippi river. J. Geol. 2014, 122, 1–15. [Google Scholar] [CrossRef]
- Cox, R.T.; Lumsden, D.N.; Van Arsdale, R.B. Possible relict meanders of the Pliocene Mississippi river and their implications. J. Geol. 2014, 122, 609–622. [Google Scholar] [CrossRef]
- Lumsden, D.N.; Cox, R.T.; Van Arsdale, R.B.; Cupples, W.B. Petrology of Pliocene Mississippi river alluvium: Provenance implications. J. Geol. 2016, 124, 501–517. [Google Scholar] [CrossRef]
- Van Arsdale, R.B.; Balco, G.; Bierman, P.R.; Rood, D.H.; Rovey, C.; Cox, R.T.; Lumsden, D.N.; Parks, A. The Pliocene Mississippi river. Geol. Soc. Am. Abstr. Program. 2014, 46, 228. [Google Scholar]
- Van Arsdale, R.B.; Arellano, D.; Stevens, K.C.; Hill, A.A.; Lester, J.D.; Parks, A.G.; Csontos, R.M.; Rapino, M.A.; Deen, T.S.; Woolery, E.W.; et al. Geology, geotechnical engineering, and natural hazards of Memphis, Tennessee, USA. Environ. Eng. Geosci. 2012, 18, 113–158. [Google Scholar] [CrossRef]
- Potter, P.E. The petrology and origin of the Lafayette Gravel: Part 1. Mineralogy and petrology. J. Geol. 1955, 63, 1–38. [Google Scholar] [CrossRef]
- Potter, P.E. The petrology and origin of the Lafayette Gravel: Part 2. Geomorphic history. J. Geol. 1995, 63, 115–132. [Google Scholar] [CrossRef]
- Saucier, R.T.; Snead, J.I. Quaternary Geology of the Lower Mississippi Valley. Scale 1:1,000,000; Geological Society of America, Inc.: Boulder, CO, USA, 1989; 1 sheet. [Google Scholar]
- Autin, W.J.; Burns, S.F.; Miller, B.J.; Saucier, R.T.; Snead, J.I. Quaternary Geology of the Lower Mississippi Valley. Quaternary Nonglacial Geology: Conterminous, U.S.; Morrison, R.B., Ed.; Geological Society of America, Inc.: Boulder, CO, USA, 1991; Volume K-2, pp. 547–582. [Google Scholar]
- Dockery, D.T.; Starnes, J.E.; Thompson, D.E.; Beiser, L. Rocks and Fossils Found in Mississippi’s Gravel Deposit; Circular 7; Mississippi Office of Geology; Mississippi Department of Environmental Quality: Jackson, MS, USA, 2008; p. 24.
- Blistan, P.; Kovanic, L.; Zeliznakova, V.; Palkova, J. Using UAV photogrammetry to document rock outcrops. Acta Montan. Slovaca 2016, 21, 154–161. [Google Scholar]
- Salvini, R.; Masrorocco, G.; Seddaiu, M.; Rossi, D.; Vanneschi, C. The use of an unmanned aerial vehicle for fracture mapping within a marble quarry (Carrara, Italy): Photogrammetry and discrete fracture network modelling. Geomat. Nat. Haz. Risk. 2017, 8, 34–52. [Google Scholar] [CrossRef]
- Chesley, J.T.; Leier, A.L.; White, S.; Torres, R. Using unmanned aerial vehicles and structure-from-motion photogrammetry to characterize sedimentary outcrops: An example from the Morrison Formation, UT, USA. Sediment. Geol. 2017, 354, 1–8. [Google Scholar] [CrossRef]
- Graham, D.J.; Reid, I. Automated sizing of coarse-grained sediments: Image-processing procedures. Math. Geol. 2005, 37, 1–28. [Google Scholar] [CrossRef]
- Warrick, J.A.; Rubin, D.M.; Ruggiero, P.; Harney, J.N.; Draut, A.E.; Buscombe, D. Cobblecam: Grain-size measurements of sand to boulder from digital photographs and autocorrelation analyses. Earth Surf. Process. Landf. 2009, 34, 1811–1821. [Google Scholar] [CrossRef]
- Pina, P.; Lira, C. Sediment image analysis as a method to obtain rapid and robust size measurements. J. Coast. Res. 2009, 56, 1562–1566. [Google Scholar]
- Wells, D.; Coppersmith, K. New empirical relationships among magnitude, rupture length, rupture width, rupture area, and surface displacement. Bull. Seismol. Soc. Am. 1994, 84, 974–1002. [Google Scholar]


| Highwall 1 | Highwall 2 | Highwall 3 | Highwall 5 | Highwall 6 | Highwall 7 |
|---|---|---|---|---|---|
| E | N28W | N57W | N | N20E | N50E |
| 9 W | 15 NW | 7 SE | 20 S | 5 NE | 25 SW |
| 23 W | 15 SE | 13 SE | 13 N | 3 NE | 18 SW |
| 16 SE | 5 SE | 12 N | 4 NE | 18 SW | |
| 11 SE | 13 N | 5 NE | |||
| 13 SE | 5 S | 8 NE | |||
| 11 SE | 4S | 4 NE | |||
| 10 SE | 12 N | ||||
| 10 SE | |||||
| 5 SE | |||||
| 5 SE |
© 2019 by the authors. Licensee MDPI, Basel, Switzerland. This article is an open access article distributed under the terms and conditions of the Creative Commons Attribution (CC BY) license (http://creativecommons.org/licenses/by/4.0/).
Share and Cite
Behrman, C.; Van Arsdale, R.; Kwon, Y.; Stockslager, K.; Leverett, D.; Lumsden, D. Drone Geologic Mapping of an Active Sand and Gravel Quarry, Desoto County, Mississippi. Drones 2019, 3, 57. https://doi.org/10.3390/drones3030057
Behrman C, Van Arsdale R, Kwon Y, Stockslager K, Leverett D, Lumsden D. Drone Geologic Mapping of an Active Sand and Gravel Quarry, Desoto County, Mississippi. Drones. 2019; 3(3):57. https://doi.org/10.3390/drones3030057
Chicago/Turabian StyleBehrman, Caroline, Roy Van Arsdale, Youngsang Kwon, Kerry Stockslager, Dave Leverett, and David Lumsden. 2019. "Drone Geologic Mapping of an Active Sand and Gravel Quarry, Desoto County, Mississippi" Drones 3, no. 3: 57. https://doi.org/10.3390/drones3030057
APA StyleBehrman, C., Van Arsdale, R., Kwon, Y., Stockslager, K., Leverett, D., & Lumsden, D. (2019). Drone Geologic Mapping of an Active Sand and Gravel Quarry, Desoto County, Mississippi. Drones, 3(3), 57. https://doi.org/10.3390/drones3030057