Review

Advances in Unoccupied Aerial Systems for Cetacean Monitoring

1
Key Laboratory of Fisheries Remote Sensing, Ministry of Agriculture and Rural Affairs, East China Sea Fisheries Research Institute, Chinese Academy of Fishery Sciences, Shanghai 200090, China
2
College of Oceanography and Ecological Science, Shanghai Ocean University, Shanghai 201306, China
3
Tianjin Tuyue Technology Co., Ltd., Tianjin 300384, China
4
Aquatic Conservation and Rescue Center of Jiangxi Province, Nanchang 330096, China
*
Authors to whom correspondence should be addressed.
Drones 2026, 10(9), 711; https://doi.org/10.3390/drones10090711 (registering DOI)
Submission received: 16 July 2026 / Revised: 3 September 2026 / Accepted: 16 September 2026 / Published: 19 September 2026

Highlights

What are the main findings?
  • Cetacean monitoring using unoccupied aerial systems (UAS) is advancing from opportunistic visual documentation toward calibrated photogrammetry, computer-vision-assisted detection and re-identification, behavior quantification, and multimodal health or molecular sampling.
  • The strongest evidence occurs when overhead imagery is converted into auditable measurements, identities, tracks, body-condition indicators, or disturbance-response metrics; abundance inference remains most constrained by availability, perception, and group-size error.
What are the implications of the main findings?
  • Technical maturity and bias-impact matrices link platform design, sensor geometry, image preprocessing, annotation, validation, and uncertainty propagation to ecological inference.
  • Management-relevant use requires reproducible preprocessing, survey-level and individual-level model validation, transparent error reporting, and integration with vessel, crewed-aircraft, acoustic, satellite, genetic, and biologging evidence.

Abstract

Most unoccupied aerial systems (UAS) research in cetacean monitoring has shown that drones can acquire high-resolution imagery, but the conditions under which such imagery becomes auditable ecological evidence remain less clearly defined. A structured narrative synthesis (evidence map) was conducted using 242 Web of Science Core Collection records retained from a final export dated 23 June 2026, with search transparency supported by index specification, sentinel-paper recall checking, and predefined evidence and validation maturity coding. Five application domains were identified: morphometrics and health assessment (79 records, 32.6%), behavioral monitoring (76, 31.4%), individual identification (34, 14.0%), abundance and distribution monitoring (33, 13.6%), and multimodal or operational applications (20, 8.3%). Across these domains, the field is shifting from opportunistic visual documentation toward calibrated photogrammetry, computer-vision-assisted detection and re-identification, behavior quantification, and targeted health or molecular sampling. However, ecological inference remains constrained by availability bias, perception bias, group-size error, measurement uncertainty, algorithmic-transfer bias, and disturbance-induced bias. UAS monitoring is therefore evaluated as an observation-to-inference workflow linking platform design, sensor geometry, image preprocessing, annotation, model validation, and uncertainty propagation to management-relevant cetacean evidence.

1. Introduction

Cetaceans are ecologically important, conservation-relevant, and technically difficult monitoring targets. Many whales and dolphins occupy upper trophic positions, contribute to nutrient transport and ecosystem functioning, and respond to changes in prey, habitat, disturbance, and climate [1,2]. At the same time, whales, dolphins, and porpoises are highly mobile, patchily distributed, and visible to observers only during brief surfacing intervals. This combination makes cetaceans a demanding test case for aerial monitoring platforms: the central difficulty is not only detecting an animal at the sea surface, but also determining what that brief observation can legitimately reveal about abundance, identity, health, behavior, or risk [3,4].
Conventional monitoring methods each observe a different component of the cetacean system. Vessel and crewed-aircraft surveys provide established population-survey frameworks, but they can be affected by cost, safety altitude, disturbance, observer error, and limited capacity to resolve individual features [4,5,6,7]. Passive acoustics, tagging, satellite imagery, genetics, biopsy sampling, and environmental sampling provide complementary evidence, yet none eliminates the mismatch between short surface availability and longer-term biological processes. Unoccupied aerial systems (UAS) therefore occupy a specific methodological niche: they can acquire repeatable, fine-resolution overhead imagery while reducing some vessel-proximity constraints, but they do not by themselves solve availability bias, perception bias, or uncertainty in ecological interpretation [5,6].
The central gap in the literature is the transition from UAS observation to auditable ecological inference. Much of the literature has demonstrated that drones can detect cetaceans, measure body dimensions, record behavior, or support targeted sampling. Less attention has been given to the conditions under which these image-derived products become defensible evidence for population status, individual encounter histories, health assessment, disturbance response, or long-term monitoring. High-resolution imagery is only the first step in this chain. Platform stability, altitude sensing, camera geometry, ground sampling distance, sea state, sun glint, sea foam, whitecaps, image preprocessing, annotation rules, model validation, and uncertainty propagation determine whether a detection, measurement, track, or identity link can be used beyond a descriptive case study.
The synthesis is structured around four questions: (i) which biological and conservation applications dominate the literature, (ii) where UAS add value relative to vessel, crewed-aircraft, acoustic, satellite, genetic, and biologging approaches, (iii) which biases still constrain ecological inference, and (iv) what reporting and validation standards are required for repeatable, ethical, and management-relevant monitoring. Unlike previous UAS marine-mammal reviews [5,6,8], which mainly catalogue applications and operational challenges, the present synthesis evaluates the conditions under which image-derived products become auditable ecological evidence.

2. Review Approach and Evidence Coding

This manuscript presents a structured narrative review supported by a bibliometric evidence map. The literature identification and record-selection workflow followed the stages represented in the Preferred Reporting Items for Systematic Reviews and Meta-Analyses (PRISMA) 2020 flow diagram, and the corresponding reporting elements were used to document record identification, screening, exclusion, and retention [9,10]. These elements were applied specifically to enhance the transparency and auditability of corpus construction; the review does not claim full adherence to the PRISMA 2020 checklist [9,10]. The analysis combined bibliometric mapping, predefined domain coding, evidence and validation maturity grading, and critical narrative synthesis. The analytical framework distinguishes observation products, such as counts, detections, measurements, identities, and tracks, from the higher-order biological inferences they support, including abundance, body condition, reproductive status, health, disturbance response, and habitat use.

2.1. Database and Search

The Web of Science (WoS) Core Collection was searched from database inception to a final export dated 23 June 2026. The institutional Core Collection export included the science and technology indexes most relevant to this topic, including the Science Citation Index Expanded (SCI-EXPANDED), Social Sciences Citation Index (SSCI), Emerging Sources Citation Index (ESCI), and Conference Proceedings Citation Index—Science (CPCI-S), where records were available. No document-type filter was applied at retrieval. No formal WoS language filter was imposed; however, the search terms and screening procedure were English-language based, so non-English studies without English bibliographic metadata may be under-represented. Records published in 2026 before the export date were retained for corpus composition, topic coding, and cumulative counts, but were excluded from complete-year trend interpretation. The search used a Topic Search (TS) query combining UAS platform terms with cetacean taxonomic and common-name terms, followed by a NOT block to remove algorithm-only and networking records unrelated to cetacean monitoring. The full executed query is reported in Table 1. The Web of Science Core Collection was used as a traceable indexed source with stable export fields for bibliometric coding; consequently, the corpus supports a structured evidence map rather than an exhaustive census of all Scopus-indexed, gray-literature, preprint, or operational records.

2.2. Recall Check and Screening

Before final screening, the query was checked against sentinel papers selected a priori to represent the methodological backbone of UAS applications in marine mammal and cetacean monitoring, including previous UAS review syntheses [5,6], early UAS photogrammetry [11], automated species identification [12], availability correction [13], abundance-survey evaluation [14,15], three-dimensional volumetrics [16], and blow sampling [17,18]. Sentinel papers were used to test whether the search strategy captured the expected methodological backbone of the field; they were not used to override the eligibility criteria or inflate the retained corpus. The Web of Science export returned 342 records. Because this was a single-database export, no duplicate-removal step was applied before screening. Titles and abstracts were screened for relevance, with case-by-case checking of potential noise. Records were excluded when they (i) used terms such as “whale” or “beluga” only as computational-algorithm vocabulary, (ii) concerned only underwater or biomimetic vehicles without airborne UAS observation, (iii) addressed non-cetacean fauna only, or (iv) mentioned UAS without applying, evaluating, or substantively discussing it for cetacean observation, measurement, sampling, or management. Screening excluded 100 records in two stages: 92 records at title/abstract screening and 8 records at full-text eligibility assessment (corrections or errata, editorials or news items, and early-access or proceedings records), consistent with Figure 1. Therefore, 242 records were retained. The search and screening chain is summarized in Table 1. The screening and record-retention process is shown in Figure 1.

2.3. Coding and Auditability

Each retained record was assigned to one dominant application domain using a fixed decision order to resolve multi-purpose studies: abundance and distribution, individual identification, morphometrics and health, behavior and disturbance, and multimodal or other applications. These classes describe the dominant theme of each record, not mutually exclusive biological functions. Coding was single-label and performed by one coder. To assess classification reliability, all 242 retained records were independently re-coded by a second coder (Tianfei Cheng) using the same decision rubric, so that full double coding of the corpus was achieved; agreement between the two codings was high, and discrepant cases were resolved by discussion under the fixed decision order. The Supplementary Materials are used only to document keyword harmonization for the bibliometric map and are not presented as a study-level extraction or coding table. The full executed query, record-count chain, fixed decision order, and domain definitions reported in Section 2.1, Section 2.2, Section 2.3 and Section 2.4 make the corpus construction and classification logic transparent, although full replication would require re-screening the records. Domain counts should therefore be interpreted as descriptive evidence of research emphasis, whereas judgments about maturity, validation, and standardization are based on coded technical and inferential attributes rather than record counts alone.

2.4. Evidence and Validation Maturity Grading

To make the maturity grading used in Table 2 explicit and reproducible, each application domain was qualitatively assessed against five criteria: (i) acquisition and scale calibration; (ii) task-level quantitative validation; (iii) external validation across independent surveys, sites, seasons, or populations; (iv) correction of key observation biases with uncertainty propagation; and (v) demonstrated standardized repeatability for long-term monitoring. Level I (proof-of-concept feasibility) denotes applications that demonstrate technical implementability, typically at a single site, for one species, or with small samples, relying on manual processing and lacking independent testing, bias correction, or full uncertainty analysis. Level II (validated research application) denotes applications with a repeatable research workflow, reported calibration, and task-relevant accuracy, with some validation on independent survey data, but with limited transferability across sites, seasons, or platforms and unproven long-term monitoring suitability. Level III (operational monitoring readiness) denotes applications in which acquisition, annotation, and analysis are standardized, with independent or external validation, explicit error propagation and correction of key biases, and demonstrated production of stable, auditable, management-relevant results in repeated surveys. Where the literature permits, indicative performance magnitudes anchor these levels; for example, calibrated photogrammetric length measurements report relative errors of approximately 2–5% [19,20,21,22]. The classification is an author-developed synthesis of evidence and validation maturity and should not be interpreted as a formal technology-readiness scale; levels describe the maturity of the validation chain, not publication counts, technological sophistication, or ecological importance.
The five criteria were applied as an ordered, cumulative chain to convert the qualitative assessments into maturity levels. Each criterion was first scored as met, partially met, or not met according to the dominant practice reported across the literature of a domain, rather than on the basis of isolated exemplar studies. A domain was graded Level I when criterion (i) was met but criterion (ii) was not, that is, calibrated acquisition had been demonstrated without task-level quantitative validation. Level II required criteria (i) and (ii) together with at least partial evidence for criterion (iii), namely a repeatable, quantitatively validated workflow with at least one evaluation on independent survey data. Level III was assigned only when all five criteria were met, which in practice required both explicit correction of key observation biases with uncertainty propagation (iv) and demonstrated standardized repeatability in repeated surveys (v). Borderline cases were handled conservatively: when the evidence for a domain fell between two levels—for example, when external validation rested on a single independent dataset, or when bias correction was reported without full uncertainty propagation—the domain was assigned to the lower of the two candidate levels, so that a level is claimed only where the supporting evidence is consistent across the domain rather than exceptional. Where studies within one domain remained genuinely heterogeneous, such as well-marked versus poorly marked species in individual identification, a range (e.g., Level II–III) is reported in Table 2 rather than a single forced grade. Borderline assignments were resolved by consensus using the same conservative decision rule.

2.5. Bibliometric Network Analysis

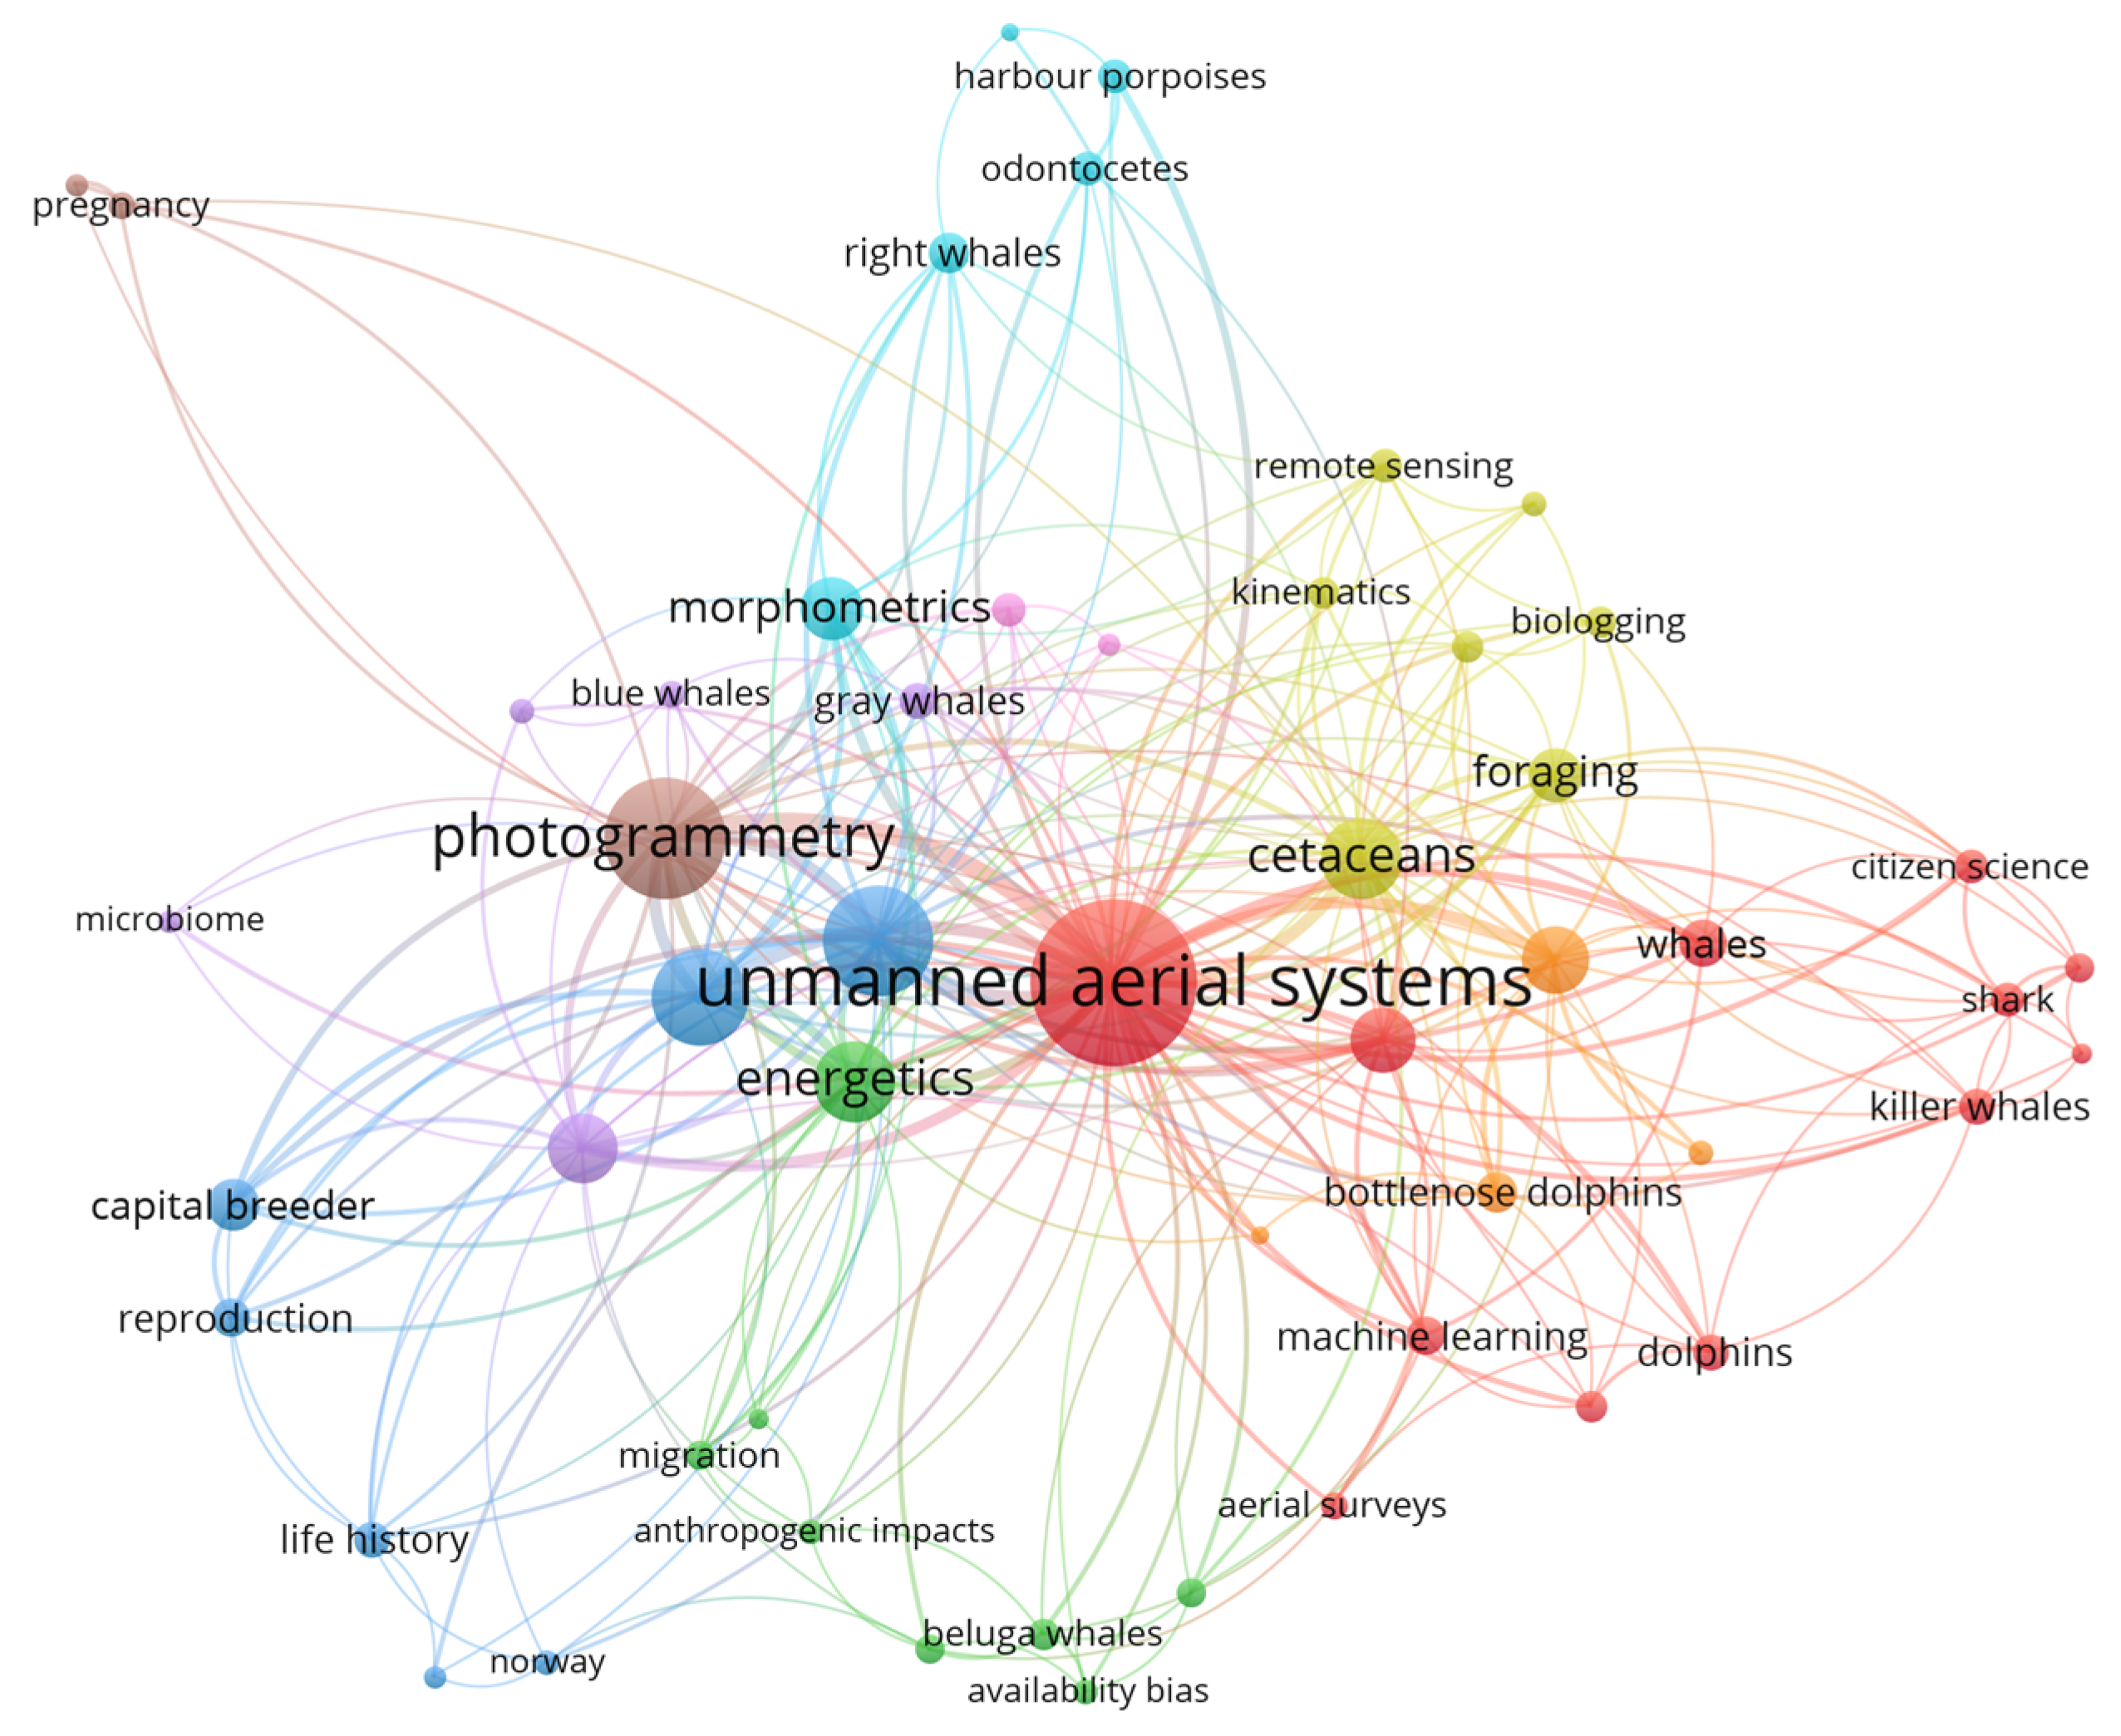
The keyword co-occurrence network was generated with VOSviewer (version 1.6.20) [23] from the 242-record corpus exported from the Web of Science Core Collection in plain-text, tab-delimited format (AU, TI, SO, PY, DE, ID, AB, DI, TC, and DT fields). Author keywords (DE field) were harmonized using a custom VOSviewer thesaurus file containing 47 replacement rules that merge platform synonyms (e.g., UAV, UAS, drone, and RPAS into the bibliometric map label “unmanned aerial systems”), scientific and common taxon names (e.g., Megaptera novaeangliae into humpback whales; Tursiops truncatus into bottlenose dolphins), spelling variants and singular/plural forms (e.g., behaviour into behavior), and closely related concepts (e.g., body size, body mass, and body length into body condition); the thesaurus file is provided as Supplementary Materials. The UAS platform label in the co-occurrence map reflects the dominant historical author-keyword terminology in the dataset, whereas the manuscript narrative uses “unoccupied aerial systems” as the preferred inclusive term. Co-occurrence analysis used full counting with a minimum occurrence threshold of 3; of 739 author keywords, 53 met the threshold. Association-strength normalization and default clustering and layout parameters were applied, and node size in indicates keyword occurrence frequency.

3. Evidence Map and Technology Evolution

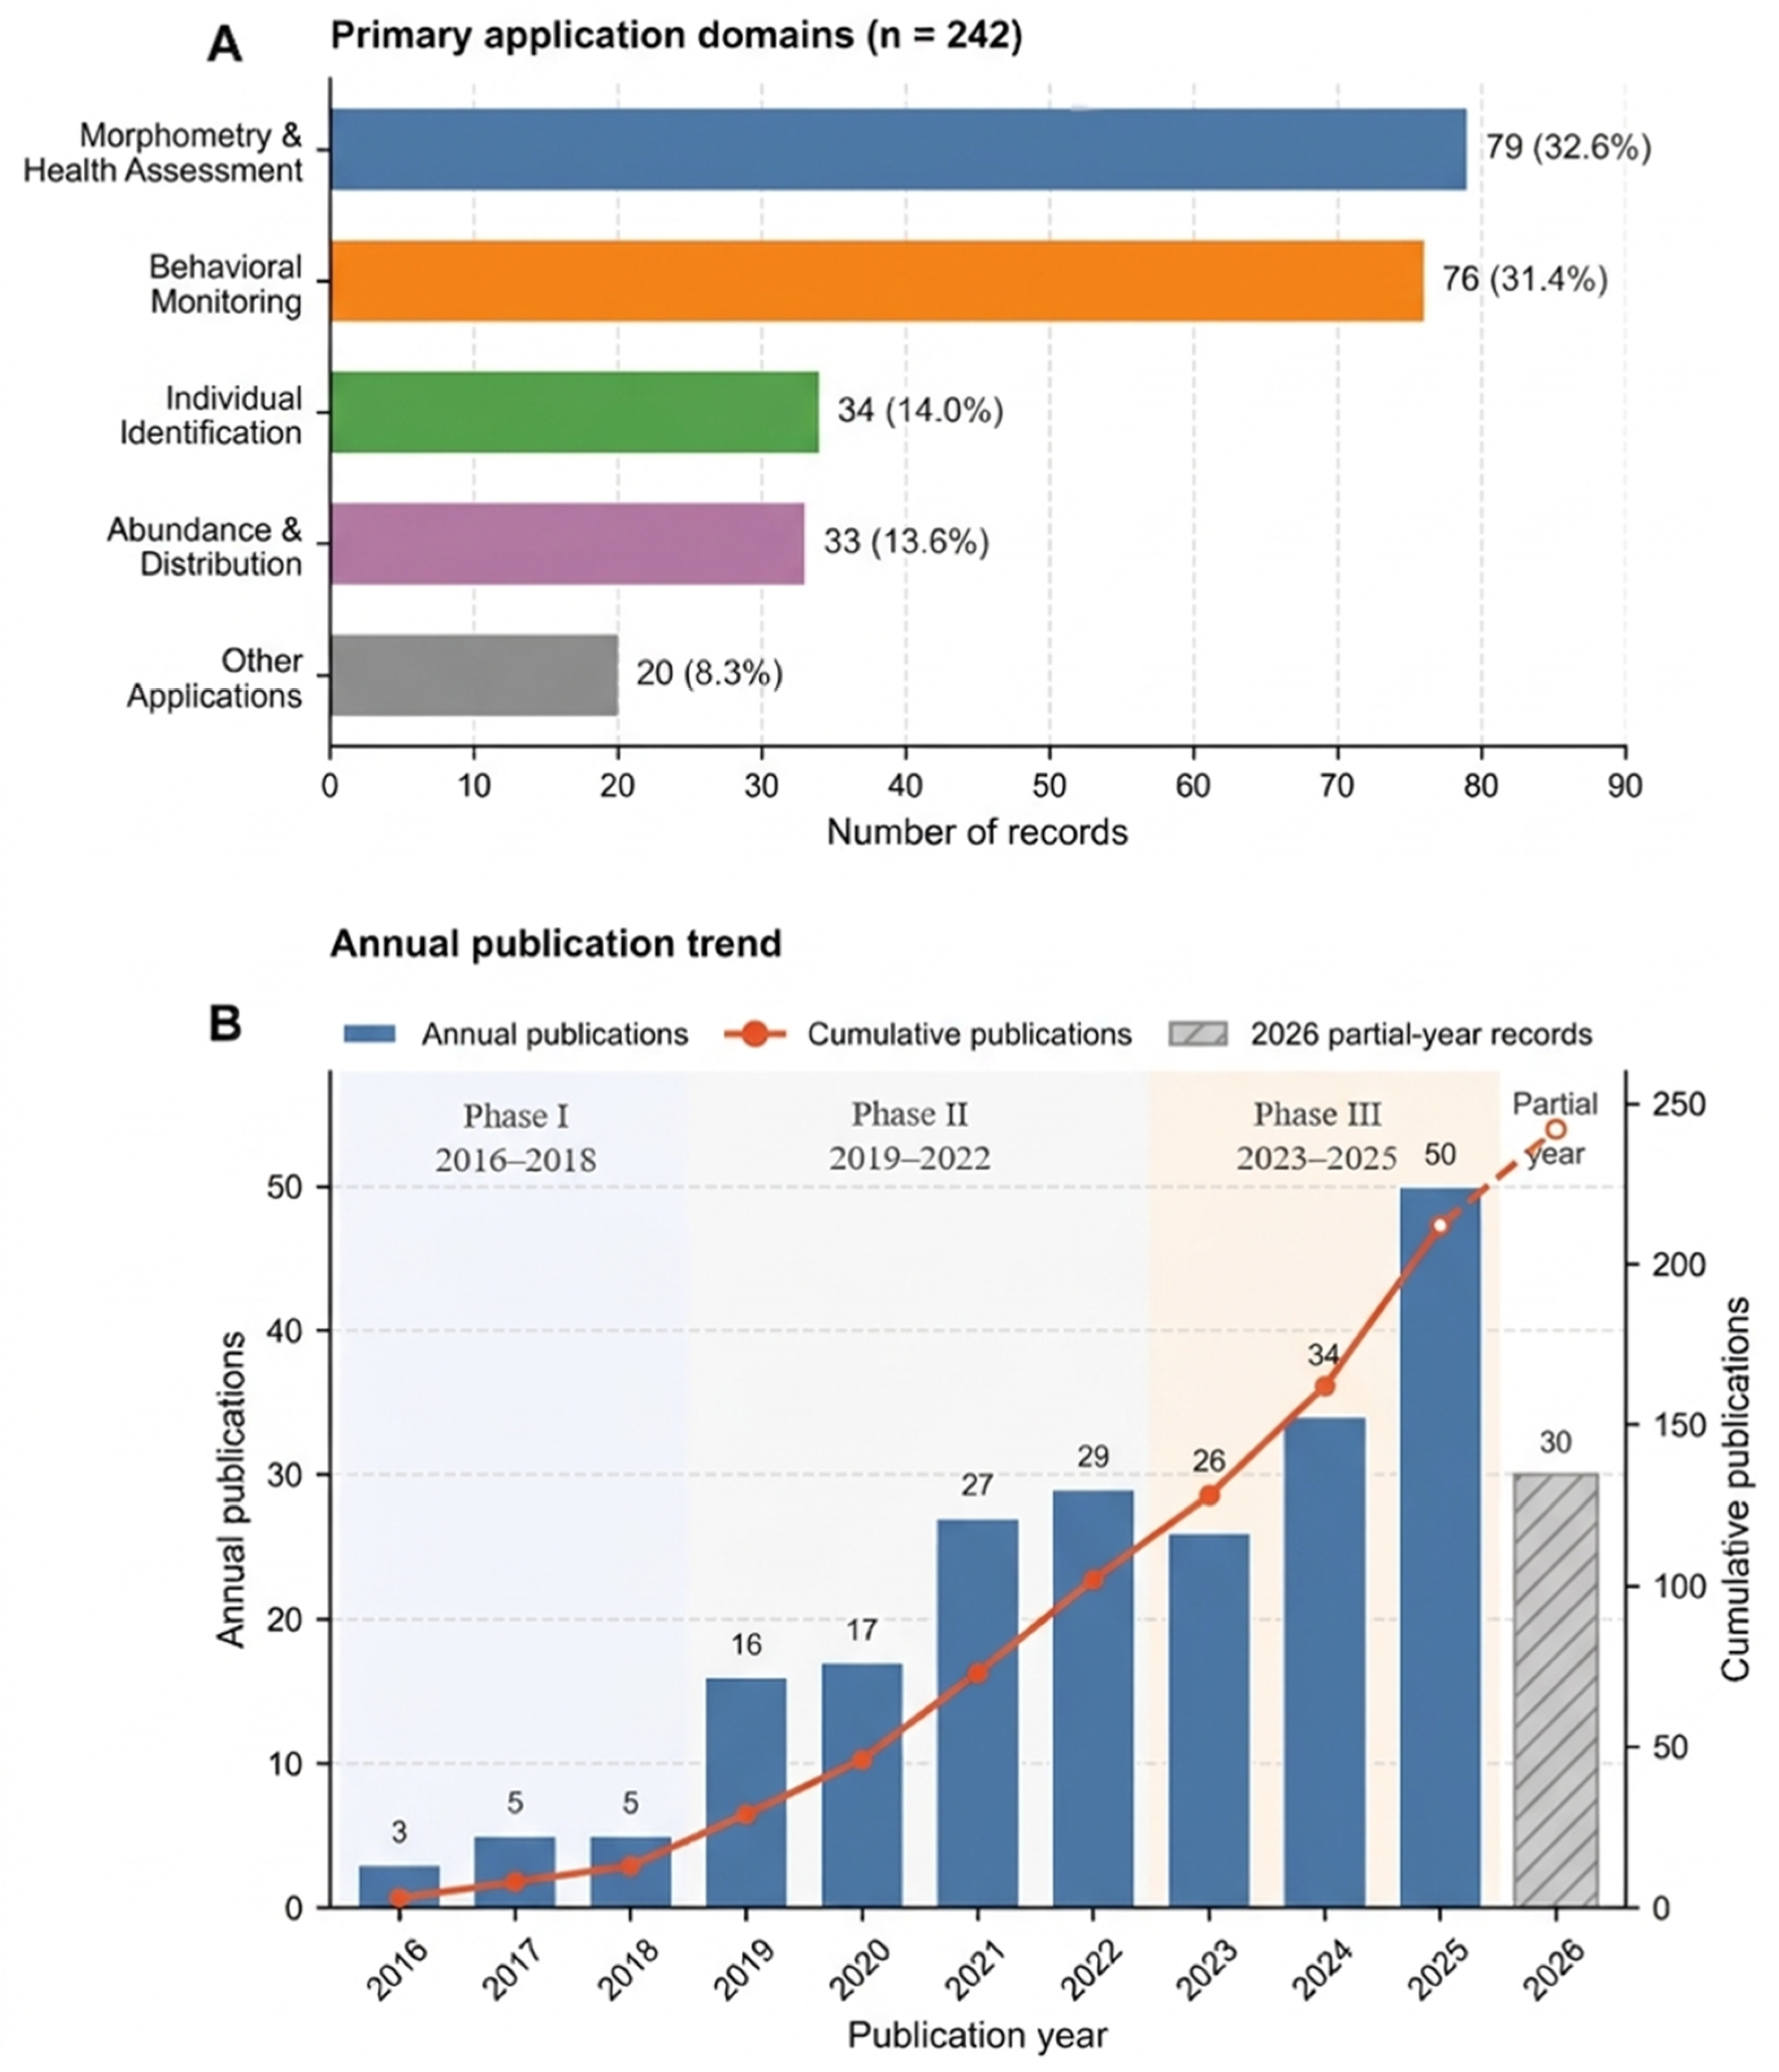
The coded corpus shows that UAS-based cetacean monitoring has developed around five biological and conservation applications (Figure 2A). Morphometrics and health assessment formed the largest category (79 records, 32.6%), closely followed by behavioral monitoring (76, 31.4%). Individual identification (34, 14.0%) and abundance and distribution monitoring (33, 13.6%) formed intermediate categories, whereas multimodal and operational applications accounted for 20 records (8.3%). This distribution describes research emphasis and should not be interpreted as a hierarchy of ecological importance or methodological maturity.
The prominence of morphometrics and health assessment reflects a biological strength of UAS: calibrated overhead imagery can be converted into body size, body condition, pregnancy indicators, lesion coverage, growth metrics, and energetic proxies. Behavioral monitoring is similarly prominent because UAS can record group geometry, surfacing sequences, fine-scale movement, and mother–calf interactions from a perspective that is difficult to obtain from vessels or shore. By contrast, abundance and distribution monitoring remains more constrained because local counts require assumptions about availability, perception probability, group size, sampling coverage, and spatial extrapolation.
The annual trend suggests three broad phases when incomplete 2026 records are excluded from complete-year interpretation (Figure 2B). Phase I (2016–2018) was exploratory, with studies emphasizing feasibility, photogrammetry, altitude control, and measurement error. Durban et al. [11], published before this phase structure, remains an important methodological precursor for UAS photogrammetry of killer whales. Phase II (2019–2022) expanded into body-condition indices, blow sampling, behavior quantification, habitat-use analysis, and cross-platform validation. During this phase, the field increasingly recognized that image resolution alone cannot substitute for sampling design, detectability correction, or uncertainty analysis. The keyword co-occurrence structure is summarized in Figure 3.
Phase III (2023–2025) was characterized by consolidation, longer-term ecological applications, and increasing automation. Recent studies introduced automated or deep-learning-assisted workflows for species identification and photogrammetry [12], body-condition measurement [19], beluga localization [24], open-source photogrammetric processing [20], right-whale morphometric extraction [25], and marine-mammal tracking consistency in challenging drone recordings [26]. These tools reduce manual screening and measurement bottlenecks, but their biological value depends on external validation across species, sites, camera systems, sea states, turbidity, sun glint, breaking waves, sea foam, and whitecaps.
Overall, the field is moving from proof-of-concept observation toward structured ecological monitoring workflows. The central requirement is to convert UAS-derived images, detections, identities, measurements, and tracks into transparent statements about population status, health, behavior, and conservation risk while retaining explicit uncertainty at each stage of the workflow.
To link the bibliometric evidence map with operational readiness, Table 2 provides a condensed comparison of the five application domains by UAS-derived output, key technical requirement, and maturity or best-use context. The maturity grades in Table 2 follow the five criteria and the criteria-to-level conversion rules defined in Section 2.4. Abundance and distribution monitoring reaches Level II for local counts in constrained habitats, but only Level I–II for absolute abundance, because availability bias and on-track detection probability, denoted g(0), remain unresolved for most cetaceans. Individual identification reaches Level II–III for well-marked species with mature catalogues, whereas fully automated cross-site re-identification remains at Level I–II. Calibrated photogrammetry reaches Level III, whereas health inference from body shape remains at Level II–III because biological validation is still required. Behavioral monitoring reaches Level II for surface-visible behavior, whereas automated behavior classification and general disturbance thresholds remain at Level I–II. Multimodal sampling remains at Level I–II overall, because contamination control, sampling success rates, and cross-condition validation are not yet stable.

4. Major Application Domains

4.1. Abundance and Distribution Monitoring

Abundance and distribution monitoring underpins population assessment, habitat protection, and conservation prioritization. UAS can improve local detection, spatial localization, image reviewability, and counting consistency relative to purely visual vessel or crewed-aircraft observations [5,6,27]. Their contribution is strongest in local, coastal, riverine, ice-edge, lagoonal, or otherwise constrained habitats where repeated coverage, post-flight image review, and ground validation are feasible.
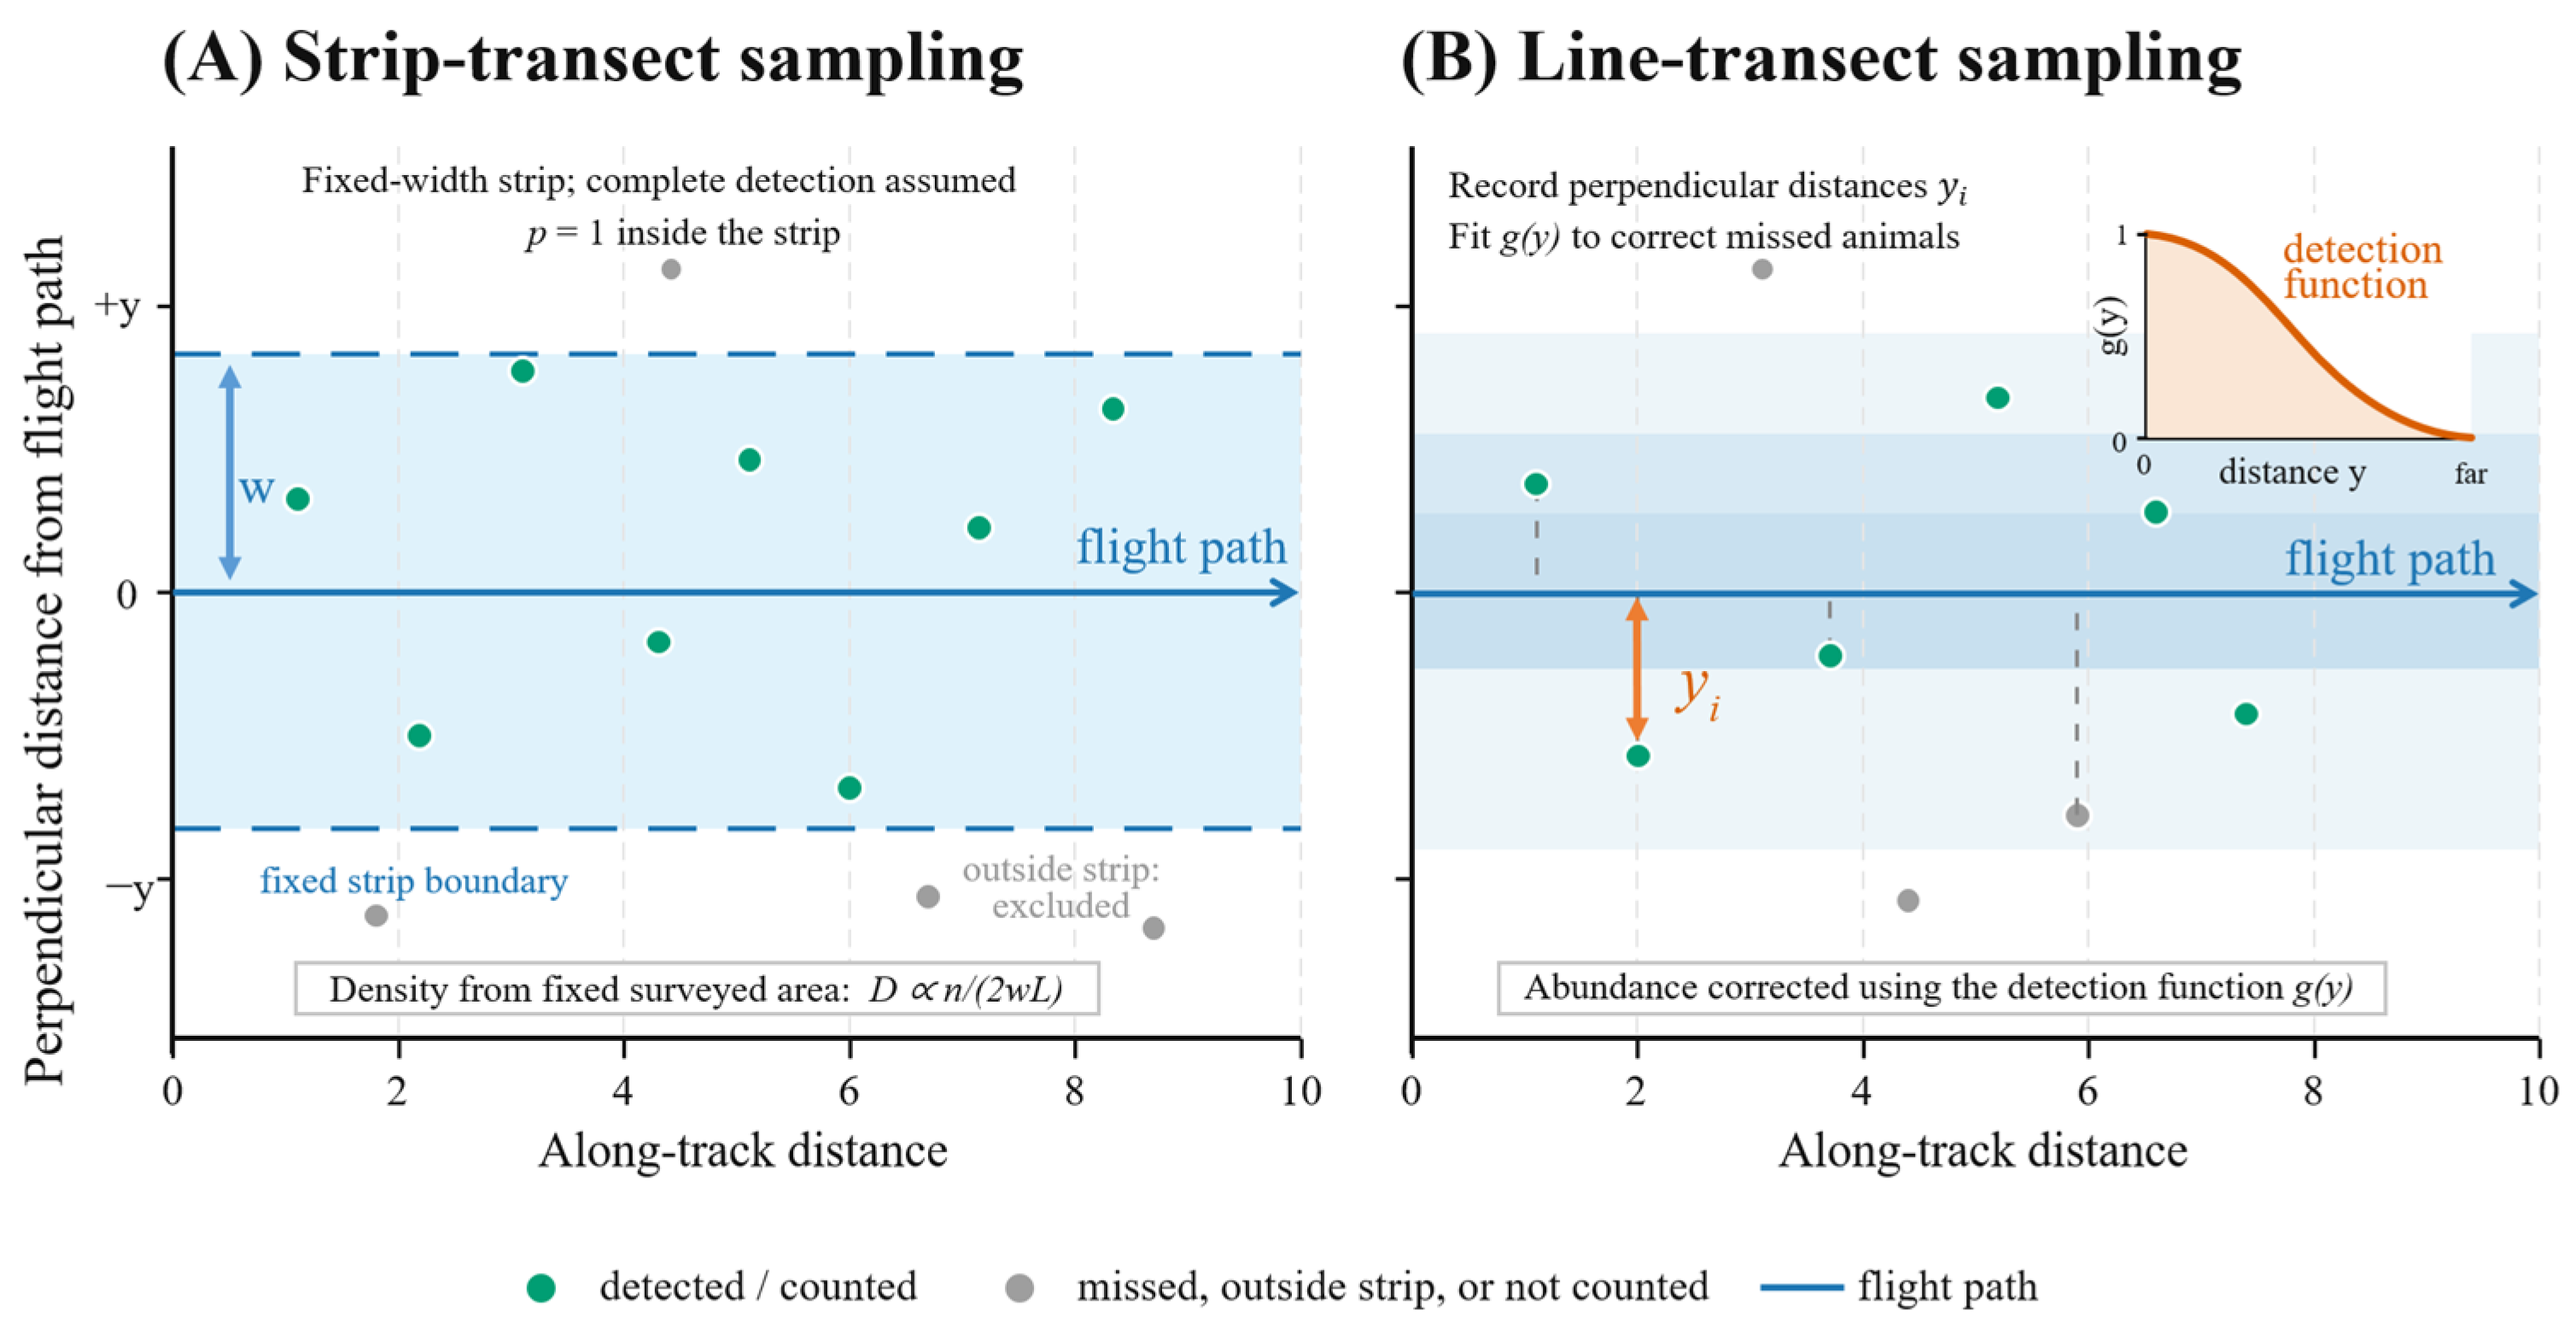
UAS do not alter the statistical problem of abundance estimation. An observed count is not an abundance estimate unless availability, perception probability, group-size error, sampling coverage, and spatial extrapolation are addressed [3,13]. Strip-transect and line-transect methods are survey-design frameworks, not automatic corrections; for cetaceans, their assumptions must be evaluated against species-specific surfacing behavior, group structure, habitat, sea state, platform endurance, and auxiliary correction data [3].

4.1.1. Strip-Transect Sampling

Strip-transect sampling can be useful in constrained survey areas. Within a predefined strip, observed animals are counted, and a density index or relative-abundance measure may be derived from the surveyed area [3,13]. In UAS applications, effective strip width is determined by flight altitude, camera field of view, image footprint, ground sampling distance, image overlap, and the analyst’s ability to distinguish animals from sea-surface structure [14,15]. The method is most defensible in clear-water, riverine, lagoonal, ice-edge, or repeatedly surveyed hotspot contexts where coverage can be documented.
Cetacean studies illustrate these applications without eliminating the need for correction. Oliveira-da-Costa et al. [28] used UAS to detect tucuxi and pink river dolphins in Amazonian conditions where maneuverability and low-altitude imaging are operationally useful; Bröker et al. [29] used image-based narwhal surveys as high-resolution reference data for crewed aerial observation; Stewart et al. [30] used UAS observations to ground-validate very-high-resolution satellite counts of belugas; and Fettermann et al. [31] reported improved local counts of bottlenose dolphins under suitable conditions. Giacomo et al. [32] should be interpreted as rapid post-disaster assessment of marine megafauna rather than as a general cetacean abundance-estimation study.
The limitations are substantial. The assumption of complete detection within a strip is weakened by sea state, water color, sun glint, breaking waves, sea foam, whitecaps, cloud shadow, turbidity, animal depth, and analyst fatigue. Colefax et al. [33], Kelaher et al. [34], and Hodgson et al. [35,36] are relevant as marine-fauna detection and detection-probability studies, but they should be treated as methodological analogues rather than direct cetacean abundance evidence. For cetaceans, the dominant unresolved issue is availability: submerged individuals are absent from imagery, and asynchronous diving can cause group-size error even when a group is detected [3,13]. UAS strip counts should therefore be reported as local counts, minimum counts, or relative abundance unless corrected with surfacing, repeated-pass, acoustic, tagging, or other auxiliary data.

4.1.2. Line-Transect Sampling

Line-transect sampling provides a framework for modeling how detection probability changes with distance from the track line [37]. In UAS studies, perpendicular distance can be reconstructed from target position, flight altitude, camera geometry, image footprint, and georeferencing information. This reduces observer distance-estimation error and allows independent image review, but it does not remove requirements for adequate sample size, randomized or systematic transect placement, and correction for animals unavailable to the camera.
Line-transect logic is relevant when the objective is absolute abundance, trend estimation, or compatibility with established aerial-survey programs over large or dispersed populations. Angliss et al. [14] and Ferguson et al. [15] show that UAS can contribute to Arctic cetacean survey contexts by improving image-based review and measurement of survey geometry. These studies should be interpreted as platform and survey-method evaluations, not as evidence that UAS alone resolves cetacean detectability.
Detection functions address visible animals that are missed; they do not correct animals that never surface during the overpass. Without species-specific surfacing time, dive-cycle information, repeated passes, acoustic support, tagging-derived availability correction, or another defensible estimate of detection probability on the transect line, on-track detection probability should not be assumed to equal 1 for diving cetaceans [3,38].

4.1.3. Comparison and Scenario-Based Recommendation

Strip-transect and line-transect approaches serve different inferential purposes. Strip-transect designs are appropriate for local censuses, rapid response, relative-abundance monitoring, and constrained habitats. Line-transect designs are preferable when absolute abundance, temporal trend, or integration with established aerial-survey frameworks is required. For cetaceans, neither design removes availability bias; method choice should be justified by species diving behavior, habitat geometry, expected density, sea state, platform endurance, and correction data. Table 3 summarizes observation products, representative cetacean taxa, dominant biases, and recommended monitoring contexts across all five application domains, and Figure 4 illustrates the survey-geometry logic. Relative to crewed aerial surveys, both UAS designs trade spatial coverage and crewed-observer endurance for higher image resolution, lower cost, and repeatable deployment; relative to very-high-resolution satellite imagery, they trade coverage for validation-grade detail and flexible timing [30,32].

4.2. Individual Identification and Re-Identification

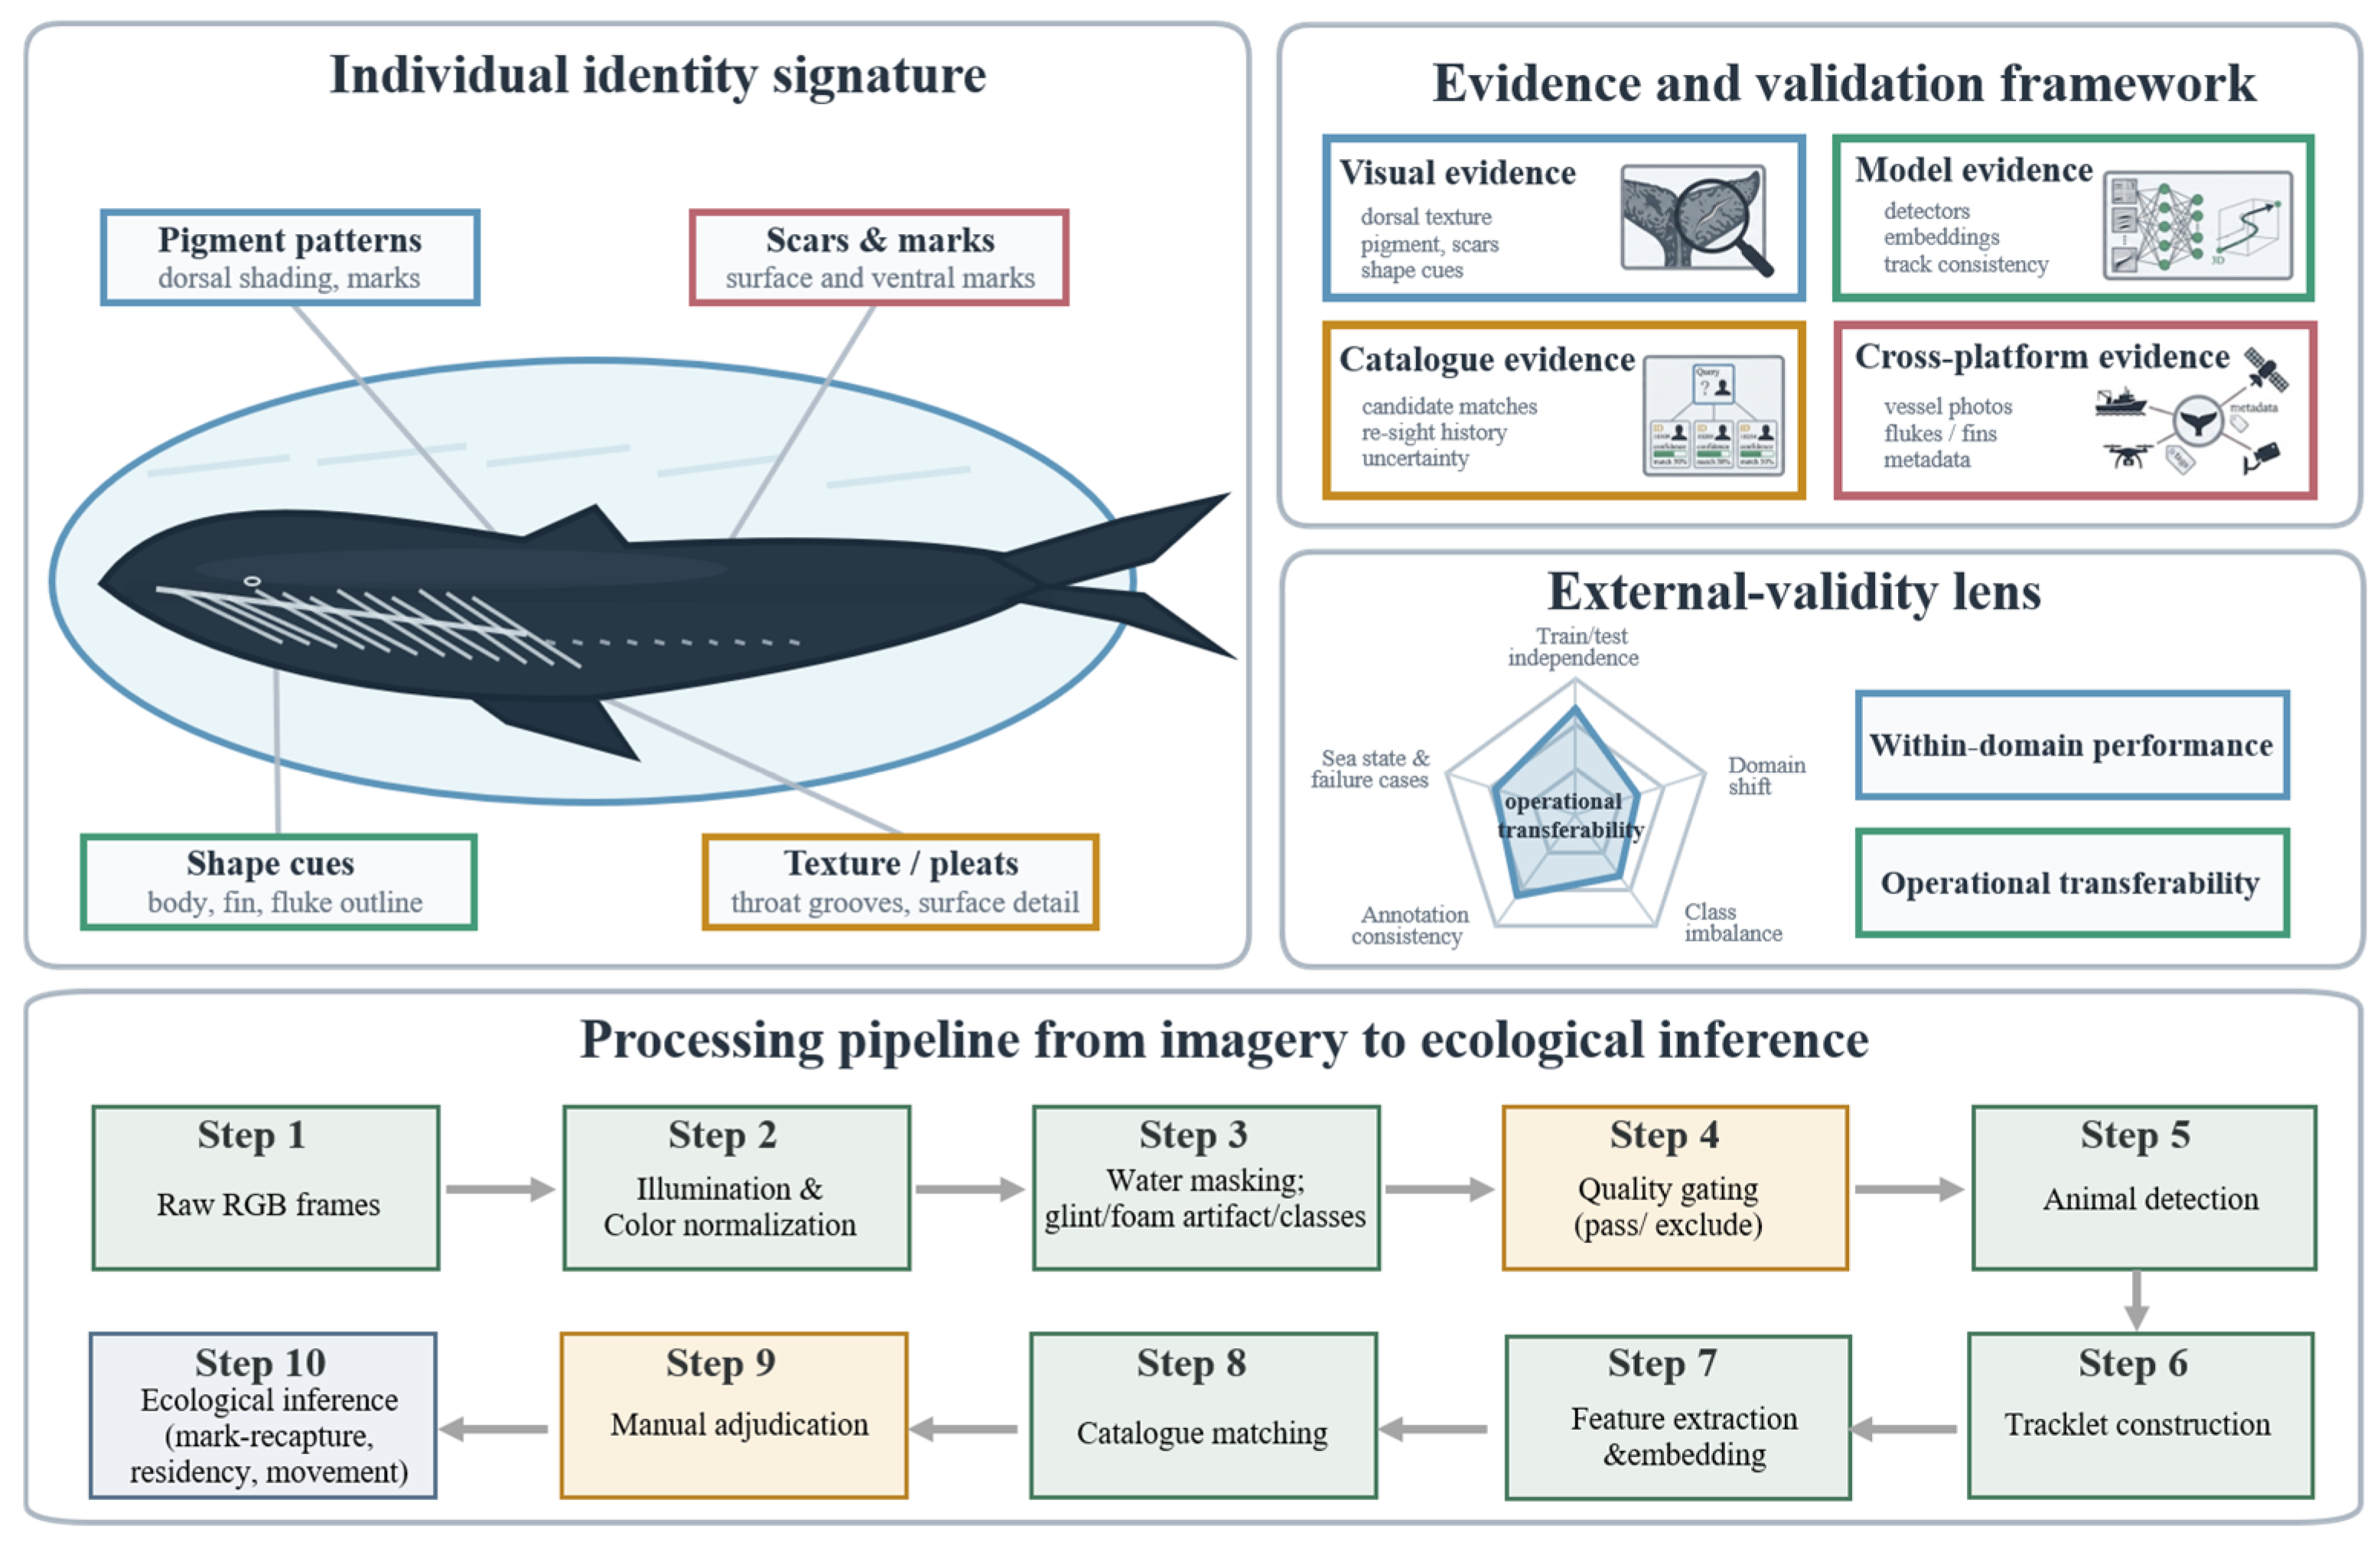
Individual identification is valuable only when image-derived visual evidence can be converted into stable encounter histories. In cetacean research, these histories support mark-recapture analysis, survival estimation, site fidelity, reproductive-history reconstruction, movement analysis, and social-network inference. Conventional photo-identification has relied mainly on lateral images of dorsal fins, flukes, callosity patterns, scars, or pigmentation, but this perspective is not equally informative across species, behavioral states, or encounter conditions [53]. UAS imagery adds a complementary overhead view by capturing whole-back morphology, dorsal pigmentation, chevron patterns, body-surface scars, callosity fields, wound marks, body-shape cues, and the spatial arrangement of marks across the animal. The central contribution of UAS is therefore not simply additional imagery, but a new class of viewpoint-dependent identity evidence that must be linked rigorously to existing catalogues and long-term demographic records [39,40,41,54].
Identification features differ among taxa and determine what the overhead view can contribute [39,40,41,42,53]. In delphinids, the primary cues are dorsal-fin shape and nicks and notches on the fin’s trailing edge, supplemented by saddle-patch and flank pigmentation [53]; in fin whales, the chevron pattern and dorsal-fin profile visible from above support individual matching [39]; in sperm whales, fluke trailing-edge marks and dorsal-ridge features are used, although flukes are only intermittently visible from the air [40]; in right whales, the head callosity pattern provides a stable individual signature [41,42]; and in belugas, which lack a dorsal fin, body scars, pigmentation, and body-shape cues must be used instead [24,41]. UAS imagery captures whole-back morphology, dorsal pigmentation, scars, and the spatial arrangement of marks, but it is less informative for features best seen laterally, such as fluke trailing edges; overhead identity evidence should therefore be linked to, rather than substituted for, conventional lateral photo-identification [53,54].
A reproducible UAS re-identification workflow should be treated as a sequence of separable technical tasks: image-quality screening, sea-surface preprocessing, animal detection, track construction, feature extraction, identity matching, catalogue linkage, and manual adjudication. These steps should not be collapsed into a generic statement that deep learning was used. Before detection or matching, raw red–green–blue (RGB) frames should be normalized for illumination and color balance, preferably with documented white-balance correction, color-space normalization, or histogram-based adjustment when lighting varies across flights. The water background should then be separated from candidate animal regions using semantic segmentation, threshold-based water masking, texture filtering, or hybrid rules appropriate to the sensor and habitat; these steps are especially relevant to dorsal-fin detection and automated detection-tracking tasks [55,56]. Specular reflection, sun glint, breaking waves, sea foam, whitecaps, turbidity plumes, and cloud shadows should be identified as explicit image-quality or artifact classes rather than left as unmodeled noise. In operational workflows, these artifacts can be handled through saturation- and luminance-based glint masks, color-space filters in hue-saturation-value (HSV) or CIELAB (Lab) color space, temporal consistency checks across adjacent frames, and quality-stratified exclusion rules, as illustrated by beluga-localization and tracking workflows [24,26]. The resulting dataset should retain quality labels such as sea state, glare intensity, turbidity, animal depth, occlusion, posture, and mark visibility so that model performance can be reported under the conditions in which the model will be used; this is also a recurrent failure mode in automated delphinid detection and broader marine-mammal detection workflows [57,58].
Detection, tracking, and identity matching are distinct analytical endpoints. Object-detection models localize candidate animals or body parts in individual frames; they do not establish biological identity. Multi-object tracking workflows associate detections across adjacent frames and create tracklets; they reduce duplicate detections and provide movement continuity, but they also do not perform re-identification in the demographic sense. True re-identification requires feature representations that are stable across surveys, viewpoints, seasons, platforms, and image-quality classes, followed by matching against a reference catalogue and adjudication of uncertain matches. Convolutional neural network (CNN)-based classifiers and metric-learning embeddings can assist this process by learning discriminative body-surface or fin/fluke features, as shown in CNN-assisted species identification [12] and right-whale photo-identification [42]. Dorsal-fin detection [55], autonomous detection and tracking of Taiwanese white dolphins [56], beluga localization and marine-mammal tracking workflows [24,26], and automated delphinid detection [57] address different components of the pipeline. The biologically relevant output is therefore not the neural-network label itself, but an auditable catalogue decision: a confirmed re-sighting, a rejected candidate, a new individual, or an unresolved identity with an explicit uncertainty status.
Validation design is a critical weakness in many automated identification workflows. Random frame-level splits are usually inadequate because adjacent frames from the same flight contain the same animal, background, sea state, altitude, camera, and lighting conditions; this validation issue is particularly important in automated cetacean and marine-mammal image workflows [12,24,26,57,58]. Such splits can inflate accuracy by allowing the model to learn survey-specific visual structures rather than transferable animal features. A defensible evaluation should specify the level of separation used for training, validation, and testing. Survey-level splits test whether a model transfers across flights, operators, viewing angles, and sea conditions. Site-level and season-level splits test spatial and temporal transfer. Individual-level splits are required when authors claim that feature extraction generalizes to previously unseen animals; encounter-level or survey-level splits are required when the aim is reliable re-sighting of known catalogue individuals without leakage from near-duplicate frames. For closed-set identity classification, where all test individuals are represented in training, performance should not be interpreted as open-set catalogue discovery. For open-set re-identification, the workflow should report how new individuals, uncertain matches, and visually similar non-matches are handled.
Performance reporting should match the task. Detection models should report object-level precision, recall, mean average precision (mAP), false positives, false negatives, duplicate-detection rates, and performance stratified by sea state, glare, whitecaps, turbidity, animal depth, and image resolution. Tracking workflows should report identity switches, track fragmentation, track purity, track completeness, and the proportion of biologically usable tracklets. Re-identification workflows should report top-k retrieval accuracy, false-match rate, false-rejection rate, catalogue-linkage success, manual adjudication rate, and error modes involving calves, weakly marked individuals, scars that change over time, partial surfacing, or poor posture. These metrics should be presented alongside failure cases, because the most consequential errors in cetacean monitoring are often not average errors but rare false matches that contaminate long-term encounter histories.
The appropriate endpoint for UAS-based individual identification is therefore not algorithmic accuracy in isolation, but reduced identity uncertainty in ecological inference. Automated detection can reduce image-screening burden; tracking can reduce duplicate counts and preserve encounter continuity; feature embedding can prioritize candidate matches; and catalogue linkage can support mark-recapture, residency, movement, and social analyses. However, each step introduces its own error structure. A UAS re-identification system should be considered transferable only when it has been evaluated across independent surveys, sites, seasons, camera systems, sea-surface conditions, and identity catalogues, with clear separation between detection performance, tracking performance, and identity-matching reliability. The resulting re-identification workflow is summarized in Figure 5.
Table 4 compares representative algorithmic and software workflows across the main analytical tasks. Three comparative patterns emerge. First, within the data distribution used for development, detection and measurement accuracy is consistently high: automated pipelines match manual morphometry within a few percent [12,19,25], and per-class detection precision and recall can exceed 0.9 [24]. Second, the dominant failure modes are structured rather than random: identity switches in multi-object tracking [24,26], signed biases in automated morphometry that require correction before use [25], and performance degradation under glare, foam, and low-contrast conditions [57,58]. Third, validation design, rather than model architecture, is the main determinant of evidence strength: workflows evaluated against manual reference measurements, quality-stratified samples, or public benchmarks [19,25,26] provide stronger evidence than workflows assessed with random frame-level splits, which remain common in detection-focused studies [55,56,57].

4.3. Morphometrics, Body Condition, and Health

4.3.1. Morphometrics

UAS photogrammetry converts overhead images into measurements of body length, width, area, volume, shape, growth, and body condition [11,16,20]. This conversion is a measurement problem before it is a biological problem. Pixels become biological dimensions only when camera geometry, altitude, lens distortion, image scale, viewing angle, animal posture, and body-edge visibility are controlled or explicitly modeled. A valid morphometric workflow should therefore report the platform, camera model, focal length, image resolution, altitude sensor, altitude-validation method, ground sampling distance, image footprint, lens calibration, and criteria used to accept or reject frames. Near-nadir imagery, straight body posture, clear body margins, and minimal roll or wave occlusion are not optional aesthetic criteria; they determine whether a measurement is interpretable.
The technical development of UAS morphometrics has moved from manual measurements based on simple altitude scaling toward calibrated, uncertainty-aware workflows. Early studies established that small UAS could obtain biologically meaningful measurements of large whales under field conditions [11]. Subsequent work improved altitude sensing, camera calibration, scale validation, open-source photogrammetric tools, and repeatable measurement pipelines [20,21,22]. These methods have now been applied across killer whales, baleen whales, snubfin and humpback dolphins, South American small cetaceans, harbor porpoises, and spinner-dolphin calves [59,60,61,62]. The common methodological lesson is that image resolution alone is insufficient. Measurement error arises from altitude uncertainty, lens distortion, animal curvature, body roll, surface refraction or occlusion, indistinct body margins, and landmark-placement variability. These uncertainties should be estimated and propagated into length, width, area, volume, and body-condition indices rather than hidden behind a single point estimate.
Automated morphometric workflows introduce additional validation requirements. Segmentation models, landmark detectors, and body-axis extraction algorithms can accelerate measurement, as illustrated by automated body-length, body-condition, and right-whale morphometric workflows [19,25]. However, their errors are structured by species morphology, pigmentation, water color, glare, posture, and image scale. A segmentation model trained on high-contrast baleen-whale images may not transfer to small odontocetes in turbid water or to partially submerged animals with weak body-edge contrast. Automated body-length or body-condition measurements should therefore be validated against expert annotations, repeated manual measurements, calibration objects where available, and independent survey-level test sets. Reported metrics should include absolute error, relative error, bias, confidence intervals, failure rates, and performance stratified by posture, sea state, sun glint, foam, whitecaps, altitude, and image quality. If automated landmarking or segmentation is used, the manuscript should specify whether validation was performed at the frame, individual, survey, or site level; otherwise, near-duplicate frames can again inflate performance.
Three-dimensional reconstruction and volumetric estimation extend UAS photogrammetry from linear measurement to energetic and body-mass inference [16]. These methods are powerful but assumption-sensitive. Volume estimates depend on body-shape models, posture, cross-sectional geometry, tissue-density assumptions, and the relationship between external morphology and internal energy stores. Consequently, body mass, lipid storage, pregnancy status, or fasting endurance should not be inferred from imagery without biological calibration and uncertainty propagation. The most defensible studies combine repeated UAS measurements with life-history information, known reproductive status, biologging, prey context, or independent health proxies.

4.3.2. Body Condition and Health Assessment

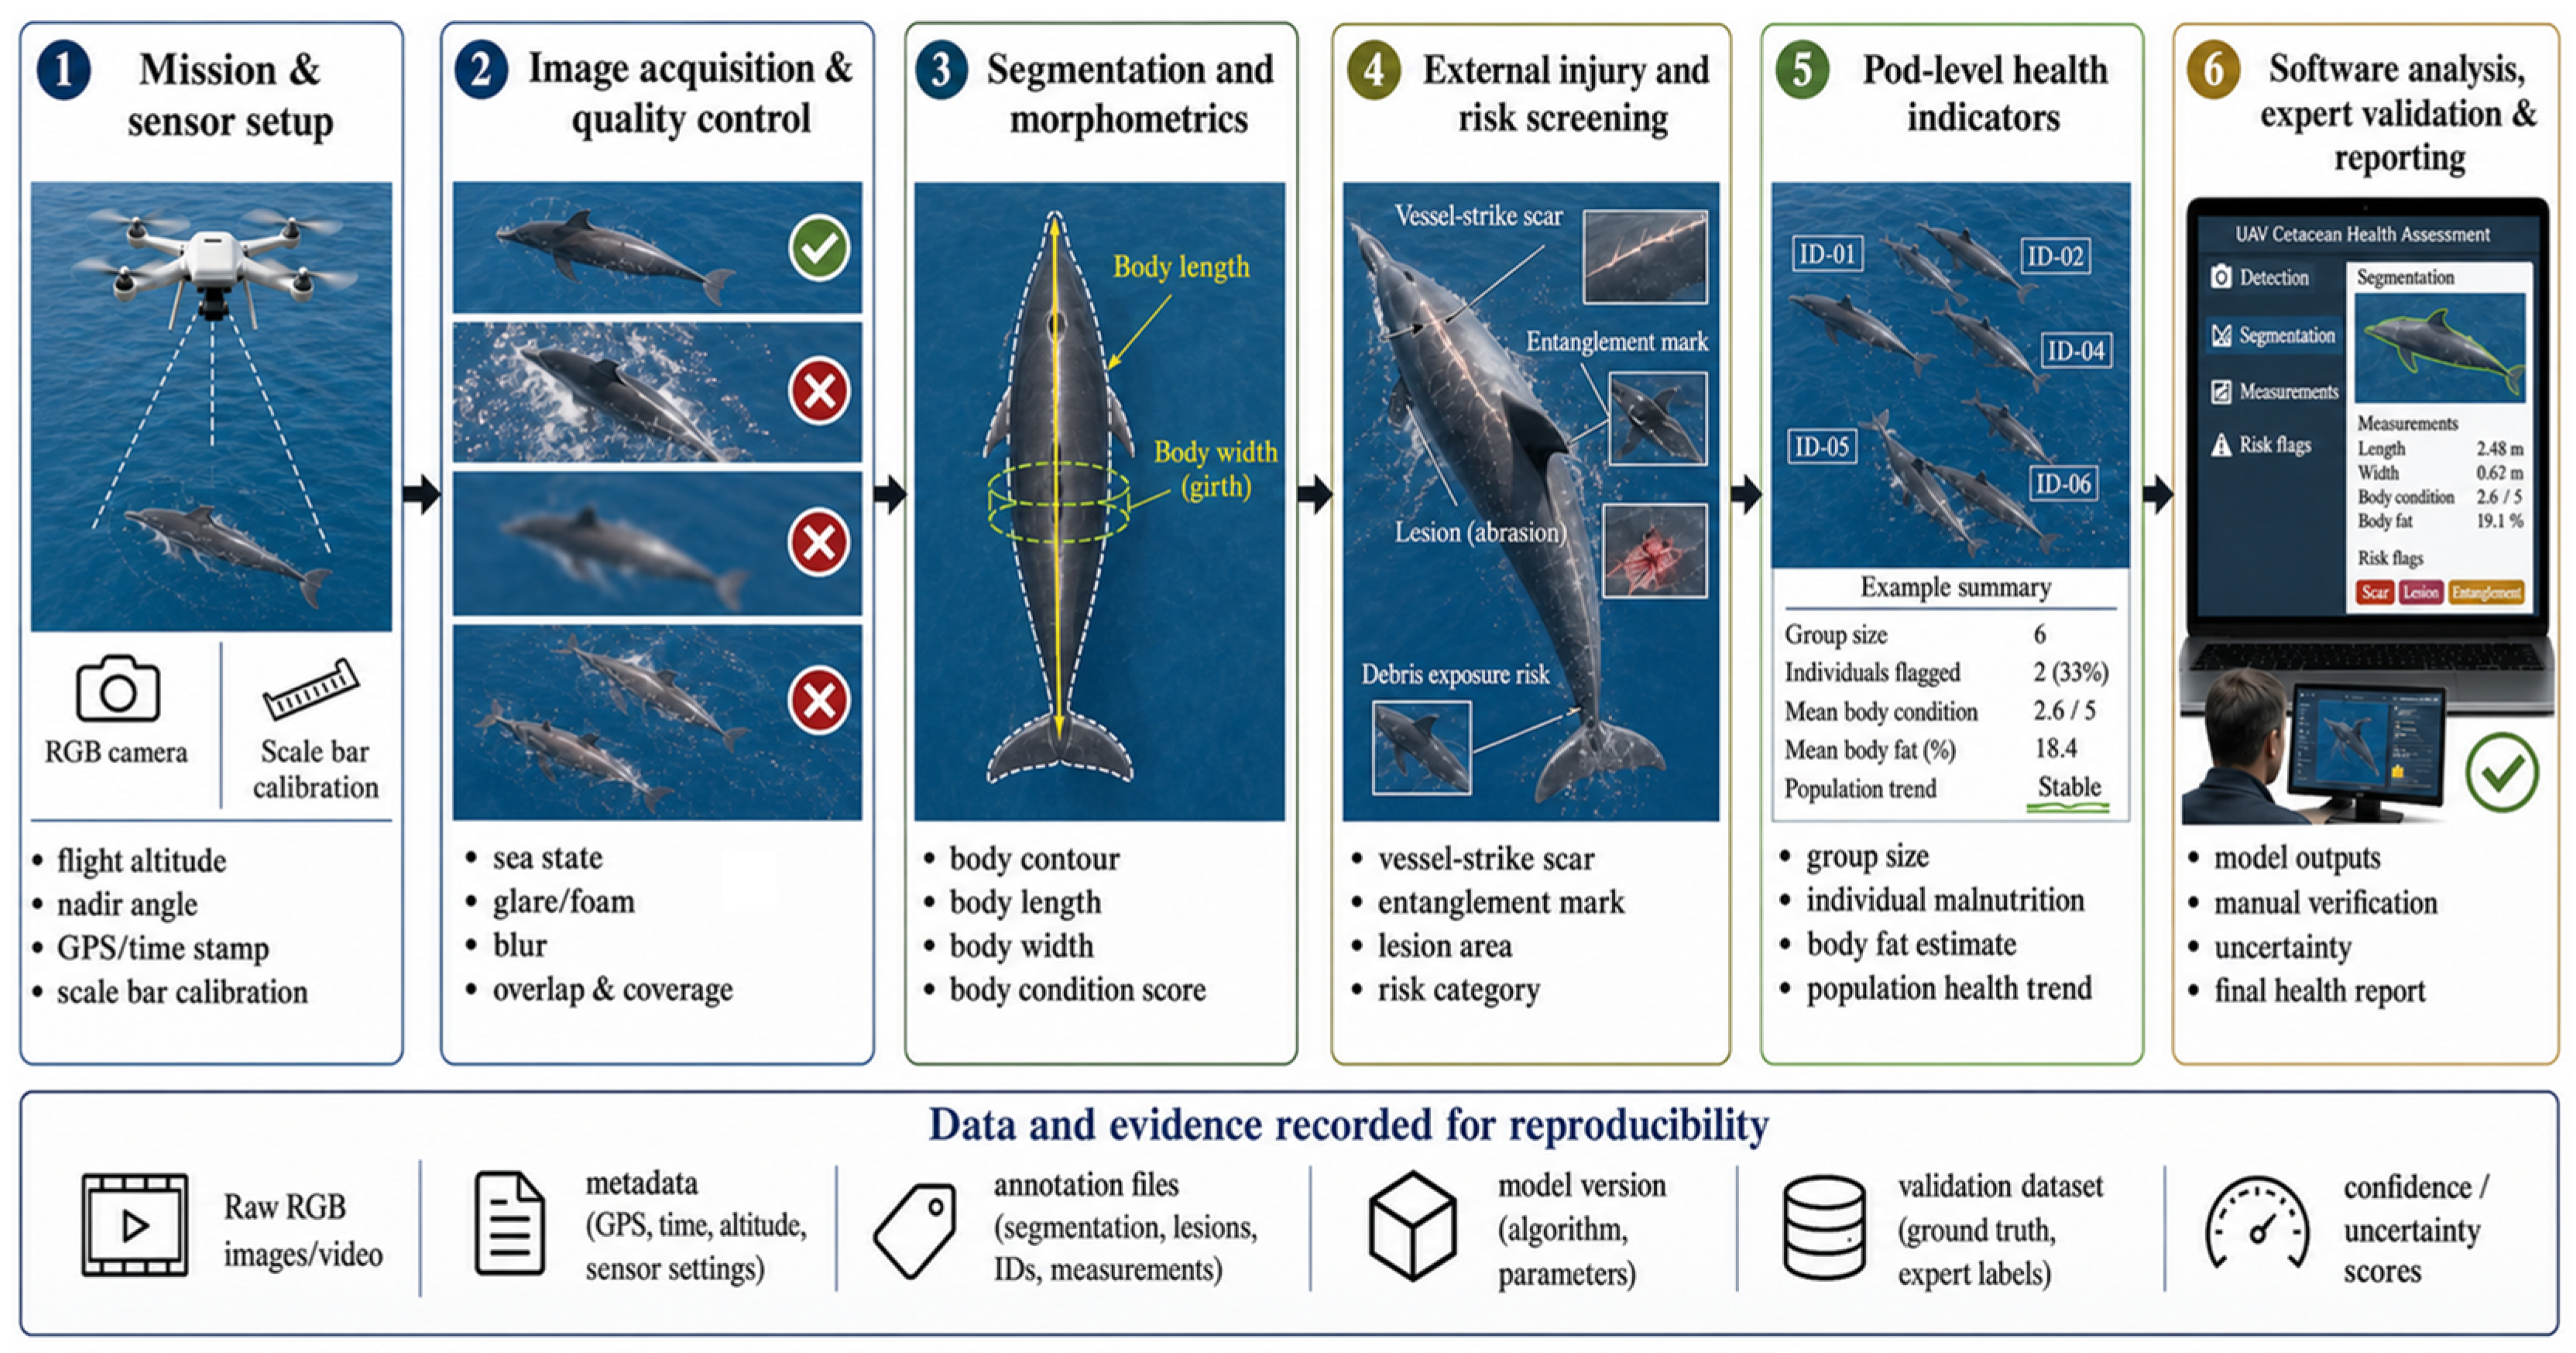
Morphometric dimensions become health evidence only after biological interpretation has been validated. Length, width, area, volume, and shape indices can indicate growth, energy reserves, pregnancy, nutritional stress, or survival probability, but these relationships depend on species, age, sex, reproductive status, season, migration phase, and ecological context. External body condition should therefore be presented as an index with defined calibration limits, not as a direct measurement of physiological condition. Christiansen et al. [63] showed that outer-blubber lipid concentration may not reliably represent whole-body condition change in humpback whales, illustrating why external morphology and physiological state cannot be assumed to be interchangeable. Conversely, repeated UAS measurements can reveal biologically meaningful seasonal depletion, foraging-ground gain, reproductive costs, and population-level stress when interpreted with appropriate context [43,64,65,66].
The strongest health applications use repeated measurements and auxiliary evidence to move beyond descriptive morphology. Maternal size and condition have been linked to calf growth and survival [67,68], body condition has been associated with killer-whale survivorship and prey availability [69], and poor condition has been interpreted in relation to unusual mortality events in gray whales [70]. These examples demonstrate the value of UAS health assessment, but they also define its limits: inference is strongest when the same individuals or population segments are measured through time, when uncertainty is propagated, and when ecological covariates are available. Cross-sectional images of unknown individuals can support screening and hypothesis generation, but they should not be overinterpreted as diagnostic health assessments.
High-resolution imagery can also support pregnancy assessment, lesion quantification, wound monitoring, epibiotic assessment, and external indicators of disease or nutritional stress [71,72,73]. These applications require the same technical discipline as morphometrics. Lesion boundaries, pigmentation changes, epibiotic coverage, and pregnancy-related body-shape cues should be annotated using predefined rules, quality classes, and repeatability checks. Automated or semi-automated lesion and pregnancy detection should report segmentation uncertainty, annotator agreement, false positives, false negatives, and failure cases under glare, foam, partial submergence, and low contrast. Without these controls, visual signs risk being converted into health claims without adequate biological validation.
Overall, UAS-based morphometrics and health assessment are among the most mature application areas in cetacean drone research, but maturity is uneven. Calibrated photogrammetry of large whales has reached a relatively high level of methodological reliability, whereas automated health classification, cross-species transfer, small-cetacean morphometrics, and diagnostic interpretation remain less mature. The field should therefore distinguish measurement readiness from biological-inference readiness. A workflow may accurately measure body length yet remain weak for inferring health, pregnancy, survival, or energetic condition if calibration, life-history context, and uncertainty propagation are absent. Compared with biopsy- or capture-based health assessment, UAS photogrammetry trades physiological depth for non-invasiveness, repeatability, and population-scale coverage; compared with satellite imagery, it trades spatial coverage for the resolution required for individual-level condition indices. Figure 6 summarizes the acquisition-to-health-inference workflow.

4.4. Behavioral Monitoring and Disturbance Assessment

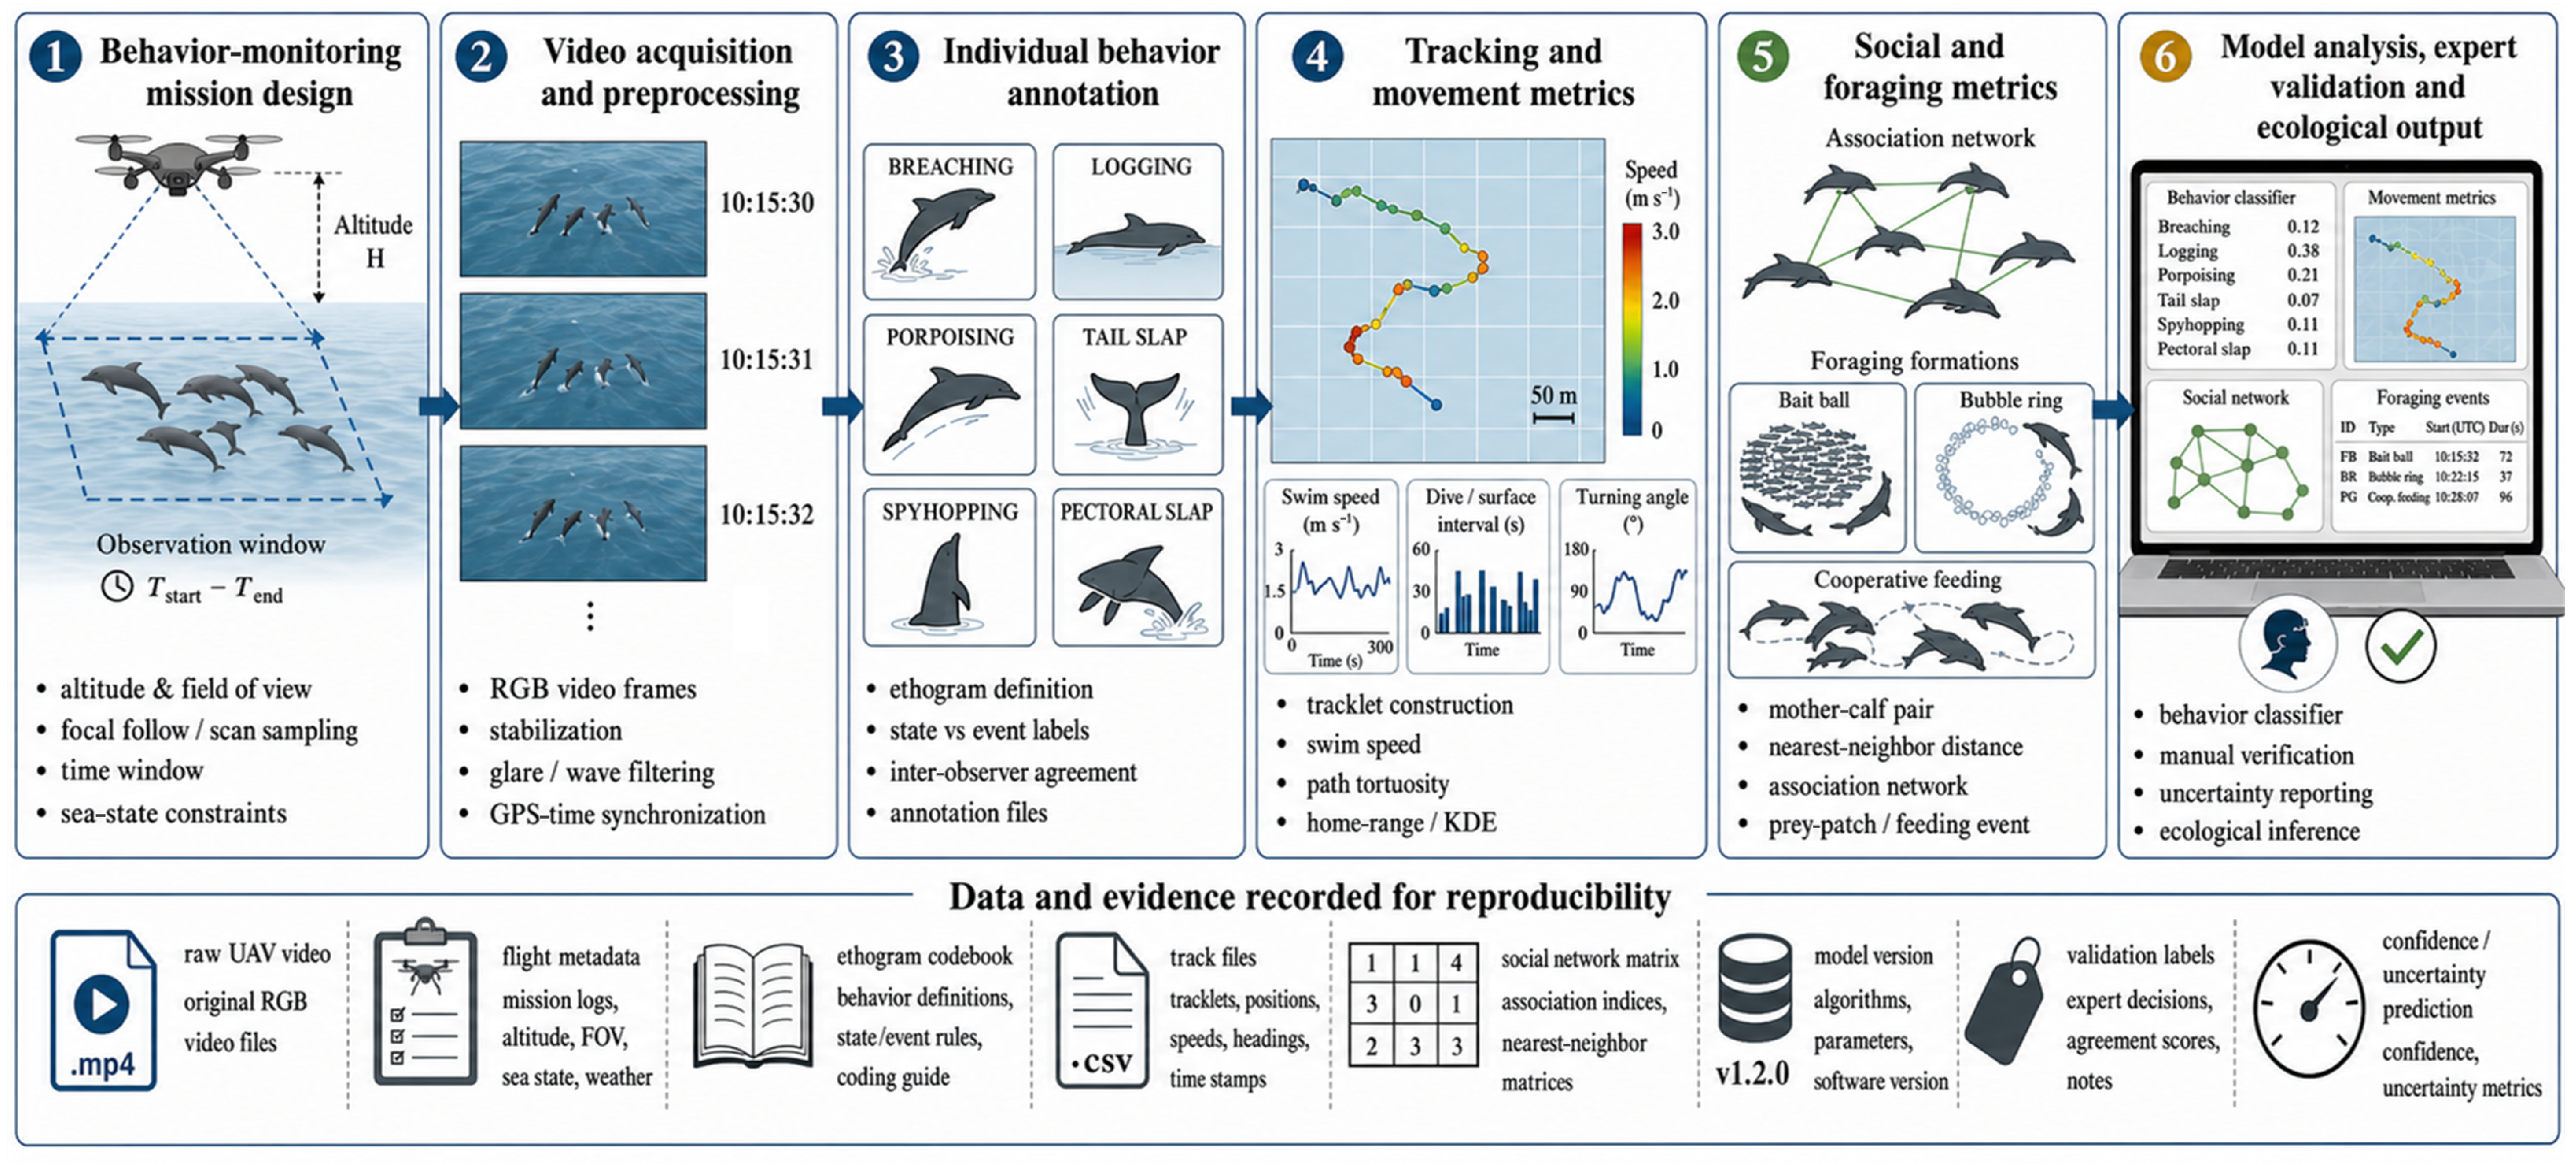
UAS provide an overhead perspective distinct from vessel and shore-based observation, making them useful for behavioral ecology when the behavioral state is visible at or near the surface. They can record group configuration, inter-individual distance, relative bearing, heading, surfacing rhythm, movement tracks, and short behavioral transitions, creating an auditable visual record [46,74]. These variables support studies of foraging, social interaction, mother–calf behavior, habitat use, and disturbance response, but they should be interpreted as surface-visible proxies rather than complete behavioral records. Figure 7 summarizes this behavioral-analysis workflow.

4.4.1. Fine-Scale Analysis of Foraging

Fine-scale foraging analysis was one of the earliest behavioral applications of UAS observation. Torres et al. [46] showed that UAS can record gray whale body rotation, lateral swimming, track change, and surface re-emergence during nearshore foraging, converting field descriptions into observable behavioral sequences. Fiori et al. [75] recorded social, resting, and traveling states of humpback whales in Tonga. Subsequent studies linked morphology, habitat use, and foraging tactics in gray whales [76] and documented context-dependent foraging in harbor porpoises [77]. Synchronized imagery, acoustics, and tracking can strengthen inference, as illustrated by drone observations of gray whale visual and acoustic behavior [78]. Deep, nocturnal, or fully submerged foraging cannot be inferred reliably from visible-light UAS imagery alone.

4.4.2. Social Interaction and Mother–Calf Behavior

Social-interaction research benefits from the capacity of UAS to record multiple individuals in a shared spatial frame. Overhead imagery supports analysis of escorting, synchrony, fission–fusion dynamics, group compactness, spacing, and positional roles. Hartman et al. [47] used continuous focal follows of male Risso’s dolphins to analyze sociality and group position; Morimura et al. [48] studied finless porpoise sociality; and Hill-Cousins et al. [79] analyzed synchronous male dolphin displays. Mother–calf behavior is relevant because resting, nursing, spacing, and escorting can affect calf energy balance and survival. Weir et al. [80] provided an aerial perspective on dusky dolphin mother–calf pairs; Ejrnæs and Sprogis [81] examined ontogenetic changes in resting behavior and energy expenditure of humpback whale mother–calf pairs; Jones et al. [82] characterized resting in a migration-corridor embayment; and Castro et al. [49] related calf proportion and group compactness in common dolphins.

4.4.3. Disturbance Response and Behavioral Quantification

UAS are both a recording platform and a potential disturbance source. From above, researchers can quantify the spatial relationship between cetaceans and external disturbance sources, including vessels, tourism, fisheries, construction, and sonar, by measuring approach distance, avoidance direction, path change, group compactness, response latency, and recovery duration [6,46]. Southall et al. [83] combined UAS photogrammetry, acoustics, and visual observation to assess common dolphin responses to naval sonar. UAS themselves can affect behavior: Fettermann et al. [84] found that bottlenose dolphin responses to multirotor UAS depend on altitude, group state, and context; Christiansen et al. [85] reported no detectable response by southern right whale mother–calf pairs under specific low-noise conditions; and Castro et al. [86] and Giles et al. [87] showed that sensitivity varies across species and behavioral states. Behavioral studies should therefore report platform type, altitude, approach profile, hover duration, acoustic context, group state, and ethogram definitions. AI-assisted behavior classification, such as that reported by Lauridsen et al. [88], is useful only when paired with manual audit, predefined labels, and transparent error reporting. Compared with shore- or vessel-based observation, overhead UAS video trades continuous long-duration coverage for fine-scale, geo-referenced measurement of spacing, movement, and surfacing rhythm; compared with biologging tags, it trades multi-day subsurface resolution for zero-attachment observation of surface-visible behavior.

4.5. Other Multimodal and Operational Applications

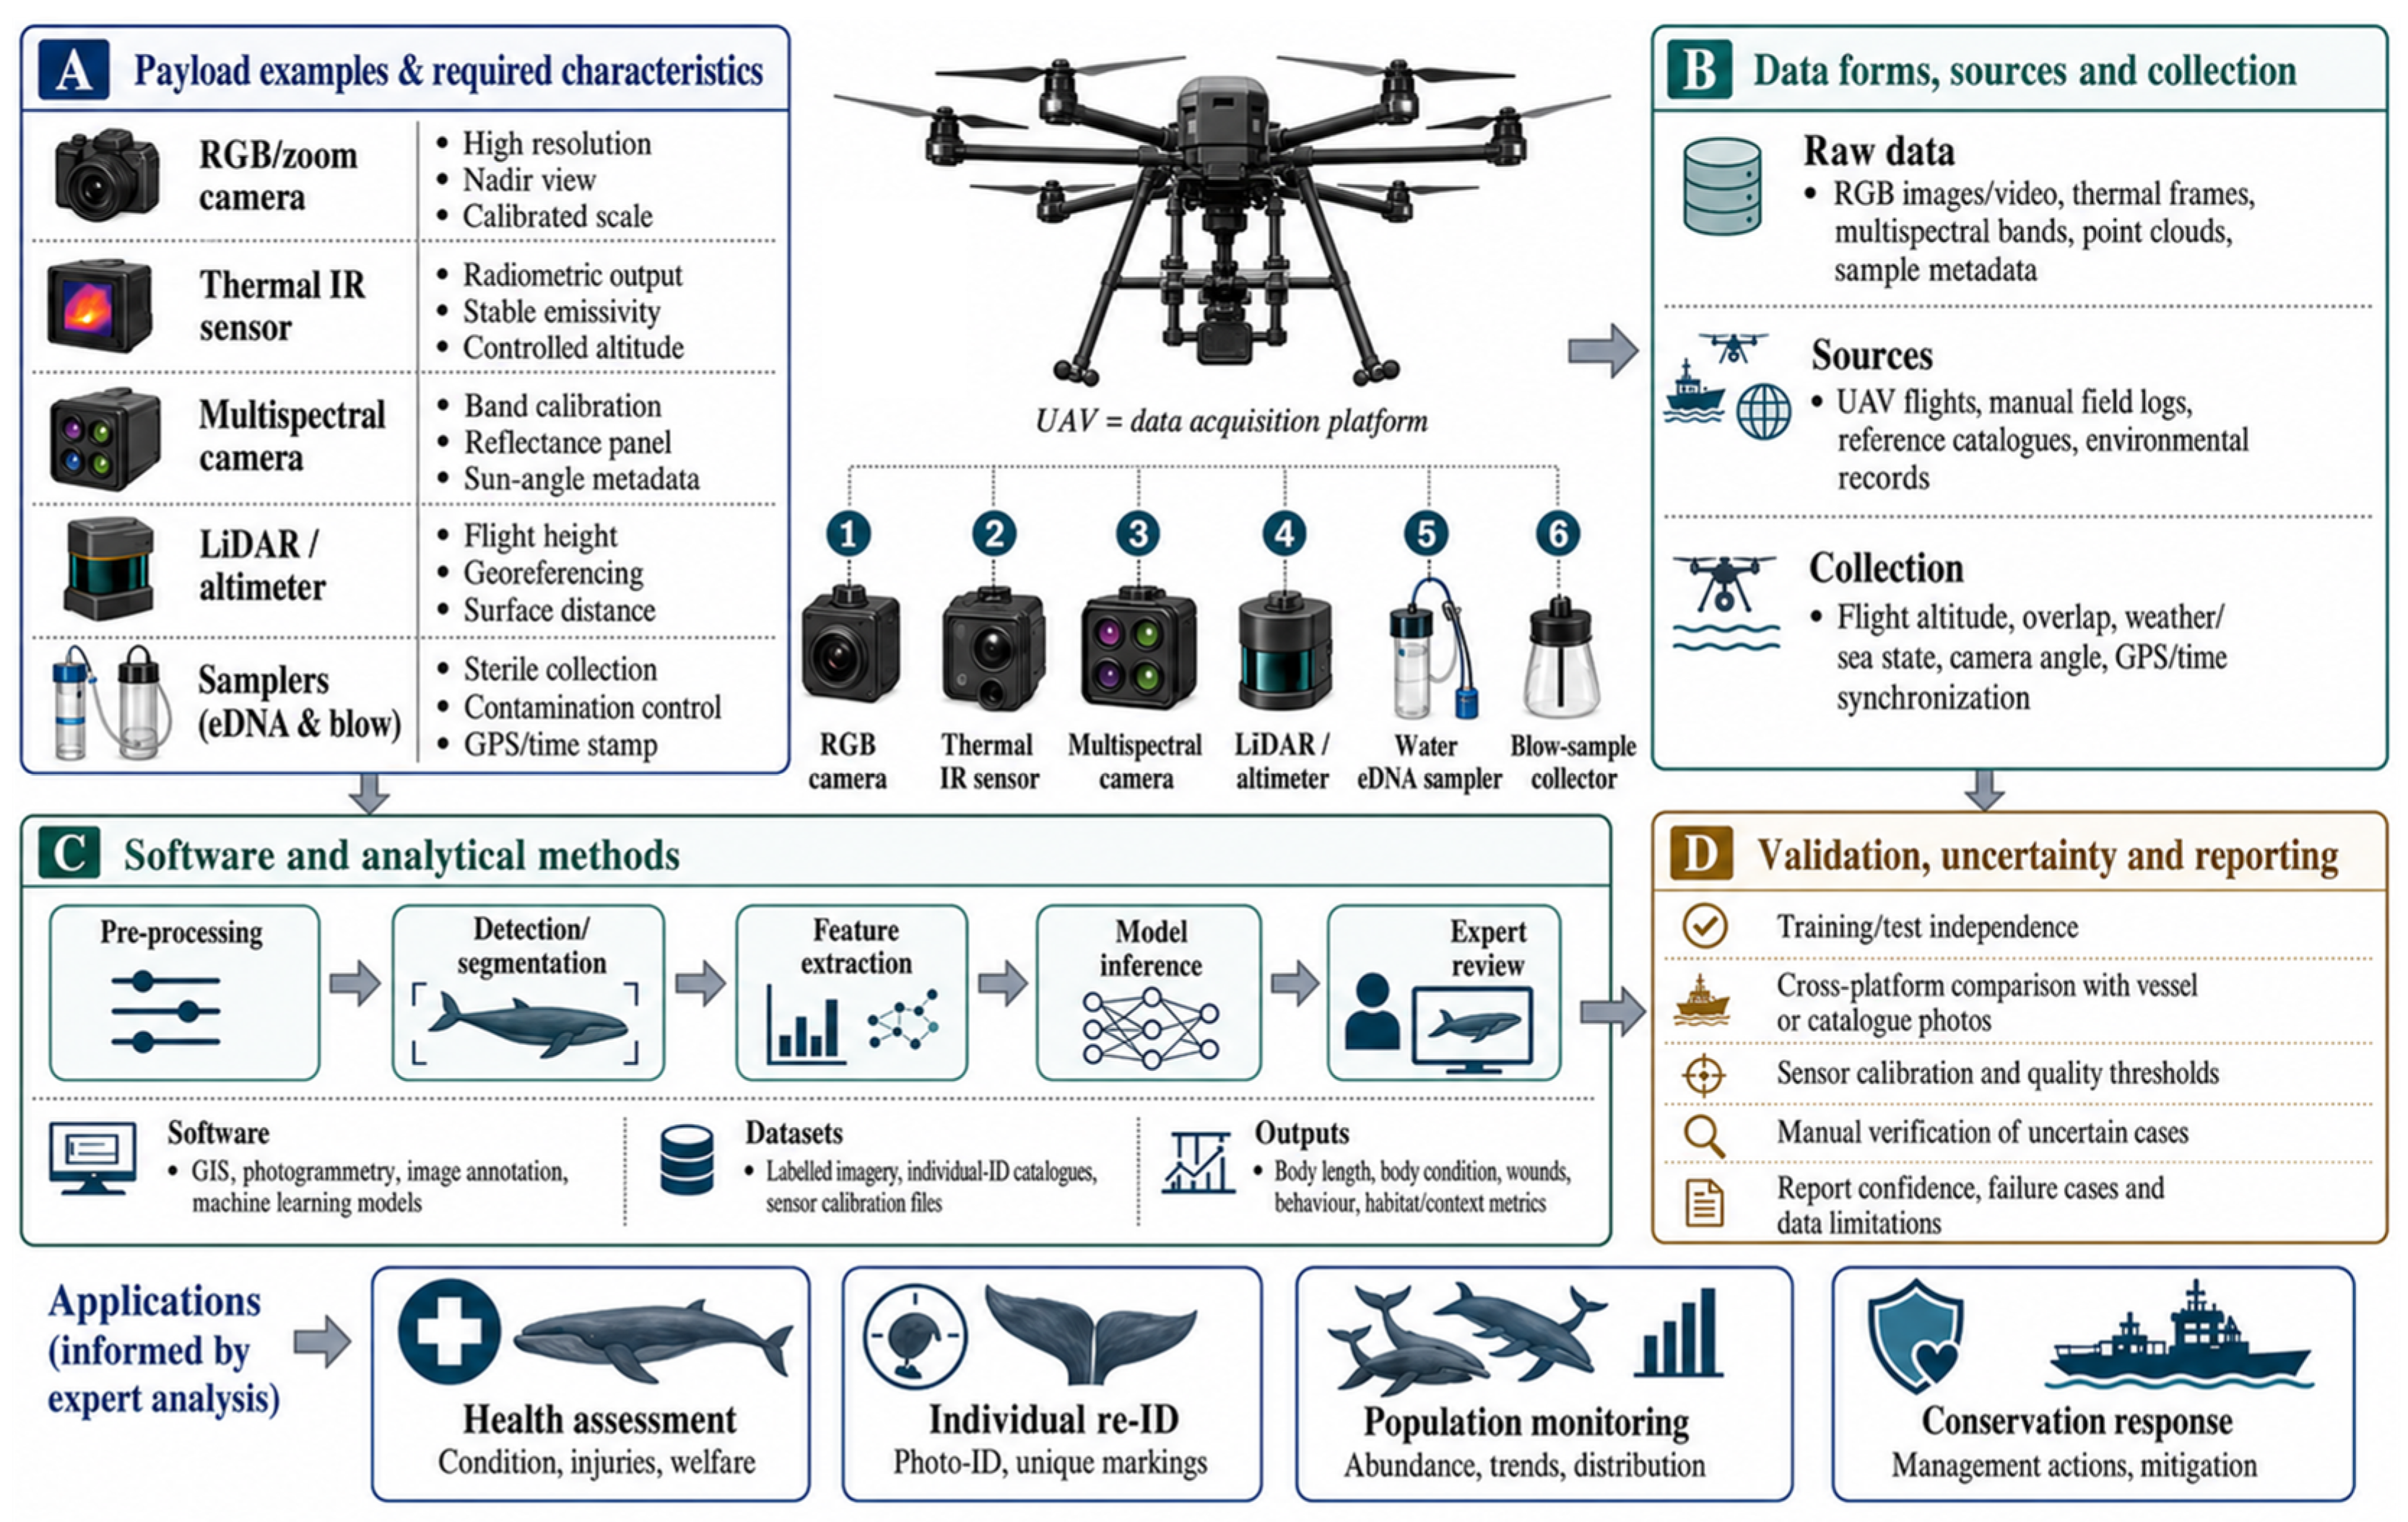
Beyond population survey, individual identification, morphometrics, and behavior, UAS are expanding into non-invasive health and molecular-ecological monitoring. Blow sampling allows researchers to collect respiratory microbiome or other biological material while limiting close vessel approach. Pirotta et al. [17] demonstrated low-cost UAS blow collection, Apprill et al. [18] identified a stable core microbiome in humpback whale blow, and Centelleghe et al. [50] extended blow-microbiome sampling to small cetaceans. These applications require contamination control, approach-angle documentation, rotor-wash awareness, sample-volume assessment, and metadata linking each sample to species, individual, group state, and environmental conditions. Thermal-infrared payloads provide another health-monitoring route: White et al. [51] used airborne thermography to monitor dolphin vital signs, although interpretation depends on emissivity, water-surface reflection, viewing angle, posture, ambient temperature, and humidity. In molecular ecology, Baker et al. [52] detected environmental DNA (eDNA) in whale wakes for species determination. These applications broaden UAS from an imaging platform into a targeted, non-invasive biological sampling and health-assessment system, but their outputs require validation against contamination, sensor, and environmental confounders. Figure 8 summarizes the resulting multimodal evidence-integration framework.
The payload assignments in Figure 8A follow from the observables required by each task. Abundance and distribution surveys require wide, nadir-looking RGB footprints with stable altitude and georeferencing, favoring lightweight mapping cameras on endurance-oriented platforms [14,15]; accordingly, Figure 8A pairs RGB/zoom cameras with high-resolution, nadir-view, calibrated-scale operation and LiDAR/altimeter units with flight-height, georeferencing, and surface-distance control. Individual identification and morphometrics require high ground-resolution detail at near-nadir posture, favoring high-resolution calibrated RGB payloads with precise altitude records [16,19]. Blow and wake sampling require low-altitude, low-rotor-wash approaches with sterile, remotely triggered collection devices [17,18,50], which Figure 8A specifies as sterile collection, contamination control, and GPS/time stamping for eDNA and blow samplers. Thermal-infrared payloads require radiometric calibration and sensitivity sufficient to detect small temperature contrasts at the water surface [51], reflected in the radiometric-output, stable-emissivity, and controlled-altitude requirements listed in Figure 8A, while multispectral cameras add band-calibration, reflectance-panel, and sun-angle metadata requirements for spectral work. In each case, payload mass, power draw, and environmental tolerance trade off against endurance, cost, and regulatory limits, so the configurations in Figure 8A should be read as evidence-linked task assignments rather than arbitrary equipment groupings (Table 5). The remaining panels situate these assignments within the end-to-end chain traced in this review—data forms, sources, and collection parameters (Figure 8B); software and analytical methods from pre-processing to expert review (Figure 8C); and validation, uncertainty, and reporting controls (Figure 8D)—through which payload outputs feed health assessment, individual re-identification, population monitoring, and conservation response.

5. Cross-Cutting Challenges

Platform and hardware constraints define the upper boundary of biological inference. Mainstream multirotor platforms used in marine research typically provide observation windows on the order of tens of minutes, and effective monitoring time is reduced by wind, salt spray, launch and recovery logistics, return-to-home margins, vessel motion, and disturbance-minimization standoff requirements [5,6,89]. Payload capacity constrains simultaneous deployment of high-resolution RGB cameras, thermal sensors, sampling devices, and precise-positioning or altitude sensors. These limits determine survey footprint, revisit interval, image quality, and ultimately the biological questions that can be answered.

5.1. Statistical Inference and Bias Propagation

The primary limitation is inferential rather than optical. Six core inferential constraints recur across the literature: availability bias [3,37], perception and image-quality bias [90], group-size error [13], measurement uncertainty [11,16,20,21,22], algorithmic-transfer bias [12,24,26,57,58], and disturbance-induced bias [84]. Table 6 summarizes these constraints in a condensed risk-control format.

5.2. Standardization Remains Insufficient

Studies differ in altitude, focal length, overlap, frame rate, posture criteria, sea-state thresholds, sun-glint handling, breaking-wave masking, sea-foam and whitecap treatment, calibration method, annotation rules, and uncertainty reporting. Consequently, values such as length, body-condition index, detection rate, re-identification match rate, or behavioral state are not always comparable across studies. Automated workflows add a further requirement: model performance should be reported with independent test data, survey-level data separation, sea-state and glare distribution, per-class metrics, false-positive and false-negative examples, and failure cases, especially when detections or classifications are used for ecological interpretation.

5.3. Ethics and Disturbance Minimization

UAS cetacean monitoring should minimize disturbance while preserving data quality. Studies should report disturbance-minimizing altitude or operating envelope, approach pattern, hover duration, group state, behavioral response, repeated exposure, and stop criteria for sensitive contexts such as breeding, nursing, resting, or repeated encounters. Because sensitivity varies across species and behavioral states, ethical operation must be evidence-based and species-specific rather than inferred from unrelated taxa or platforms.

5.4. Long-Term Monitoring Gap

Long-term monitoring remains the main gap between UAS case studies and management-relevant use. Repeated UAS measurements of gray whales, killer whales, and humpback whales demonstrate the value of body-condition and energy-accumulation data for detecting nutritional limitation, environmental stress, and reproductive consequences [43,69,70]. However, most studies remain project-oriented. Fragmented catalogues, limited data sharing, inconsistent annotation, and heterogeneous metadata restrict cross-population inference and prevent many datasets from being reused in management assessments.

6. Roadmap for Standardized UAS Cetacean Monitoring

A standardized UAS cetacean-monitoring workflow should begin with acquisition metadata. Each mission should record species, group composition, behavioral state, platform model, payload, lens, image resolution, frame rate, altitude sensor, flight speed, image overlap, sea state, sun glint, breaking waves, sea foam, whitecaps, wind, sun angle, launch platform, operating constraints, and observed behavioral response. These metadata define the conditions under which images, counts, measurements, and model outputs can be interpreted.
Annotation should be treated as a scientific measurement process. Counts, body landmarks, identities, tracks, lesions, pregnancy indicators, and behavioral states require predefined inclusion criteria, annotator identity, training procedures, and agreement metrics. Labels generated for computer-vision models should be versioned and linked to image-quality fields, including sea state, sun glint, breaking waves, sea foam, whitecaps, animal depth, and partial occlusion.
Analysis should explicitly separate observation products from inferred quantities. Counts are not abundance estimates, measurements are not body condition without biological calibration, detections are not individual identities without matching rules, and tracks are not behavior without ethogram definitions. Uncertainty from acquisition, annotation, calibration, and model output should be propagated into ecological interpretation.
Validation should be external to the data used for model fitting or workflow tuning. Abundance studies require repeated passes, surfacing or acoustic information, group-size correction, or another defensible availability adjustment. Morphometric and health studies require scale validation, posture filtering, repeated measurement, and biological calibration. Detection, tracking, and identification models require independent survey-level test sets and reporting of false positives, false negatives, and performance under adverse sea-surface conditions, including sun glint, breaking waves, sea foam, and whitecaps.
Data sharing should prioritize reusable ecological evidence rather than isolated images. Ethically governed repositories should include raw imagery where permissible, derived annotations, mission metadata, behavioral context, sea state, altitude, preprocessing decisions, validation splits, and catalogue linkage rules. Interoperable individual-identification, morphometric, and behavioral catalogues are necessary for cross-population and long-term monitoring.
Ethics and long-term integration should be embedded in the workflow rather than appended after data collection. Welfare-conscious operating envelopes should specify altitude, approach route, exposure duration, repeat-flight limits, and stop criteria for sensitive states. UAS data should be integrated with vessel, crewed-aircraft, acoustic, satellite, genetic, and biologging data so that high-resolution surface observations contribute to durable conservation inference rather than isolated case descriptions.
Indicative platform-payload configurations follow from the mission type (Table 5). For abundance and distribution surveys over large or dispersed populations, endurance-oriented fixed-wing or hybrid vertical-takeoff platforms carrying lightweight nadir RGB cameras may be appropriate, with altitude, footprint, overlap, and transect spacing set by detection-function requirements and local regulations [14,15]. For individual identification and morphometrics, multirotor platforms with high-resolution calibrated RGB cameras and precise altitude records are needed to obtain task-appropriate ground sampling distance and near-nadir measurement geometry [16,19]. For behavioral and disturbance studies, low-noise multirotors should record continuous video with predefined approach profiles and altitude floors matched to species sensitivity [84,85]. For blow or wake sampling, low-altitude multirotors carrying remotely triggered sterile samplers are used under strict contamination and disturbance controls [17,50]. Across all mission types, platform model, payload, altitude, ground sampling distance, speed, sea state, glare, and approach metadata should be logged as part of the observation product.

7. Limitations

Several caveats delimit the evidence map. First, coding was single-label in the primary synthesis; although all 242 records were independently re-coded by a second coder, showing high agreement for primary-domain assignment (Section 2.3), full multi-label independent coding would better capture cross-domain studies. Because no study-level extraction or coding table is supplied as Supplementary Material, auditability is limited to the stated search strategy, screening chain, fixed coding order, evidence and validation maturity definitions (Section 2.4), and summarized domain counts; these materials improve transparency but do not substitute for full release of record-level coding decisions. Second, the corpus includes records from 2026 only up to the export date of 23 June 2026, so 2026 was retained for corpus composition but excluded from complete-year trend interpretation. Third, the search was restricted to the Web of Science Core Collection and may under-represent Scopus-indexed records, gray literature, preprints, operational reports, and studies without English bibliographic metadata. Fourth, large baleen whales remain better represented than many small odontocetes, so domain-level generalizations may be weighted toward species that are easier to detect, measure, and follow from the air. These limitations require that domain counts be interpreted descriptively; cross-cutting conclusions about availability bias, validation, uncertainty propagation, and standardization are synthesis-level judgments.

8. Conclusions

UAS have expanded cetacean monitoring by making repeatable, high-resolution overhead observation more accessible. Their principal value is biological: they can support abundance and distribution monitoring, individual re-identification, body-condition assessment, health evaluation, behavior quantification, disturbance assessment, and targeted non-invasive sampling. Their limits are equally clear. Imagery is not inference; availability bias, perception bias, group-size error, measurement uncertainty, algorithmic-transfer bias, and disturbance-induced bias persist unless addressed through sampling design, auxiliary data, validation, and uncertainty reporting. UAS should therefore be understood as a high-resolution evidence node within an integrated cetacean-conservation toolkit, complementing vessel, crewed-aircraft, acoustic, satellite, genetic, and biologging evidence. The next stage of the field should prioritize standardized protocols, long-term biological monitoring, ethically governed datasets, and explicit linkage between UAS-derived observation products and management-relevant ecological inference.

Supplementary Materials

The following supporting information can be downloaded at: https://www.mdpi.com/article/10.3390/drones10090711/s1, VOSviewer keyword thesaurus used to harmonize author keywords for Figure 3. The UAS platform synonyms in the Supplementary Materials are harmonized to the bibliometric-map label “unmanned aerial systems” to preserve consistency with Figure 3; the manuscript narrative uses “unoccupied aerial systems” as the preferred term.

Author Contributions

Literature review, synthesis, investigation, and validation by W.R., J.Q., T.C. and F.W.; formal analysis, writing, review, editing, and visualization by F.W. and H.W.; project administration and funding acquisition by W.F. and S.Y. All authors have read and agreed to the published version of the manuscript.

Funding

This research was funded by the Central Public-Interest Scientific Institution Basal Research Fund, CAFS, grant number 2023TD89.

Institutional Review Board Statement

Not applicable.

Informed Consent Statement

Not applicable.

Data Availability Statement

The bibliographic records of the 242 retained records and additional review-audit materials are available from the corresponding author upon reasonable request.

Conflicts of Interest

Author Hepeng Wang was employed by Tianjin Tuyue Technology Co., Ltd. The remaining authors declare that the research was conducted in the absence of any commercial or financial relationships that could be construed as a potential conflict of interest.

References

  1. Roman, J.; Estes, J.A.; Morissette, L.; Smith, C.; Costa, D.; McCarthy, J.; Nation, J.; Nicol, S.; Pershing, A.; Smetacek, V. Whales as marine ecosystem engineers. Front. Ecol. Environ. 2014, 12, 377–385. [Google Scholar] [CrossRef] [Scilit]
  2. Moore, S.E. Marine mammals as ecosystem sentinels. J. Mammal. 2008, 89, 534–540. [Google Scholar] [CrossRef] [Scilit]
  3. Hammond, P.S.; Francis, T.B.; Heinemann, D.; Long, K.J.; Moore, J.E.; Punt, A.E.; Reeves, R.R.; Sepúlveda, M.; Sigurðsson, G.M.; Siple, M.C.; et al. Estimating the abundance of marine mammal populations. Front. Mar. Sci. 2021, 8, 735770. [Google Scholar] [CrossRef] [Scilit]
  4. Nowacek, S.M.; Wells, R.S.; Solow, A.R. Short-term effects of boat traffic on bottlenose dolphins, Tursiops truncatus, in Sarasota Bay, Florida. Mar. Mammal Sci. 2001, 17, 673–688. [Google Scholar] [CrossRef] [Scilit]
  5. Fiori, L.; Doshi, A.; Martinez, E.; Orams, M.B.; Bollard-Breen, B. The use of unmanned aerial systems in marine mammal research. Remote Sens. 2017, 9, 543. [Google Scholar] [CrossRef] [Scilit]
  6. Johnston, D.W. Unoccupied aircraft systems in marine science and conservation. Annu. Rev. Mar. Sci. 2019, 11, 439–463. [Google Scholar] [CrossRef] [Scilit] [PubMed]
  7. Sasse, D.B. Job-related mortality of wildlife workers in the United States, 1937–2000. Wildl. Soc. Bull. 2003, 31, 1015–1020. [Google Scholar]
  8. Álvarez-González, M.; Suarez-Bregua, P.; Pierce, G.J.; Saavedra, C. Unmanned aerial vehicles (UAVs) in marine mammal research: A review of current applications and challenges. Drones 2023, 7, 667. [Google Scholar] [CrossRef] [Scilit]
  9. Page, M.J.; McKenzie, J.E.; Bossuyt, P.M.; Boutron, I.; Hoffmann, T.C.; Mulrow, C.D.; Shamseer, L.; Tetzlaff, J.M.; Akl, E.A.; Brennan, S.E.; et al. The PRISMA 2020 statement: An updated guideline for reporting systematic reviews. BMJ 2021, 372, n71. [Google Scholar] [CrossRef] [Scilit] [PubMed]
  10. Page, M.J.; Moher, D.; Bossuyt, P.M.; Boutron, I.; Hoffmann, T.C.; Mulrow, C.D.; Shamseer, L.; Tetzlaff, J.M.; Akl, E.A.; Brennan, S.E.; et al. PRISMA 2020 explanation and elaboration: Updated guidance and exemplars for reporting systematic reviews. BMJ 2021, 372, n160. [Google Scholar] [CrossRef] [PubMed]
  11. Durban, J.W.; Fearnbach, H.; Barrett-Lennard, L.G.; Perryman, W.L.; Leroi, D.J. Photogrammetry of killer whales using a small hexacopter launched at sea. J. Unmanned Veh. Syst. 2015, 3, 131–135. [Google Scholar] [CrossRef] [Scilit]
  12. Gray, P.C.; Bierlich, K.C.; Mantell, S.A.; Friedlaender, A.S.; Goldbogen, J.A.; Johnston, D.W. Drones and convolutional neural networks facilitate automated and accurate cetacean species identification and photogrammetry. Methods Ecol. Evol. 2019, 10, 1490–1500. [Google Scholar] [CrossRef] [Scilit]
  13. Brown, A.M.; Allen, S.J.; Kelly, N.; Hodgson, A.J. Using unoccupied aerial vehicles to estimate availability and group size error for aerial surveys of coastal dolphins. Remote Sens. Ecol. Conserv. 2023, 9, 340–353. [Google Scholar] [CrossRef] [Scilit]
  14. Angliss, R.P.; Ferguson, M.C.; Hall, P.; Helker, V.; Kennedy, A.; Sformo, T. Comparing manned to unmanned aerial surveys for cetacean monitoring in the Arctic: Methods and operational results. J. Unmanned Veh. Syst. 2018, 6, 109–127. [Google Scholar] [CrossRef] [Scilit]
  15. Ferguson, M.C.; Angliss, R.P.; Kennedy, A.; Lynch, B.; Willoughby, A.; Helker, V.; Brower, A.A.; Clarke, J.T. Performance of manned and unmanned aerial surveys to collect visual data and imagery for estimating Arctic cetacean density and associated uncertainty. J. Unmanned Veh. Syst. 2018, 6, 128–154. [Google Scholar] [CrossRef] [Scilit]
  16. Christiansen, F.; Sironi, M.; Moore, M.J.; Di Martino, M.; Ricciardi, M.; Warick, H.A.; Irschick, D.J.; Gutierrez, R.; Uhart, M.M. Estimating body mass of free-living whales using aerial photogrammetry and 3D volumetrics. Methods Ecol. Evol. 2019, 10, 2034–2044. [Google Scholar] [CrossRef] [Scilit]
  17. Pirotta, V.; Smith, A.; Ostrowski, M.; Russell, D.; Jonsen, I.D.; Grech, A.; Harcourt, R. An economical custom-built drone for assessing whale health. Front. Mar. Sci. 2017, 4, 425. [Google Scholar] [CrossRef] [Scilit]
  18. Apprill, A.; Miller, C.A.; Moore, M.J.; Durban, J.W.; Fearnbach, H.; Barrett-Lennard, L.G. Extensive core microbiome in drone-captured whale blow supports a framework for health monitoring. mSystems 2017, 2, e00119-17. [Google Scholar] [CrossRef] [Scilit] [PubMed]
  19. Bierlich, K.C.; Karki, S.; Bird, C.N.; Fern, A.; Torres, L.G. Automated body length and body condition measurements of whales from drone videos for rapid assessment of population health. Mar. Mammal Sci. 2024, 40, e13137. [Google Scholar] [CrossRef] [Scilit]
  20. Bierlich, K.C.; Hewitt, J.; Bird, C.N.; Johnston, D.W.; Dale, J.; Pirotta, E.; Schick, R.S.; Stewart, J.D.; New, L.; Chimienti, E.; et al. A workflow of open-source tools for drone-based photogrammetry of marine megafauna. PeerJ 2025, 13, e19768. [Google Scholar] [CrossRef] [Scilit] [PubMed]
  21. Dawson, S.M.; Bowman, M.H.; Leunissen, E.; Sirguey, P. Inexpensive aerial photogrammetry for studies of whales and large marine animals. Front. Mar. Sci. 2017, 4, 366, Corrigendum in Front. Mar. Sci. 2018, 5, 438. [Google Scholar] [CrossRef] [Scilit]
  22. Burnett, J.D.; Lemos, L.; Barlow, D.; Wing, M.G.; Chandler, T.; Torres, L.G. Estimating morphometric attributes of baleen whales with photogrammetry from small UASs: A case study with blue and gray whales. Mar. Mammal Sci. 2019, 35, 108–139. [Google Scholar] [CrossRef] [Scilit]
  23. van Eck, N.J.; Waltman, L. Software survey: VOSviewer, a computer program for bibliometric mapping. Scientometrics 2010, 84, 523–538. [Google Scholar] [CrossRef] [Scilit] [PubMed]
  24. Alsaidi, M.; Al-Jassani, M.G.; Bang, C.; O’Corry-Crowe, G.; Watt, C.; Ghazal, M.; Zhuang, H. Localization and tracking of beluga whales in aerial video using deep learning. Front. Mar. Sci. 2024, 11, 1445698. [Google Scholar] [CrossRef] [Scilit]
  25. Bagchi, C.; Medina, J.; Irschick, D.J.; Maji, S.; Christiansen, F. Automated extraction of right whale morphometric data from drone aerial photographs. Remote Sens. Ecol. Conserv. 2025, 11, 438–453. [Google Scholar] [CrossRef] [Scilit]
  26. Ptak, B.; Midtiby, H.S.; Kraft, M. Improving consistency of marine mammals tracking in challenging drone recordings through visual particle filter integration. Neurocomputing 2025, 646, 130503. [Google Scholar] [CrossRef] [Scilit]
  27. Bigal, E.; Galili, O.; van Rijn, I.; Rosso, M.; Cleguer, C.; Hodgson, A.; Scheinin, A.; Tchernov, D. Reduction of species identification errors in surveys of marine wildlife abundance utilising unoccupied aerial vehicles (UAVs). Remote Sens. 2022, 14, 4118. [Google Scholar] [CrossRef] [Scilit]
  28. Oliveira-da-Costa, M.; Marmontel, M.; da-Rosa, D.S.X.; Coelho, A.; Wich, S.; Mosquera-Guerra, F.; Trujillo, F. Effectiveness of unmanned aerial vehicles to detect Amazon dolphins. Oryx 2020, 54, 696–698. [Google Scholar] [CrossRef] [Scilit]
  29. Bröker, K.C.A.; Hansen, R.G.; Leonard, K.E.; Koski, W.R.; Heide-Jørgensen, M.P. A comparison of image and observer based aerial surveys of narwhal. Mar. Mammal Sci. 2019, 35, 1253–1279. [Google Scholar] [CrossRef] [Scilit]
  30. Stewart, J.B.; Hudson, J.M.; Sherbo, B.A.H.; Watt, C.A. Estimating beluga whale abundance from space: Using drones to ground-validate VHR satellite imagery. Remote Sens. Ecol. Conserv. 2024, 10, 673–685. [Google Scholar] [CrossRef] [Scilit]
  31. Fettermann, T.; Fiori, L.; Gillman, L.; Stockin, K.; Bollard, B. Drone surveys are more accurate than boat-based surveys of bottlenose dolphins (Tursiops truncatus). Drones 2022, 6, 82. [Google Scholar] [CrossRef] [Scilit]
  32. Giacomo, A.B.D.; Barreto, J.; Teixeira, J.B.; Oliveira, L.; Cajaíba, L.; Joyeux, J.-C.; Barcelos, N.; Martins, A.S. Using drones and ROV to assess the vulnerability of marine megafauna to the Fundão tailings dam collapse. Sci. Total Environ. 2021, 800, 149302. [Google Scholar] [CrossRef] [Scilit] [PubMed]
  33. Colefax, A.P.; Butcher, P.A.; Pagendam, D.E.; Kelaher, B.P. Reliability of marine faunal detections in drone-based monitoring. Ocean Coast. Manag. 2019, 174, 108–115. [Google Scholar] [CrossRef] [Scilit]
  34. Kelaher, B.P.; Colefax, A.P.; Tagliafico, A.; Bishop, M.J.; Giles, A.; Butcher, P.A. Assessing variation in assemblages of large marine fauna off ocean beaches using drones. Mar. Freshw. Res. 2020, 71, 68–77. [Google Scholar] [CrossRef] [Scilit]
  35. Hodgson, A.; Kelly, N.; Peel, D. Unmanned aerial vehicles (UAVs) for surveying marine fauna: A dugong case study. PLoS ONE 2013, 8, e79556. [Google Scholar] [CrossRef] [Scilit] [PubMed]
  36. Hodgson, A.; Peel, D.; Kelly, N. Unmanned aerial vehicles for surveying marine fauna: Assessing detection probability. Ecol. Appl. 2017, 27, 1253–1267. [Google Scholar] [CrossRef] [Scilit] [PubMed]
  37. Buckland, S.T.; Anderson, D.R.; Burnham, K.P.; Laake, J.L.; Borchers, D.L.; Thomas, L. Introduction to Distance Sampling: Estimating Abundance of Biological Populations; Oxford University Press: Oxford, UK, 2001. [Google Scholar] [CrossRef] [Scilit]
  38. Heide-Jørgensen, M.P.; Laidre, K.L. Surfacing time, availability bias and abundance of humpback whales in West Greenland. J. Cetacean Res. Manag. 2015, 15, 1–8. [Google Scholar] [CrossRef] [Scilit]
  39. Degollada, E.; Amigó, N.; O’Callaghan, S.; Varola, M.; Ruggero, K.; Tort, B. A novel technique for photo-identification of the fin whale, Balaenoptera physalus, as determined by drone aerial images. Drones 2023, 7, 220. [Google Scholar] [CrossRef] [Scilit]
  40. O’Callaghan, S.A.; Al Abbar, F.; Costa, H.; Prieto, R.; Gammell, M.; O’Brien, J. Aerial photo-identification of sperm whales (Physeter macrocephalus). Aquat. Mamm. 2024, 50, 479–494. [Google Scholar] [CrossRef] [Scilit]
  41. Ryan, K.P.; Ferguson, S.H.; Koski, W.R.; Young, B.G.; Roth, J.D.; Watt, C.A. Use of drones for the creation and development of a photographic identification catalogue for an endangered whale population. Arct. Sci. 2022, 8, 1191–1201. [Google Scholar] [CrossRef] [Scilit]
  42. Bogucki, R.; Cygan, M.; Khan, C.B.; Klimek, M.; Milczek, J.K.; Mucha, M. Applying deep learning to right whale photo identification. Conserv. Biol. 2019, 33, 676–684. [Google Scholar] [CrossRef] [Scilit] [PubMed]
  43. Bierlich, K.C.; Hewitt, J.; Schick, R.S.; Pallin, L.; Dale, J.; Friedlaender, A.S.; Christiansen, F.; Sprogis, K.R.; Dawn, A.H.; Bird, C.N.; et al. Seasonal gain in body condition of foraging humpback whales along the Western Antarctic Peninsula. Front. Mar. Sci. 2022, 9, 1036860. [Google Scholar] [CrossRef] [Scilit]
  44. Pirotta, E.; Bierlich, K.C.; New, L.; Hildebrand, L.; Bird, C.N.; Fernandez Ajó, A.; Torres, L.G. Modeling individual growth reveals decreasing gray whale body length and correlations with ocean climate indices at multiple scales. Glob. Change Biol. 2024, 30, e17366. [Google Scholar] [CrossRef] [Scilit] [PubMed]
  45. Stewart, J.D.; Durban, J.W.; Knowlton, A.R.; Lynn, M.S.; Fearnbach, H.; Barbaro, J.; Perryman, W.L.; Miller, C.A.; Moore, M.J. Decreasing body lengths in North Atlantic right whales. Curr. Biol. 2021, 31, 3174–3179.e3. [Google Scholar] [CrossRef] [Scilit] [PubMed]
  46. Torres, L.G.; Nieukirk, S.L.; Lemos, L.; Chandler, T.E. Drone up! Quantifying whale behavior from a new perspective improves observational capacity. Front. Mar. Sci. 2018, 5, 319. [Google Scholar] [CrossRef] [Scilit]
  47. Hartman, K.; van der Harst, P.; Vilela, R. Continuous focal group follows operated by a drone enable analysis of the relation between sociality and position in a group of male Risso’s dolphins (Grampus griseus). Front. Mar. Sci. 2020, 7, 283. [Google Scholar] [CrossRef] [Scilit]
  48. Morimura, N.; Itahara, A.; Brooks, J.; Mori, Y.; Piao, Y.; Hashimoto, H.; Mizumoto, I. A drone study of sociality in the finless porpoise Neophocaena asiaeorientalis in the Ariake Sound, Japan. Drones 2023, 7, 422. [Google Scholar] [CrossRef] [Scilit]
  49. Castro, J.; Cid, A.; Quirin, A.; Matos, F.L.; Rosa, R.; Pearson, H.C. Assessing the dynamics of common dolphin (Delphinus delphis) mother-calf pairs along the south coast of Portugal using unmanned aerial vehicles. Mar. Mammal Sci. 2024, 40, e13115. [Google Scholar] [CrossRef] [Scilit]
  50. Centelleghe, C.; Carraro, L.; Gonzalvo, J.; Rosso, M.; Esposti, E.; Gili, C.; Bonato, M.; Pedrotti, D.; Cardazzo, B.; Povinelli, M.; et al. The use of unmanned aerial vehicles (UAVs) to sample the blow microbiome of small cetaceans. PLoS ONE 2020, 15, e0235537, Correction in PLoS ONE 2021, 16, e0246177. [Google Scholar] [CrossRef] [Scilit] [PubMed]
  51. White, C.; Colefax, A.P.; Parra, G.J. Using drone-based infrared thermography for monitoring vital signs in dolphins. J. Therm. Biol. 2026, 135, 104353. [Google Scholar] [CrossRef] [Scilit] [PubMed]
  52. Baker, C.S.; Steel, D.; Nieukirk, S.; Klinck, H. Environmental DNA (eDNA) from the wake of the whales: Droplet digital PCR for detection and species identification. Front. Mar. Sci. 2018, 5, 133. [Google Scholar] [CrossRef] [Scilit]
  53. Elliser, C.R.; van der Linde, K.; MacIver, K. Adapting photo-identification methods to study poorly marked cetaceans: A case study for common dolphins and harbor porpoises. Mammal. Biol. 2022, 102, 811–827. [Google Scholar] [CrossRef] [Scilit]
  54. Machado, A.M.S.; Cantor, M. A simple tool for linking photo-identification with multimedia data to track mammal behaviour. Mamm. Biol. 2022, 102, 983–993, Correction in Mamm. Biol. 2022, 102, 1045. [Google Scholar] [CrossRef] [Scilit]
  55. Renò, V.; Losapio, G.; Forenza, F.; Politi, T.; Stella, E.; Fanizza, C.; Hartman, K.; Carlucci, R.; Dimauro, G.; Maglietta, R. Combined color semantics and deep learning for the automatic detection of dolphin dorsal fins. Electronics 2020, 9, 758. [Google Scholar] [CrossRef] [Scilit]
  56. Chien, T.-Y.; Chen, C.-F.; Chen, Z.-Y. Study of Taiwanese white dolphins detection and tracking techniques by utilizing autonomous unmanned aerial vehicles. In Proceedings of the OCEANS 2022, Hampton Roads, VA, USA, 17–20 October 2022; pp. 1–10. [Google Scholar] [CrossRef] [Scilit]
  57. Canelas, J.; Clementino, L.; Cid, A.; Castro, J.; Machado, I.; Vieira, S. Automated cetacean detection in UAV imagery using AI models: A case study on Delphinid species. Int. J. Data Sci. Anal. 2025, 20, 3965–3979. [Google Scholar] [CrossRef] [Scilit]
  58. Rodofili, E.N.; Lecours, V.; LaRue, M. Remote sensing techniques for automated marine mammals detection: A review of methods and current challenges. PeerJ 2022, 10, e13540. [Google Scholar] [CrossRef] [Scilit] [PubMed]
  59. Christie, A.I.; Colefax, A.P.; Cagnazzi, D. Feasibility of using small UAVs to derive morphometric measurements of Australian snubfin (Orcaella heinsohni) and humpback (Sousa sahulensis) dolphins. Remote Sens. 2022, 14, 21. [Google Scholar] [CrossRef] [Scilit]
  60. de Oliveira, L.L.; Andriolo, A.; Cremer, M.J.; Zerbini, A.N. Aerial photogrammetry techniques using drones to estimate morphometric measurements and body condition in South American small cetaceans. Mar. Mammal Sci. 2023, 39, 811–829. [Google Scholar] [CrossRef] [Scilit]
  61. Irschick, D.J.; Martin, J.; Siebert, U.; Kristensen, J.H.; Madsen, P.T.; Christiansen, F. Creation of accurate 3D models of harbor porpoises (Phocoena phocoena) using 3D photogrammetry. Mar. Mammal Sci. 2021, 37, 482–491. [Google Scholar] [CrossRef] [Scilit]
  62. Rio, R. Pediatric drone: Estimating morphometric measurements in spinner dolphin (Stenella longirostris) calves based on aerial photogrammetry. Mar. Mammal Sci. 2025, 41, e13185. [Google Scholar] [CrossRef] [Scilit]
  63. Christiansen, F.; Sprogis, K.R.; Gross, J.; Castrillon, J.; Warick, H.A.; Leunissen, E.; Bengtson Nash, S. Variation in outer blubber lipid concentrations does not reflect morphological body condition in humpback whales. J. Exp. Biol. 2020, 223, jeb213769. [Google Scholar] [CrossRef] [Scilit] [PubMed]
  64. Soledade Lemos, L.; Burnett, J.D.; Chandler, T.E.; Sumich, J.L.; Torres, L.G. Intra- and inter-annual variation in gray whale body condition on a foraging ground. Ecosphere 2020, 11, e03094. [Google Scholar] [CrossRef] [Scilit]
  65. Burslem, A.; Isojunno, S.; Prieto, R.; Silva, M.A.; Miller, P.J.O. Estimating total body lipid store of free-ranging whales in vivo using drone photogrammetry and biologging tags. Ecol. Evol. 2025, 15, e72472. [Google Scholar] [CrossRef] [Scilit] [PubMed]
  66. Christiansen, F.; Gregory, E.A.; Sprogis, K.R. Starvation threshold and fasting endurance of right whales. Mar. Ecol. Prog. Ser. 2025, 768, 99–118. [Google Scholar] [CrossRef] [Scilit]
  67. Christiansen, F.; Vivier, F.; Charlton, C.; Ward, R.; Amerson, A.; Burnell, S.; Bejder, L. Maternal body size and condition determine calf growth rates in southern right whales. Mar. Ecol. Prog. Ser. 2018, 592, 267–281. [Google Scholar] [CrossRef] [Scilit]
  68. van Aswegen, M.; Szabo, A.; Currie, J.J.; Stack, S.H.; Evans, L.; Straley, J.; Neilson, J.; Gabriele, C.; Cates, K.; Steel, D.; et al. Maternal investment, body condition and calf growth in humpback whales. J. Physiol. 2025, 603, 551–578. [Google Scholar] [CrossRef] [Scilit] [PubMed]
  69. Stewart, J.D.; Durban, J.W.; Fearnbach, H.; Barrett-Lennard, L.G.; Casler, P.K.; Ward, E.J.; Dapp, D.R. Survival of the fattest: Linking body condition to prey availability and survivorship of killer whales. Ecosphere 2021, 12, e03660. [Google Scholar] [CrossRef] [Scilit]
  70. Christiansen, F.; Rodríguez-González, F.; Martínez-Aguilar, S.; Urbán, J.; Swartz, S.; Warick, H.; Vivier, F.; Bejder, L. Poor body condition associated with an unusual mortality event in gray whales. Mar. Ecol. Prog. Ser. 2021, 658, 237–252. [Google Scholar] [CrossRef] [Scilit]
  71. Cheney, B.J.; Dale, J.; Thompson, P.M.; Quick, N.J. Spy in the sky: A method to identify pregnant small cetaceans. Remote Sens. Ecol. Conserv. 2022, 8, 492–505. [Google Scholar] [CrossRef] [Scilit]
  72. Leslie, M.S.; Kant, L.; Perkins-Taylor, C.; Van Bressem, M.-F.; Minton, G.; MacDonald, D.; Christiansen, F.; Willson, M.S.; Collins, T.; Baldwin, R.; et al. Remote and non-invasive quantification of “tattoo skin disease-like” dermatopathy in endangered Arabian Sea humpback whales using drone photography. Mammal. Biol. 2022, 102, 1605–1617. [Google Scholar] [CrossRef] [Scilit]
  73. Ten, S.; Konishi, K.; Raga, J.A.; Pastene, L.A.; Aznar, F.J. Epibiotic fauna of the Antarctic minke whale as a reliable indicator of seasonal movements. Sci. Rep. 2022, 12, 22214. [Google Scholar] [CrossRef] [Scilit] [PubMed]
  74. Nowacek, D.P.; Christiansen, F.; Bejder, L.; Goldbogen, J.A.; Friedlaender, A.S. Studying cetacean behaviour: New technological approaches and conservation applications. Anim. Behav. 2016, 120, 235–244. [Google Scholar] [CrossRef] [Scilit]
  75. Fiori, L.; Martinez, E.; Bader, M.K.F.; Orams, M.B.; Bollard, B. Insights into the use of an unmanned aerial vehicle (UAV) to investigate the behavior of humpback whales (Megaptera novaeangliae) in Vava’u, Kingdom of Tonga. Mar. Mammal Sci. 2020, 36, 209–223. [Google Scholar] [CrossRef] [Scilit]
  76. Bird, C.N.; Pirotta, E.; New, L.; Bierlich, K.C.; Donnelly, M.; Hildebrand, L.; Fernandez Ajó, A.; Torres, L.G. Growing into it: Evidence of an ontogenetic shift in grey whale use of foraging tactics. Anim. Behav. 2024, 214, 121–135. [Google Scholar] [CrossRef] [Scilit]
  77. Stedt, J.; Hamel, H.; Torres Ortiz, S.; Højer Kristensen, J.; Wahlberg, M. Harbour porpoises are flexible predators displaying context-dependent foraging behaviours. Ecol. Evol. 2024, 14, e70671. [Google Scholar] [CrossRef] [Scilit]
  78. Frouin-Mouy, H.; Tenorio-Hallé, L.; Thode, A.; Swartz, S.; Urbán, J. Using two drones to simultaneously monitor visual and acoustic behaviour of gray whales (Eschrichtius robustus) in Baja California, Mexico. J. Exp. Mar. Biol. Ecol. 2020, 525, 151321. [Google Scholar] [CrossRef] [Scilit]
  79. Hill-Cousins, S.; Chereskin, E.; Allen, S.J.; Connor, R.C.; Krützen, M.; Papageorgiou, D.; King, S.L. Allied male dolphins use synchronous displays to strengthen social bonds in a cooperative context. Mov. Ecol. 2025, 13, 84. [Google Scholar] [CrossRef] [Scilit] [PubMed]
  80. Weir, J.S.; Fiori, L.; Orbach, D.N.; Piwetz, S.; Protheroe, C.; Würsig, B. Dusky dolphin (Lagenorhynchus obscurus) mother-calf pairs: An aerial perspective. Aquat. Mamm. 2018, 44, 603–607. [Google Scholar] [CrossRef] [Scilit]
  81. Ejrnæs, D.D.; Sprogis, K.R. Ontogenetic changes in energy expenditure and resting behaviour of humpback whale mother-calf pairs examined using unmanned aerial vehicles. Wildl. Res. 2022, 49, 34–45. [Google Scholar] [CrossRef] [Scilit]
  82. Jones, A.; Bruce, E.; Cato, D.H. Characterising resting patterns of mother-calf humpback whale groups in a semi-enclosed embayment along the Australian east coast migration pathway. Sci. Rep. 2023, 13, 14702. [Google Scholar] [CrossRef] [Scilit] [PubMed]
  83. Southall, B.L.; Durban, J.W.; Calambokidis, J.; Casey, C.; Fahlbusch, J.A.; Fearnbach, H.; Flynn, K.R.; Fregosi, S.; Friedlaender, A.S.; Leander, S.G.M.; et al. Behavioural responses of common dolphins to naval sonar. R. Soc. Open Sci. 2024, 11, 240650. [Google Scholar] [CrossRef] [Scilit] [PubMed]
  84. Fettermann, T.; Fiori, L.; Bader, M.; Doshi, A.; Breen, D.; Stockin, K.A.; Bollard, B. Behaviour reactions of bottlenose dolphins (Tursiops truncatus) to multirotor unmanned aerial vehicles (UAVs). Sci. Rep. 2019, 9, 8558, Correction in Sci. Rep. 2020, 10, 17126. [Google Scholar] [CrossRef] [Scilit] [PubMed]
  85. Christiansen, F.; Nielsen, M.L.K.; Charlton, C.; Bejder, L.; Madsen, P.T. Southern right whales show no behavioral response to low noise levels from a nearby unmanned aerial vehicle. Mar. Mammal Sci. 2020, 36, 953–963. [Google Scholar] [CrossRef] [Scilit]
  86. Castro, J.; Borges, F.O.; Cid, A.; Laborde, M.I.; Rosa, R.; Pearson, H.C. Assessing the behavioural responses of small cetaceans to unmanned aerial vehicles. Remote Sens. 2021, 13, 156. [Google Scholar] [CrossRef] [Scilit]
  87. Giles, A.B.; Butcher, P.A.; Colefax, A.P.; Pagendam, D.E.; Mayjor, M.; Kelaher, B.P. Responses of bottlenose dolphins (Tursiops spp.) to small drones. Aquat. Conserv. Mar. Freshw. Ecosyst. 2021, 31, 677–684. [Google Scholar] [CrossRef] [Scilit]
  88. Lauridsen, D.G.; Madsen, N.; Pagh, S.; Glarou, M.; Pertoldi, C.; Rasmussen, M.H. Drone monitoring and behavioral analysis of white-beaked dolphins (Lagenorhynchus albirostris). Drones 2025, 9, 651. [Google Scholar] [CrossRef] [Scilit]
  89. Raoult, V.; Colefax, A.P.; Allan, B.M.; Cagnazzi, D.; Castelblanco-Martínez, N.; Ierodiaconou, D.; Johnston, D.W.; Landeo-Yauri, S.; Lyons, M.; Pirotta, V.; et al. Operational protocols for the use of drones in marine animal research. Drones 2020, 4, 64. [Google Scholar] [CrossRef] [Scilit]
  90. Aniceto, A.S.; Biuw, M.; Lindstrøm, U.; Solbø, S.A.; Broms, F.; Carroll, J. Monitoring marine mammals using unmanned aerial vehicles: Quantifying detection certainty. Ecosphere 2018, 9, e02122. [Google Scholar] [CrossRef] [Scilit]
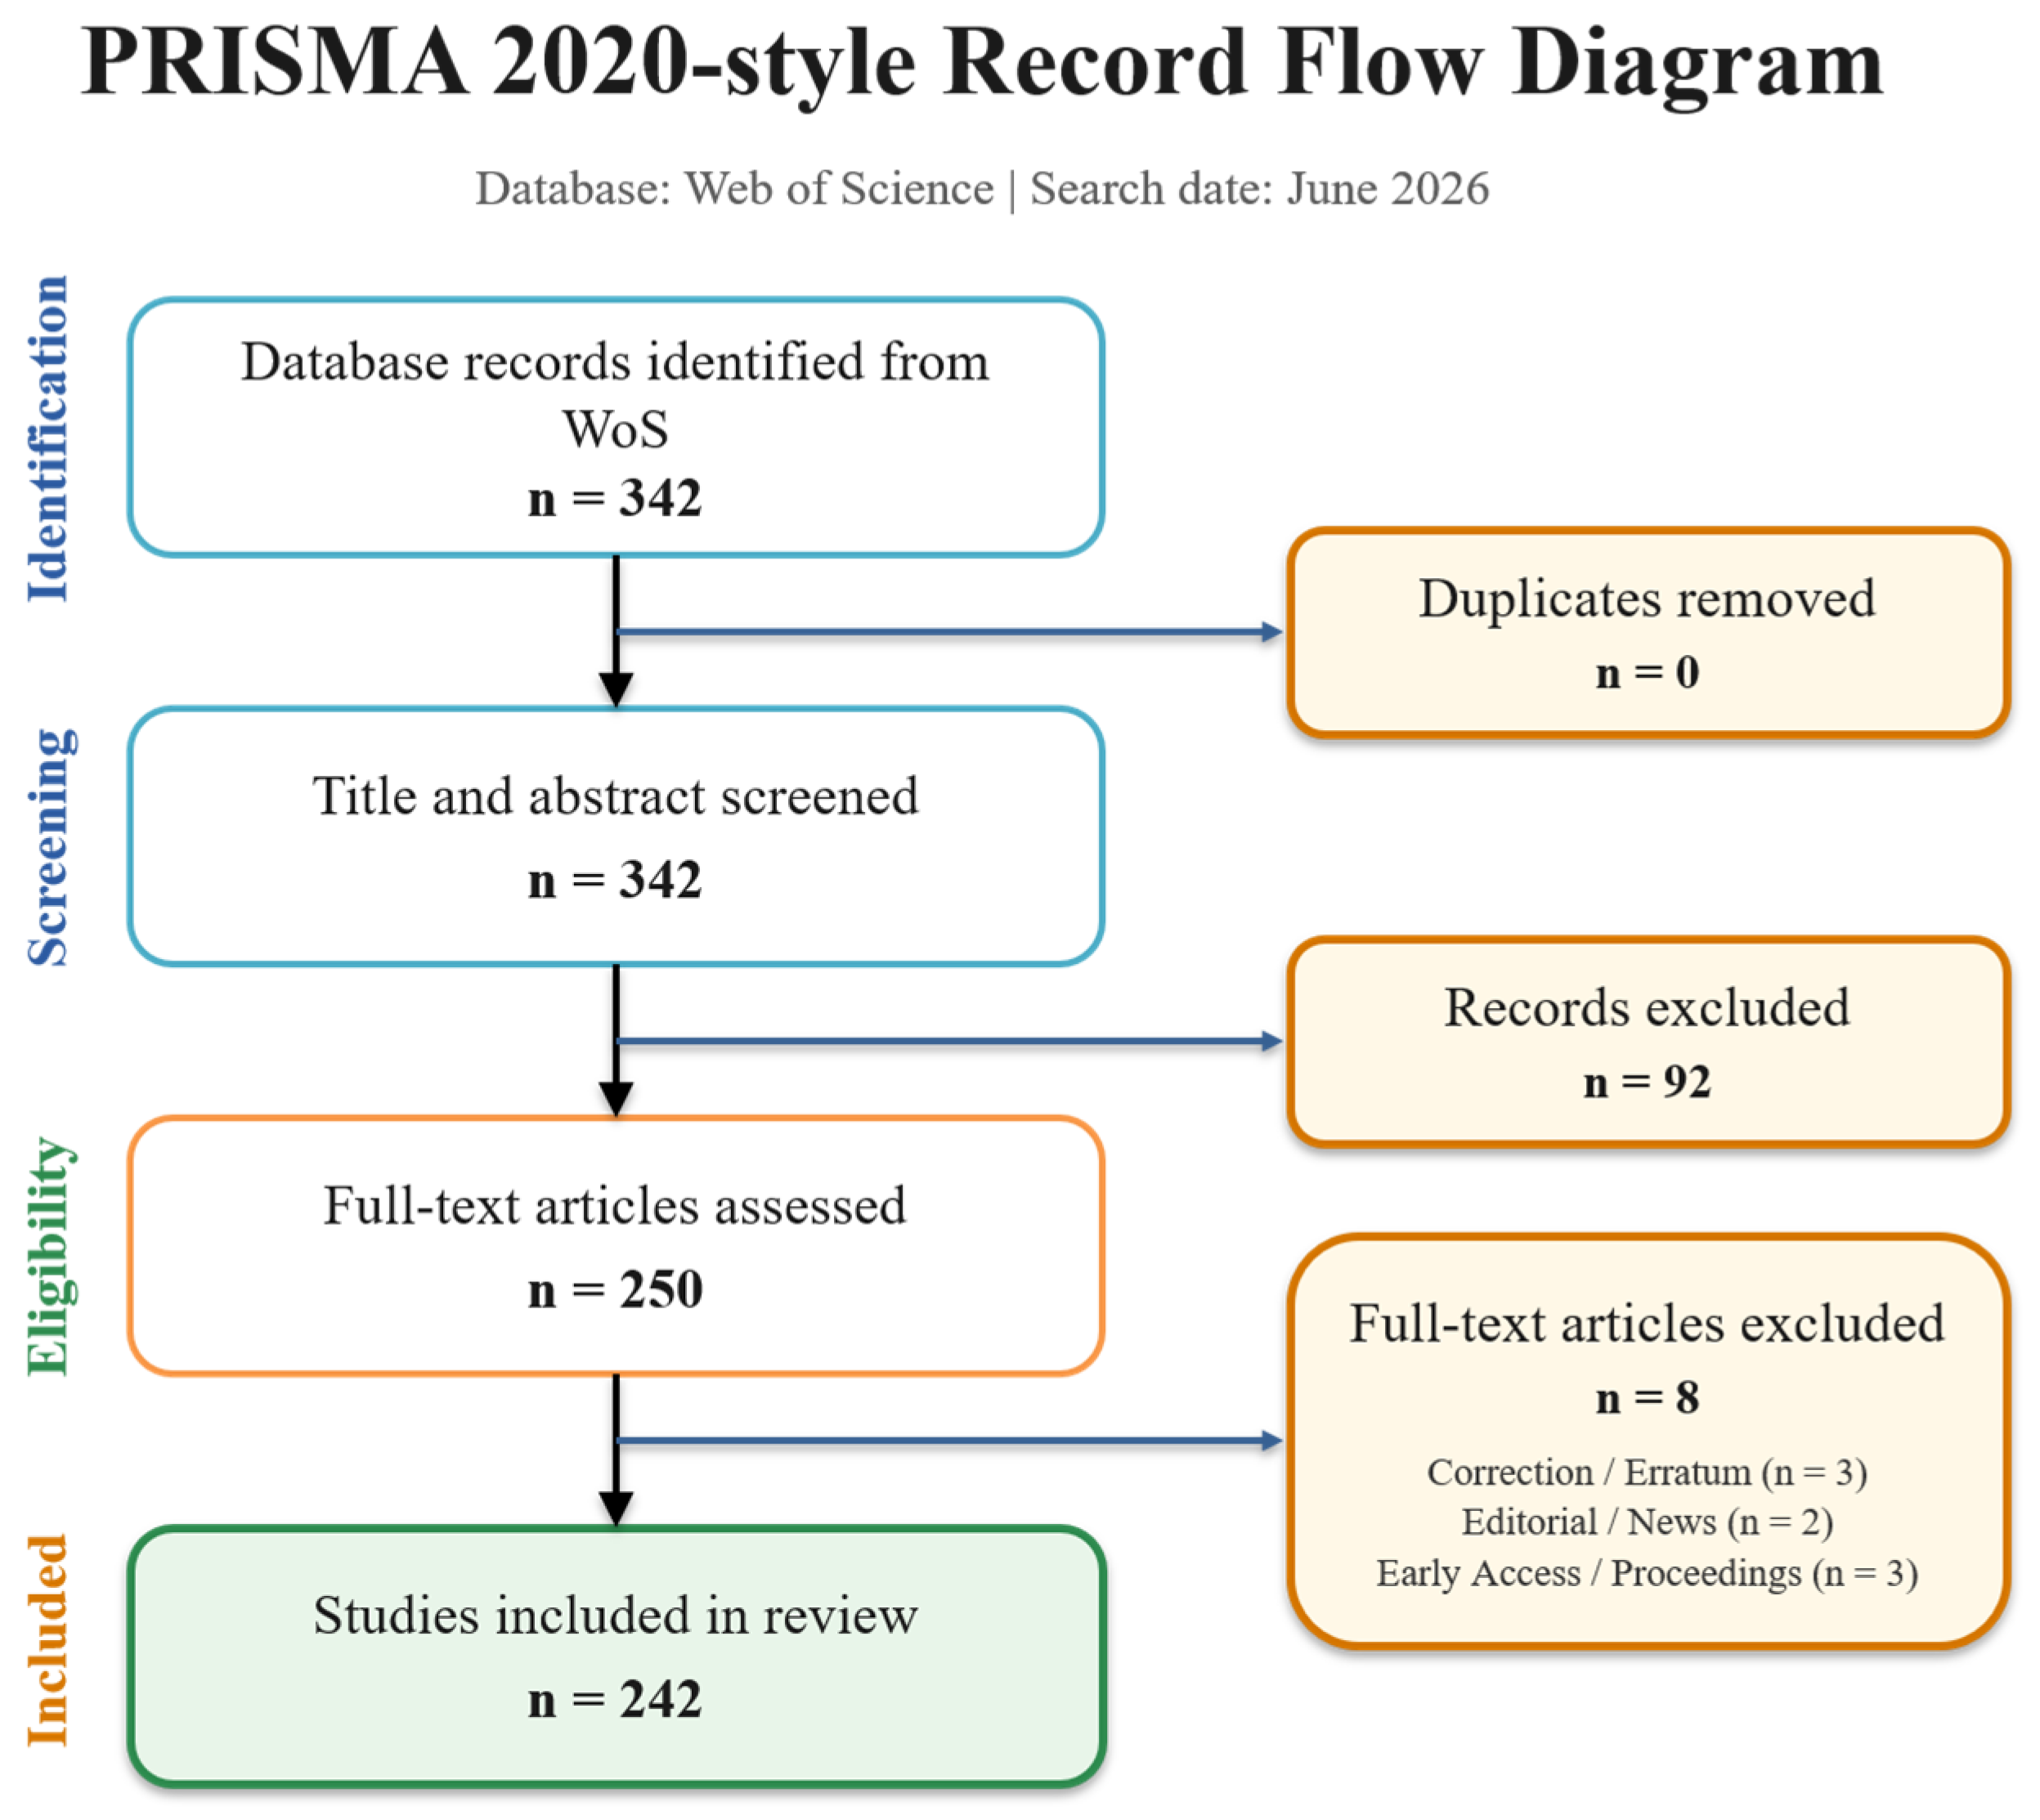
Figure 1. PRISMA 2020-informed flow diagram documenting record identification, title-and-abstract screening, exclusion, and retention in the evidence-coding corpus [9,10].
Drones 10 00711 g001
Figure 2. Bibliometric overview of UAS-based cetacean-monitoring literature. (A) Distribution of primary application domains in the coded corpus (n = 242). (B) Annual and cumulative publication trends from 2016 to 2026; blue bars show annual publications (left axis) and the orange line shows cumulative publications (right axis), with the dashed segment and open marker extending the cumulative count to the partial-year 2026 records. Records from 2026 represent partial-year output at the search date and were excluded from complete-year annual trend interpretation.
Drones 10 00711 g002
Figure 3. Co-occurrence network of author keywords in the 242-record corpus. Author keywords were harmonized with a custom thesaurus (Supplementary Materials) and analyzed in VOSviewer version 1.6.20 [23] using full counting; terms occurring in at least three records are displayed, and node size indicates occurrence frequency. The central “unmanned aerial systems” label reflects the thesaurus label used to merge historical author-keyword variants; the narrative text uses “unoccupied aerial systems” as the preferred term.
Drones 10 00711 g003
Figure 4. Technical schematic comparing strip-transect and line-transect survey logic for UAS-based cetacean monitoring. The schematic specifies observation geometry and inferential assumptions; it is not an abundance-estimation formula. In the schematic, w denotes the strip half-width, L the transect (flight-path) length, and n the number of detections counted within the strip.
Drones 10 00711 g004
Figure 5. UAS-based cetacean individual re-identification framework: identity signatures, evidence validation, and processing workflow.
Drones 10 00711 g005
Figure 6. Technical workflow for UAS-based cetacean health assessment, including mission and sensor setup, image quality control, morphometric analysis, injury-risk screening, pod-level health indicators, expert validation, and reproducible reporting.
Drones 10 00711 g006
Figure 7. Technical workflow for UAS-based cetacean behavioral ecology assessment, including mission design, video acquisition and preprocessing, individual behavior annotation, movement tracking, social and foraging metrics, expert validation, and reproducible ecological inference.
Drones 10 00711 g007
Figure 8. UAS payload configuration, data sources, analytical workflow, and validation framework for cetacean monitoring.
Drones 10 00711 g008
Table 1. Search and screening summary, including database indexes, language and document handling, Boolean query, record-count chain, exclusion criteria, and records retained.
ItemValue/Description
DatabaseWeb of Science Core Collection.
Indexes searchedScience Citation Index Expanded (SCI-EXPANDED), Social Sciences Citation Index (SSCI), Emerging Sources Citation Index (ESCI), and Conference Proceedings Citation Index—Science (CPCI-S), where records were available through institutional access.
CoverageDatabase inception through 23 June 2026; 2026 records are partial-year output.
Language and document handlingNo formal WoS language filter was imposed and no document-type filter was applied at retrieval; screening used English-language bibliographic metadata, so non-English studies without English title/abstract metadata may be under-represented.
Executed Topic Search queryTS = ((“Unmanned Aerial Vehicle*” OR “UAV*” OR “Drone*” OR “Unmanned Aircraft System*” OR “UAS” OR “Remotely Piloted Aircraft*” OR “RPAS” OR “Uncrewed Aerial*” OR “Unoccupied Aerial*” OR “Uncrewed Aircraft*”) AND (“Cetacea*” OR “Whale*” OR “Dolphin*” OR “Porpoise*” OR “Mysticeti*” OR “Odontoceti*” OR “Balaenopt*” OR “Megaptera” OR “Orcinus” OR “Tursiops” OR “Delphinus” OR “Stenella” OR “Sousa” OR “Phocoena” OR “Neophocaena”)) NOT TS = (“Whale optimization” OR “WOA” OR “algorithm design” OR “routing protocol” OR “ad hoc network” OR “swarm intelligence” OR “meta-heuristic”)
Initial hits/duplicates/exclusionsInitial records identified: 342; duplicate records removed: 0; records excluded: 100 (92 at title/abstract screening; 8 at full-text eligibility assessment).
Exclusion reasonsRecords were excluded when they used whale-related terms only as computational-algorithm vocabulary, concerned only underwater or biomimetic vehicles without airborne UAS observation, addressed non-cetacean fauna only, or mentioned UAS without applying, evaluating, or substantively discussing it for cetacean observation, measurement, sampling, or management.
Records retained242.
Table 2. Condensed technical maturity and cross-domain comparison of UAS-based cetacean monitoring applications. Evidence and validation maturity was qualitatively assessed against five criteria (Section 2.4): acquisition calibration, task-specific validation, external transferability, correction of major observation biases with uncertainty propagation, and demonstrated repeatability. Level I denotes proof-of-concept feasibility; Level II denotes a validated research application; and Level III denotes operational monitoring readiness. Ranges indicate heterogeneity among studies within an application domain. The conversion of the five criteria into maturity levels and the conservative handling of borderline cases are described in Section 2.4. The classification is an author-developed synthesis and should not be interpreted as a formal technology-readiness scale.
Application DomainMain UAS OutputKey Technical RequirementEvidence and Validation Maturity and Best-Use Context
Abundance and distributionCounts, detections, tracks, spatial locations, and validation data.Use systematic strips or lines; report altitude/GSD, footprint, sea state, and availability/perception correction.II in constrained habitats; I–II for absolute abundance. Best for lagoons, rivers, ice edges, coastal hotspots, and validation studies.
Individual identification and re-identificationDetections, tracklets, body marks, scars, pigmentation, catalogue links, and re-sightings.Use high-resolution nadir/oblique imagery, quality screening, duplicate suppression, and catalogue adjudication.II–III for well-marked catalogues; I–II for cross-site automation. Best for resident or repeatedly sampled populations.
Morphometrics, body condition, and healthBody dimensions, volume, condition indices, growth, pregnancy, lesions, and external health signs.Use calibrated camera/altitude, near-nadir posture-screened frames, repeated measurement, and uncertainty propagation.III for calibrated photogrammetry; II–III for health inference. Strongest for large whales with repeated access.
Behavioral monitoring and disturbanceGroup geometry, tracks, surfacing rhythm, behavioral states, response latency, and recovery metrics.Use continuous video; report altitude, frame rate, approach path, hover duration, ethogram, and audit rules.II for visible behavior; I–II for automated labels. Strongest with acoustics, biologging, or repeated focal follows.
Multimodal and operational applicationsBlow, eDNA, thermal, targeted sampling, rapid assessment, and sensor-fusion products.Report sampling distance, rotor-wash exposure, contamination controls, thermal angle, and environmental metadata.I–II. Useful for targeted health or genetic sampling; routine monitoring requires stronger validation and calibration.
Table 3. Application domains compared by UAS-derived observation products, representative cetacean taxa and studies, dominant biases, and recommended monitoring contexts.
Domain (n; %)Core UAS-Derived OutputRepresentative Cetacean Taxa/StudiesPrincipal Bias or LimitationBest-Use Context
Abundance and distribution
(33; 13.6%)
Counts, detections, tracks, spatial locations, and strip- or line-transect outputs.Amazonian river dolphins, narwhal, beluga, and bottlenose dolphin [14,28,29,30].Availability bias, perception bias, group-size error, and detection-probability assumptions.Local or constrained-habitat surveys and platform validation.
Individual identification
(34; 14.0%)
Candidate detections, tracklets, dorsal or body-surface features, and re-identification links.Fin whale, sperm whale, beluga, right whale, and dolphins [24,39,40,41,42].Annotation burden, posture, sun glint, breaking waves, sea foam, whitecaps, duplicate tracks, and algorithmic transfer across species or sites.Long-term re-identification and marked-individual monitoring.
Morphometrics and health assessment
(79; 32.6%)
Length, width, area, 3D volume, body-condition index, and lesions.Large whales and small cetaceans [16,19,43,44,45].Scale calibration, posture, tissue-density assumptions, and uncertainty propagation.Individual health, growth, pregnancy, and body condition.
Behavioral monitoring
(76; 31.4%)
Group geometry, surfacing rhythm, movement tracks, and response metrics.Gray whale, humpback whale, Risso’s dolphin, finless porpoise, and common dolphin [46,47,48,49].Short observation windows, UAS-induced disturbance, and immature classification standards.Foraging, social interaction, mother–calf behavior, and disturbance response.
Other multimodal applications
(20; 8.3%)
Blow microbiome, eDNA, thermal vital signs, and sensor-fusion products.Humpback whales, small cetaceans, and dolphins [17,18,50,51,52].Contamination risk, sampling success rate, synchronization, and validation.Targeted non-invasive health or genetic monitoring and rapid response.
Table 4. Comparative assessment of representative algorithmic and software workflows for UAS-based cetacean image analysis. Values in the performance column are source-reported summaries from the cited studies.
Analytical TaskRepresentative StudiesAlgorithm/SoftwareInput DataMain Limitation/Condition of Use
Species identification + photogrammetryGray et al. 2019 [12]CNN classifier with automated photogrammetryRGB aerial stills (humpback, minke, blue whales)Validated within one image archive; cross-site and cross-species transfer not tested
Automated morphometry (length, condition)Bierlich et al. 2024 [19]DeteX frame detection + XtraX measurement pipelineDrone videos of gray whalesDemonstrated mainly on gray whales; posture and image quality still gate accuracy
Automated morphometric extractionBagchi et al. 2025 [25]Two Mask R-CNN models (body mask + axis points)8958 aerial photographs of southern right whalesSigned biases (length −1.3%, volume +6.5%) require correction; trained on a single species
Detection and trackingAlsaidi et al. 2024 [24]YOLOv7 detection + deep SORT tracking with post-processingAerial video of belugasIdentity switching is the dominant failure mode; single-site proprietary dataset
Tracking consistencyPtak et al. 2025 [26]SORT-PF (particle-filter integration)Drone videos, including a public porpoise datasetImprovements demonstrated on one public dataset
Dorsal-fin and delphinid detectionRenò et al. 2020 [55]; Chien et al. 2022 [56]; Canelas et al. 2025 [57]Color semantics + CNN; autonomous detection-tracking; AI detectorsRGB frames and videoFrame-level splits remain common; survey-level transfer rarely tested
Individual re-identificationBogucki et al. 2019 [42]CNN-based photo-identificationRight whale catalogue photographsClosed-set catalogue setting; open-set discovery unresolved
Table 5. Payload types and reporting parameters for UAS-based cetacean monitoring. Values are indicative examples drawn from reported study designs and common research-grade payloads; they are included to guide reporting and mission planning, not to prescribe universal equipment specifications or operating altitudes.
Payload TypeKey Reporting ParametersPrimary TasksEnvironmental Constraints
RGB camera (stills/video)Report camera model, lens or focal length, image resolution, frame rate, altitude sensor, footprint, and mission-specific GSD; published examples commonly use high-resolution RGB stills or 4K video at task-dependent altitudes.Abundance, distribution, individual identification, morphometrics, behavior [14,15,16,19]Sun glint, sea state, cloud shadow; near-nadir geometry required for measurement tasks
Radiometric thermal infraredReport detector resolution, thermal sensitivity or noise-equivalent temperature difference (NETD), radiometric calibration, lens field of view, emissivity assumptions, frame rate, and viewing geometry.Vital-sign and blow detection, health screening, low-light detection [51]Humidity, water-surface reflection, emissivity, viewing angle, ambient temperature
MultispectralReport sensor model, band set, bandwidths, radiometric calibration, reflectance-panel procedure, flight altitude, viewing geometry, and surface-water correction.Habitat context, turbidity and surface characterizationIllumination correction required; water-column effects limit subsurface inference
Blow sampler (Petri dish/vacuum)Report sampler type, sterile collection surface, trigger mechanism, approach distance or altitude, exposure time, and contamination controls.Respiratory microbiome and hormone sampling [17,18,50]Rotor wash, contamination risk, approach angle, variable sampling success
Wake/surface eDNA samplerReport collector type, sampling height or approach geometry, water volume, filtration or preservation procedure, field blanks, negative controls, and contamination controls.Species detection from environmental DNA [52]Contamination control, sample dilution, sea state
Table 6. Condensed risk-control matrix for six core inferential constraints in UAS-based cetacean monitoring.
Core ConstraintMain RiskMinimum Control
Availability biasSubmerged animals are absent from visible imagery, so counts may understate presence or abundance.Use repeated passes, surfacing/dive data, acoustic or tagging support, or explicit g(0) assumptions.
Perception and image-quality biasGlint, breaking waves, sea foam, whitecaps, turbidity, depth, or fatigue cause missed or false detections.Report image-quality classes, apply artifact screening/masking, and provide false-positive/false-negative evidence.
Group-size errorAsynchronous diving or partial surfacing makes visible group size incomplete.Define group rules, use repeated frames or passes, and report correction or sensitivity analyses.
Measurement uncertaintyAltitude, lens distortion, scale, posture, roll, body-edge ambiguity, and landmark placement affect measurements.Report calibration, GSD, posture filters, repeated measures, error estimates, and uncertainty intervals.
Algorithmic-transfer biasModels fail across species, sites, seasons, cameras, altitudes, sea states, or annotation protocols.Use survey/site/season/individual-level validation splits, stratified metrics, independent tests, and failure cases.
Disturbance-induced biasUAS presence alters behavior, spacing, diving, respiration, movement, or sampling conditions.Report platform, altitude, route, hover duration, group state, response, repeat exposure, and stop criteria.
Disclaimer/Publisher’s Note: The statements, opinions and data contained in all publications are solely those of the individual author(s) and contributor(s) and not of MDPI and/or the editor(s). MDPI and/or the editor(s) disclaim responsibility for any injury to people or property resulting from any ideas, methods, instructions or products referred to in the content.