


Highlights
What are the main findings?
- The paper developed presents methods for a 2D UAV flight planning prototype that enhances flight risk assessment by integrating geometric and semantic data.
- Integrating semantic information enhances representation of safety constraints and risks of UAV environment.
What are the implications of the main findings?
- The methods developed for the prototype can serve as a technical framework for supporting 2D UAV path planning.
- The results lay a groundwork toward the development of a comprehensive 3D UAV path planning for increasingly complex operational scenarios.
Abstract
Risk assessment of Unmanned Aerial Vehicle (UAV) path planning is a crucial step towards ensuring a safe UAV operation. However, achieving a reasonable risk assessment of UAV flight paths remains challenging because it involves multiple responsibilities and processes that extend beyond a single agency or organization. Additionally, it must balance various complex factors and data from social, technical, political, and economic sources. Most existing works on flight path planning evaluate flight risks at a global level and generalized geometric representations of the UAV operating environment with respect to the current applicable UAV regulations. However, geometric information alone does not provide sufficient insight for comprehensive and safe path planning. Therefore, there are other ideas and concepts for using semantic data to characterize objects, obstacles and actions in the UAV environment. Incorporating semantic information into path planning enables more meaningful scene descriptions and a better representation of relevant constraints, obstacles within UAV environment that may influence the safety level of UAV operation, and the relevant risk assessment process. In this paper, we propose the development of methods and frameworks integrated into a flight planning prototype designed to generate safe two-dimensional UAV routes within a local, fine-grained planning context. The prototype incorporates safety considerations to enable a comprehensive assessment of UAV operational risks. It leverages both geometric and semantic datasets to characterize objects and obstacles within the UAV environment. These datasets are processed and stored in a relational database to support structured access and long-term usability. All concepts and experiments were implemented using datasets from a study area in the city of Brunswick, Germany.
1. Introduction
1.1. Problem Description
Assessing UAV operational risk is a critical step in ensuring safe flight path planning. However, achieving a reasonable risk assessment remains challenging, as it involves multiple responsibilities and processes that span across different agencies and organizations. Additionally, it should balance various complex factors and data from social, technical, political and economic sources.
To reach an acceptable safety level, minimizing UAV risks to other airspace users as well as to both people and property on the ground is requested [1,2,3,4]. UAV risk minimization requires a clear and acceptable assessment of potential risks in UAV operational environment. For “risk minimization and assessment” to be effective, it is essential first to define what a risk is and what is meant by risk assessment. In general, a risk is defined as the probability and potential severity of an accident or loss resulting from exposure to hazards, such as an injury to people or a damage to resources. Each identified risk can be assessed (evaluated) in terms of its likelihood (probability) and its severity (consequences), based on the degree of human or equipment exposure to the hazard [5].
In the context of UAV risk assessment, several approaches and frameworks have been proposed and partially implemented: particularly those developed by the European Union Aviation Safety Agency (EASA) such as the Specific Operations Risk Assessment (SORA, Section 1.2). However, these existing methodologies primarily evaluate risk at a global level, relying on generalized geometric representations of UAV environmental operation. In this context, “global level” refers to mission-level assessment rather than trajectory-level analysis, meaning that a risk is evaluated for the overall operation instead of being computed along a detailed and location-specific flight path. Consequently, these approaches may not explicitly distinguish, for example, between flying over an empty field and flying over a crowded street at different segments of the flight route.
Furthermore, a purely geometric and generalized representation of UAV environmental obstacles may be insufficient for a comprehensive risk assessment. Ideally, obstacles should also be described in semantic terms through context-aware information. Incorporating semantic data shifts a risk assessment from a purely geometric question (“where are the obstacles?”) to a contextual one (“what is present in the environment, who is exposed, and what are the potential consequences of a risk event?”). This enables a more realistic and, in many cases, time-dependent estimation of operational risks.
To address this gap, we propose the development of methods that can be integrated into a Flight Planning Prototype (FPP) to support the generation of safe UAV flight paths in operational environments. The prototype serves as a heuristic risk assessment tool, incorporating a framework specifically designed to meet the operational requirements and regulatory expectations governing UAV operations within the open category (Section 1.2). In contrast to existing approaches such as SORA, the FPP focuses on a local, fine-grained planning and risk classification by leveraging mission-specific parameters and context-dependent environmental factors. It evaluates how a risk level can change along a trajectory and enables a more targeted, accurate, and operationally relevant assessment of mission risks.
The methods employed within the FPP and its associated risk assessment component consider the availability and quality of UAV-relevant environmental data, including both geometric and semantic information. At the current stage of this study, the focus is on the implementation of two-dimensional geometric datasets (i.e., GIS-based layers) and their integration with corresponding semantic attributes describing static characteristics of geographic objects, such as building functions (e.g., residential, hospital, or school). The use of two-dimensional GIS-based datasets is actually a deliberate choice driven by methodological, computational and data-availability considerations. First, 2D representations provide a computationally efficient and well-established abstraction of the operational environment, enabling a rapid prototyping of a core risk assessment and path evaluation functions. Since the primary objective of this work phase is to proof the feasibility of integrating geometric and semantic risk components within a unified framework, 2D data offers a sufficiently expressive yet simplified model for algorithm development and testing. In addition, 2D foundation provides a scalable baseline that can be extended toward 3D and dynamic spatiotemporal representations in future work without requiring a fundamental redesign of the core risk assessment logic.
The paper is structured as follows: the next subsection provides a review of UAV risk assessment approaches and methodologies. Section 2 outlines the data preparation process for the study area. Section 3 presents the characterization of key objects and obstacles within the UAV operating environment from both geometric and semantic perspectives. Section 4 addresses safety and risk assessment in flight operations, with particular emphasis on recent UAV regulations in Europe. Section 5 describes the implementation of the proposed prototype. Finally, Section 6 presents and discusses the results of the FPP process, highlighting the functionality and efficiency of the proposed approach.
1.2. Related Work
Several review articles and studies on UAV applications have highlighted safety and risk assessment as critical components of UAV operations [4,6,7,8,9,10]. Consequently, the existing literature and UAV regulations commonly distinguish between two principal classes of risk: Ground Risk Class (GRC), which addresses the potential impact of UAV operations on people, property and infrastructure on the ground; and the Air Risk Class (ARC), which concerns hazards arising from interactions with other airspace users and the surrounding aerial environment. Various frameworks have been proposed to assess these risks; among them is the UAV risk assessment model developed by [11], which provides a structured approach for evaluating both ground-based and airspace-related operational risks. The model is seen as the fundamental framework for establishing a safe and reliable organization and set up for UAV flights permission and insurance applications. It involves assessing actions to mitigate the predicted probability and severity of the consequences or outcomes of each operational risk. The model consists of four phases: (1) hazard identification, (2) risk assessment, (3) risk mitigation, and (4) documentation process. Within this model, the risk assessment procedure defines UAV operation risks as the likelihood or frequency of a risk, for instance, a risk is likely to occur or has occurred frequently, etc., so that risks can be better managed and controlled.
Another notable contribution to UAV risk assessment is the Easy Risk Assessment (ERA) method proposed by [12]. ERA aimed to provide a simple and practical framework for assessing the risks associated with UAV operations by considering a range of factors that influence risk management. The method offers a straightforward approach to identifying hazards and their sources, supporting risk management processes, and determining acceptable levels of risk tolerance for a given operation.
Following the introduction of the new European Union drone regulatory framework by EASA in January 2021 [13], UAV risk assessment has become increasingly complex, as it must account for a wide range of technical, operational, social, economic, and regulatory factors. To streamline and standardize the assessment process, EASA introduced the Predefined Risk Assessment (PDRA) framework. PDRA provides predefined operational scenarios together with corresponding risk mitigation measures, enabling operators to demonstrate regulatory compliance without performing a full risk assessment for each individual operation. This approach reduces the complexity and administrative burden of the assessment process while maintaining an adequate level of operational safety [14]. In summary, the main advantage of PDRA is that, when a planned operation falls within an existing predefined scenario, the UAV operator is not required to conduct a full risk assessment. Instead, the operator can complete the relevant PDRA-specific documentation, prepare an Operations Manual (OM), and submit it to the competent national aviation authority for approval.
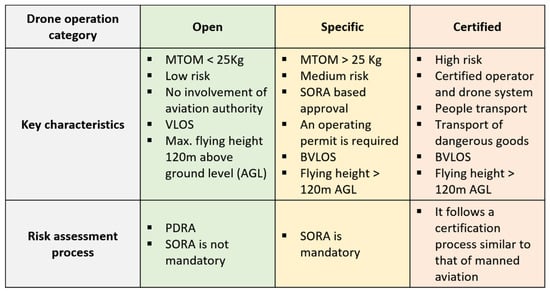
As a more advanced risk assessment methodology, the new regulations permit the use of the Specific Operations Risk Assessment (SORA); a standardized Europe-wide framework developed by the Joint Authorities for Rulemaking on Unmanned Systems [15]. SORA is designed to guide the risk assessment process required for applications to operate UAVs within the “specific category”, a medium-risk operational category defined by the EASA [13,16,17]. To properly highlight SORA framework, it is necessary to briefly introduce the UAV operational categories established by EASA. In addition to the specific category, EASA defined two further categories for drone operations: the open and certified categories. These categories are primarily differentiated according to the level of operational risk (low, medium and high), as well as key technical and operational parameters, including Maximum Take-Off Mass (MTOM), visual line-of-sight (VLOS) versus beyond visual line-of-sight (BVLOS) conditions and flight altitude expressed as above ground level. Figure 1 provides an overview of these categories and their key characteristics.
Figure 1.
UAV operation categories [13].
The SORA framework provides a comprehensive and globally applicable approach to risk assessment and classification. It is primarily based on a holistic evaluation of the UAV operational environment. Through a structured ten-step process (Table 1), SORA evaluates the impact of flight risks—including damages, harms and threats—to third parties on the ground and in the airspace. This impact is checked by analyzing two primary risk classes GRC and ARC associated with UAV operations. Both classes are influenced by the availability and quality of Unmanned Traffic Management (UTM) services—for example, flight planning support, robustness of procedures and safety level [18].
Table 1.
SORA steps [18].
As mentioned earlier, SORA is mandatory for UAV operations that fall within the specific category. However, it is not required for operations conducted under the open or certified categories. The certified category addresses the highest risk operations such as those involving manned aircraft or large UAVs and typically follows a certification process similar to that of manned aviation. Furthermore, SORA is not mandatory for operations conducted within the open category. This is because the open category encompasses low-risk UAV operations and is governed by a well-defined regulatory framework consisting of specific operational rules and subcategories. These subcategories impose strict limitations on technical and operational parameters, such as drone weight, maximum flight altitude and proximity to uninvolved persons; thereby reducing the need for a formal risk assessment methodology such as SORA. In addition, UAV operators within the open category may consider existing risk assessment frameworks, including PDRA and SORA, to be insufficiently tailored to their operational requirements. These limitations arise primarily from the fact that the SORA and even PDRA are designed to assess a risk at a global operational level, relying on static assumptions and predefined parameters. As such, these frameworks may not be inherently aligned with the requirements of the open category, which typically demands fine-grained, context-sensitive decision-making. In particular, these frameworks do not incorporate real-time, context-aware (semantic) environmental data derived from the UAV’s operational surroundings, which are increasingly considered essential for accurate flight planning and risk assessment in complex urban environments.
To this end, the review of the state-of-the-art shows that a safe UAV path planning is not a novel problem and has been extensively studied in the literature. However, it remains an open challenge, partly due to the limited integration of local safety measures in current UAV operations. In addition, existing UAV path planning approaches are predominantly based on geometric data and current regulatory frameworks. Relying solely on geometric data, however, does not provide sufficiently rich information for a safe flight path planning; for instance, an adequate semantic description of relevant places and objects is often not available. For this reason, there are also other ideas of using semantic information to characterize objects and actions within the UAV operating environment. Incorporating semantic information alongside geometric data in a local path planning can improve the efficiency of the planning process, which might otherwise become operationally demanding. Moreover, enriching path planning with semantic information enables a more meaningful representation of the current state of the environment, including relevant constraints and rules that must be considered during UAV flight planning.
2. Data Preparation in the Study Area
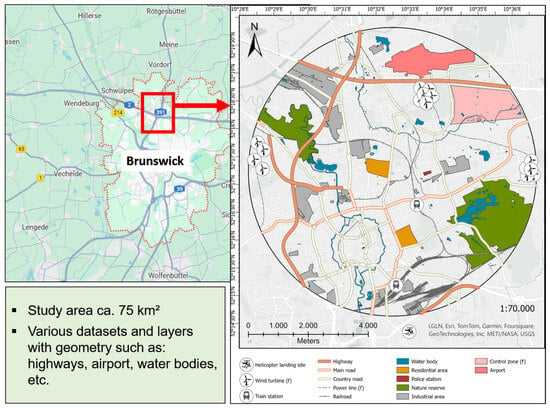
The prototype framework was implemented in the city of Brunswick, Germany, within a circular study area of approximately 75 km2, covering most of the urban region (Figure 2). The area comprises a variety of thematic datasets representing geographical features such as highways, railway infrastructure, water bodies, nature conservation areas, industrial zones, roads and the airport. The datasets include both geometric and semantic information derived from OpenStreetMap (OSM) as a primary source for several thematic layers. In addition, complementary datasets were obtained from open geospatial portals of the respective federal state, including digital terrain models, land-use data and energy infrastructure information. While OSM provides extensive spatial coverage and a reasonable attribute structure, the quality and completeness of its semantic information are inherently heterogeneous due to its volunteered nature. Attribute availability varies according to contributor activities (e.g., adding new map features, updating metadata, etc.), regional mapping practices and tagging conventions, resulting in differing levels of detail across features. Furthermore, inconsistencies in tagging schemes and variations in update frequency may affect the accuracy and completeness of specific attributes [19,20].
Figure 2.
The study area in the city of Brunswick in Germany showing the different geographical areas relevant for UAV flight planning—fictitious data (synthetic features) is marked with an (f).
A preliminary assessment of the datasets indicated that the key attributes required for this study were generally available and exhibited a satisfactory level of consistency. The evaluation focused on the availability and quality of essential spatial and descriptive information, including feature geometries, classification tags, road network characteristics, points of interest, and land-use attributes relevant to the study objectives. In addition, the assessment examined the completeness and consistency of these attributes across the study area to ensure their suitability for subsequent analysis. The results suggested that the datasets provide a reliable foundation for the research and are sufficiently detailed to support the intended analytical framework. The study area was deliberately selected to include a variety of objects and obstacles relevant to UAV path planning and risk assessment. Nevertheless, some UAV regulatory constraints were not represented by publicly available geospatial data within the study area. To ensure a complete coverage of the regulations considered, synthetic features such as wind turbines, power lines and a control zone were added to the datasets. These features provide controlled representations of specific regulatory constraints and enable their systematic evaluation within the path planning and risk assessment framework. Since the focus of this study is on assessing the methodology rather than modelling a specific real-world environment, the use of synthetic features is considered appropriate and does not affect the validity of the findings.
For each object (obstacle) identified within the study area, a Minimum Safety Distance (MSD) for UAV operation was derived based on applicable UAV regulations and stored in a database (Section 3.2). The determination of MSD is fundamentally dependent on both geometric and semantic information. While geometric properties define the spatial extent of obstacles, semantic attributes provide the contextual interpretation required for risk-based differentiation. In particular, MSD values are influenced by object function, occupancy characteristics and classification, and this therefore enables a context-dependent risk weighting. Consequently, geometrically similar objects may be assigned different safety distances depending on their semantic category, such as an educational or industrial land use. However, this reliance on semantic information introduces variability and uncertainty, as semantic completeness and consistency differ across data sources. Incomplete or ambiguous semantic tagging may therefore propagate into MSD estimation, affecting the granularity and reliability of the resulting safety buffers. Overall, MSD can be interpreted as a hybrid geometric-semantic component, where a spatial risk is modulated by contextual information derived from semantic data. MSD values of important obstacles considered in the study are provided in Table 2.
Table 2.
Minimum Safety Distances MSD per obstacle implemented in the study area.
3. Description of UAV Environment
Identifying and digitally representing all relevant objects and obstacles within the flight area is a critical task, as it directly influences flight planning and operational safety. A well-defined description of the UAV environment can enable a safer route planning and enhance the protection of people and property both in the air and on the ground. To meet this requirement, we developed a framework for constructing a digital UAV environment. The framework consists of two steps, which are described in detail in the following subsections.
3.1. Step 1—Geometric and Semantic Identification of UAV Environment
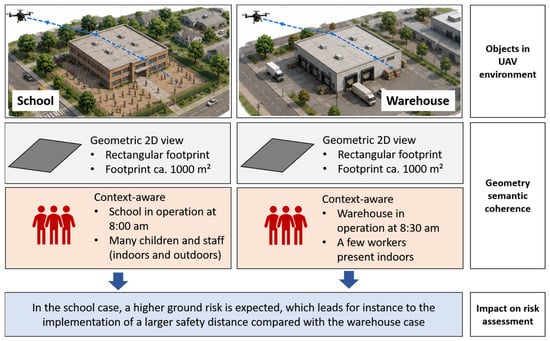
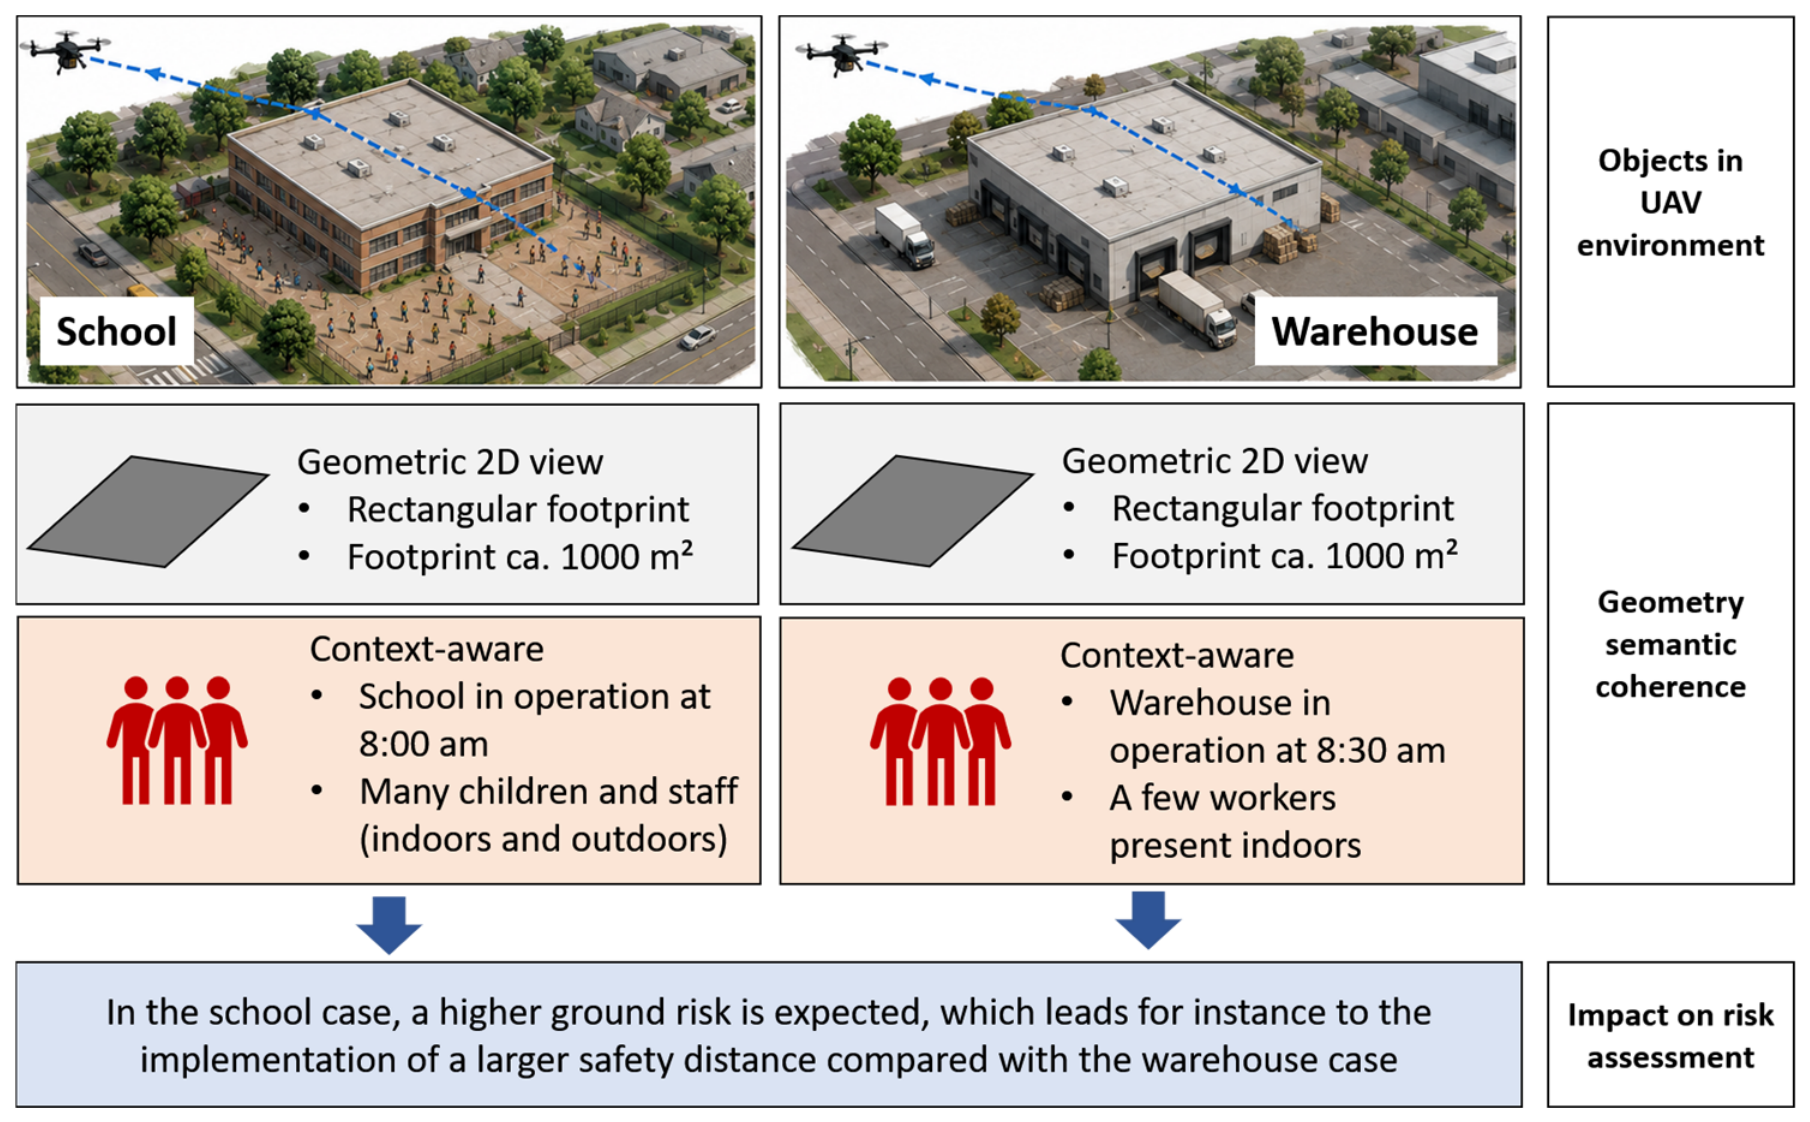
The first step focused on identifying relevant 2D objects and obstacles within the UAV flight environment and selecting suitable datasets to realistically represent them, including building footprints, roads, railways and nature reserves. Intangible objects, such as control zones, were also considered. For all geometric data, supplementary semantic information was collected, for instance road names, addresses, etc. Incorporating semantic attributes for objects and obstacles enhances flight safety by providing more accurate inputs for a route planning. Basically, semantic data transform a risk from a geometric focus (“Where are the obstacles?”) to a contextual one (“What is happening, who is present, and what are the consequences?”), thereby enabling more realistic estimates of operational risk. To illustrate this, consider a drone delivery route that crosses two visually identical buildings: (1) a school at 8:00 a.m. and (2) a warehouse at 8:30 a.m. (Figure 3).
Figure 3.
An illustration of the interaction between geometric and semantic representations of UAV environment, and their impact on risk assessment. It depicts UAV flights over a school and a warehouse. Although both buildings may appear geometrically similar, their semantic meanings differ significantly. This difference can substantially influence the operational risk level.
From a purely geometric perspective, both features may appear as large rectangular structures, exhibiting similar two-dimensional footprints and therefore are difficult to distinguish based solely on shape characteristics. Semantic data can reveal that the school is likely to contain hundreds of children, whereas the warehouse may only host a small number of workers. Consequently, the expected severity of a potential crash differs substantially, which can lead to different risk scores or route decisions.
3.2. Step 2—Data Structure and Storage
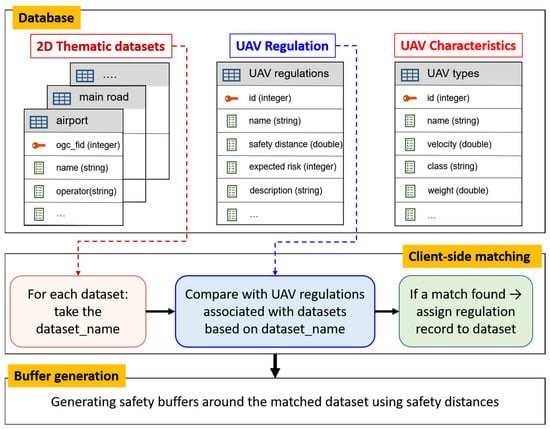
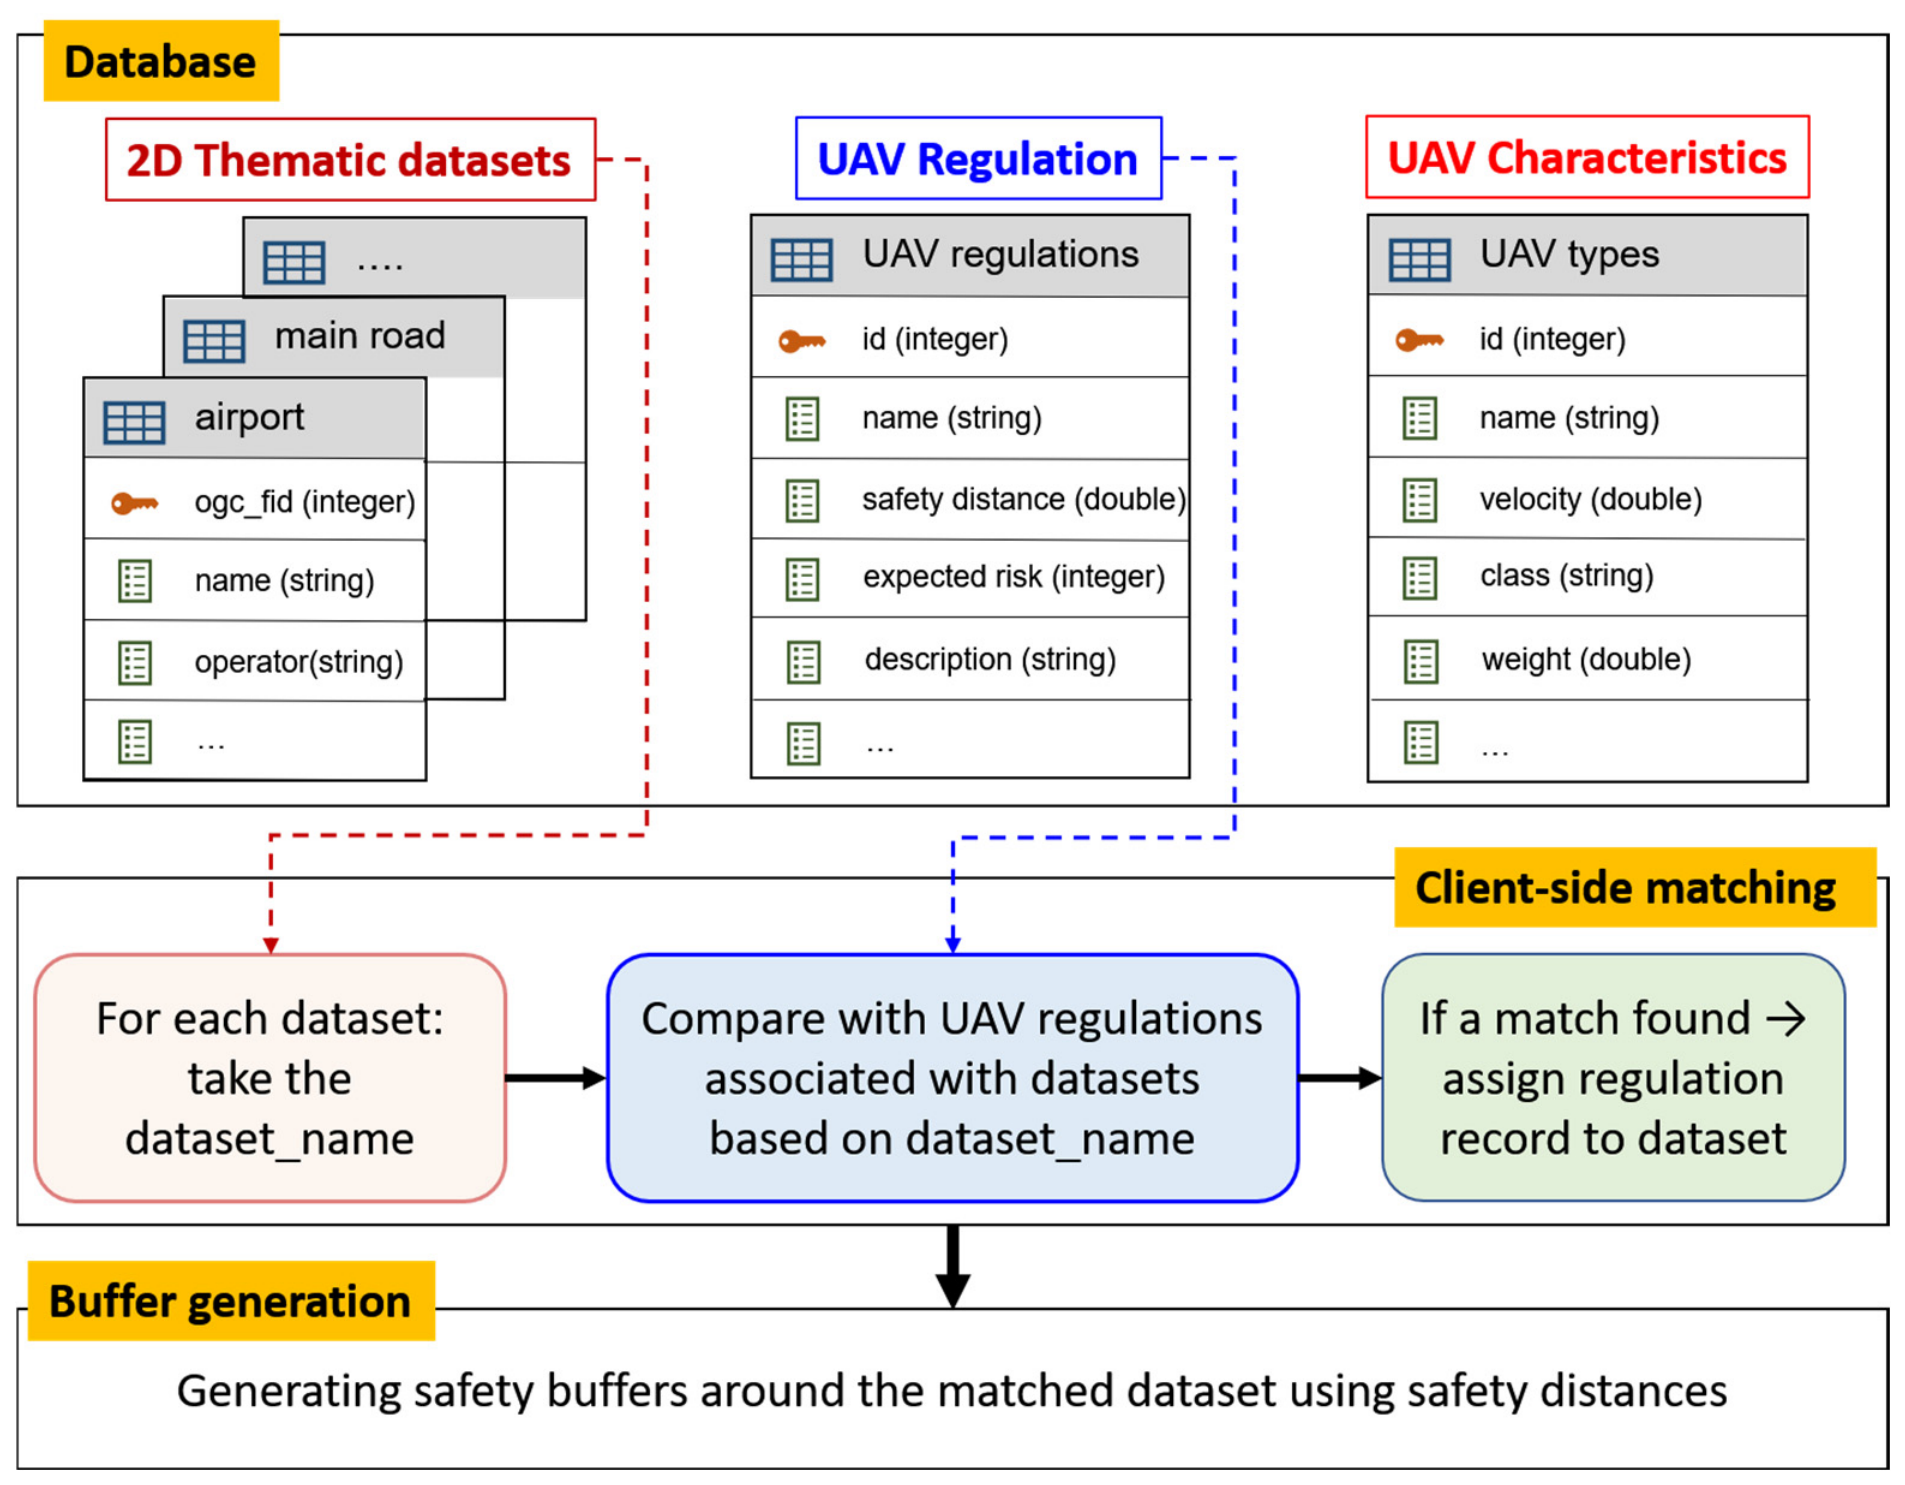
Datasets identified in the previous step were processed and stored for long-term use in a relational database. For this purpose, a PostgreSQL-database combined with the PostGIS extension was implemented [21]. Separate tables were created for each thematic dataset and stored as 2D geometric layers such as roads, airport and other relevant features (Figure 4). In addition, two dedicated tables were included: the first table contains important UAV regulations associated also with the individual thematic datasets; with the focus on corresponding safety distances to objects (obstacles). The second table contains information on UAV types and key properties, for instance UAV class, weight, etc.
Figure 4.
Table structure in the database. Thematic datasets and UAV regulations are retrieved independently from the database and linked on the client-side through a name-based matching process. The safety distance—specified in regulation records—is assigned to the corresponding matched dataset, enabling the generation of safety buffers around the dataset geometries for subsequent UAV route planning and risk assessment.
From a database perspective, no explicit relational linkage exists between the regulation records and the thematic datasets. Instead, the association is established on the client-side within the prototype application. To achieve this, the application first retrieves the relevant UAV regulations and the available thematic datasets from the database. Each regulation record contains a reference to the thematic dataset to which it applies, stored as a textual identifier or a dataset name. During processing, the client application performs a name-based matching procedure, in which the dataset name specified in the regulation table is compared with the names of the loaded thematic datasets. Once a matching dataset is found, the corresponding regulation records are assigned to that dataset within the application’s runtime environment. Subsequently, the safety distances defined in the regulatory table can also be applied to the geometries contained within the associated thematic dataset. Accordingly, the prototype generates safety buffers around the obstacle geometries, with each buffer radius corresponding to the safety distance specified by the applicable regulations, as discussed in the following section.
4. Risk Assessment of UAV Flight Path
In this section, we introduce the so-called “Expected Risk Value (ERV)” as a numerical indicator representing the risk level of a flight path. The ERV quantifies the likelihood of UAV-obstacle collisions along a given trajectory. Several factors influence this probability; in this study, we focus on the impact of the 2D area occupied by an obstacle and its distance to the UAV route.
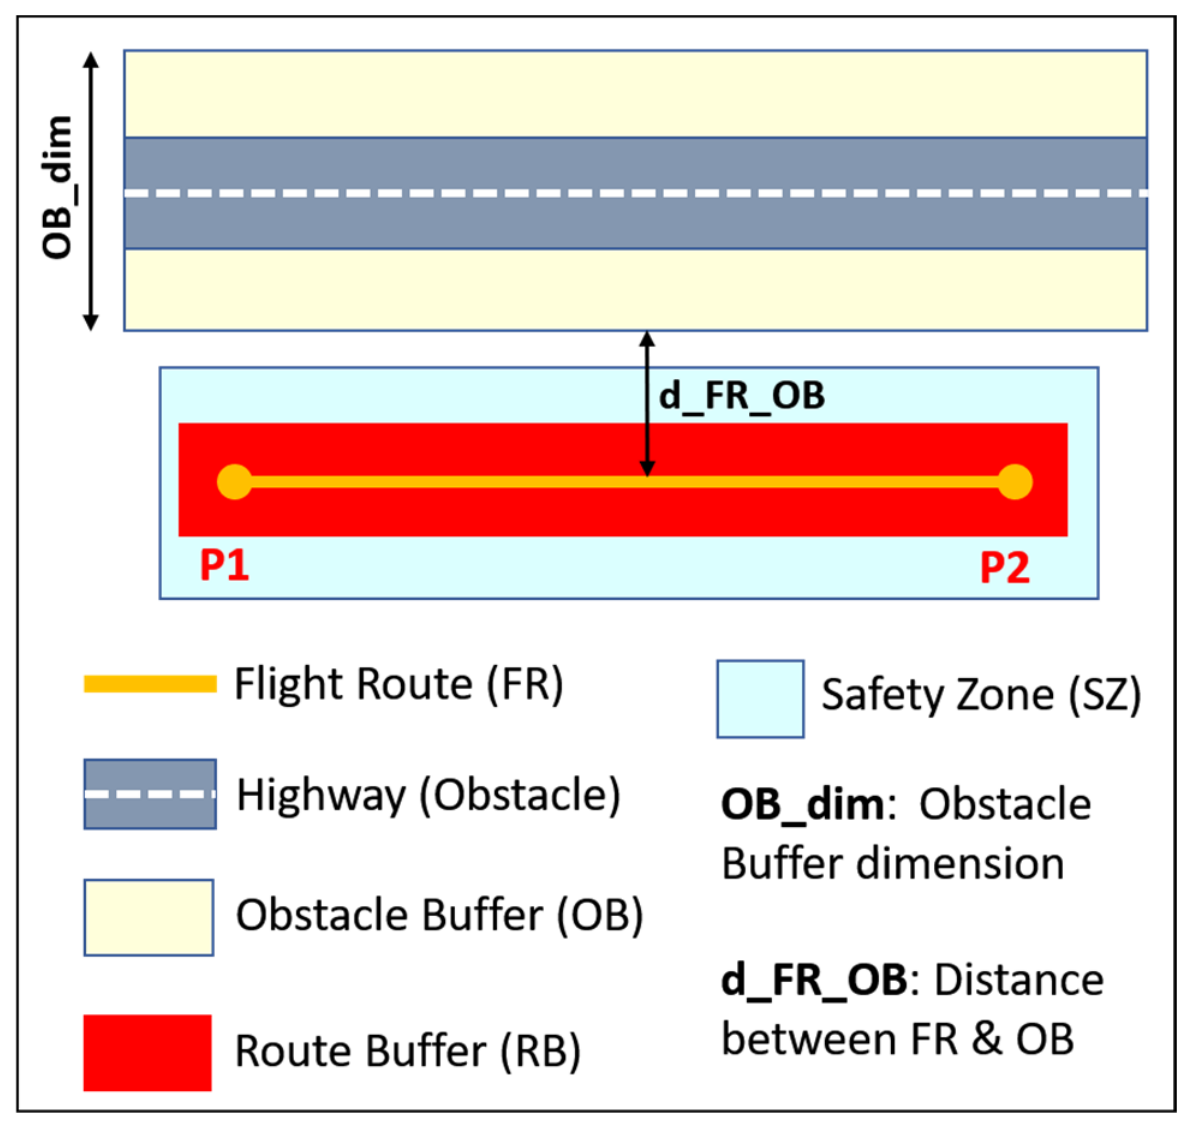
As discussed in Section 3, objects considered as obstacles in the UAV operating environment are represented as geographic features, specifically points, lines and 2D polygons. Although each obstacle may affect the planned flight route, its influence is basically limited to a specific surrounding area. This area can be defined as a risk area, the extent of which depends on the obstacle’s type and dimension. To mitigate obstacle-related risks, an obstacle buffer (OB) should be created around each obstacle. Provided that the UAV remains outside this buffer, the flight is assumed to be safe with respect to obstacle-related hazards. The dimension of the obstacle buffer (OB_dim) depends on both the obstacle type and the MSD required for UAV operations in its vicinity (cf. Table 2).
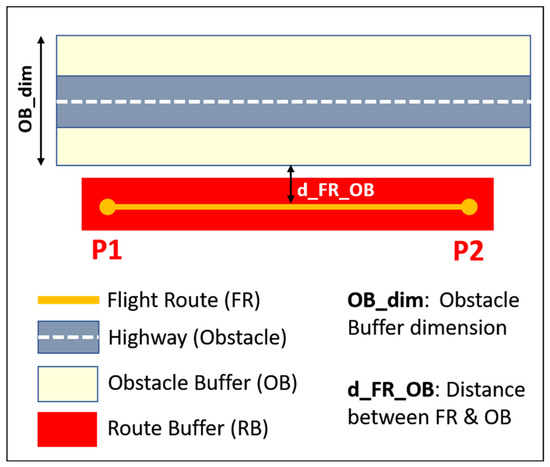
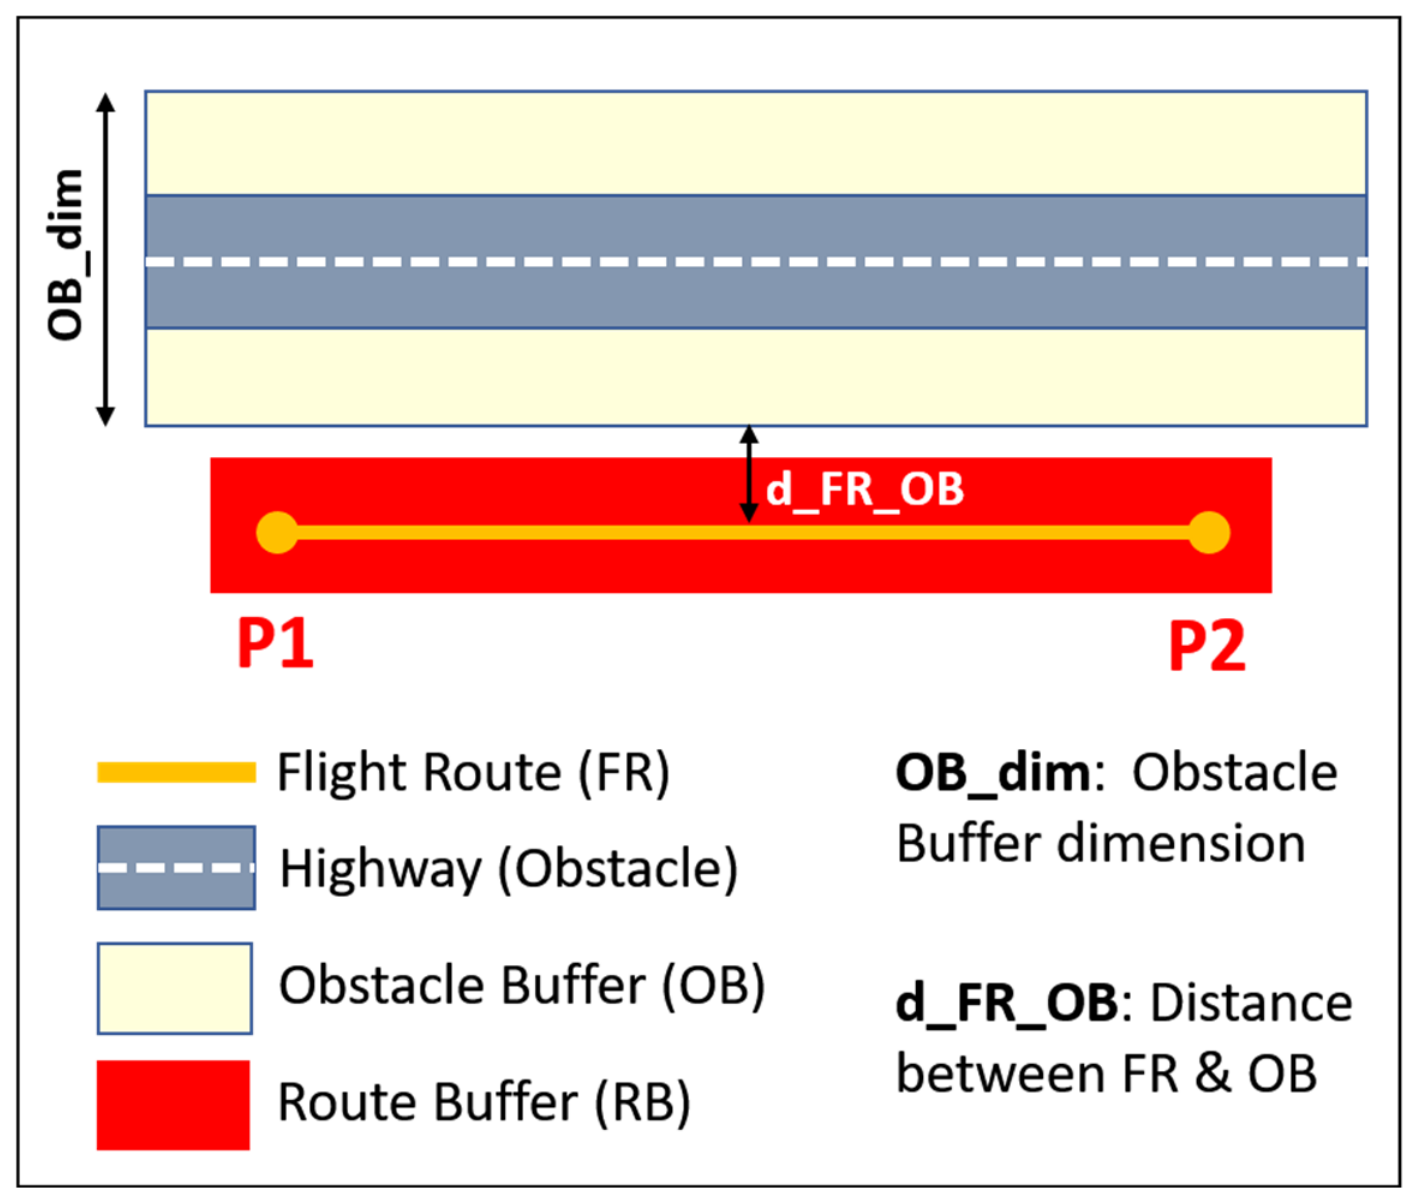
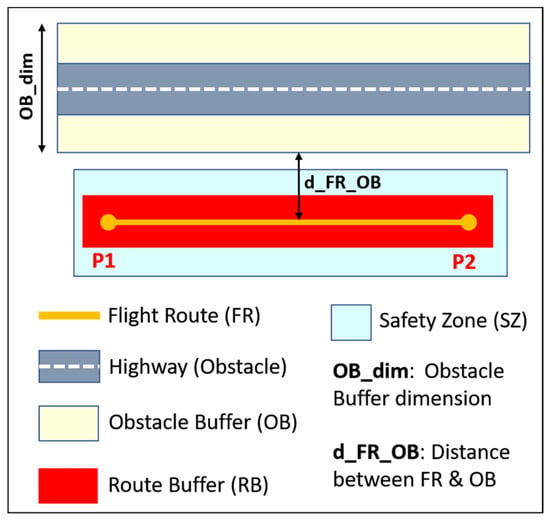
Figure 5 illustrates a Flight Route (FR) between points P1 and P2 located near a highway. Since the highway could be considered as an obstacle within the UAV environment, a specific OB is generated (shown in yellow in Figure 5). OB-dimension is determined based on the MSD values (Table 2) that should be maintained on both sides of that highway during UAV operation. However, path planners typically maintain also a sufficient safety distance from the OB-boundary, denoted as d_FR_OB.
Figure 5.
Flight Route (FR) between points P1 and P2, nearby a highway. Route buffer (RB in red) and obstacle buffer (OB in yellow) were created.
Although a flight route is inherently a linear feature, it makes sense to create a route buffer (RB, shown in red in Figure 5) around the UAV route to further minimize the likelihood of collisions. The dimension of RB is influenced by multiple factors such as UAV type, the complexity of the flight environment and the applicable regulatory requirements. Consequently, path planners should define the RB size by considering their operational experience together with relevant flight parameters.
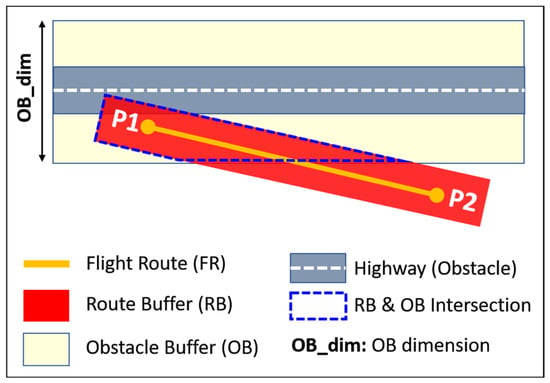
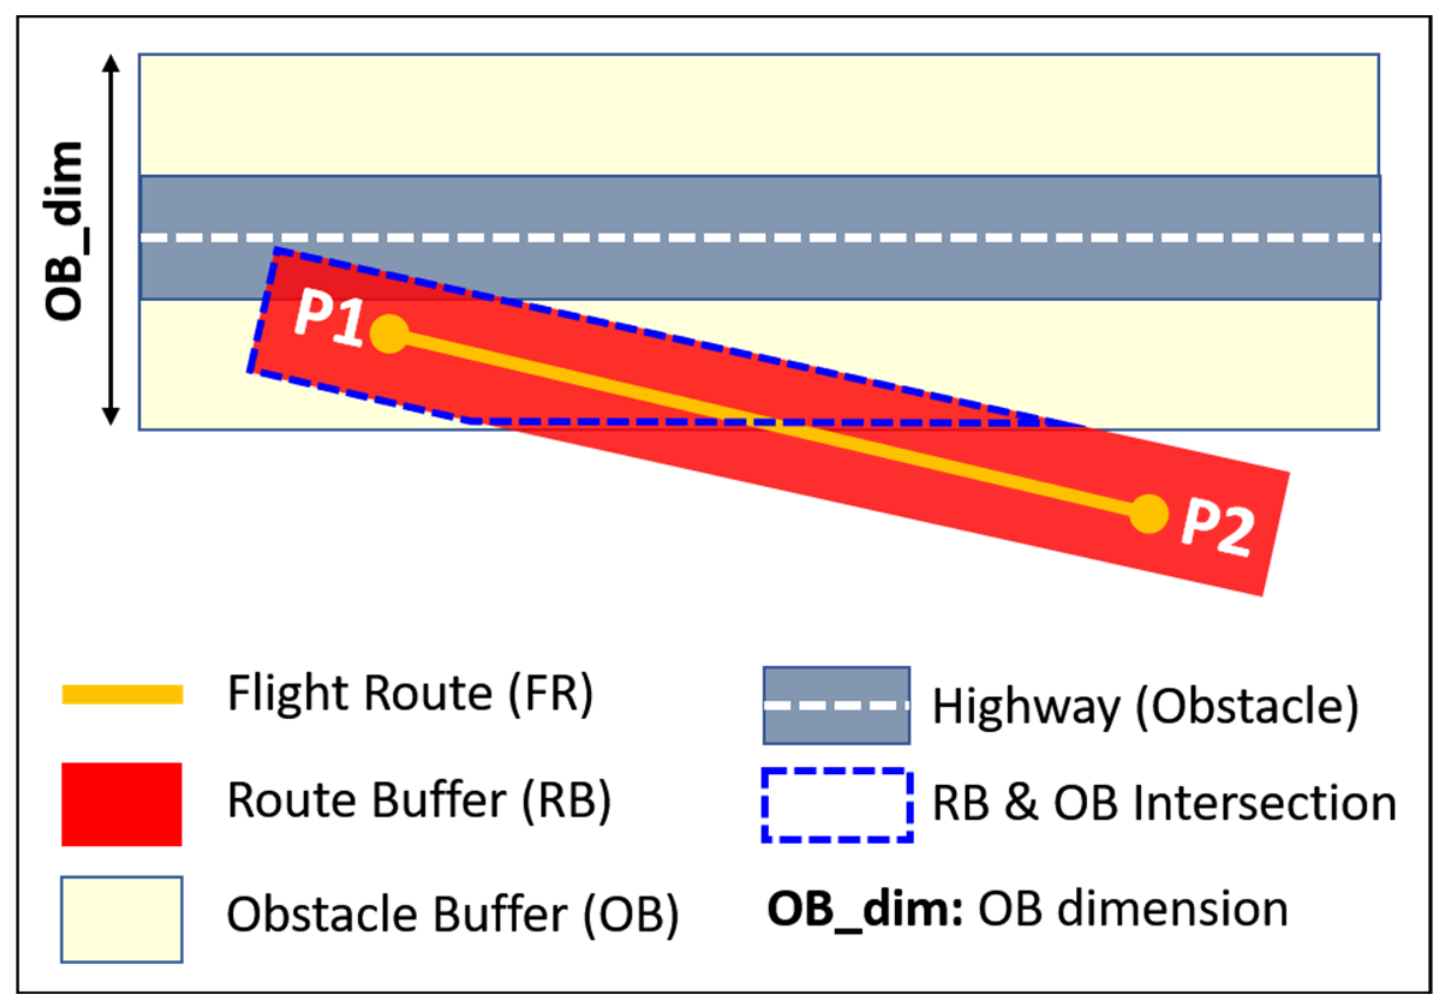
It can be assumed that, as long as no geometric intersection exists between OB and RB—as illustrated in Figure 5—the UAV operation remains somehow unaffected by the obstacle under consideration. Otherwise, potential risks may exist. In such a case, the interaction between the UAV flight route and surrounding obstacles can be determined by calculating the area of intersection between the RB and OB (Figure 6, dotted line in blue). This intersection can be defined as the Factor of Intersection (Fint), which represents the intersected area (A_int_RB_OB) relative to the area of entire obstacle (AOB), as follows:
Figure 6.
Intersection between route buffer (RB) and obstacle buffer (OB).
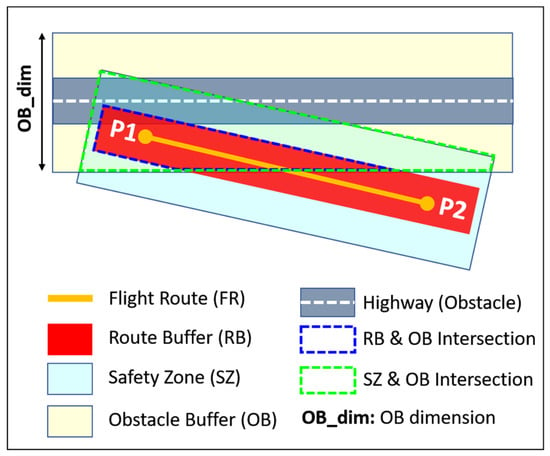
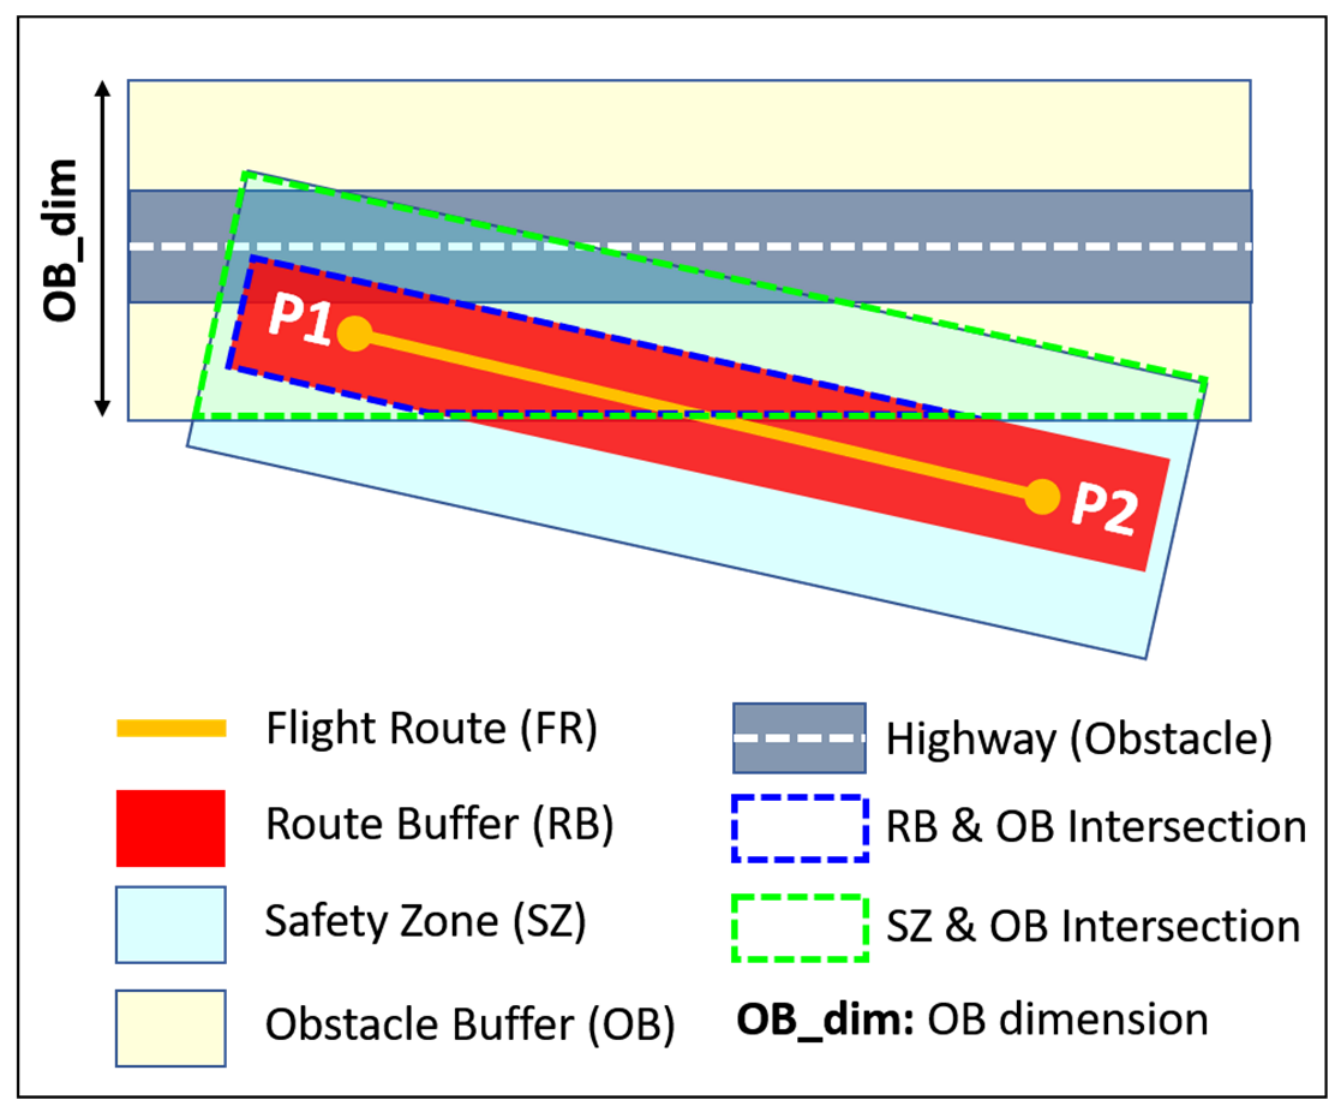
A key challenge lies in determining how the spatial extent of an obstacle influences the intersection factor. For instance, when considering a highway as an obstacle, its total length may extend for tens of kilometres, producing a correspondingly large obstacle buffer. However, the operational relevance of such a structure for UAV safety assessment is not uniformly distributed along its entire extent. In practice, only the portion of the obstacle that lies in proximity to the UAV flight path meaningfully contributes to collision risk, while distant segments have negligible influence despite being included in the full geometric representation. To address this issue (i.e., extent mismatch), the analysis introduces a Safety Zone (SZ) surrounding the route buffer, rather than relying on the full obstacle buffer, as shown in Figure 7. The SZ is defined as a controlled spatial expansion of the RB, expressed as a fixed multiple of RB dimension (e.g., 1×, 2×). This design choice was justified on both computational and methodological grounds. First, it ensures local relevance, as UAV risk is primarily driven by spatial proximity between the flight corridor and nearby obstacles, rather than the total global extent of those obstacles. By scaling the SZ relative to the RB, the methods—implemented in this work—adapt naturally to the geometry and scale of the planned route, maintaining consistency across different study areas and flight configurations. Second, the multiplicative formulation provides a normalized and transferable framework, avoiding arbitrary absolute distance thresholds that may not generalize across heterogeneous environments. Finally, this approach improves computational efficiency by restricting analysis to a relevant subset of the obstacle space, reducing unnecessary intersection calculations with distant segments that do not contribute meaningfully to risk estimation. In summary, the SZ serves both as an additional buffer around the RB and as a two-dimensional spatial limiter that ensures the analysis is restricted to areas of operational relevance. It achieves this by considering only the portion of the OB that intersects with the SZ, depicted as a green dotted line in Figure 7. This intersecting segment is subsequently used in the computation of the intersection factor. Accordingly, the area of entire obstacle (AOB) should be replaced by the intersection between SZ and OB, and the formula (1) should therefore be revised as follows:
Figure 7.
Safety Zone (SZ) as an additional safety area around the route buffer (RB). The intersection between SZ and OB is indicated by the green dotted line.
- ➢
- Interpretation of Fint valuesFint values will be discussed and interpreted according to the scenarios below:
- RB ꓵ OB ≠ 0: There is an intersection between RB and OB (as shown in Figure 7); meaning also: SZ ꓵ OB ≠ 0, and it leads that ; where the value 1 means a 100% overlap between RB and SZ (namely, RB and SZ are identical).
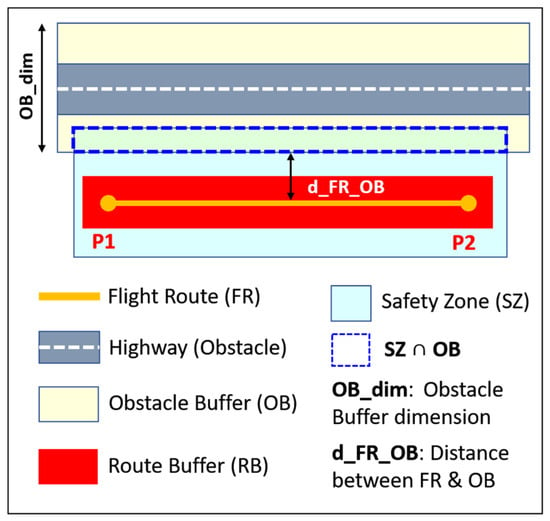
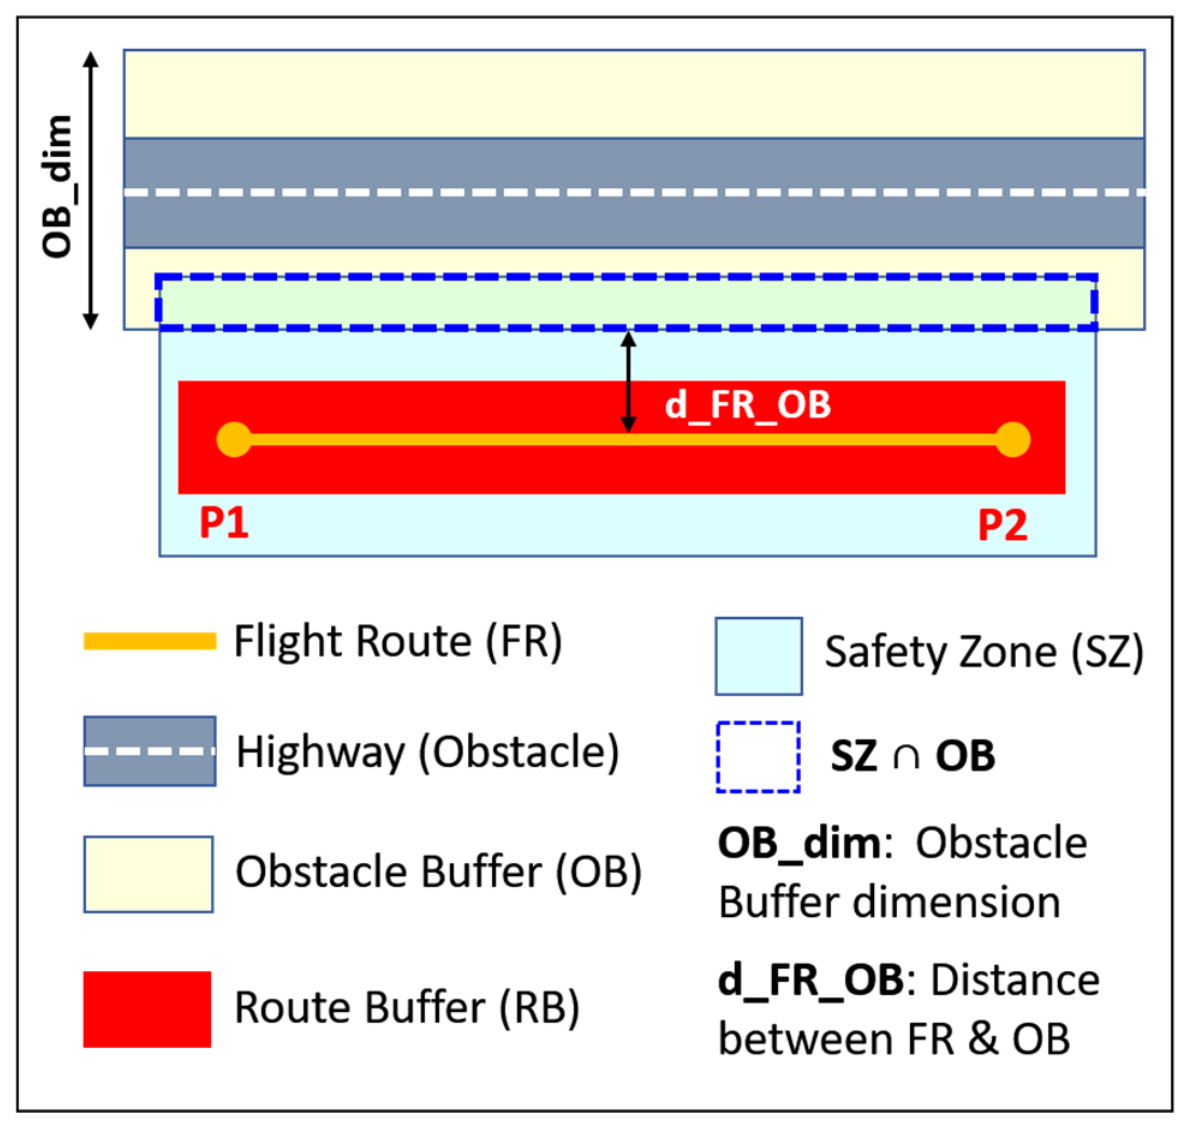
- RB ꓵ OB = 0 and SZ ꓵ OB ≠ 0: There is no intersection between RB and OB, but SZ intersects OB, (Figure 8); this leads to Fint = 0.
- RB ꓵ OB = 0 and SZ ꓵ OB = 0; this indicates that neither RB nor SZ intersected OB. Consequently, Fint is not defined, and we therefore set it to zero (Figure 9).
Figure 8. Illustration showing that there is no intersection between route buffer RB and obstacle buffer OB, while safety zone SZ intersects obstacle buffer OB.Figure 9. Illustration showing that RB and SZ do not intersect OB.
A zero value of Fint does not guarantee a completely safe flight path or operation. Route safety is also affected by other parameters, including for instance flight speed, the distance between UAV route and surrounding obstacles. The latter can be determined through the minimum distance needed to define the obstacle buffer dimension (Table 2). In theory, UAV path planners can operate safely as long as flight paths remain within the defined obstacle buffer constraints. In practice, however, an additional safety distance (namely, d_FR_OB) is typically applied to the obstacle buffer boundary to further enhance operational safety. Consequently, a new factor—termed as distance factor (Fdis)—should be incorporated into the risk assessment. This factor can be determined as follows:
where disapp: the distance_to_an_obstacle applied during a flight operation.
Accordingly, to account for the influence of the two factors discussed above on the risk assessment, the Expected Risk Value (ERV) for an obstacle (Oi) can be determined through a mathematical relationship that combines both factors (formulas (2) and (3)) in an additive relationship as follows:
An additive relationship is adopted instead of a multiplicative one because the intersection and distance factors represent complementary risk components rather than mutually dependent variables. The additive formulation allows each factor to contribute independently to the ERV, ensuring that a high value of either the intersection factor or the distance factor is sufficient to increase the overall risk. This is particularly desirable in safety critical applications, where an obstacle may pose a significant hazard due to its close proximity despite a moderate likelihood of path intersection, or vice versa.
In contrast, a multiplicative formulation may suppress the overall risk when either factor is small. Specifically, if one factor approaches zero, the resulting ERV also approaches zero regardless of the magnitude of the other factor, potentially underestimating the risk associated with obstacles that are critical according to only one criterion. Moreover, the multiplicative model introduces a stronger nonlinear coupling between the two factors, making the risk assessment more sensitive to a factor scaling and normalization. Therefore, the additive formulation provides a more robust, interpretable and conservative measure of risk by preserving the independent contribution of each factor. It avoids the unintended attenuation of risk inherent in multiplicative models and ensures that either a high probability of path intersection or close obstacle proximity can independently elevate the expected risk.
Although the present work employs an unweighted additive formulation, the proposed ERV model can be extended by introducing weighting factors to account for the relative importance of the intersection and distance factors. However, determining appropriate weighting coefficients requires comprehensive experimental validation and is beyond the scope of the present study. Therefore, the implementation of weighted factors is identified as an important direction for a future work to further improve the accuracy and adaptability of the proposed risk assessment framework.
Next, ERVi assigned to an obstacle can be subsequently aggregated to the Total Expected Risk (TER) of the proposed flight route, as follows:
Flight routes with high TER values can indicate lower safety levels, suggesting that re-routing may be necessary. However, defining a precise threshold for what constitutes a “high TER” is challenging, as it depends on numerous factors including UAV type and model, technical specifications and regulatory constraints. To address that, a research work is underway to categorize TER results into well-defined safety levels.
5. Implementation
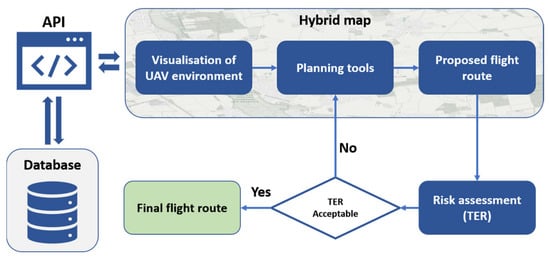
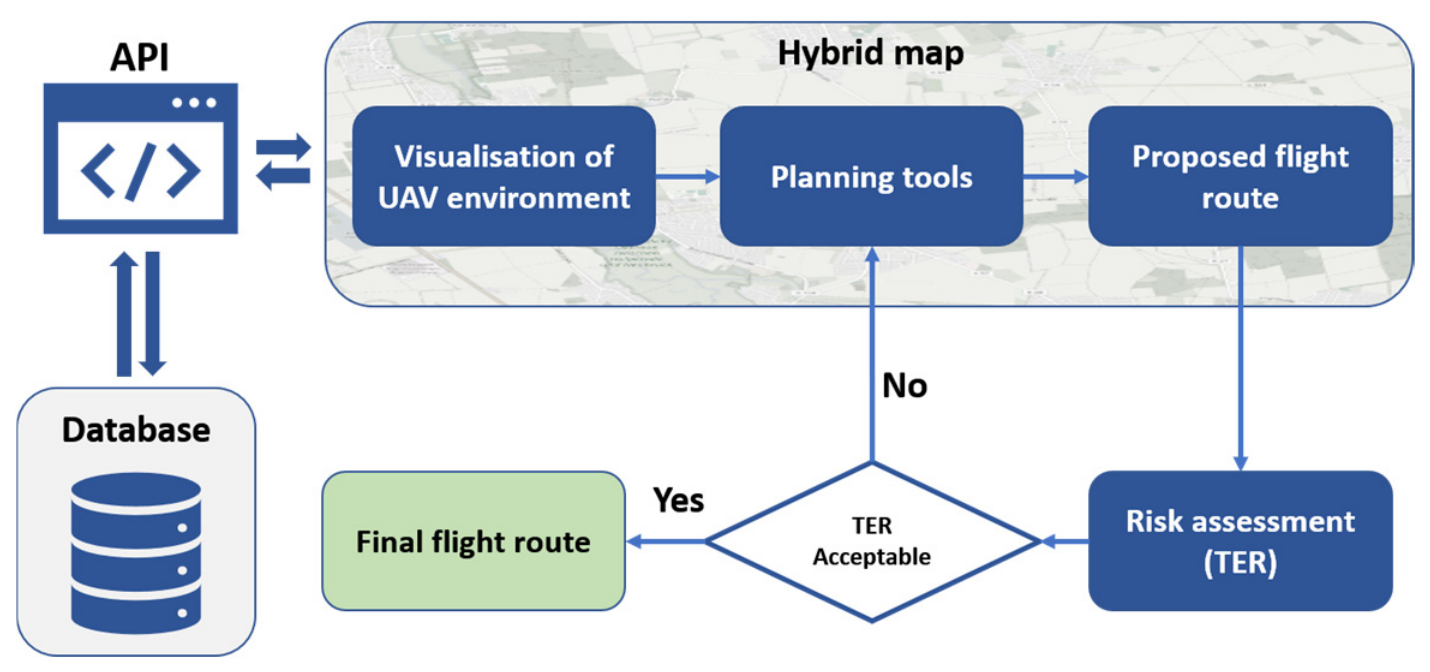
In this section, we present the practical implementation of the concepts discussed in Section 3 and Section 4. Specifically, these concepts were implemented through the development of a browser-based prototype that is compatible with all major web browsers. Figure 10 shows that the core component of the prototype is a hybrid map that displays and visualizes obstacles in the UAV environment as 2D shapes. The map was built using the open-source mapping library “Leaflet” [22], which is a lightweight framework known for its efficient performance and fast rendering. Standard map functions and planning tools such as zooming, drawing and panning are natively supported. These tools enable path planners to create flight routes. For more advanced geospatial analyses, the Turf.js library was integrated [23]. This library allows, for example, the generation of obstacle buffers within the UAV environment. It was also used to realize and implement the TER concept and its corresponding calculation process described in Section 4. Importantly, all geospatial analyses were executed on the client side.
Figure 10.
Implementation of the flight planning prototype.
To facilitate communication between the database and the client application, an Application Programming Interface (API) was implemented. The API was developed using JavaScript and Node.js [24] and was hosted on the same server as the database. It provides access to both geometric and semantic data, which are delivered in the standardized GeoJSON format. This format allows seamless integration into web-based mapping applications. At the current stage, the API supports only data retrieval from the database; the addition of new data is not yet implemented.
6. Results Discussion and Evaluation
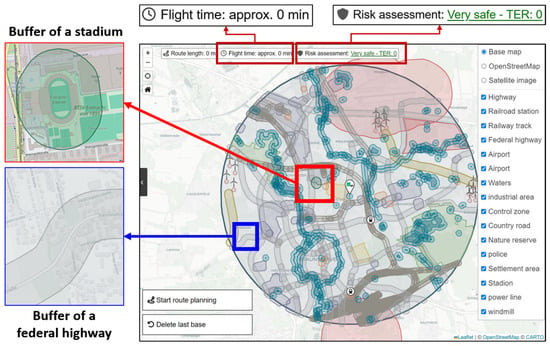
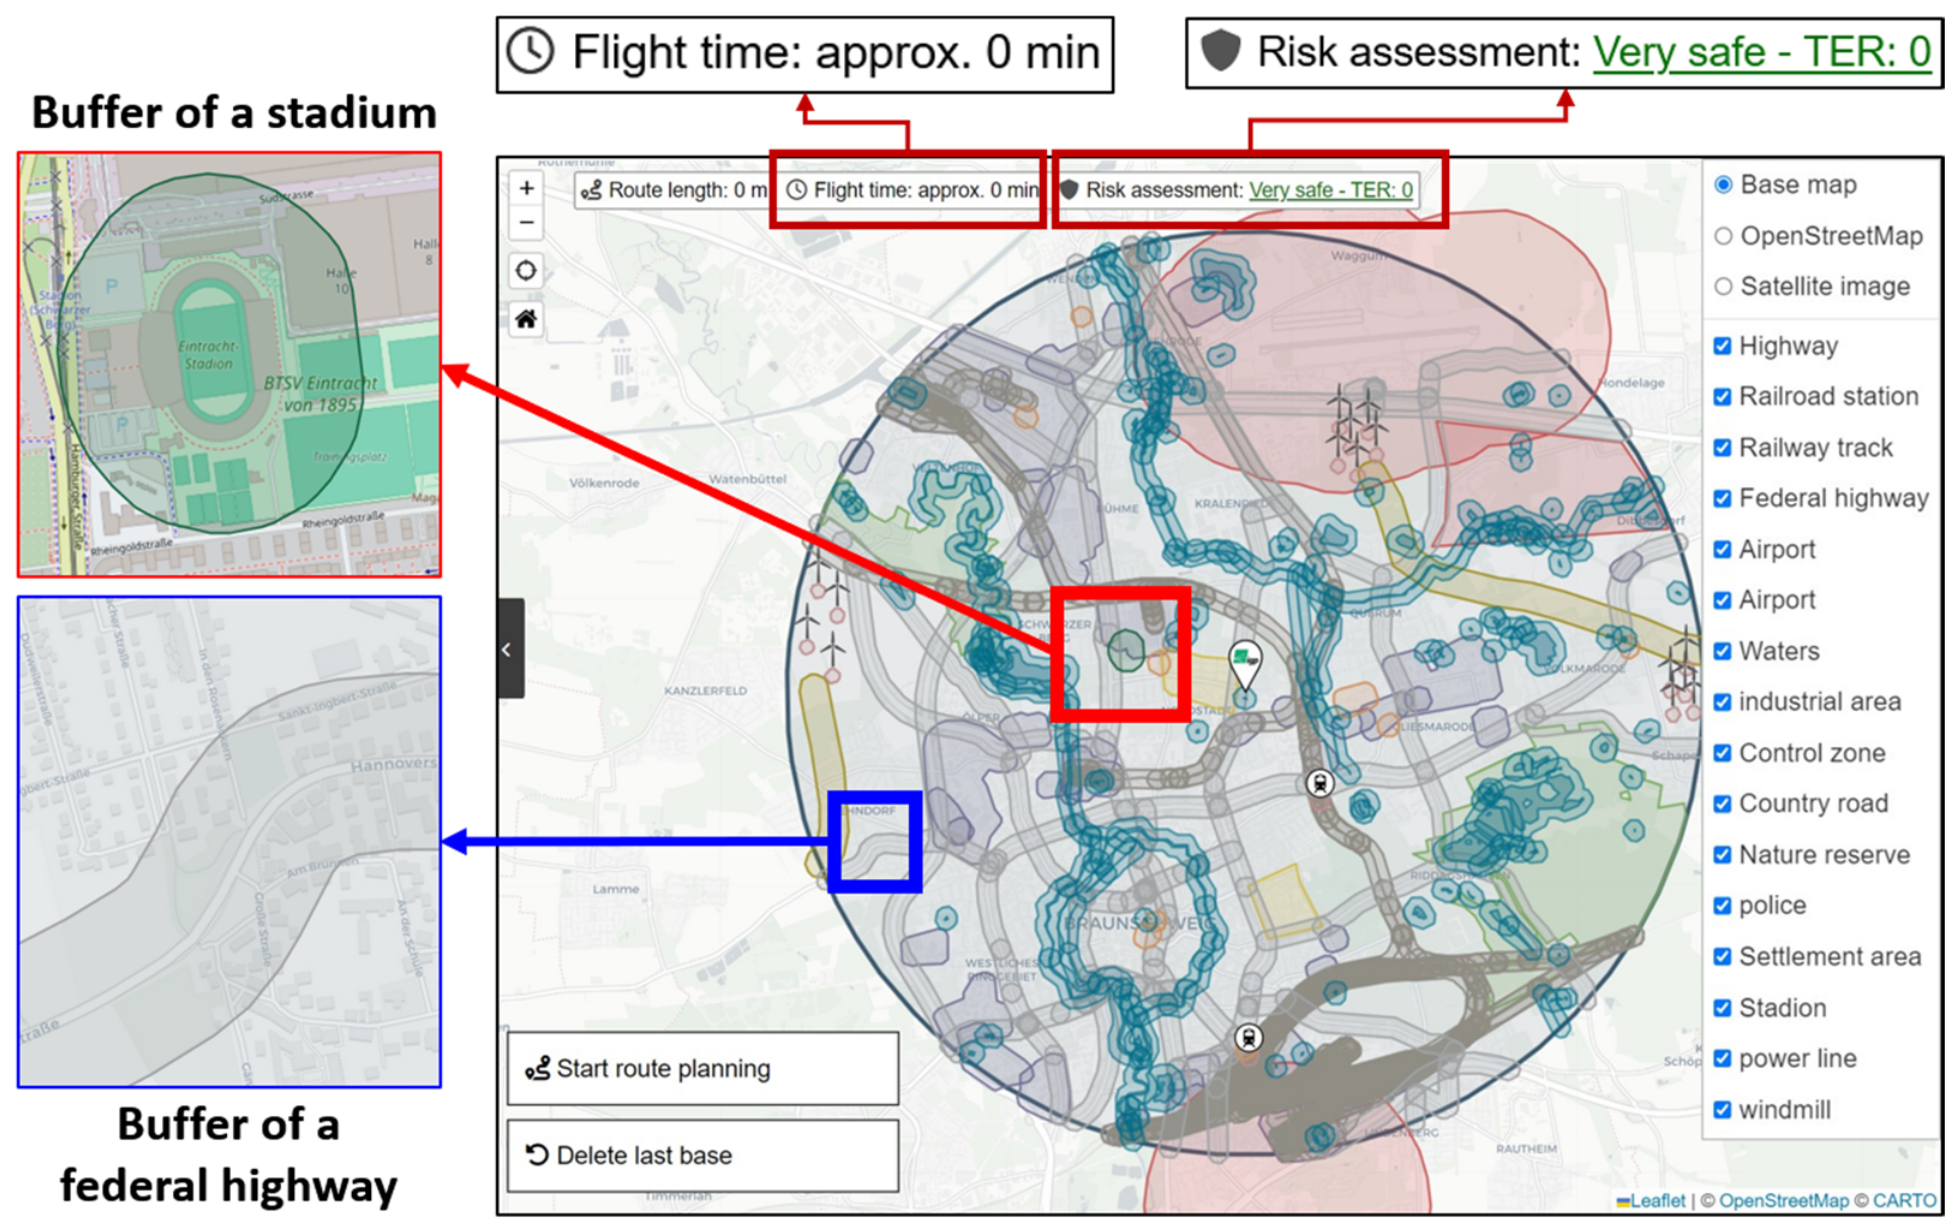
The hybrid map as the central component of the prototype is shown in Figure 11. The map displays the geometric data as 2D layers of objects and obstacles within the study area along with their corresponding obstacle buffers. To enhance clarity, individual datasets can be toggled on/off using the layer control located on the right-side of the map. New flight routes can be generated using the control elements located at the bottom left of the map. Essential information about each planned route such as the current route length, estimated flight time and TER is displayed at the top of the interface.
Figure 11.
Hybrid map of FPP showing all relevant 2D data layers, including objects, obstacles and their corresponding obstacle buffers. A close view of two obstacle buffers representing a stadium and a federal highway is also shown (left).
When planning a new flight route, the prototype continuously checks for intersections between the proposed UAV path and defined geographical areas. For this purpose, it employs the intersect function from the Turf.js library. If the route intersects with an obstacle—namely, with its associated safety buffer (OB)—a warning is issued. In addition, the prototype automatically conducts background checks to verify compliance with established regulations. Objects intersecting the route are highlighted on the map, and such intersections will increase the TER value of the planned route in accordance with Formula (5). The path planner can then decide whether to accept the generated path or to create an alternative route. To support this process, the prototype provides a comprehensive list of key regulations enabling a quick and reliable decision-making.
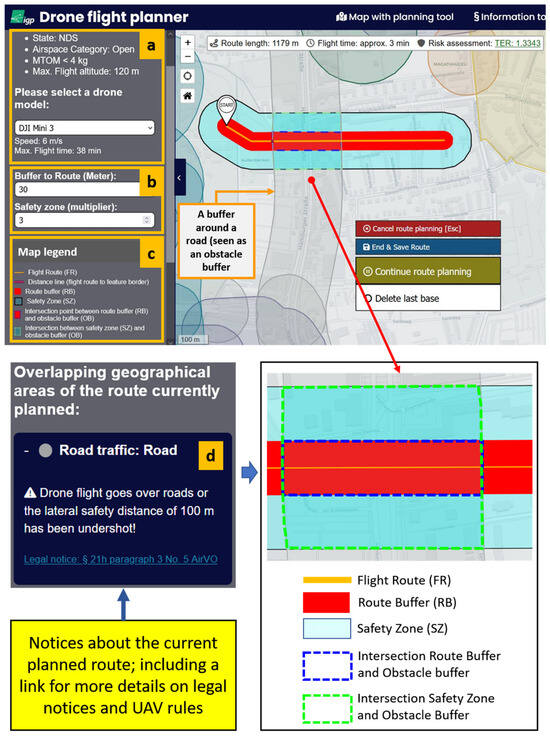
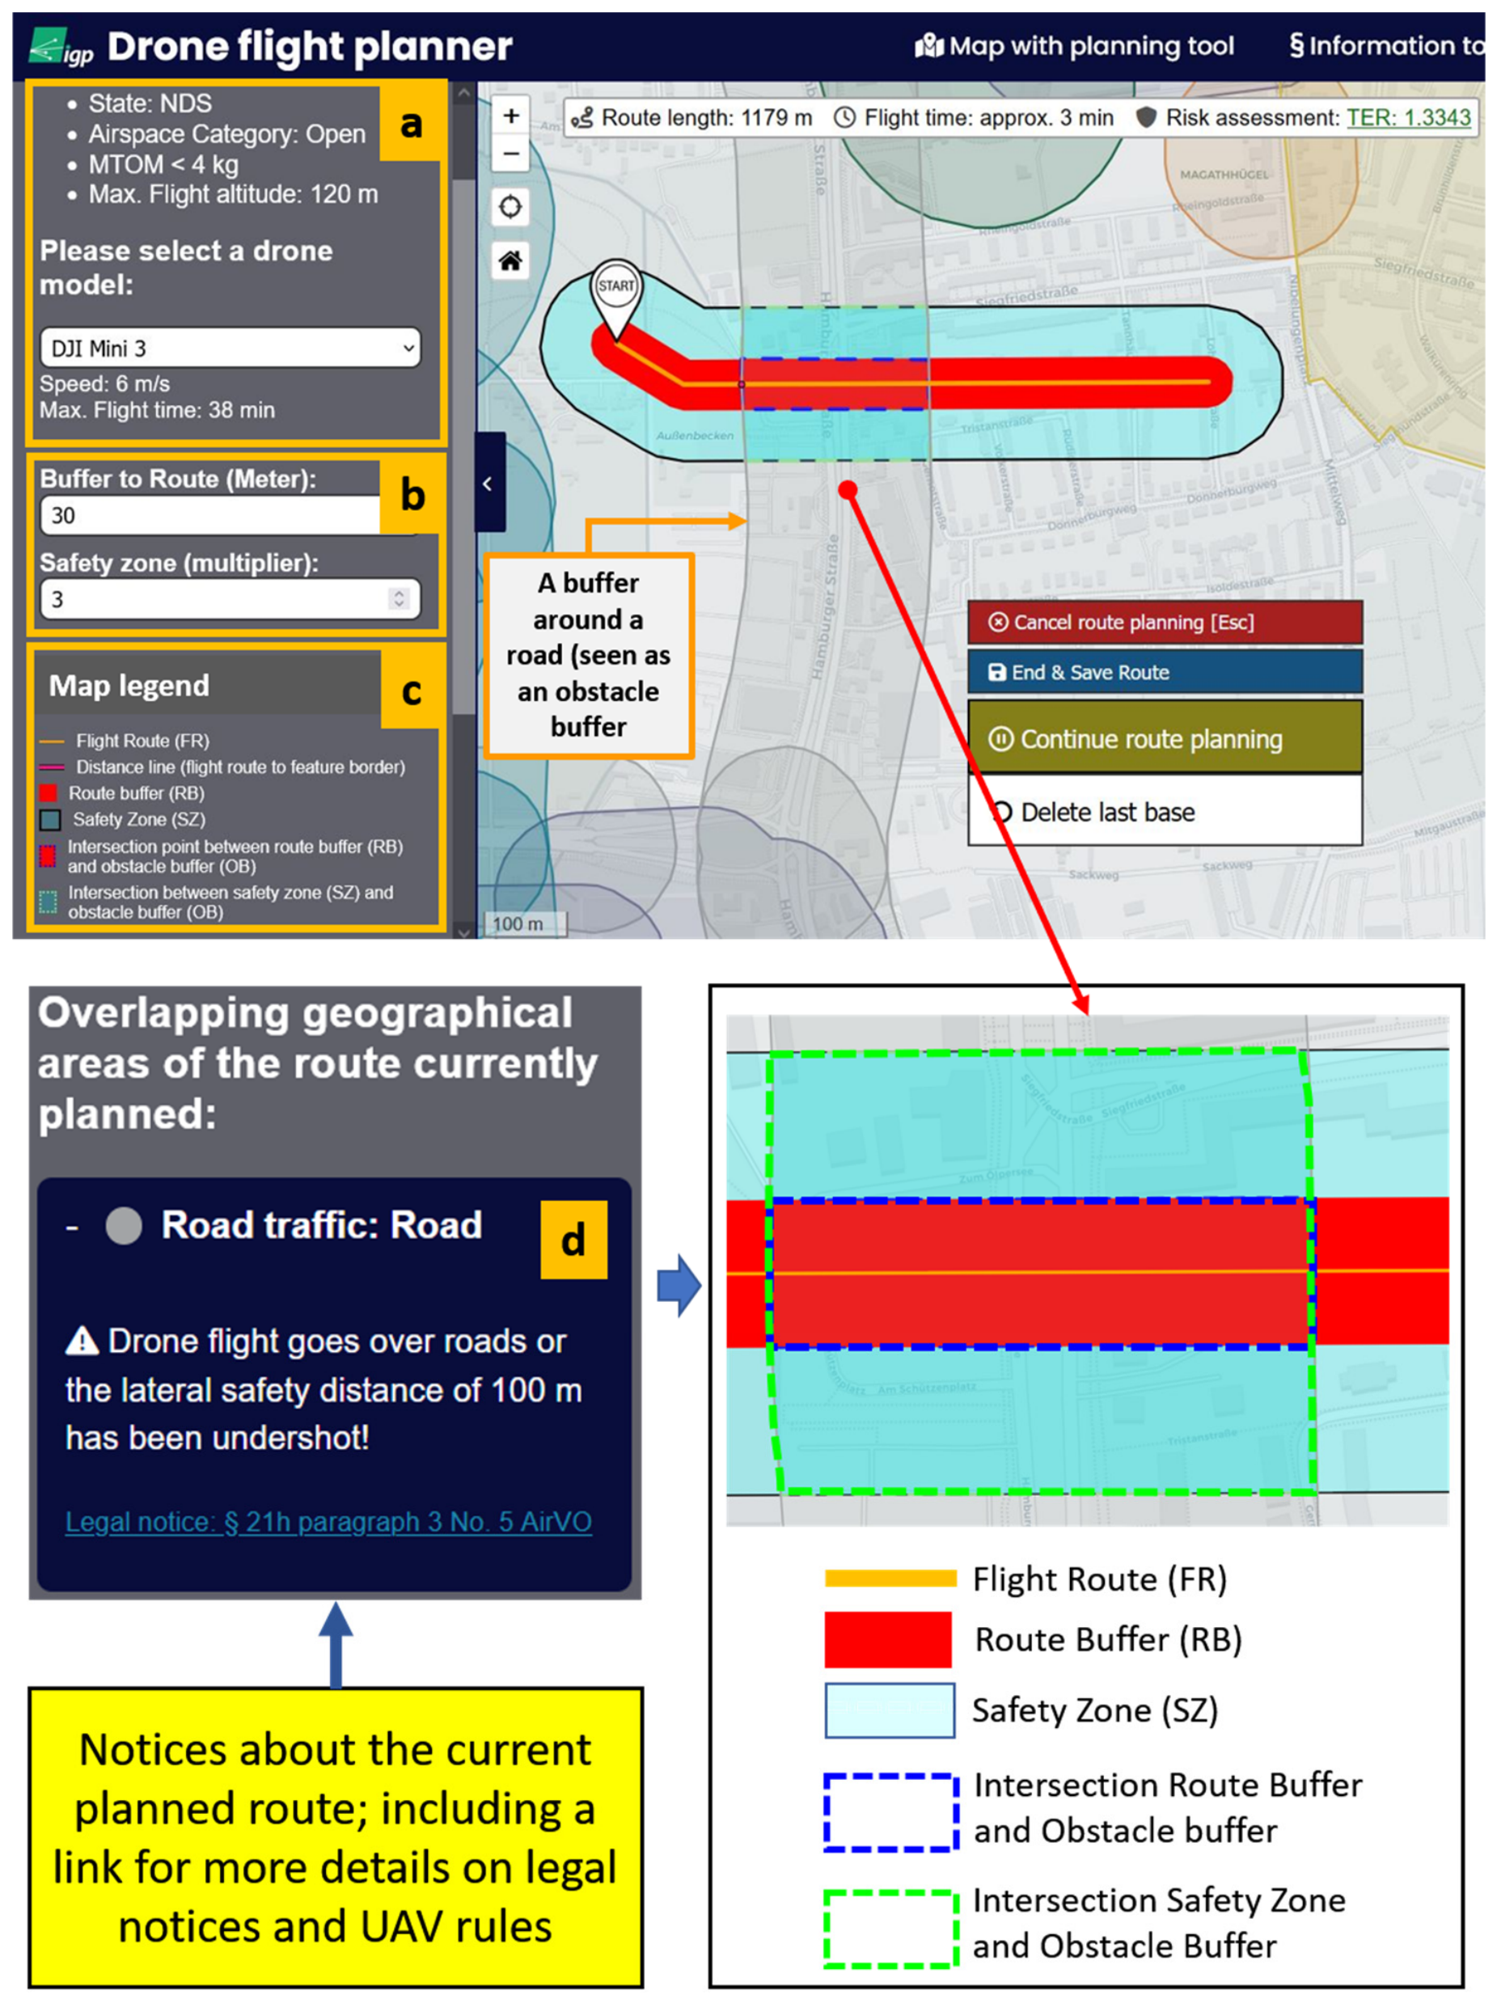
Figure 12 illustrates the FPP interface, showing an example of a generated flight route along with the corresponding flight parameters displayed in the above-left panel (Figure 12a); for instance, operation category, UAV model, flight speed, etc. In this example, the flight route is enclosed by a route buffer RB of 30 m and SZ defined as three times the RB (Figure 12b). The planned route intersects a federal road, which is considered an obstacle, highlighting the importance of complying with specific UAV regulations applicable to such areas. In this context, the FPP provides path planners with relevant notifications and regulatory information regarding the planned route, as illustrated in (Figure 12d). Finally, additional parameters of the generated flight such as total flight time, flight length and the total risk value TER are also presented.
Figure 12.
FPP interface showing a flight route crossing a federal road buffer (above). (a) The path planner selects UAV model and specific flight parameters such as speed, etc. (b) Safety zones around the route buffers can be generated. (c) The map legend explains the visual representation of the flight route, route buffer, safety zone, obstacle buffers and their intersections. (d) Notifications and warnings together with references to the applicable UAV regulations. Supplementary flight parameters such as the estimated flight duration, total route length and TER value are also presented.
FPP Evaluation
Since the preliminary FPP framework was developed as a proof-of-concept implementation to demonstrate the feasibility of the proposed methodology while maintaining computational efficiency and implementation simplicity, its evaluation was conducted using a set of formalized assessment criteria. These criteria were defined to systematically assess the correctness of the input datasets and their processing pipeline, the consistency of regulatory rules application, and the functional integrity of the FPP components, as discussed below.
- Criterion 1: Dataset storage and retrievalEfficient storage and retrieval of datasets require a robust data management platform, as the way data is managed directly affects its accessibility and retrieval speed for path planning. For this, a PostgreSQL/PostGIS-based database platform was implemented for data management. PostgreSQL offered straightforward access to stored data and ensured compatibility with various data processing and retrieval tools such as QGIS. Additionally, PostGIS extends PostgreSQL with spatial database capabilities, providing supported for geographic objects and enabling location-based queries using Structured Query Language (SQL).
- Criterion 2: Usability of FPPUsability evaluation is a critical component of the overall design of the client interface. We assessed the usability of the FPP based on three main aspects, as follows [25,26]:
- Consistency: Initial results indicated that the client interface was well-designed in accordance with key conceptual and logical standards of web design. It provided an effective mechanism for performing relevant organizational and functional tasks. Consequently, users can become familiar with the FPP interface commands without needing to learn new techniques and skills. Furthermore, adherence to established standards for colour schemes, layout and page titles helped to minimize navigation difficulties within the FPP interface.
- User control options: The client interface design offered several control options, enabling users to navigate and manage their interactions easily. For example, users can move forward or backward through pages, return to the homepage, or cancel ongoing operations as needed.
- Ease of learning: The interface was intentionally designed to be simple and intuitive, minimizing unnecessary complexity. As such, it avoided the use of obscure technical terms, unfamiliar icons, or intricate interface elements. However, the prototype is not intended for complete novices in the field of UAV flight planning.
Although a final evaluation of the FPP’s usability requires testing with a representative group of users, the selected design concepts provide and facilitate a strong foundation for developing a user-friendly product/tool. It is important to note that evaluating the FPP’s usability does not constitute a scientific and practical validation of the FPP concept itself. Nevertheless, usability is essential for the successful adoption of the FPP, as users are likely to rely on it for flight route planning only if it is intuitive, consistent and efficient to use.
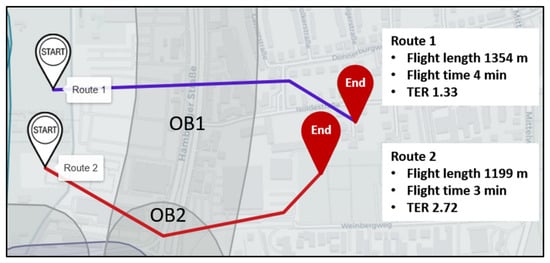
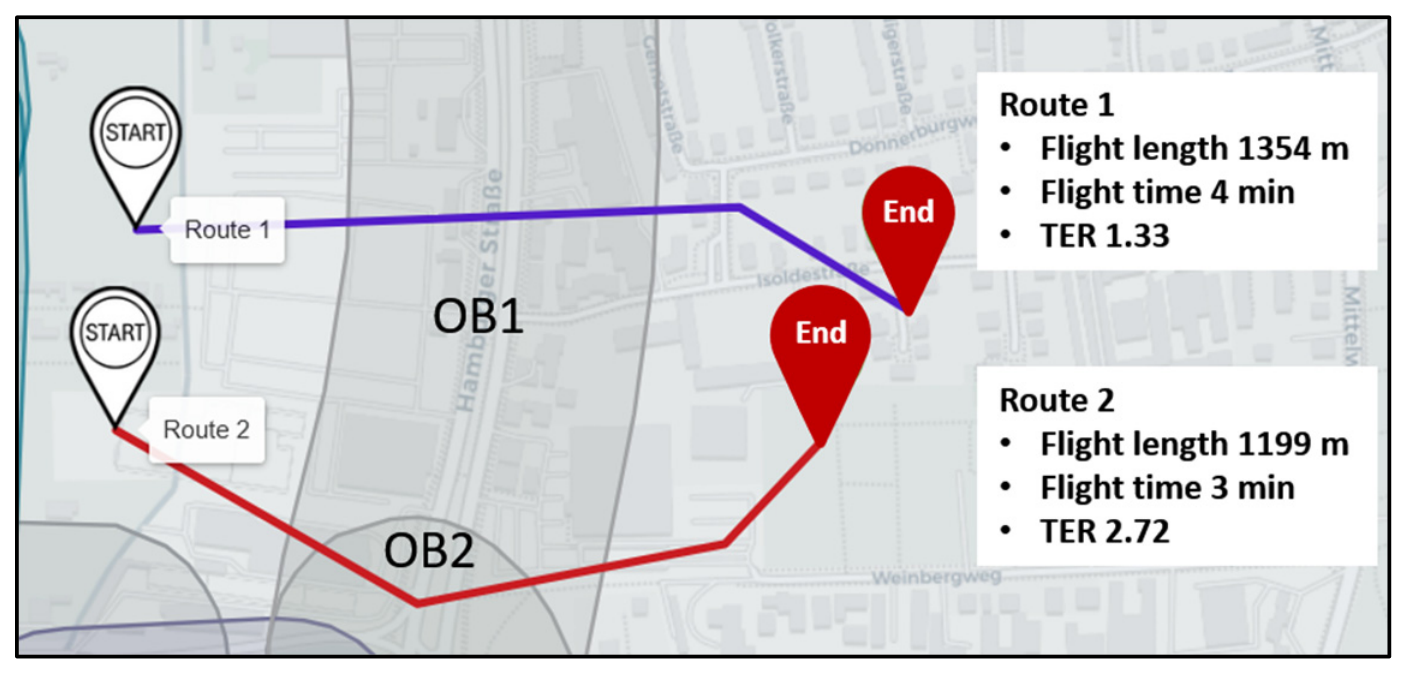
- Criterion 3: TER-based vs. geometric-only risk assessmentThe FPP supports the generation of multiple candidate flight routes, each associated with a corresponding TER value, enabling a more comprehensive comparison and facilitating the selection of the safest trajectory (Figure 13). This capability further highlights the advantages of TER-based risk assessment, which integrates both semantic and geometric representations of the UAV environment to provide a more informative and context-aware evaluation than approaches relying solely on geometric information.
Figure 13.
Two planned flight routes are shown, each with its own characteristics. TER of the second route is higher than that of the first route because it, in this case, crosses two obstacle buffers: OB1 (a road buffer) and OB2 (an industrial area).
Regarding a comparison with geometric-only risk assessment approaches, we acknowledge that such a comparison would provide valuable insight into the contribution of semantic information within the proposed framework. However, a quantitative comparison has not been conducted at this work stage, as it requires a common experimental framework in which both approaches are evaluated using the same datasets, equivalent geometric information and identical performance criteria.
The current implementation of the FPP is based on a 2D representation that integrates semantic information with obstacle occupancy and spatial location but does not include detailed 3D geometric characteristics such as obstacle height and volume. Since many geometric-only risk assessment approaches rely heavily on these 3D geometric attributes, a direct quantitative comparison would not constitute a fair or scientifically rigorous evaluation of the respective methods. Instead, this work focuses on demonstrating the conceptual benefits of incorporating semantic information into UAV risk assessment. A comprehensive quantitative evaluation will therefore be conducted in a future work using datasets that provide both detailed 3D geometric information and semantic annotations, thereby enabling a rigorous, objective and unbiased comparison between semantic-based and traditional geometric-only approaches.
Despite the aforementioned limitations related to 3D geometric data, Table 3 provides a qualitative comparison between the proposed semantic-based approach and geometric-only approaches for UAV risk assessment.
Table 3.
Semantic-based vs. traditional geometric-only risk assessment.
- Criterion 4: Lack of real-word FPP validationIn accordance with the scope of this work, evaluation of the FPP framework under real-world flight conditions was not feasible due to operational, regulatory and safety-related constraints associated with UAV testing in controlled airspace.Real-world validation would introduce external uncertainties, including dynamic conditions, temporary airspace restrictions and unpredictable environmental factors, which could obscure the isolated assessment of the proposed methodology. Furthermore, the primary objective of this study was the methodological development and verification of the TER-based risk assessment and routing framework, rather than operational deployment. Consequently, validation was conducted within a controlled simulation environment using geospatial datasets and formalized safety constraints. This approach ensures reproducibility, enables consistent comparison of route alternatives, and supports stable evaluation of TER values without external variability. Therefore, the absence of real-world flight testing does not compromise the validity of the proposed framework, but rather ensures a controlled and methodologically consistent assessment of its core functionalities.
7. Conclusions
In this paper, a prototype for 2D UAV path planning was introduced. It integrates both geometric and semantic background information to enable the planning of 2D flight routes and the estimation of their associated risk levels. In addition, the prototype provided UAV pilots with essential regulatory information to promote the highest levels of operational safety for both the UAV system and people on the ground.
At its current stage, the prototype remains an early implementation with certain limitations that must be addressed before practical deployment. One key limitation is that it currently relies solely on 2D geometric data. Since a safe route planning also depends on maintaining an appropriate flight altitude, future development should extend the system to incorporate a third dimension. Ideally, this enhancement would allow routes to be planned and visualized directly within a 3D viewer, thereby improving the pilot’s situational awareness of potential risk areas.
Ongoing work aims to improve the prototype’s efficiency and overall functionality. Current efforts focus on optimizing the client-server communication (via GET/POST methods), refining the geometric and semantic datasets, and integrating additional factors into the risk assessment process.
Author Contributions
Conceptualization, A.A., C.B. and K.W.; methodology, A.A., C.B., K.W. and M.S.B.; validation, A.A. and C.B.; formal analysis, A.A.; data curation, A.A., C.B. and K.W.; writing—original draft preparation, A.A.; writing—review and editing, A.A., C.B., K.W. and M.S.B. All authors have read and agreed to the published version of the manuscript.
Funding
This research received no external funding.
Data Availability Statement
The datasets used in the manuscript are open source. The application code can be provided by the corresponding author upon request.
Acknowledgments
The authors would like to thank Markus Gerke for his supports and suggested ideas.
Conflicts of Interest
Author Konstantin Wenzlaff is employed by the company Avacon Netz GmbH, Helmstedt, Germany. The authors declare that the research was conducted in the absence of any commercial or financial relationships that could be construed as a potential conflict of interest.
References
- Asghari, O.; Ivaki, N.; Madeira, H. UAV Operations Safety Assessment: A Systematic Literature Review. ACM Comput. Surv. 2025, 57, 1–37. [Google Scholar] [CrossRef] [Scilit]
- Fitrikananda, B.P.; Jenie, Y.I.; Sasongko, R.A.; Muhammad, H. Risk Assessment Method for UAV’s Sense and Avoid System Based on Multi-Parameter Quantification and Monte Carlo Simulation. Aerospace 2023, 10, 781. [Google Scholar] [CrossRef] [Scilit]
- Tang, H.; Zhu, Q.; Qin, B.; Song, R.; Li, Z. UAV path planning based on third-party risk modeling. Sci. Rep. 2023, 13, 22259. [Google Scholar] [CrossRef] [Scilit] [PubMed]
- Marzec, D.; Fellner, R. Review of risk assessment tools and techniques for selected aspects of functioning aerodrome operator. WUT J. Transp. Eng. 2023, 136, 5–22. [Google Scholar] [CrossRef] [Scilit]
- Federal Aviation Administration. Aviation Instructor’s Handbook. 2020. Available online: https://www.faa.gov/sites/faa.gov/files/regulations_policies/handbooks_manuals/aviation/aviation_instructors_handbook/aviation_instructors_handbook.pdf (accessed on 21 July 2026).
- Allan, J. A heuristic risk assessment technique for birdstrike management at airports. Risk Anal. 2006, 26, 723–729. [Google Scholar] [CrossRef] [Scilit] [PubMed]
- Falavigna, G.P.; Iescheck, A.L.; Souza, S.F.D. Obstacles risk classification model in aerodromes protection zones using the multi-criteria decision analysis ahp. Bol. Ciências Geodésicas 2021, 27, e2021027. [Google Scholar] [CrossRef] [Scilit]
- Kirkland, I.D.L.; Caves, R.E.; Humphreys, I.M.; Pitfield, D.E. An improved methodology for assessing risk in aircraft operations at airports, applied to runway overruns. Saf. Sci. 2004, 42, 891–905. [Google Scholar] [CrossRef] [Scilit]
- Spriggs, J. Airport Risk Assessment: Examples, models and mitigations. In Components of System Safety; Springer: London, UK, 2002; pp. 183–195. [Google Scholar]
- Yousefi, Y.; Karballaeezadeh, N.; Moazami, D.; Sanaei Zahed, A.; Mohammadzadeh, S.D.; Mosavi, A. Improving aviation safety through modeling accident risk assessment of runway. Int. J. Environ. Res. Public Health 2020, 17, 6085. [Google Scholar] [CrossRef] [Scilit] [PubMed]
- Wackwitz, K.; Boedecker, H. Safety Risk Assessment for UAV Operation; Safe Airspace Integration Project, Part 1; Drone Industry Insights: Hamburg, Germany, 2015. [Google Scholar]
- Wyszywacz, W. Easy Risk Assessment for Unmanned Aircraft Systems: Outline of the Method. Trans. Aerosp. Res. 2022, 2022, 32–47. [Google Scholar] [CrossRef] [Scilit]
- European Union Aviation Safety Agency EASA. Regulations (EU) 2019/947 and 2019/945, 2019. Revision (New Published in July 2024). Available online: https://www.easa.europa.eu/en/downloads/110913/en (accessed on 13 June 2026).
- Predefined Risk Assessment PDRA. 2019. Available online: https://www.easa.europa.eu/en/domains/drones-air-mobility/operating-drone/specific-category-civil-drones/predefined-risk-assessment-pdra#group-easa-downloads (accessed on 19 May 2026).
- Joint Authorities for Rulemaking on Unmanned Systems JARUS. Available online: http://jarus-rpas.org/ (accessed on 10 June 2026).
- Alamouri, A.; Lampert, A.; Gerke, M. New UAS regulations in the EU and their impact on effective usage of UAS. In Proceedings of the Dreiländertagung der DGPF, OVG und SGPF, Dresden, Germany, 5–6 October 2022; Publikationen der DGPF, Band 30; Geschäftsstelle der DGPF: Stuttgart, Germany, 2022. [Google Scholar]
- Alamouri, A.; Lampert, A.; Gerke, M. An Exploratory Investigation of UAS Regulations in Europe and the Impact on Effective Use and Economic Potential. Drones 2021, 5, 63. [Google Scholar] [CrossRef] [Scilit]
- JAR-doc-06: JARUS Guidelines on Specific Operations Risk Assessment (SORA). 2019. Available online: https://uas.gov.ge/dashboard/pdf/SORA%20methodology%20SAIL%20Step%209.pdf (accessed on 6 April 2026).
- Mooney, P.; Minghini, M. A Review of OpenStreetMap Data. In Mapping and the Citizen Sensor; Foody, G., See, L., Fritz, S., Mooney, P., Olteanu-Raimond, A.-M., Fonte, C.C., Antoniou, V., Eds.; Ubiquity Press: London, UK, 2017; pp. 37–59. [Google Scholar] [CrossRef] [Scilit]
- Fonte, C.C.; Antoniou, V.; Bastin, L.; Estima, J.; Arsanjani, J.J.; Bayas, J.-C.L.; See, L.; Vatseva, R. Assessing VGI Data Quality. In Mapping and the Citizen Sensor; Foody, G., See, L., Fritz, S., Mooney, P., Olteanu-Raimond, A.-M., Fonte, C.C., Antoniou, V., Eds.; Ubiquity Press: London, UK, 2017; pp. 137–163. [Google Scholar] [CrossRef] [Scilit]
- PostgreSQL. Available online: https://www.postgresql.org/ (accessed on 2 May 2026).
- Leaflet. Available online: https://leafletjs.com/ (accessed on 13 April 2026).
- Turf Library. Available online: https://turfjs.org/ (accessed on 13 April 2026).
- Nodejs. Available online: https://nodejs.org/en (accessed on 12 March 2026).
- Vizcarra, A.; Quiroz, G.; Cornejo, J. The Impact of User Interface and Experience (UI/UX) Design on Visual Ergonomics: A Technical Approach for Reducing Human Error in Industrial Settings. Designs 2026, 10, 8. [Google Scholar] [CrossRef] [Scilit]
- Nielsen, J. Usability 101: Introduction to Usability. 2012. Available online: https://www.nngroup.com/articles/usability-101-introduction-to-usability/ (accessed on 11 April 2026).

Disclaimer/Publisher’s Note: The statements, opinions and data contained in all publications are solely those of the individual author(s) and contributor(s) and not of MDPI and/or the editor(s). MDPI and/or the editor(s) disclaim responsibility for any injury to people or property resulting from any ideas, methods, instructions or products referred to in the content. |
© 2026 by the authors. Licensee MDPI, Basel, Switzerland. This article is an open access article distributed under the terms and conditions of the Creative Commons Attribution (CC BY) license.