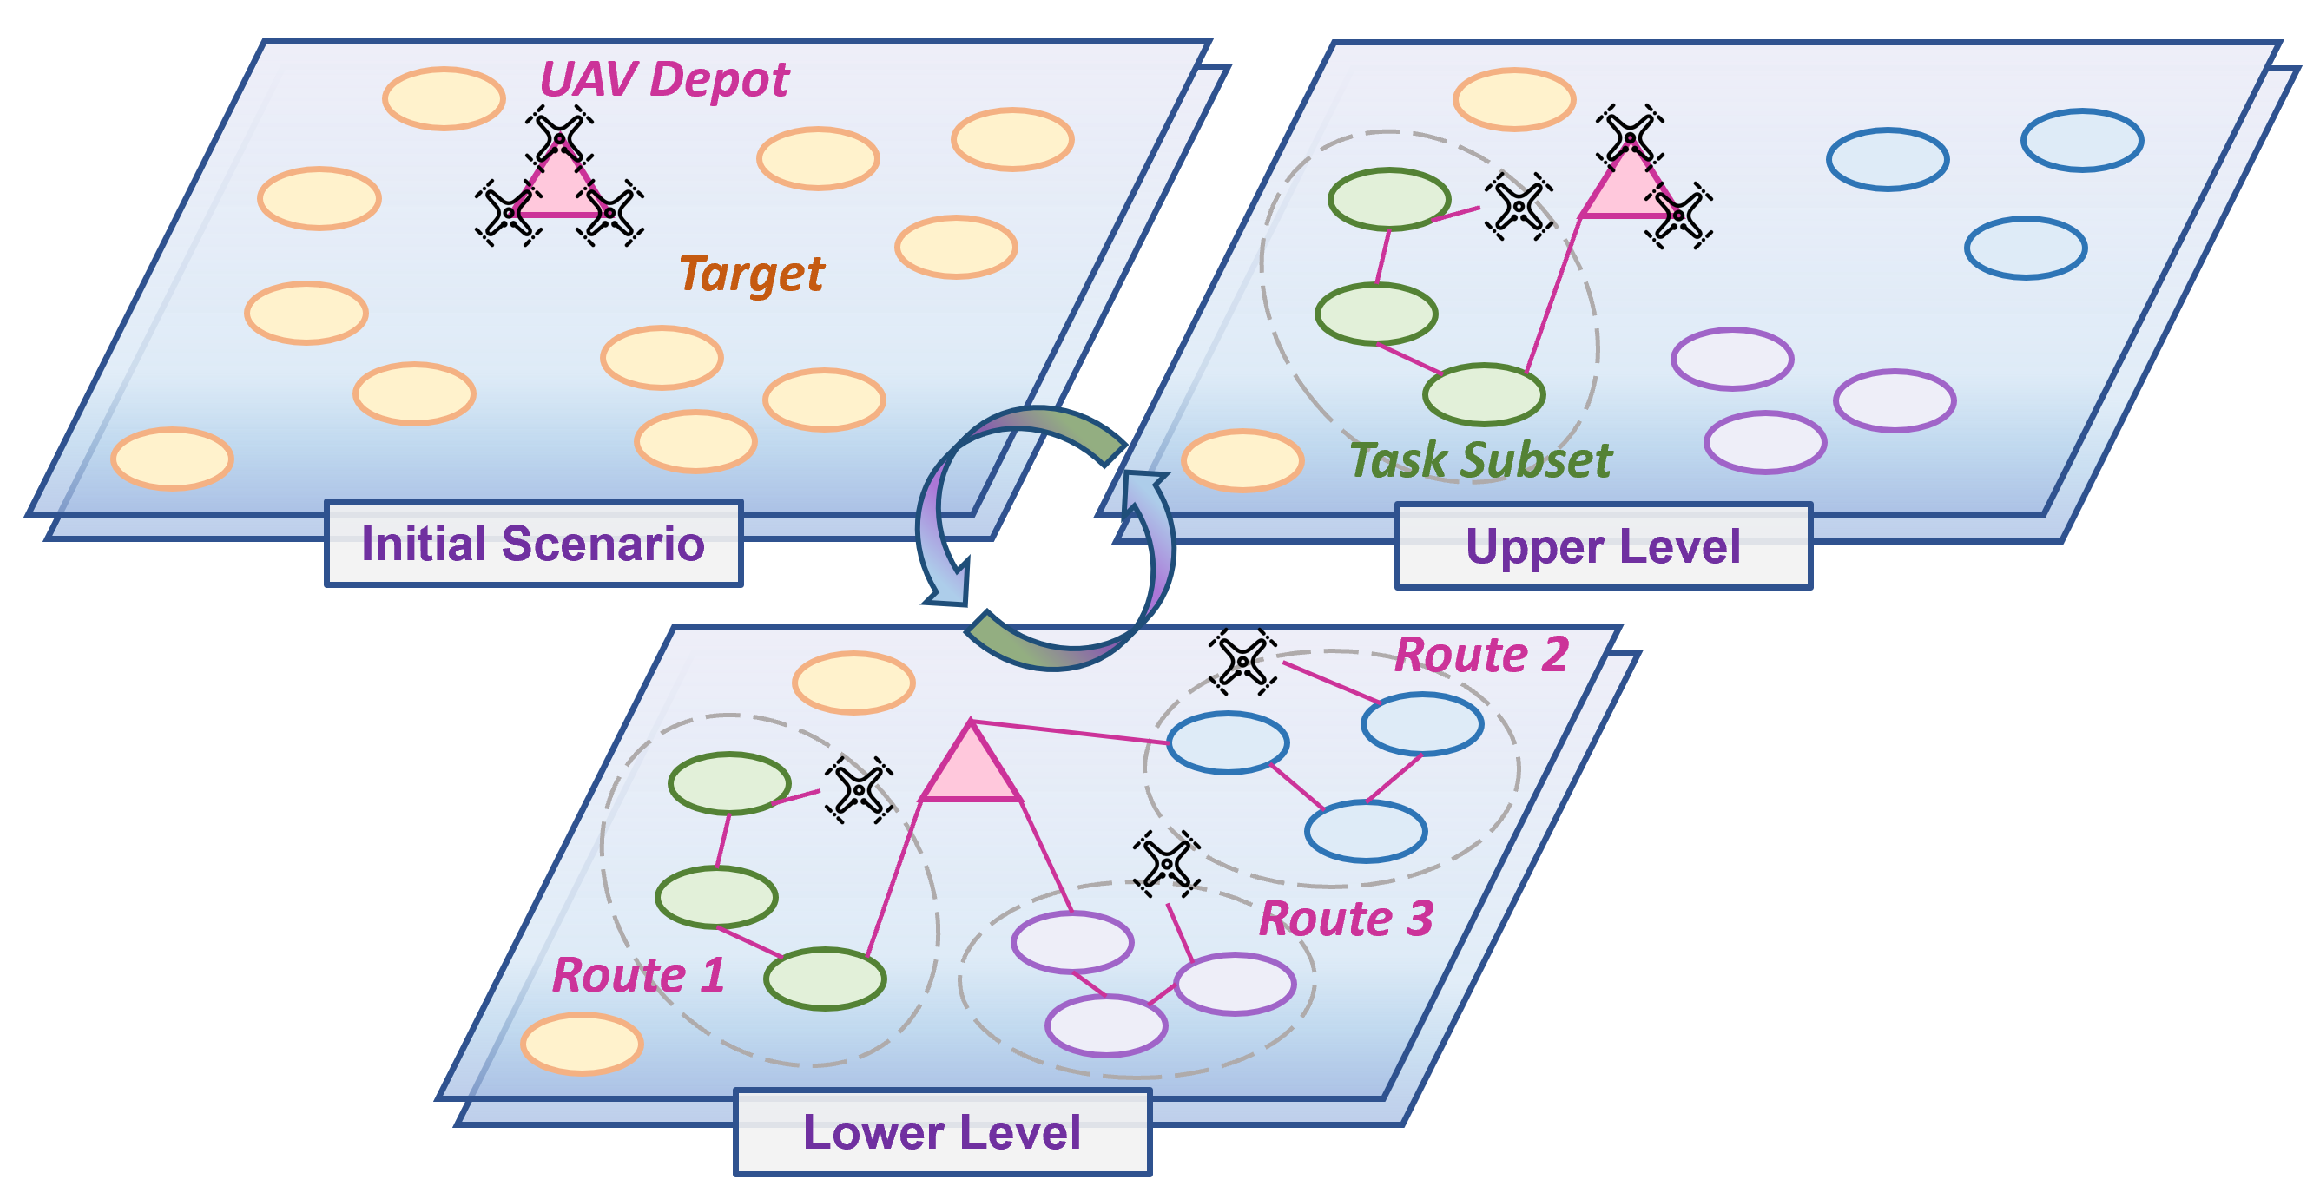
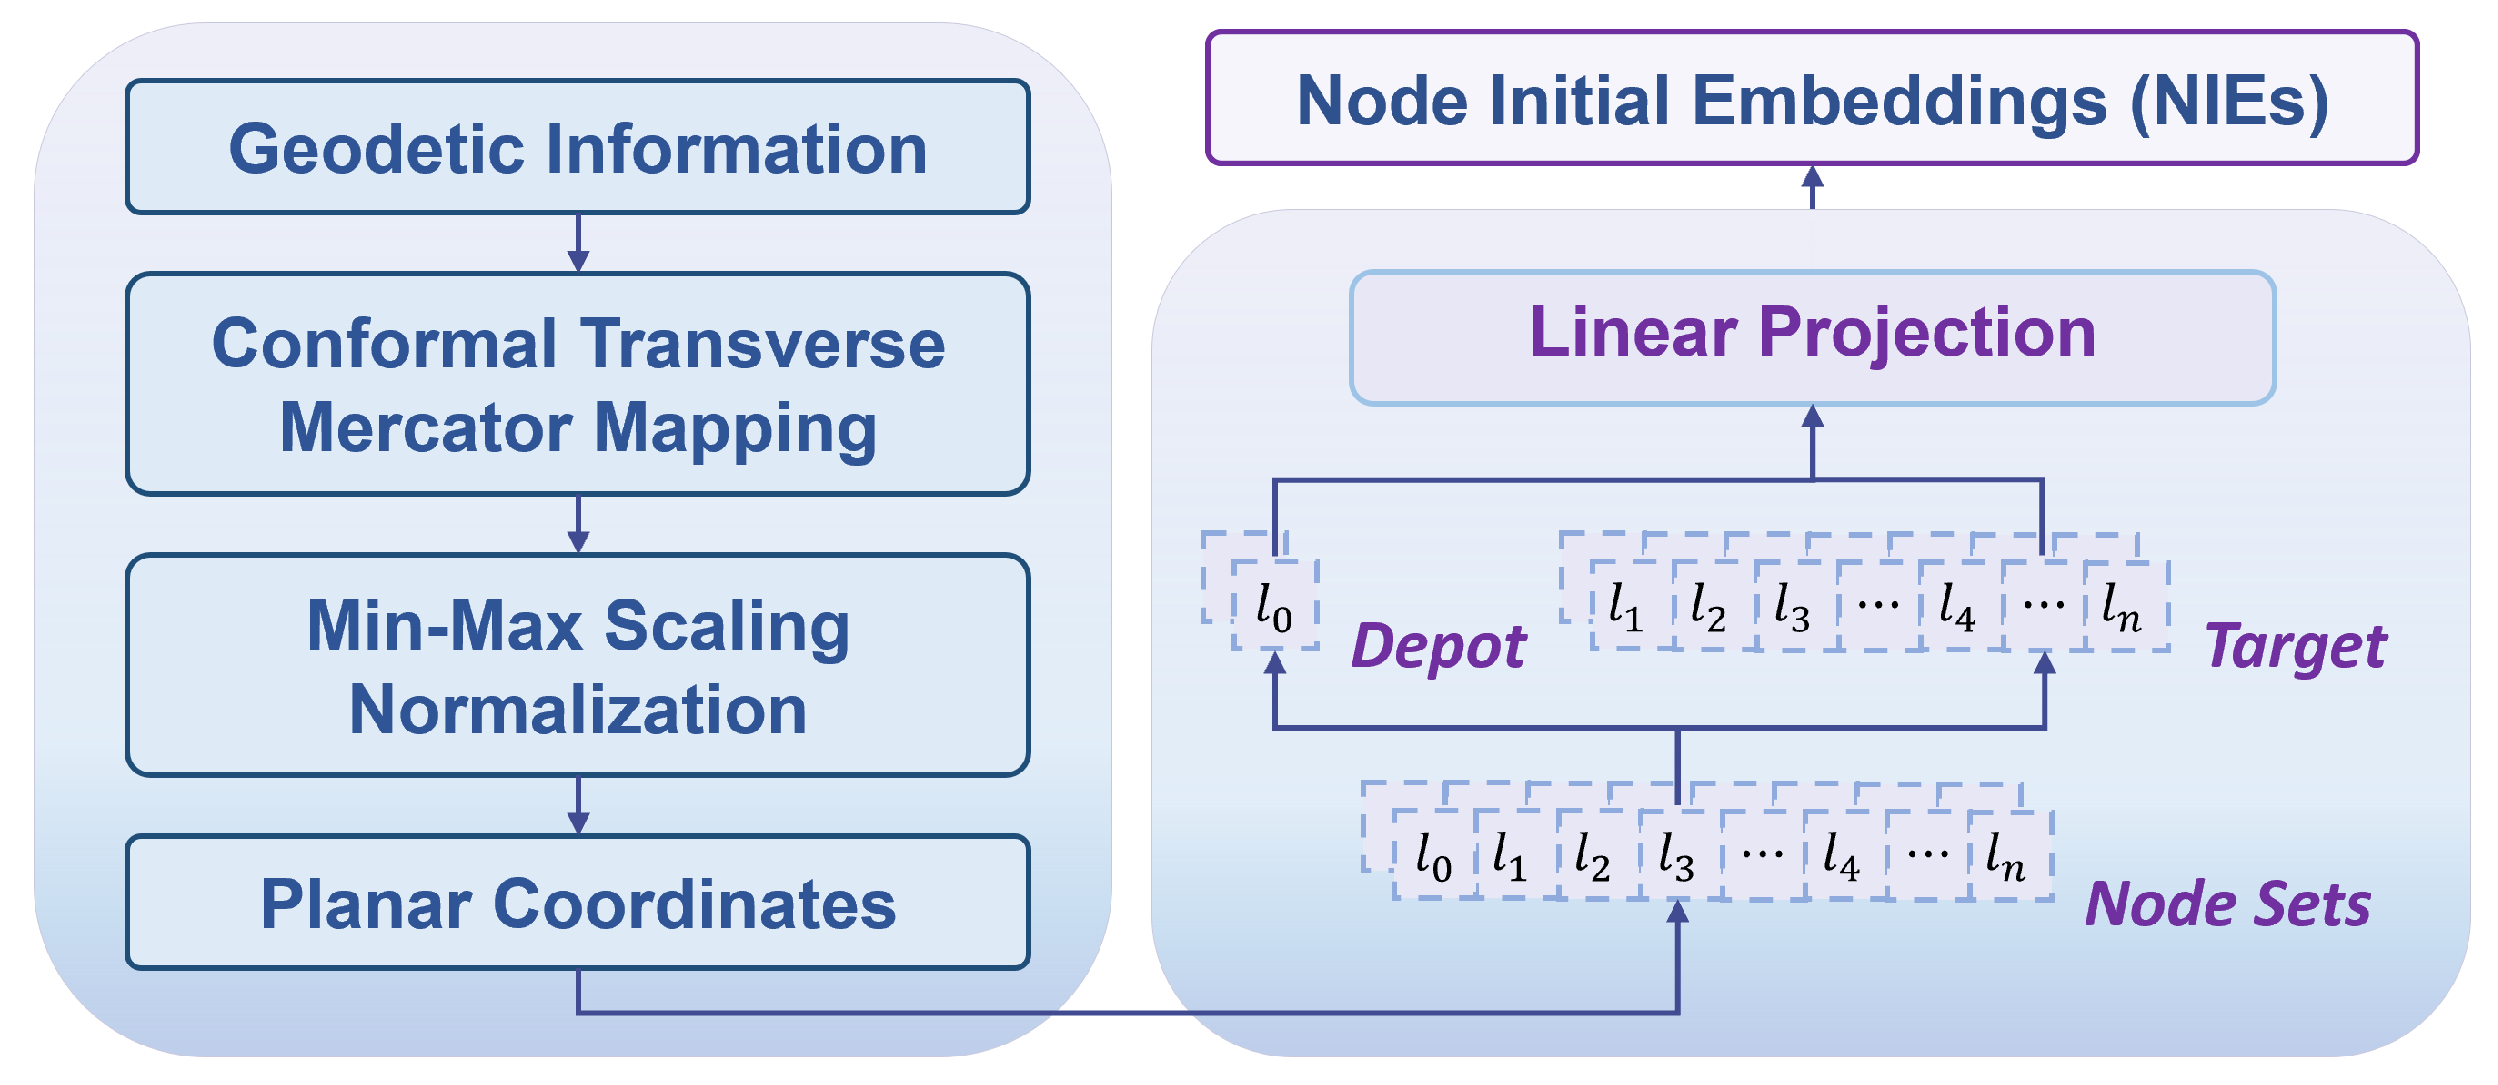
This section evaluates the Hierarchical Deep Reinforcement Learning framework for large-scale heterogeneous UAV mission planning. The setup details the experimental environment, dataset generation from real-world geographic data, and hyperparameter configurations. Evaluation compares the proposed method against eight baseline algorithms across problem scales ( to 300). This comparison assesses solution quality and scalability. The analysis examines small-scale convergence and large-scale generalization. Trajectory visualizations corroborate the numerical findings. Finally, the evaluation quantifies statistical stability and computational efficiency. These metrics verify the framework’s applicability to time-sensitive disaster relief operations.
5.1. Experiment Settings
Experiments test the framework on instances with varying scales. The model sets target counts
N from the set
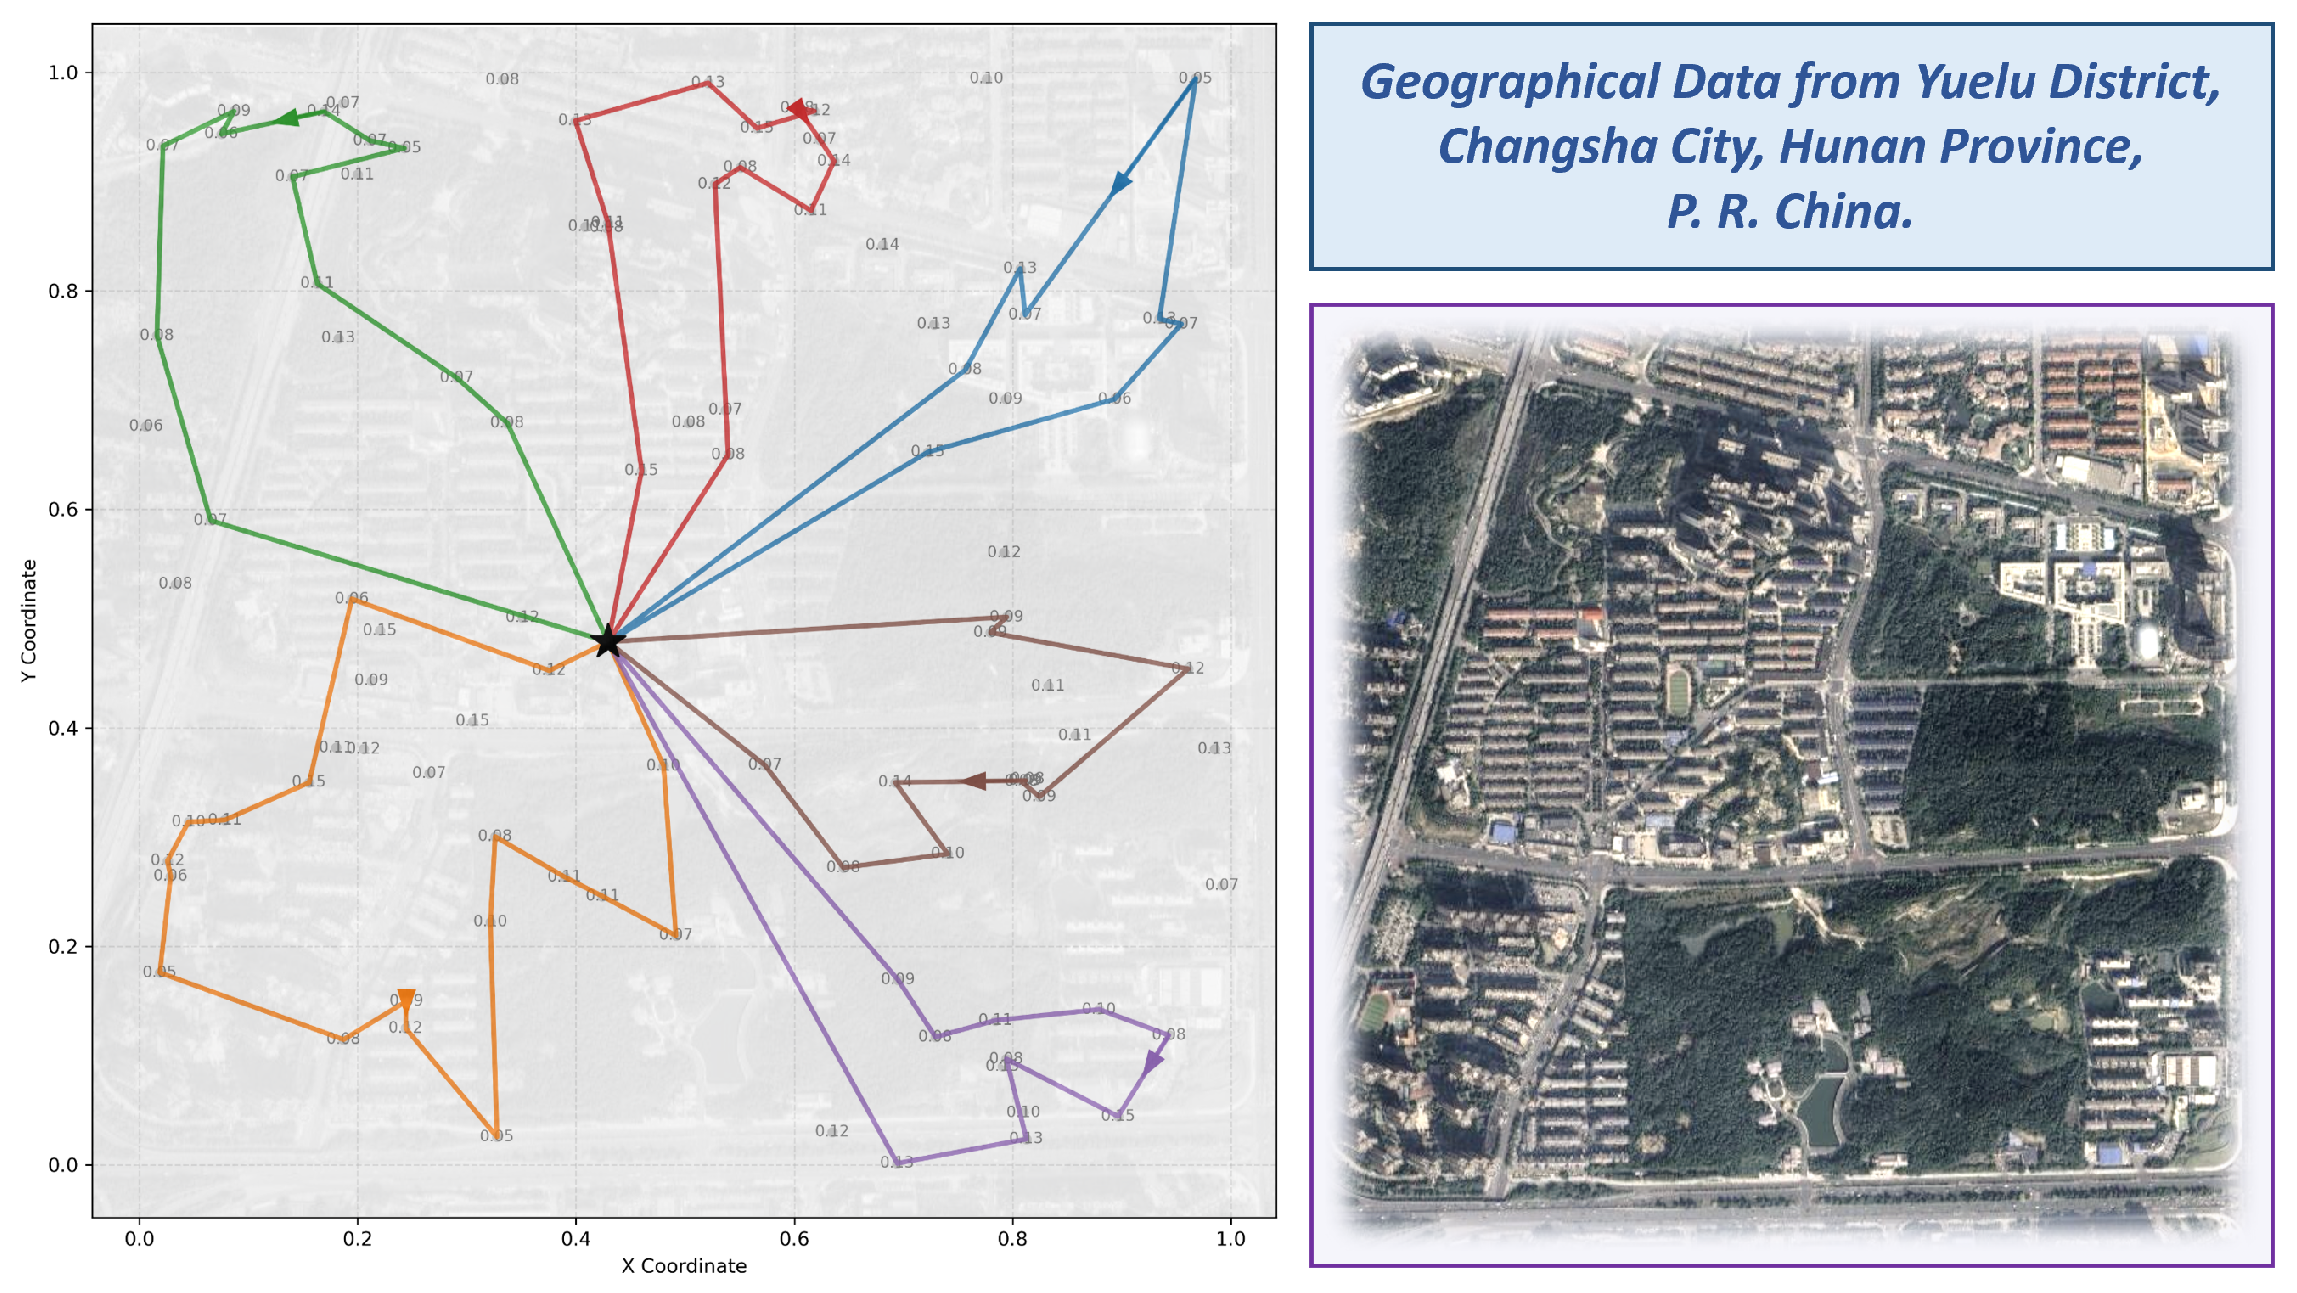
. Real-world geographic data from the Yuelu District of Changsha City, China, supplies the geospatial coordinates for target nodes.
Figure 4 visualizes this spatial distribution, with raw location data sourced from the World Geodetic System 1984 reference system. The procedure samples
N coordinates from this pool and projects them into a unit square
.
Uniform distributions
and
define the maximum payload capacity
and flight range
for each UAV
. These parameters model the fleet heterogeneity. Target demands
follow a uniform distribution
. Target prizes
are sampled from a uniform distribution
, reflecting heterogeneous rescue priorities across task nodes. The distance penalty coefficient and workload balance penalty coefficient in Equation (
1) are set to
and
, respectively. The reported objective value (Obj.) in all result tables corresponds to the terminal episode reward
as defined in Equation (
10). A virtual agent with infinite capacity and range absorbs unassigned tasks. Tasks routed to this agent yield zero reward, implicitly penalizing infeasible assignments.
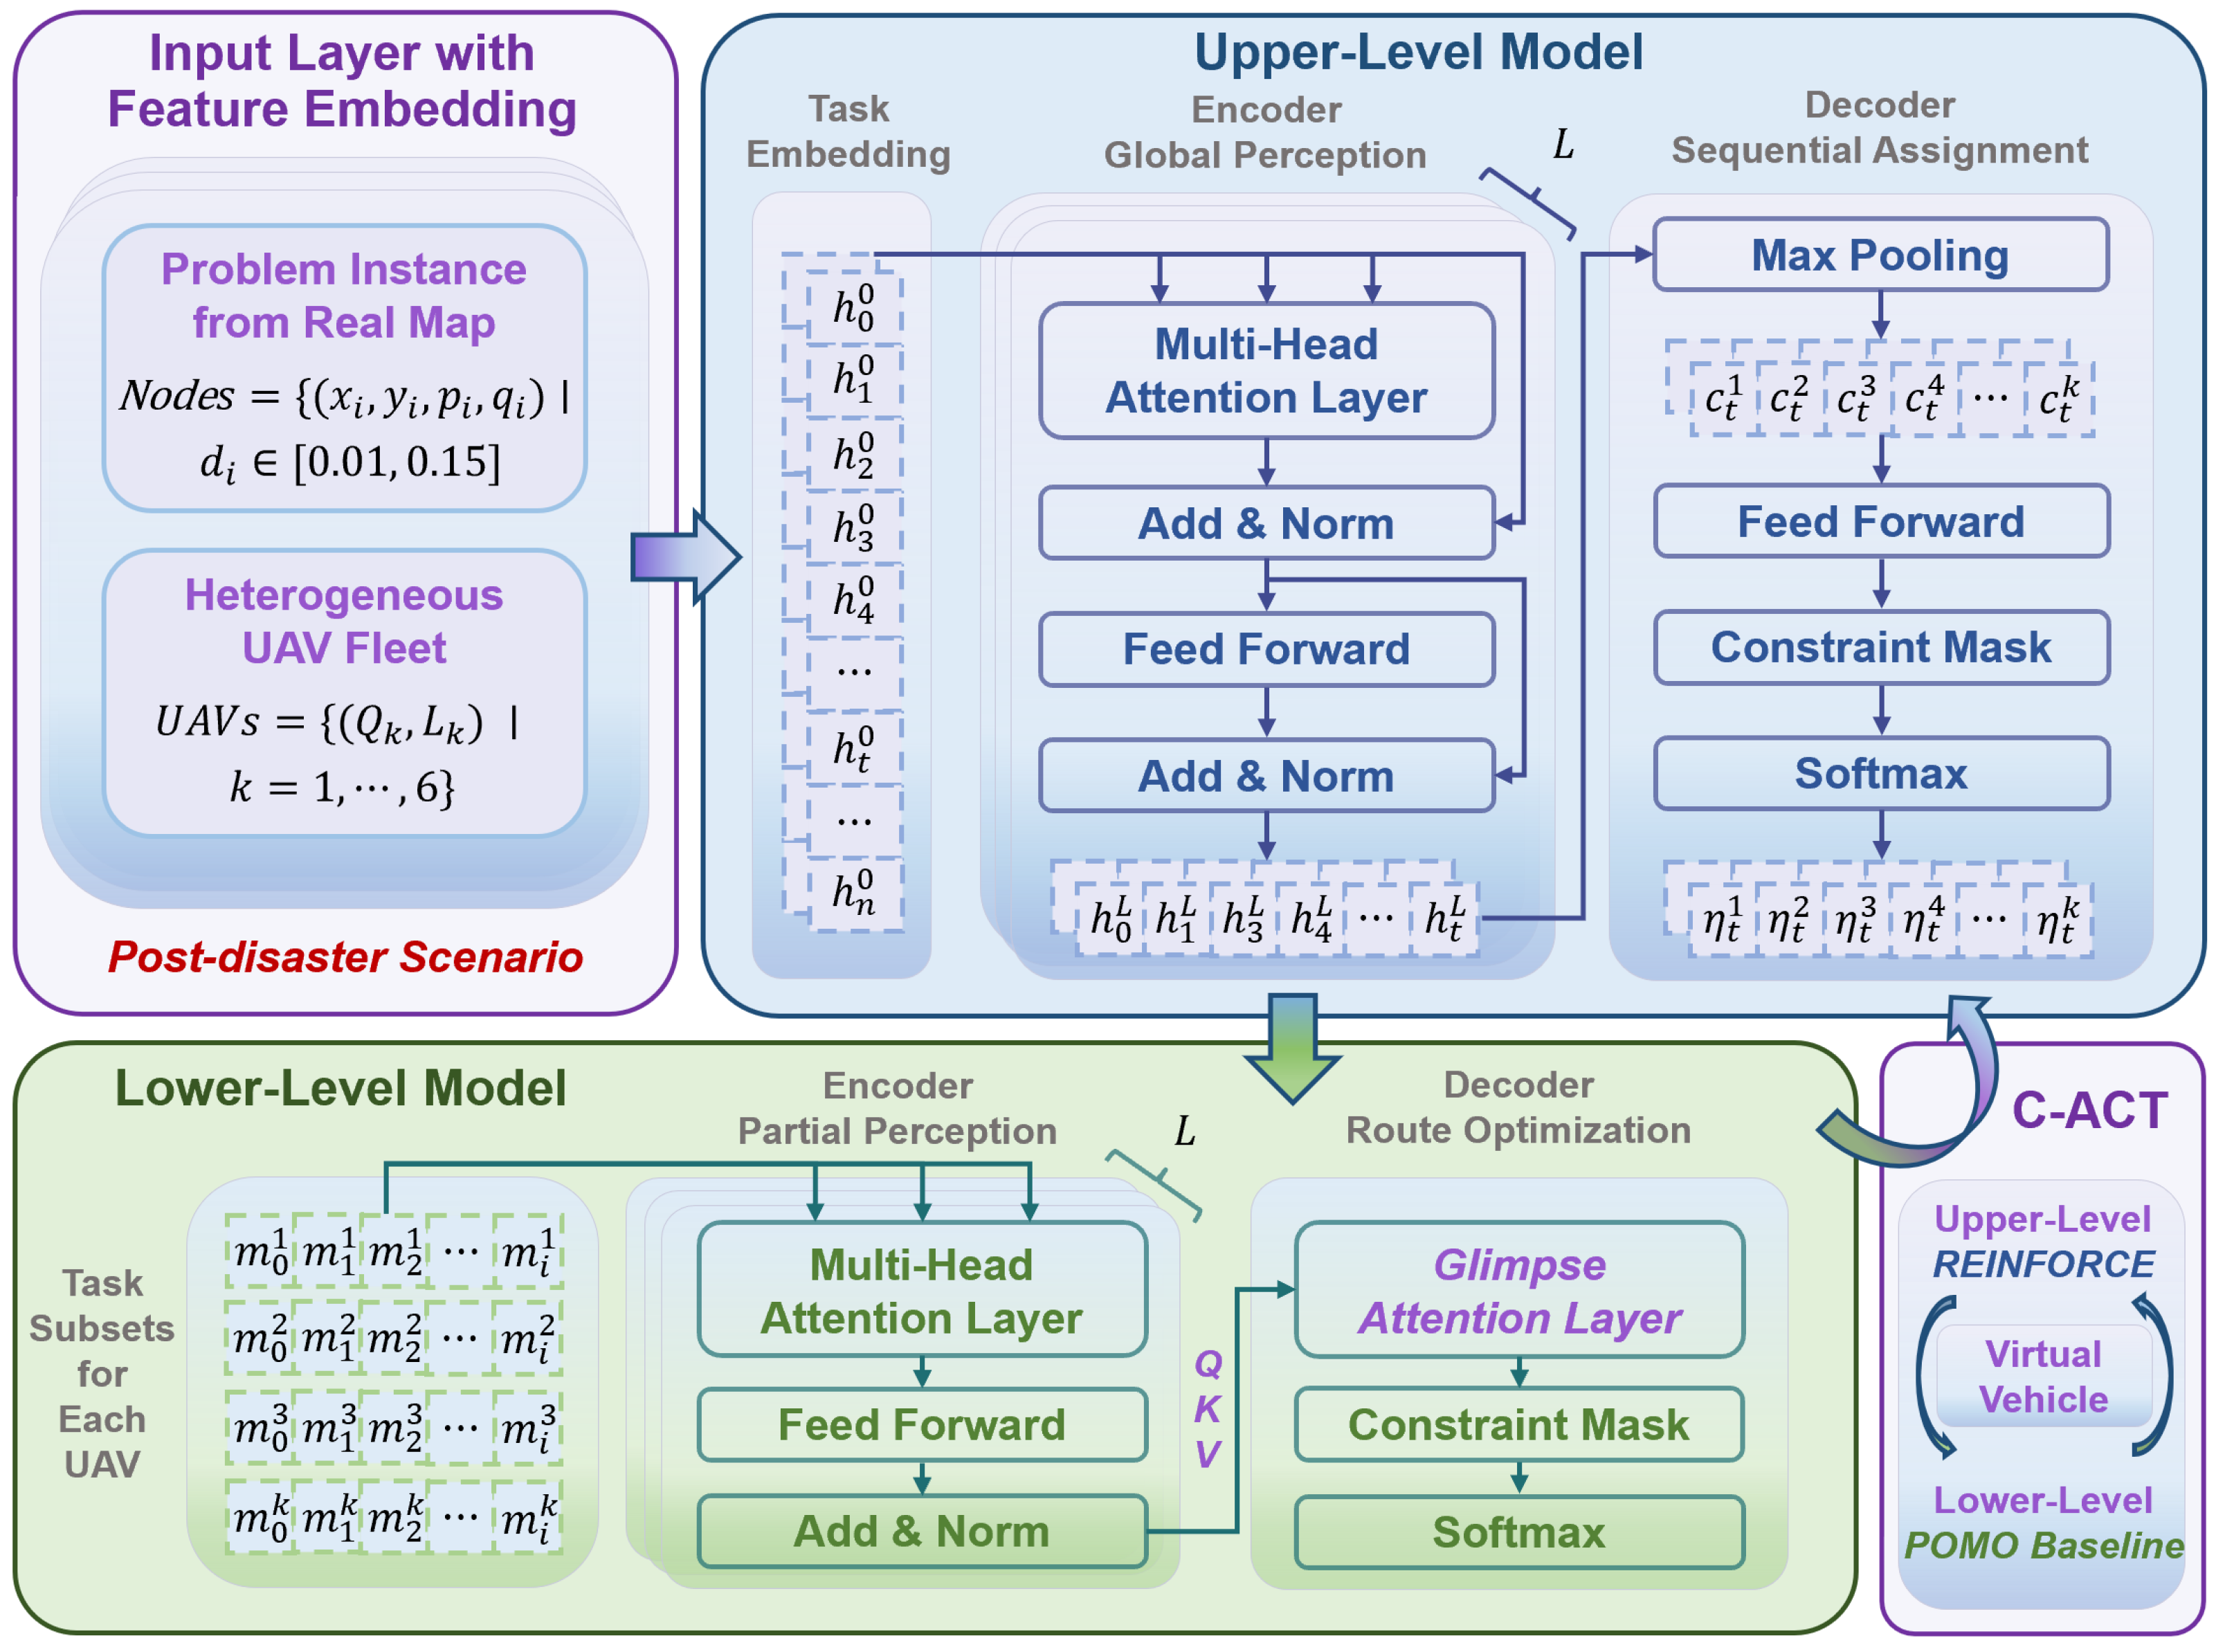
The hierarchical framework pairs an upper-level allocation policy with a lower-level routing policy, both parameterized by attention-based neural networks. Each encoder incorporates 3 self-attention layers with a unified hidden and embedding dimension of 128, processed through an 8-head multi-head attention mechanism. The upper-level MCTS executes 80 simulations per step with . The lower-level routing model applies the POMO mechanism with a sample size of 8. Validation and testing phases apply greedy decoding for deterministic decision-making.
Both models are trained with the Adam optimizer at an initial learning rate of . The upper-level model trains for 100 epochs total (50 Phase-II + 50 Phase-III; batch size 1600; epoch size 800,000 instances) with a per-epoch learning rate decay of 0.995; gradient norms are clipped at 3.0. The lower-level model trains for warm-up epochs (batch size 400; epoch size 200,000 instances) at a constant learning rate, with gradient norms clipped at 1.0. Phase III joint stabilization runs for additional epochs. The curriculum factor decays from to over Phase II epochs via a cosine schedule.
Implementation relies on Python 3.12 and the PyTorch 2.8.0 deep learning framework. All computational tasks were performed on a single workstation. The hardware includes an Intel Xeon Platinum 8358P CPU (2.60 GHz), 90 GB of RAM, and a single NVIDIA GeForce RTX 3090 GPU (24 GB). The Ubuntu 22.04 LTS operating system hosts the environment. CUDA 12.8 acceleration processes the tensor computations.
The following protocol governs all evaluations to support reproducibility. Performance metrics are computed over 100 independently sampled test instances per scale. Geographic coordinate sampling and fleet parameter generation use a fixed random seed (seed = 2026); network weights are initialized with seed = 0. Three independent training runs are conducted; the mean performance across the three runs is reported. The coefficient of variation of the reward across the three runs remains below 2% at convergence, confirming training stability. Neural models apply greedy decoding during inference. Stochastic baselines (Adaptive Large Neighborhood Search, ALNS) are executed with five independent runs per instance; the best result per instance is recorded. Error bars in
Section 5.6 represent the standard deviation across the 100 test instances. Wilcoxon signed-rank tests in
Section 5.6 are computed over the paired per-instance objective values from these same 100 instances.
5.2. Benchmark Evaluation
A cross-scale evaluation protocol tests the generalization capability and scalability of the hierarchical framework. Specifically, models trained on instances with targets execute inference on both and test sets. Models trained on the dataset evaluate scenarios with and targets. This process requires no additional fine-tuning. This experimental design verifies the adaptability of the learned policies to varying problem scales. It demonstrates the model’s ability to capture the underlying problem structure rather than overfit to specific dimensions.
The baseline selection follows a factorial design that isolates the contribution of each hierarchical component independently. Three upper-level allocation strategies (Random, K-Means, and MCTS) cross-combine with three lower-level solvers (ALNS, OR-Tools, and Transformer), yielding nine controlled comparisons. End-to-end learning-based planners for multi-UAV routing are considered as additional baselines. Published models of this type are trained on homogeneous fleets or on problem scales below ; direct comparison without retraining on the LSH-TOP formulation would conflate architectural differences with distribution mismatch, obscuring interpretation. The MCTS + OR pairing serves as a strong reference for the lower-level routing component by substituting the Transformer with an exact solver under an identical upper-level strategy.
Random assignment serves as a lower-bound reference reflecting unstructured allocation. K-Means clusters tasks by spatial proximity without considering vehicle-specific constraints. Evaluations consider four problem scales with target counts
.
Table 2 and
Table 3 report the average objective value (Obj.), the optimality gap (Gap), and the inference time.
Experimental results show the MCTS + Trans method achieves the highest objective value across all four scales. The optimality gap is computed relative to the best objective value among all compared methods, not the theoretical optimum; LSH-TOP is NP-hard and exact solutions are intractable at these scales. A 0.00% gap indicates MCTS + Trans achieves the highest objective among all evaluated methods on every test instance, not that it reaches the provably optimal solution. The absolute values and the
p-values in
Section 5.6 provide the primary basis for performance assessment.
Section 5.3 and
Section 5.4 provide detailed analyses of these results by scale.
5.3. Comparative Analysis on Small and Medium Scales
This subsection investigates algorithmic performance on small- and medium-scale instances (
and
). The analysis focuses on convergence quality and constraint satisfaction.
Table 2 shows the MCTS + Trans framework achieves objective values of 50.43 and 59.30 for
and
, respectively. This establishes a performance benchmark with a 0.00% optimality gap.
Fixing the lower-level solver to the Transformer model isolates the impact of the upper-level allocation strategy. The Random + Trans baseline lacks active assignment logic. It exhibits an optimality gap exceeding 33% across both scales. The KMeans + Trans strategy clusters tasks based on Euclidean proximity. This reduces the gap to 9.18% at . Spatial clustering fails to account for heterogeneous payload and flight range parameters. This failure causes load imbalances and restricts the total recoverable value. The MCTS strategy models these constraints during the tree search simulation. MCTS evaluates the potential reward of future states via look-ahead simulation. This approach optimizes task distribution based on the feasibility of the resulting sub-problems. It facilitates the construction of higher-value routes compared to geometric location strategies.
Fixing the upper-level strategy to MCTS isolates the contribution of the lower-level routing solver. The Transformer-based solver performs comparably to the exact OR-Tools solver at these scales. At , the MCTS + OR method achieves an objective of 46.14 (8.51% gap). The MCTS + Trans method reaches 50.43 (0.00% gap). OR-Tools converges to optimality given unlimited time. However, a fixed computational budget per sub-problem bounds its performance here. The Transformer model acts as a learned heuristic. It generalizes to the constrained TOP variants and infers solutions rapidly (4.13 s vs. 4.31 s for OR-Tools). This learned policy captures the structural properties of the routing problem efficiently.
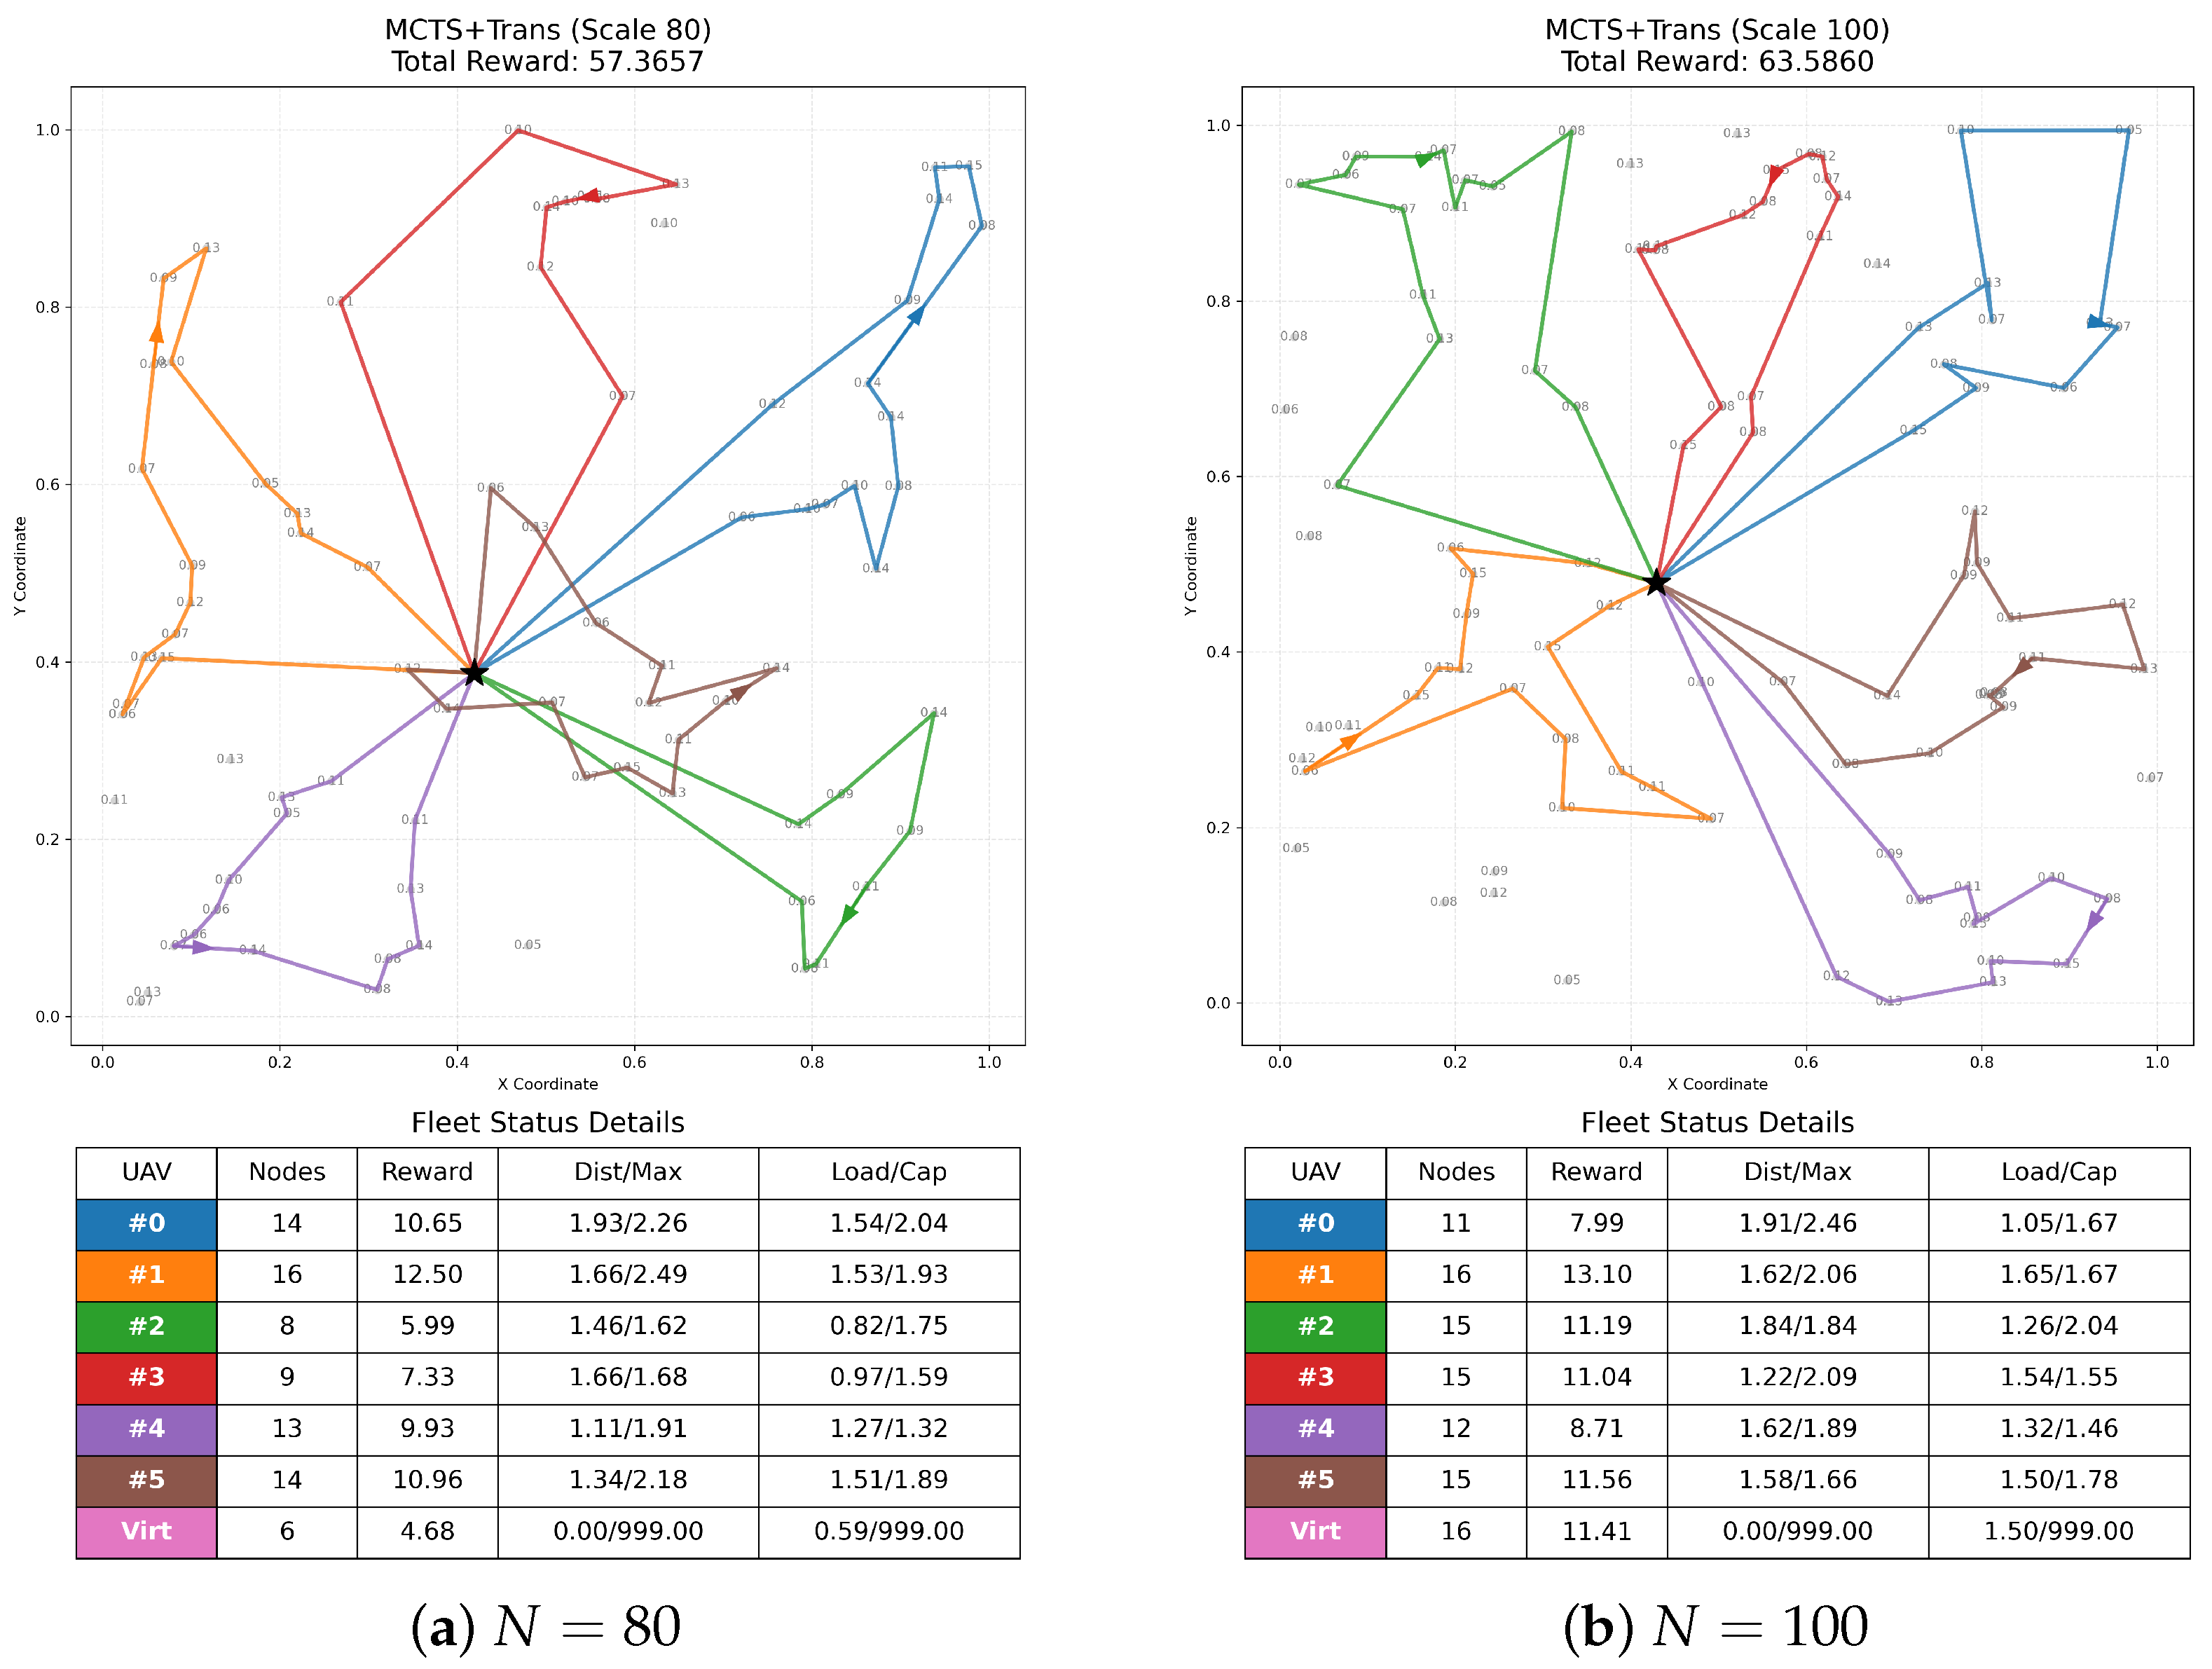
Qualitative analysis of the solution topology, as illustrated in
Figure 5, corroborates the numerical results.
Figure 5a,b depict the planned trajectories for
and
instances. The generated routes exhibit spatial partitioning with minimal path crossing, indicating that MCTS groups proximal tasks while adhering to the individual flight range limits of each UAV. Furthermore, all UAVs return to the depot after completing their service loops, confirming that the coupled hierarchy satisfies the hard constraints of the mission.
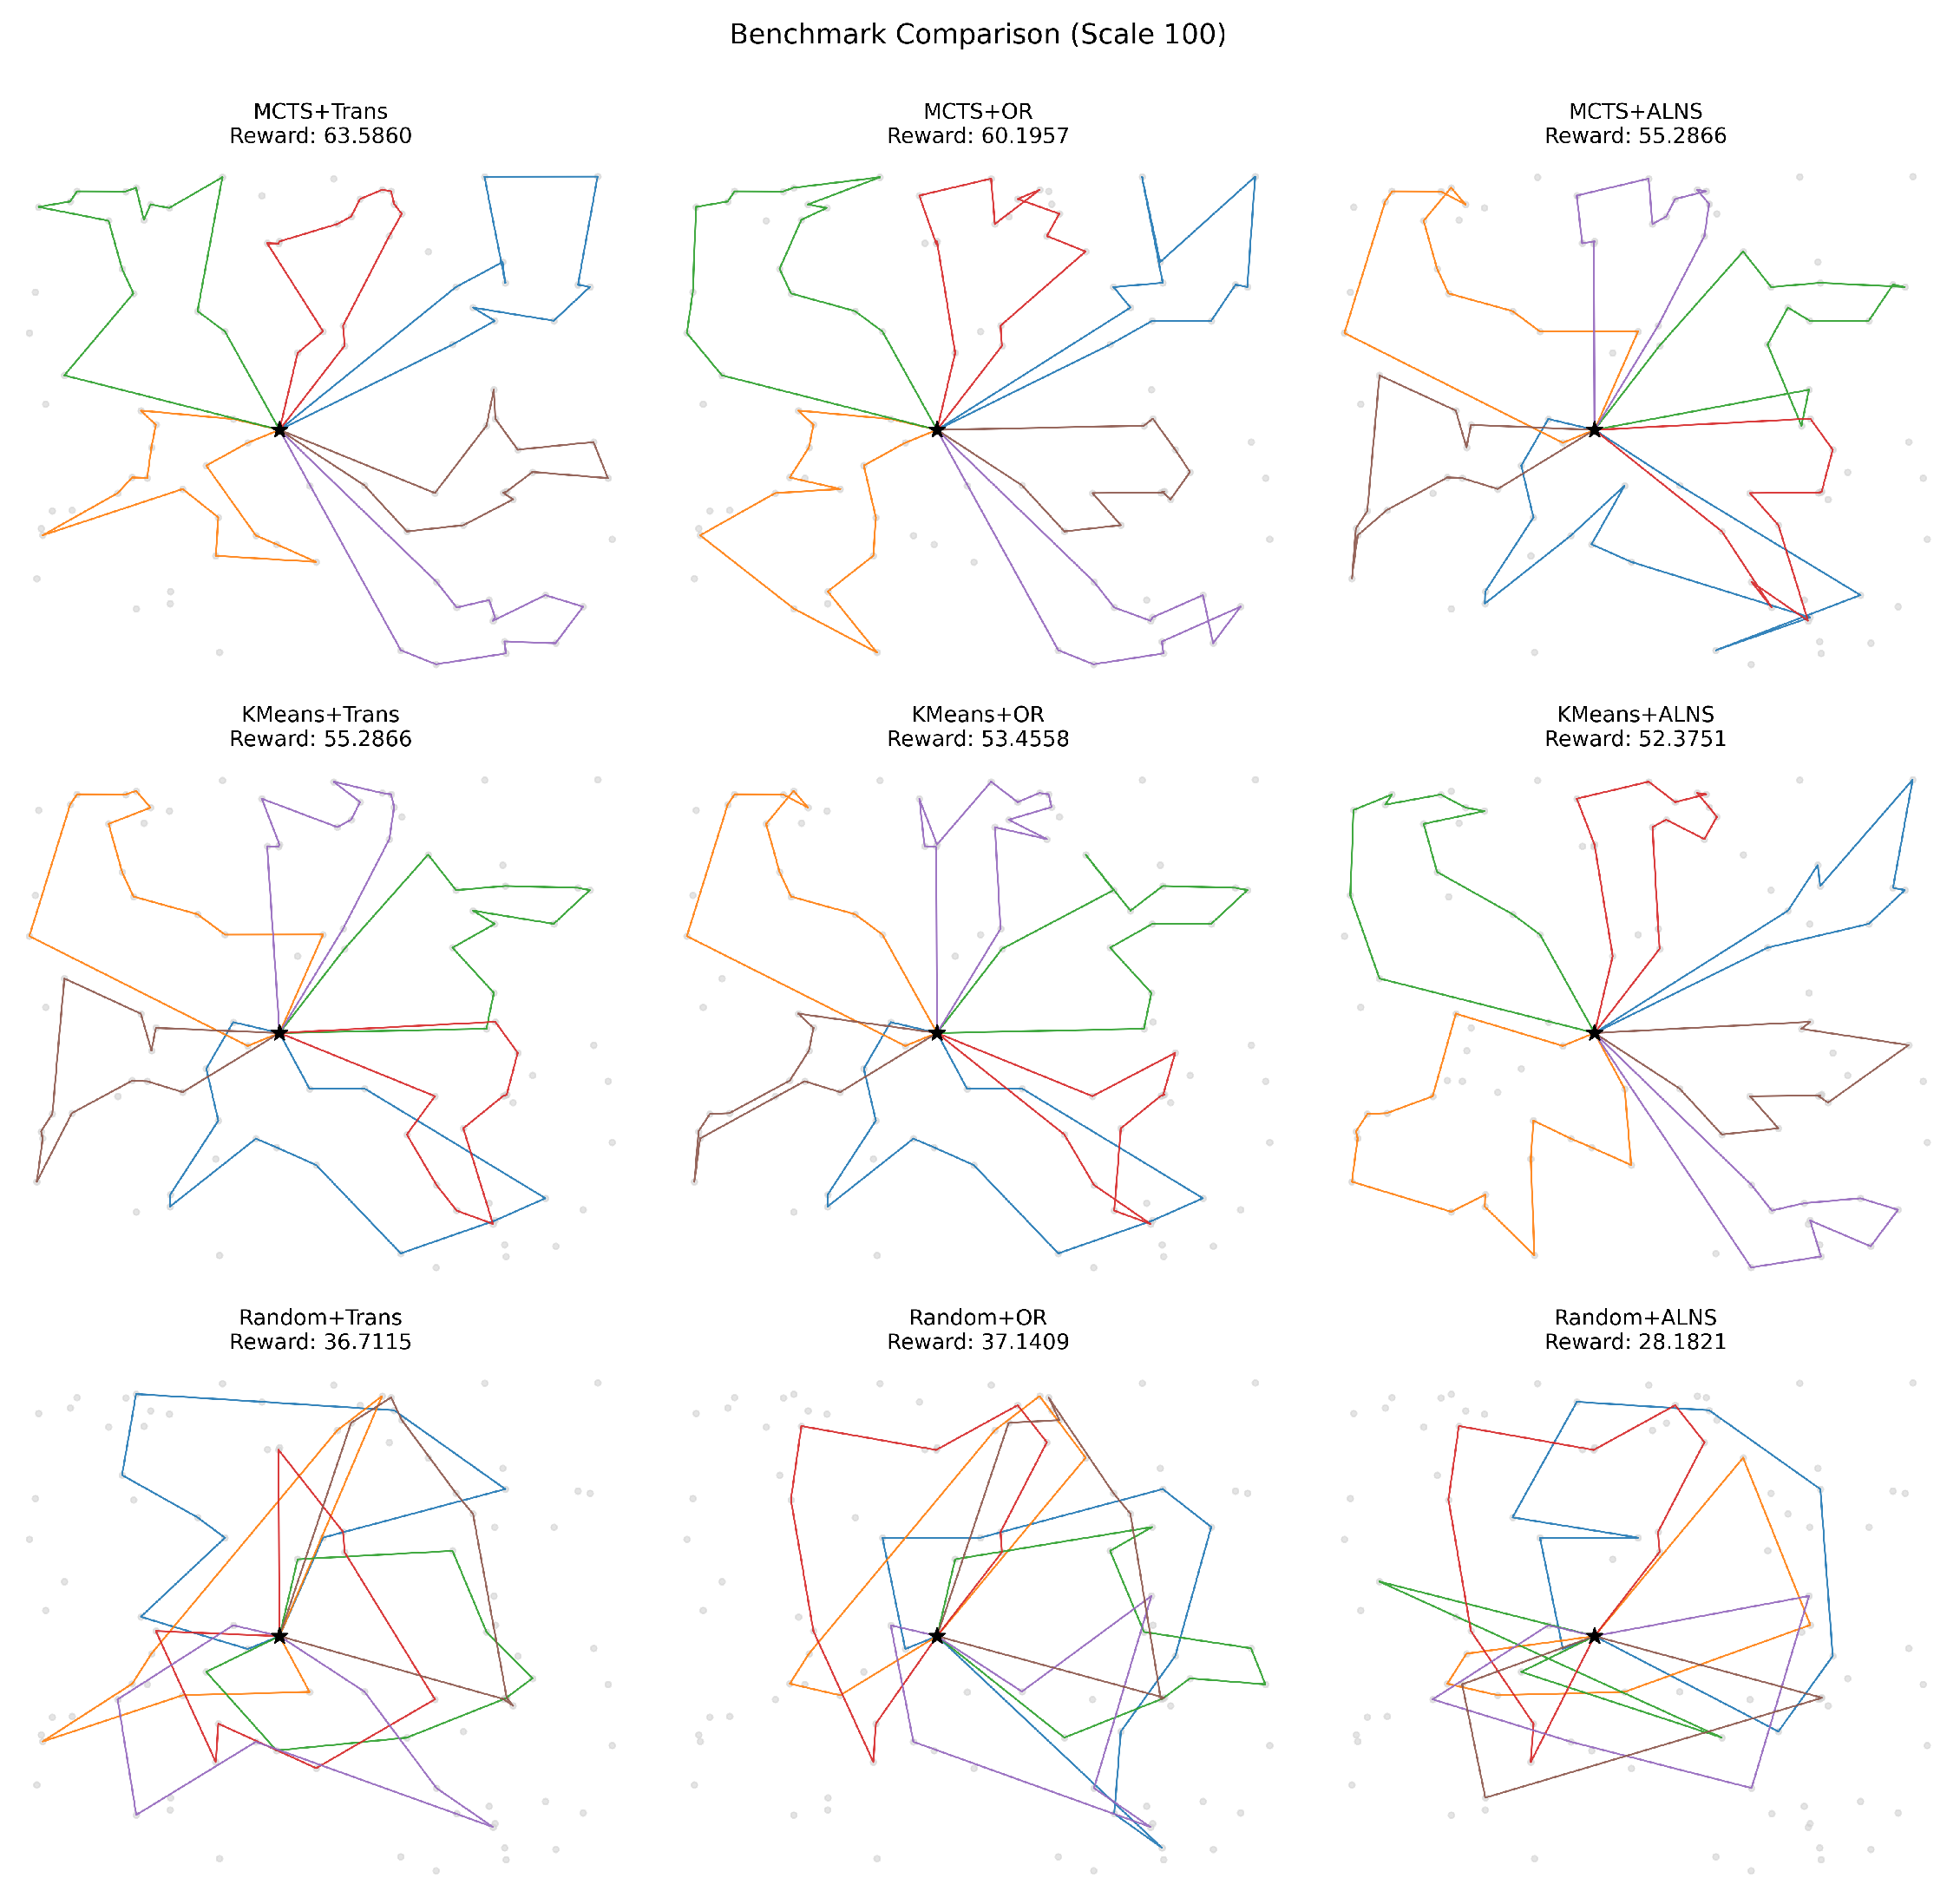
To verify the numerical difference shown in
Table 2,
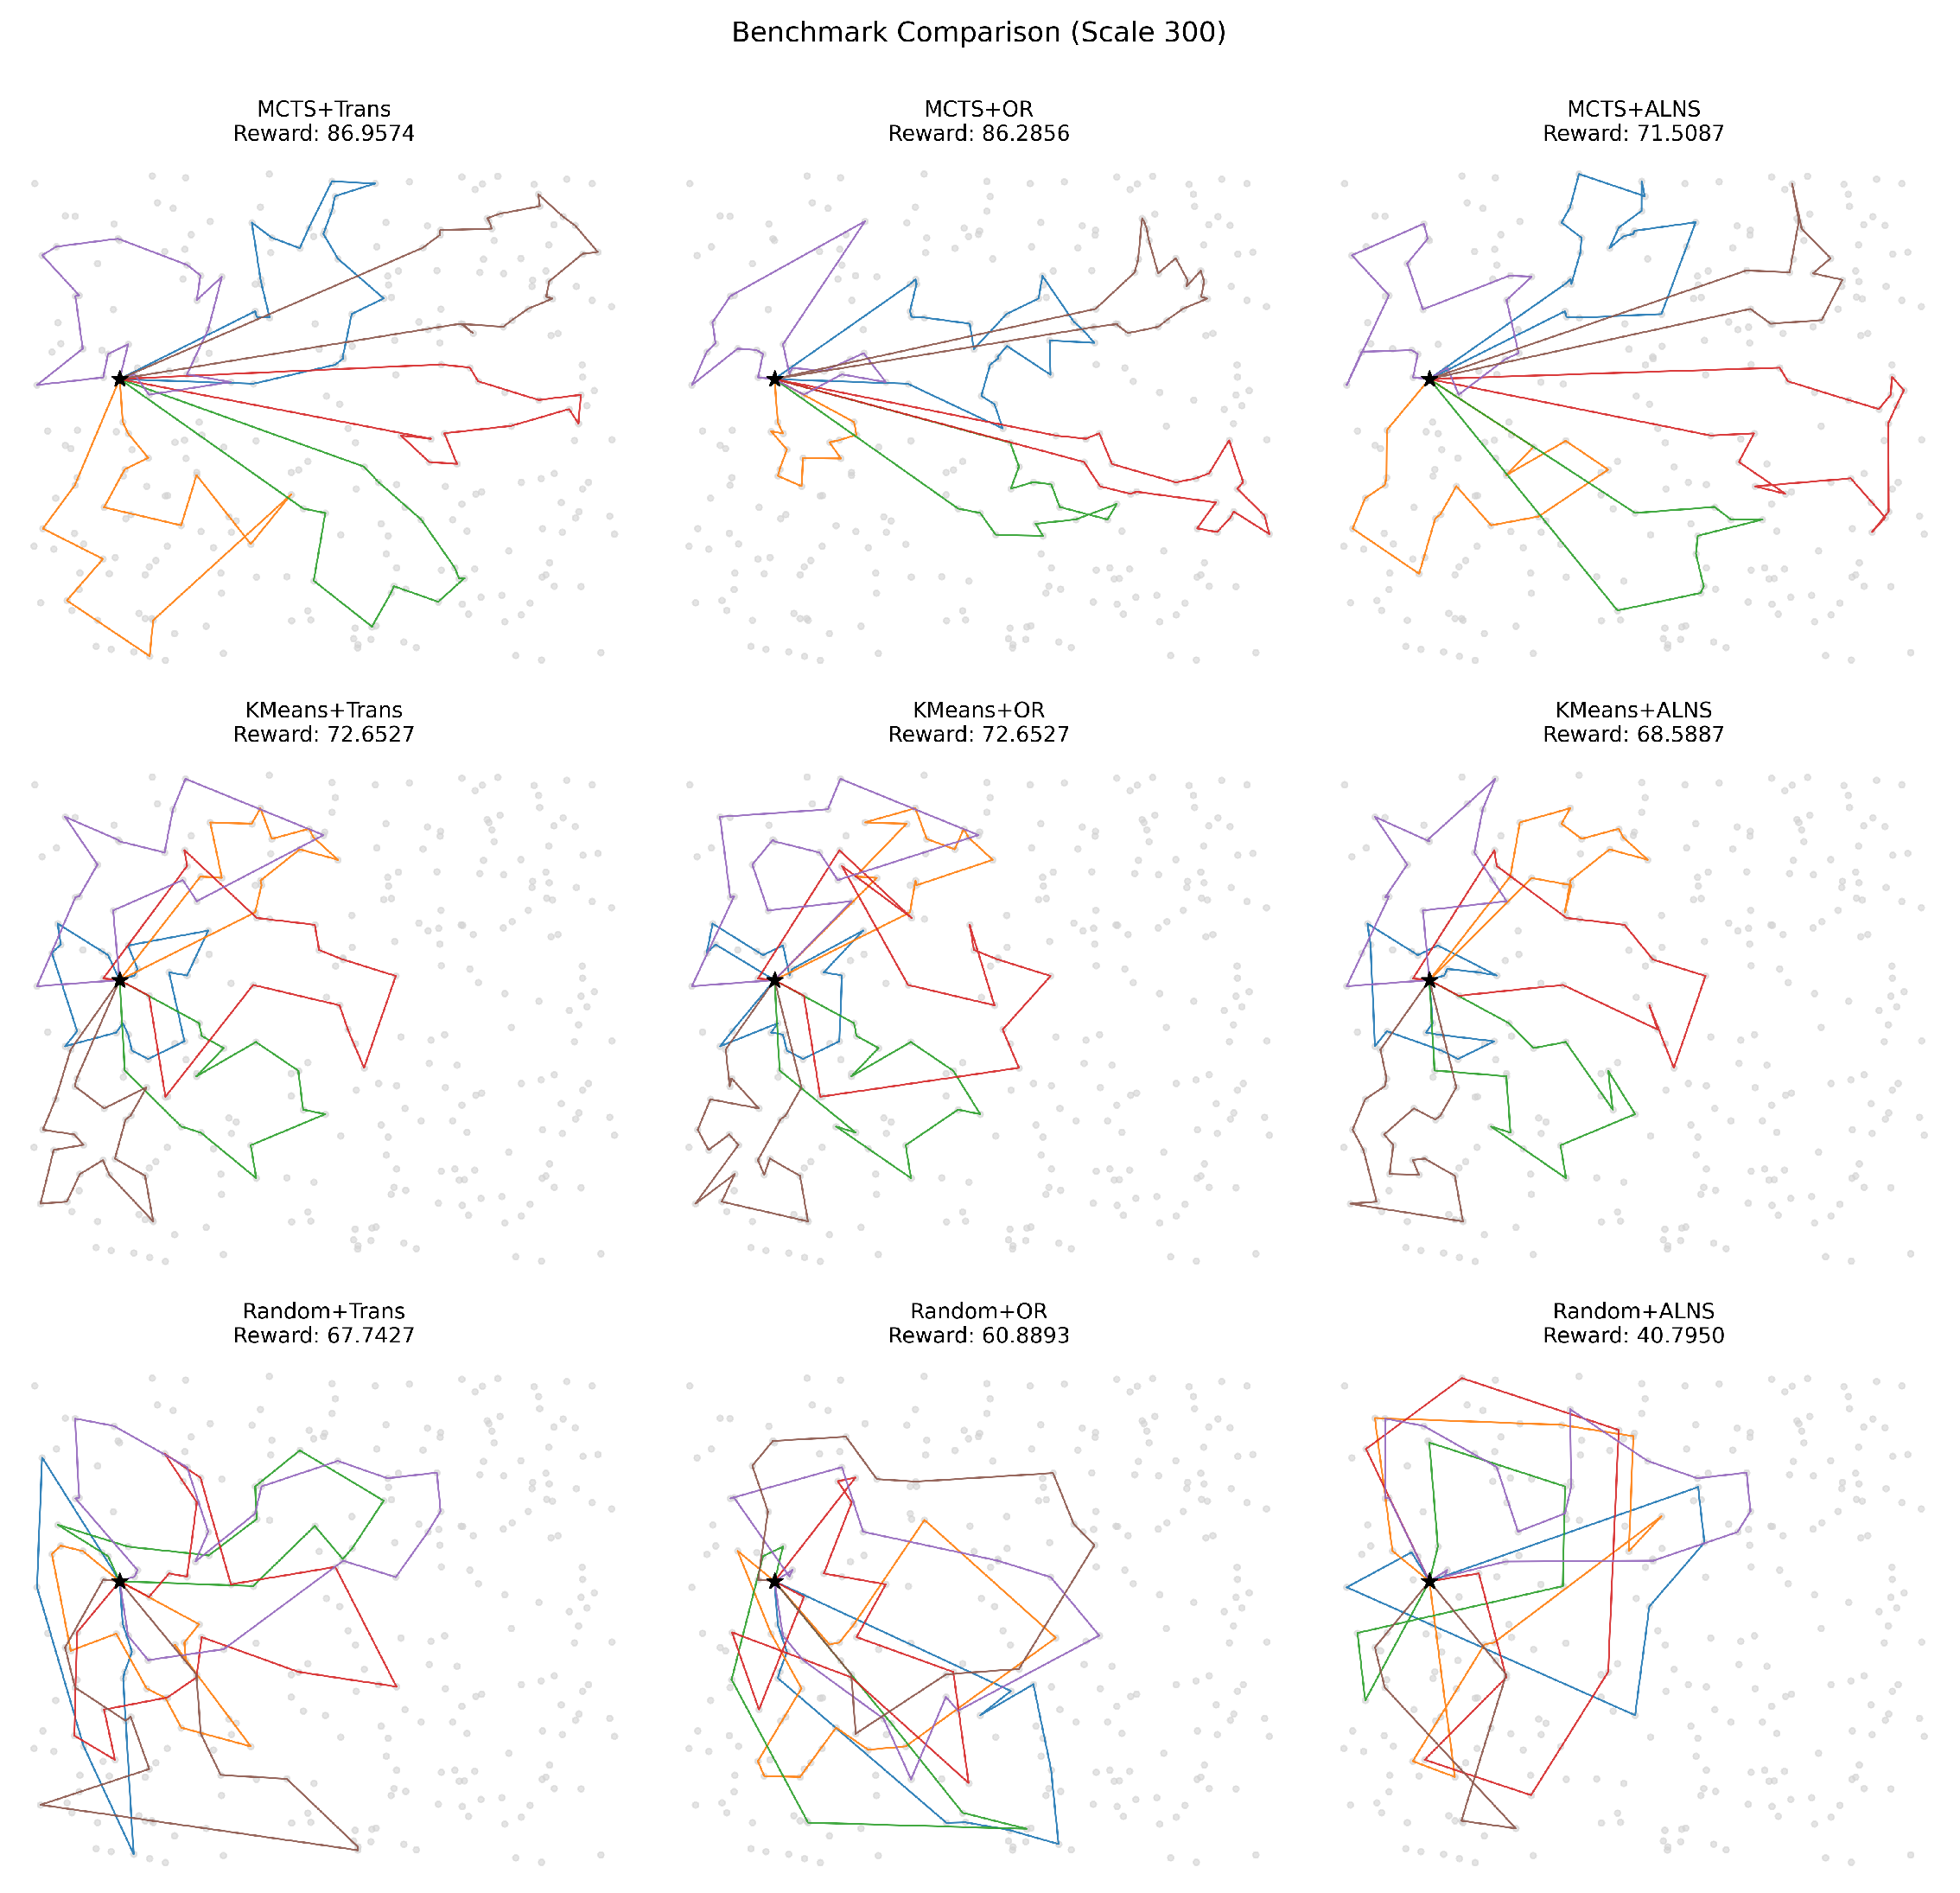
Figure 6 presents a side-by-side comparison of solution topologies for an instance with
. Methods using random allocation (bottom row) result in disordered trajectories with overlapping paths, indicating inefficient task distribution. K-Means (middle row) improves spatial grouping but generates unbalanced routes, as it ignores vehicle-specific payload and range parameters. Route length disparity across UAVs in
Figure 6 confirms this load imbalance. The MCTS + Trans method (top-left) produces a structured topology characterized by sub-region partitioning and compact routes. This visualization confirms that the proposed hierarchy optimizes the numerical objective and yields physically rational logistics plans.
5.4. Scalability Verification on Large Scales
5.4.1. Target-Scale Generalization
This section evaluates framework robustness on large-scale instances (
and
). The MCTS + Trans method maintains optimal performance with a 0.00% gap. It achieves objective values of 74.41 and 82.54 for
and
, respectively. These results appear in
Table 3.
The limitations of heuristic allocation strategies compound as the problem scale expands. Fixing the lower-level solver to the Transformer model highlights this degradation. The Random + Trans baseline yields an objective value of 70.32 at . This value corresponds to a 14.80% optimality gap. The KMeans + Trans strategy records a gap of 12.44% (Obj. 72.27). These gaps widen compared to small-scale benchmarks. Geometric heuristics struggle to balance workloads across heterogeneous UAVs in dense environments. The MCTS strategy mitigates this workload imbalance. Simulating task assignments identifies partitions aligned with specific payload and range constraints. This anticipation prevents premature saturation of vehicle capacities.
The Transformer-based routing solver demonstrates a scalability advantage over conventional iterative baselines. OR-Tools performs competitively on smaller scales. Its performance decays on large-scale sub-problems due to the computational complexity of the orienteering problem. At , the MCTS + OR method achieves an objective of 77.04. This trails the MCTS + Trans method (82.54) by a 6.66% gap. The Transformer model processes increased node density without the corresponding performance decay. The learned policy generalizes to larger instances. It captures routing patterns inaccessible to constructive heuristics.
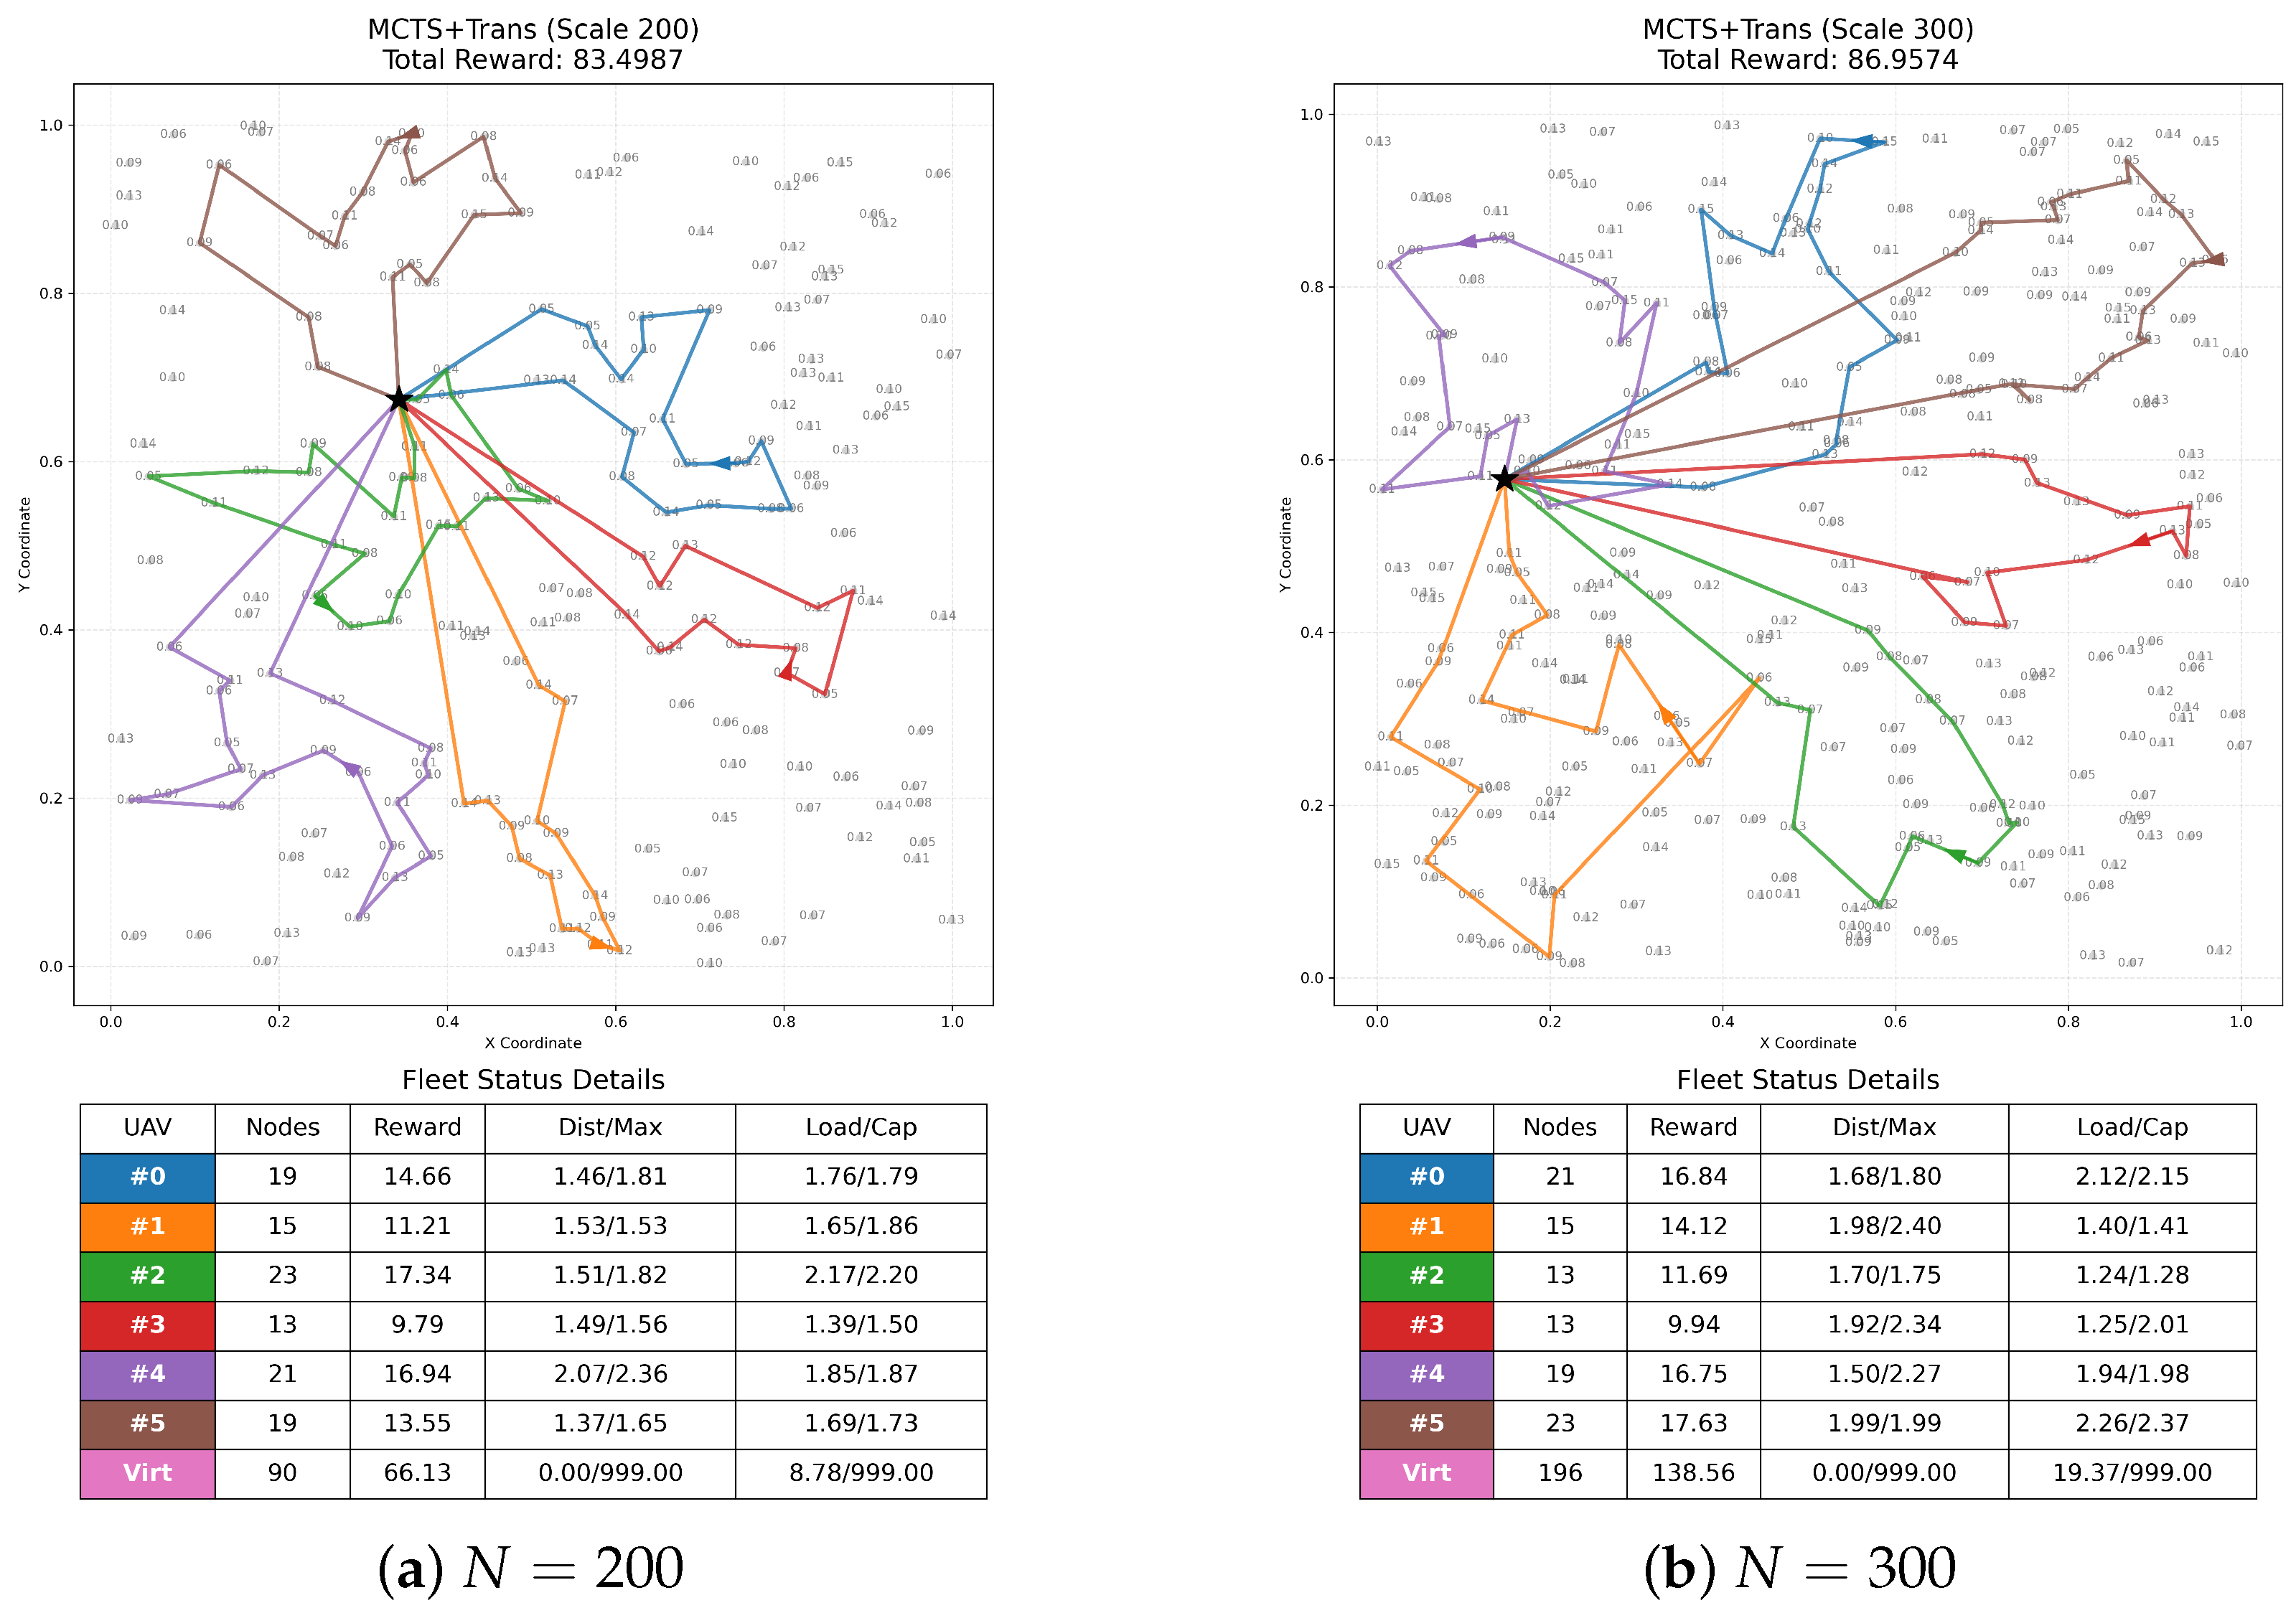
Analysis of
Figure 7 and
Figure 8 corroborates these numerical findings.
Figure 7 illustrates the proposed framework generating compact, non-overlapping trajectories at high target densities. These routes maximize the coverage of distributed high-value targets.
Figure 8 contrasts this with baseline methods. Random allocation methods (bottom row) produce entangled routes. This structural chaos reflects a failure to spatially decompose the massive task set. K-Means-based approaches (middle row) generate load imbalances. These imbalances stem from fleet heterogeneity. The proposed method (top-left) establishes a streamlined topology. This visual evidence verifies its capability to resolve large-scale collaborative mission planning problems.
5.4.2. Fleet-Size Sensitivity
The preceding experiments fix the fleet size at
. To evaluate sensitivity to fleet composition, all methods are tested under
UAVs using zero-shot inference without retraining.
Table 4 reports the results.
Under , KMeans + Trans achieves the highest objective at both scales (52.53 at ; 112.85 at ), surpassing MCTS + Trans by 24.4% and 35.3%, respectively. This reversal relative to the results reveals a boundary condition of the learned allocation policy. The MCTS search tree is trained on a 6-agent decision space; when transferred to 9 agents without retraining, the tree structure cannot represent the expanded combinatorial branching, limiting its ability to exploit additional fleet capacity. K-Means, as a geometry-based method independent of training configuration, distributes tasks across all available UAVs by spatial proximity, naturally scaling with fleet size.
This result identifies fleet-size generalization as a limitation of the current framework. Retraining or fine-tuning the upper-level policy on the target fleet configuration is expected to restore MCTS dominance, as the search mechanism itself is not fleet-size-dependent. Developing fleet-size-agnostic allocation policies constitutes a direction for future work.
5.5. Ablation Study
To validate the structural choices and verify the isolated contribution of each mechanism within the C-ACT protocol, a comprehensive ablation study was conducted at the scale. This scenario, characterized by the highest combinatorial complexity and stringent resource limits, serves as a stress test for the proposed framework. The complete MCTS + Trans framework is compared against four degraded variants:
w/o POMO: Replaces the POMO mechanism with single-trajectory greedy decoding. This isolates the baseline capability of the Transformer routing heuristic.
w/o MCTS (Neural Greedy): Removes the look-ahead search from the upper-level allocator. Task assignment relies solely on the neural policy’s direct greedy output.
w/o Curriculum (): Disables dynamic constraint annealing. The network trains under strict payload and range limits from the initial epoch.
w/o Virtual Agent: Removes the virtual agent from the assignment space. Infeasible tasks revert to rigid hard-masking, risking action space collapse.
The performance metrics for these variants are summarized in
Table 5.
Table 5 justifies each methodological choice through performance degradation. Most notably, the w/o MCTS variant achieves an objective of 74.50, yielding a gap of 9.74% relative to the full model. This result falls 3.08 percentage points below the MCTS + OR reference (6.66%), confirming that while the neural allocator learns meaningful representations, MCTS look-ahead simulations are essential to escape myopic assignments at large scales.
The most severe performance collapse stems from removing the Virtual Agent (29.49% gap). Without an absorptive buffer for infeasible targets, the action space frequently collapses during early training, causing MDP termination. To quantify its necessity,
Table 6 tracks the virtual agent’s utilization frequency across scales.
The proportion of instances requiring virtual agent intervention rises from 2.1% at to 14.3% at , confirming the virtual agent functions as an essential buffer in dense environments. Furthermore, MCTS allocation consistently triggers the virtual agent less frequently than the K-Means heuristic, indicating it generates more physically feasible sub-problems.
Finally, omitting dynamic constraint annealing (w/o Curriculum) reduces the objective to 75.50. Experimental logs confirm that without C-ACT, training exhibited severe instability: reward variance during early epochs was substantially higher, and independent runs frequently settled into penalty-avoidance behaviors. The curriculum schedule resolves this by expanding the feasible region early in training, then gradually contracting it toward physical limits. The w/o POMO variant confirms that the base MCTS + Trans architecture outperforms OR-based routing under single-trajectory decoding. POMO augmentation reduces the gap by a further 3.32 percentage points through multi-start geometric diversification.
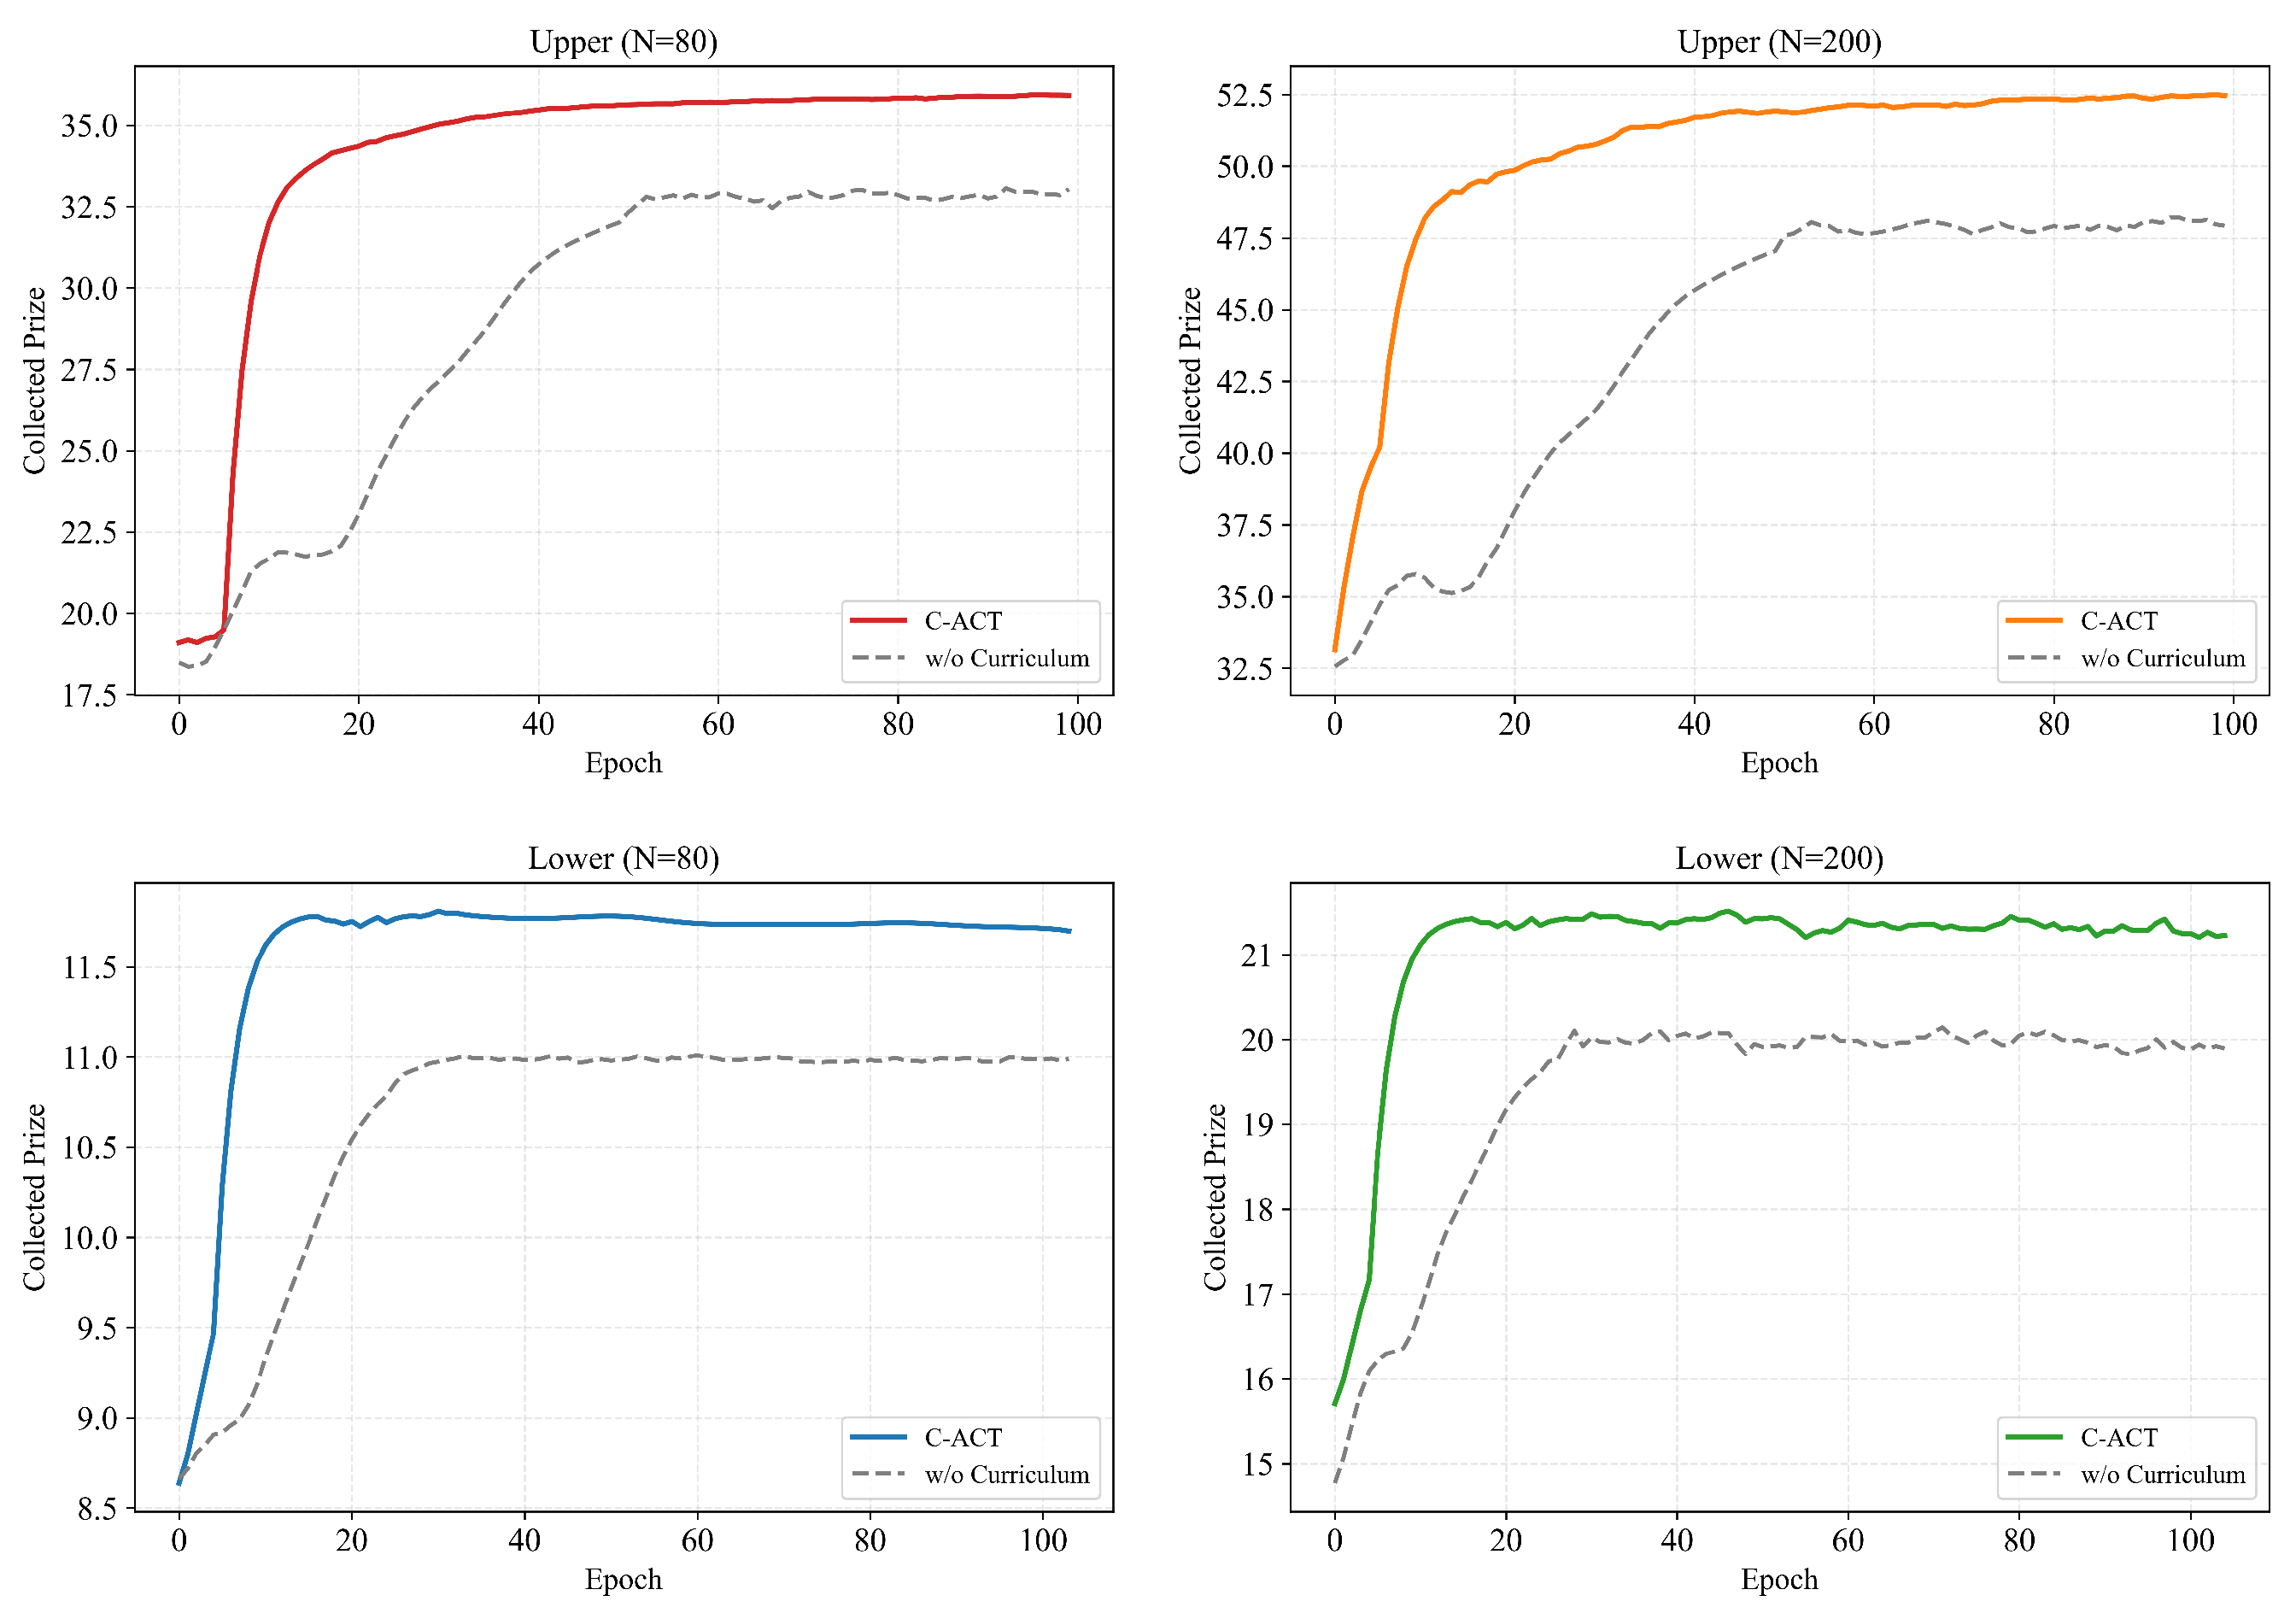
Figure 9 presents the training reward curves for both the upper-level allocation model and the lower-level routing model at two problem scales (
and
), comparing the full C-ACT protocol (solid) against the w/o Curriculum ablation with fixed
(dashed gray).
The convergence behavior of C-ACT is further evidenced by training dynamics (
Figure 9). At the upper level, C-ACT reduces reward variance by an order of magnitude relative to the fixed-constraint baseline: the variance ratio (C-ACT/w/o Curriculum) is 0.014 at
and 0.152 at
, indicating that curriculum relaxation is essential for stable upper-level optimization across problem scales. At the lower level, the variance reduction is moderate (
at
) since the routing policy operates on pre-allocated subproblems with smaller action spaces. These dynamics are consistent with the 8.53% performance gap at convergence (
Table 5) and confirm that dynamic constraint annealing is necessary for convergence in this constrained heterogeneous setting.
An end-to-end baseline generating joint allocation-routing sequences without bilevel decomposition would provide the most direct validation of the hierarchical design. However, no published end-to-end model supports the LSH-TOP constraints (heterogeneous capacities, heterogeneous ranges, and prize collection) at scales beyond . Training such a model from scratch requires action-space exploration per step (, yields candidate sequences), rendering convergence infeasible within practical GPU budgets. As a proxy, the w/o MCTS (Neural Greedy) variant approximates a flat learned policy: it uses the same trained Transformer allocator but removes tree-search look-ahead, collapsing the hierarchical structure to a single forward pass per assignment. Its 9.74% gap relative to the full model quantifies the minimum cost of abandoning structured search. The MCTS + OR reference further isolates the decomposition benefit: replacing the learned router with OR-Tools still achieves a 6.66% gap, confirming that the hierarchical structure itself—independent of the lower-level solver—provides the dominant performance contribution.
5.6. Statistical Stability and Computational Efficiency
Evaluating stochastic stability and resource utilization efficiency is essential for operational deployment. This subsection assesses statistical variance, task completion rates, and computational latency across scales.
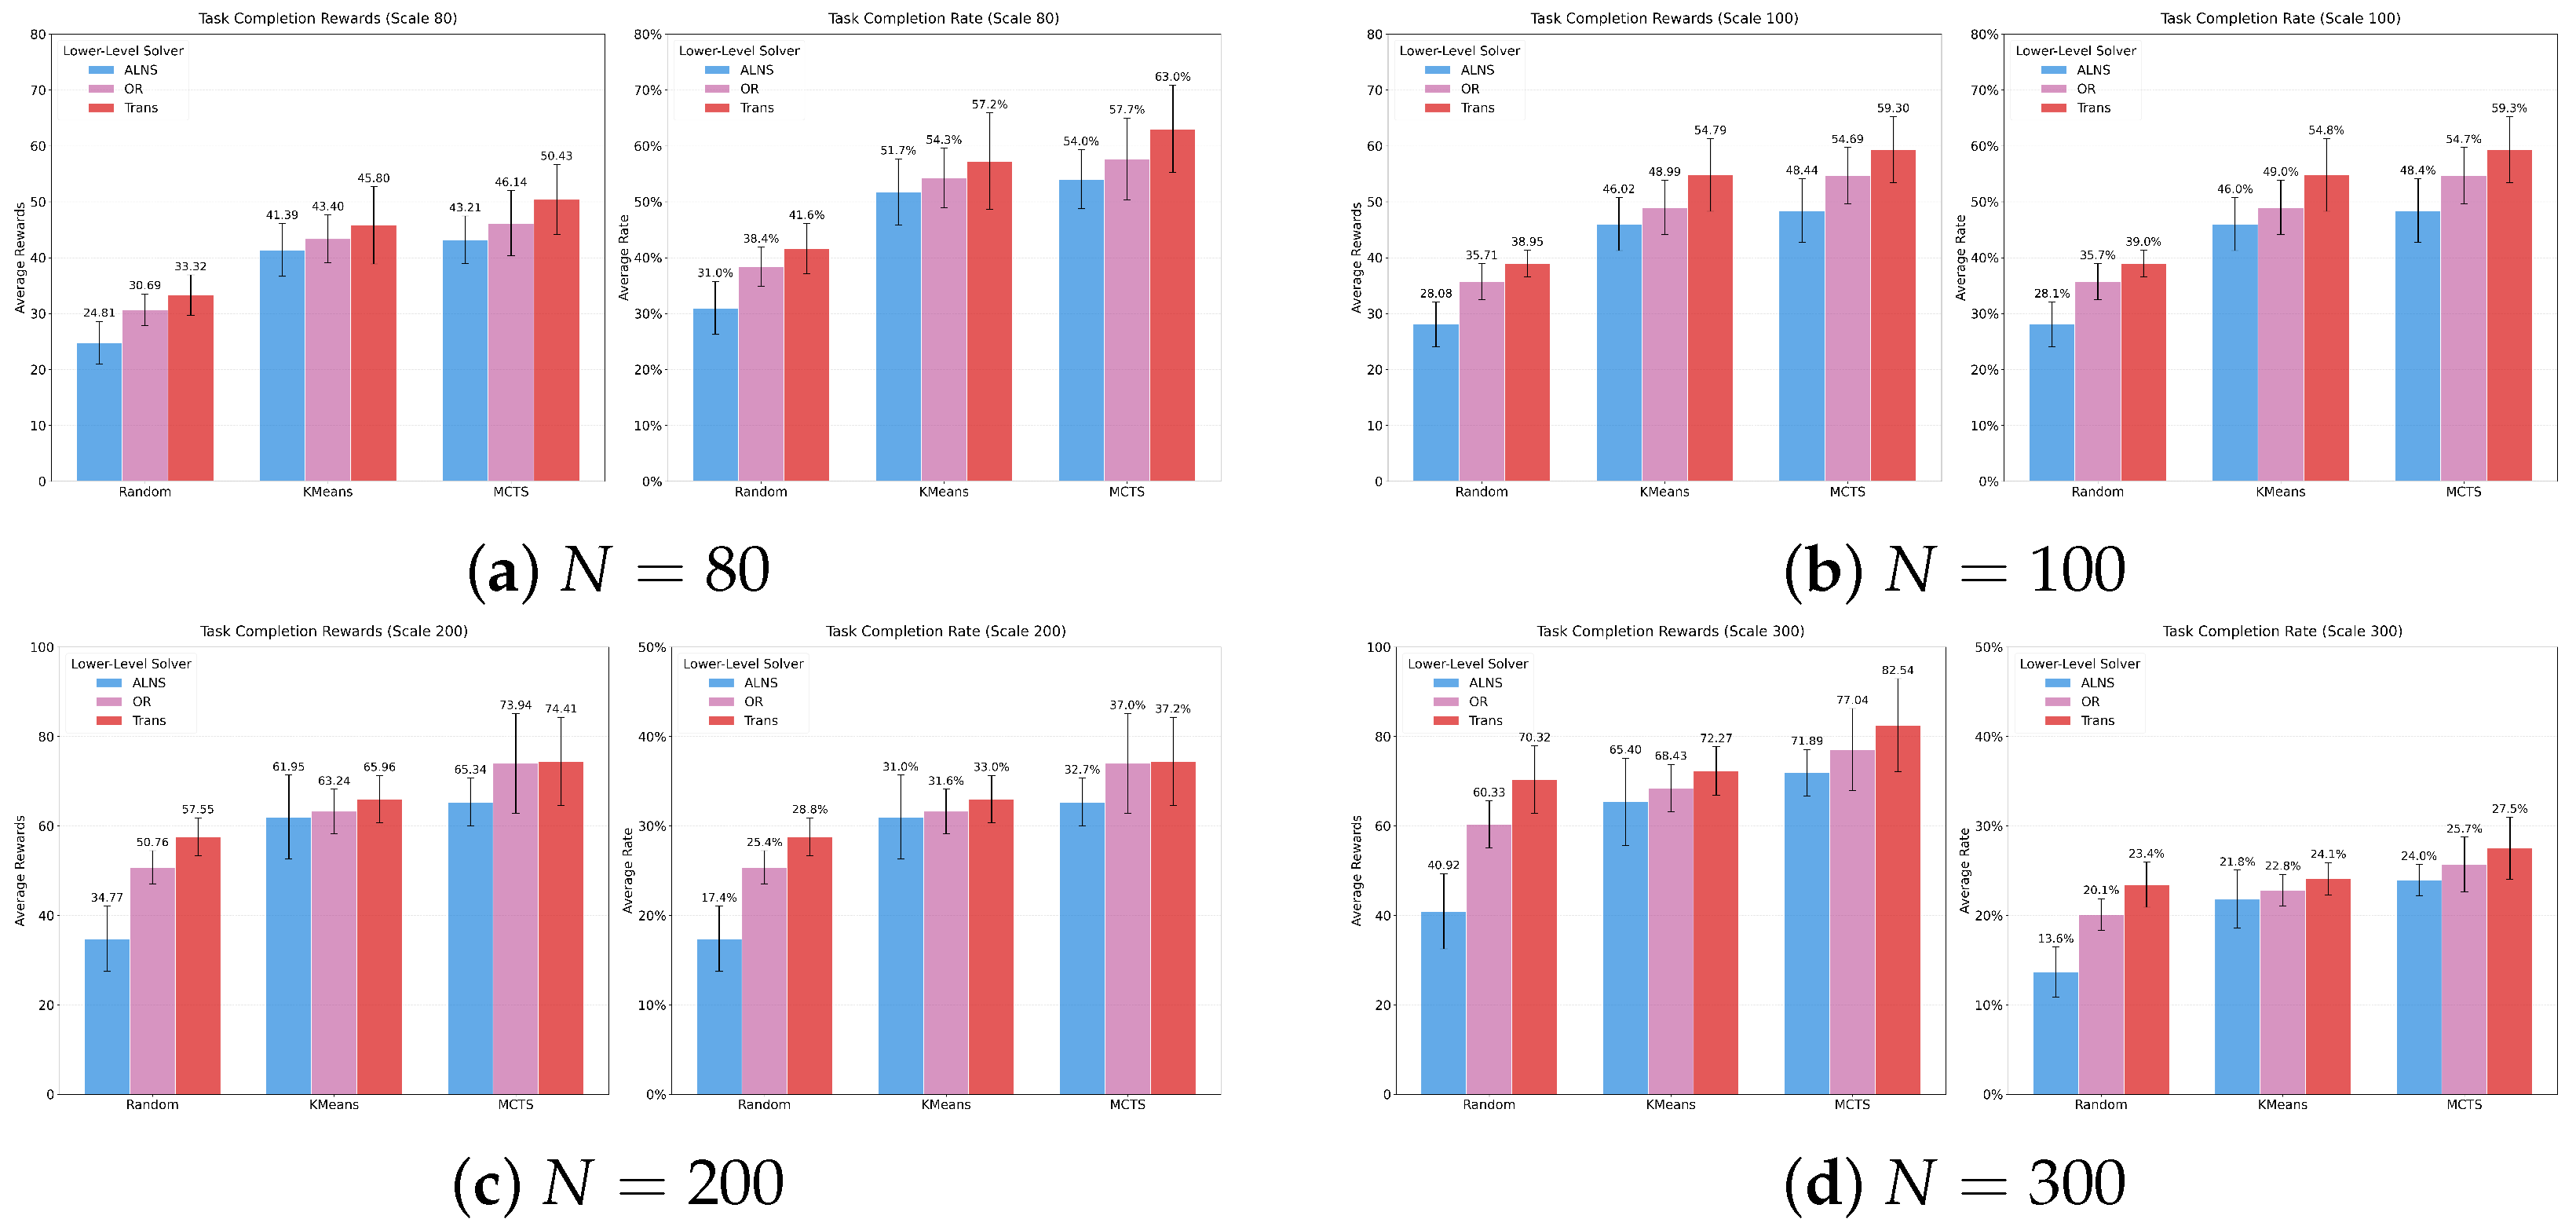
Figure 10 visualizes reward distribution and task completion rates for
. Error bars quantify standard deviations across test instances. Vertical progression from
Figure 10a–d reveal the MCTS + Trans method securing tighter error bounds. This contrasts sharply with Random and K-Means baselines. At
(
Figure 10d), the standard deviation for MCTS + Trans remains smaller than Random + Trans. The hierarchical framework mitigates the randomness inherent in combinatorial optimization.
The TCR quantifies the proportion of targets successfully served by the fleet.
Figure 10 reports TCR distributions across all scales and methods. At
, MCTS + Trans achieves a 63.0% completion rate, exceeding the 54.0% recorded by MCTS + ALNS (read from
Figure 10a). At
, the task-to-resource ratio peaks. MCTS + Trans maintains a leading completion rate of 27.5% (
Table 5). The MCTS strategy optimizes route compactness alongside high-value targeting, serving more nodes within strict flight range constraints.
The Wilcoxon signed-rank test was applied at
to verify that the performance gains of MCTS + Trans over the two strongest baselines are statistically significant. The test targets two controlled comparisons: MCTS + Trans versus MCTS + OR isolates the contribution of the lower-level routing solver, and MCTS + Trans versus KMeans + Trans isolates the contribution of the upper-level allocation strategy.
Table 7 reports both
p-values. Both fall below the 0.05 threshold, rejecting the null hypotheses for both comparisons.
Table 8 reports 95% confidence intervals for the proposed method and its two strongest baselines at
, computed across the 100 test instances via the normal approximation. Non-overlapping intervals confirm that performance differences are not attributable to sampling variance.
Computational efficiency dictates real-time applicability.
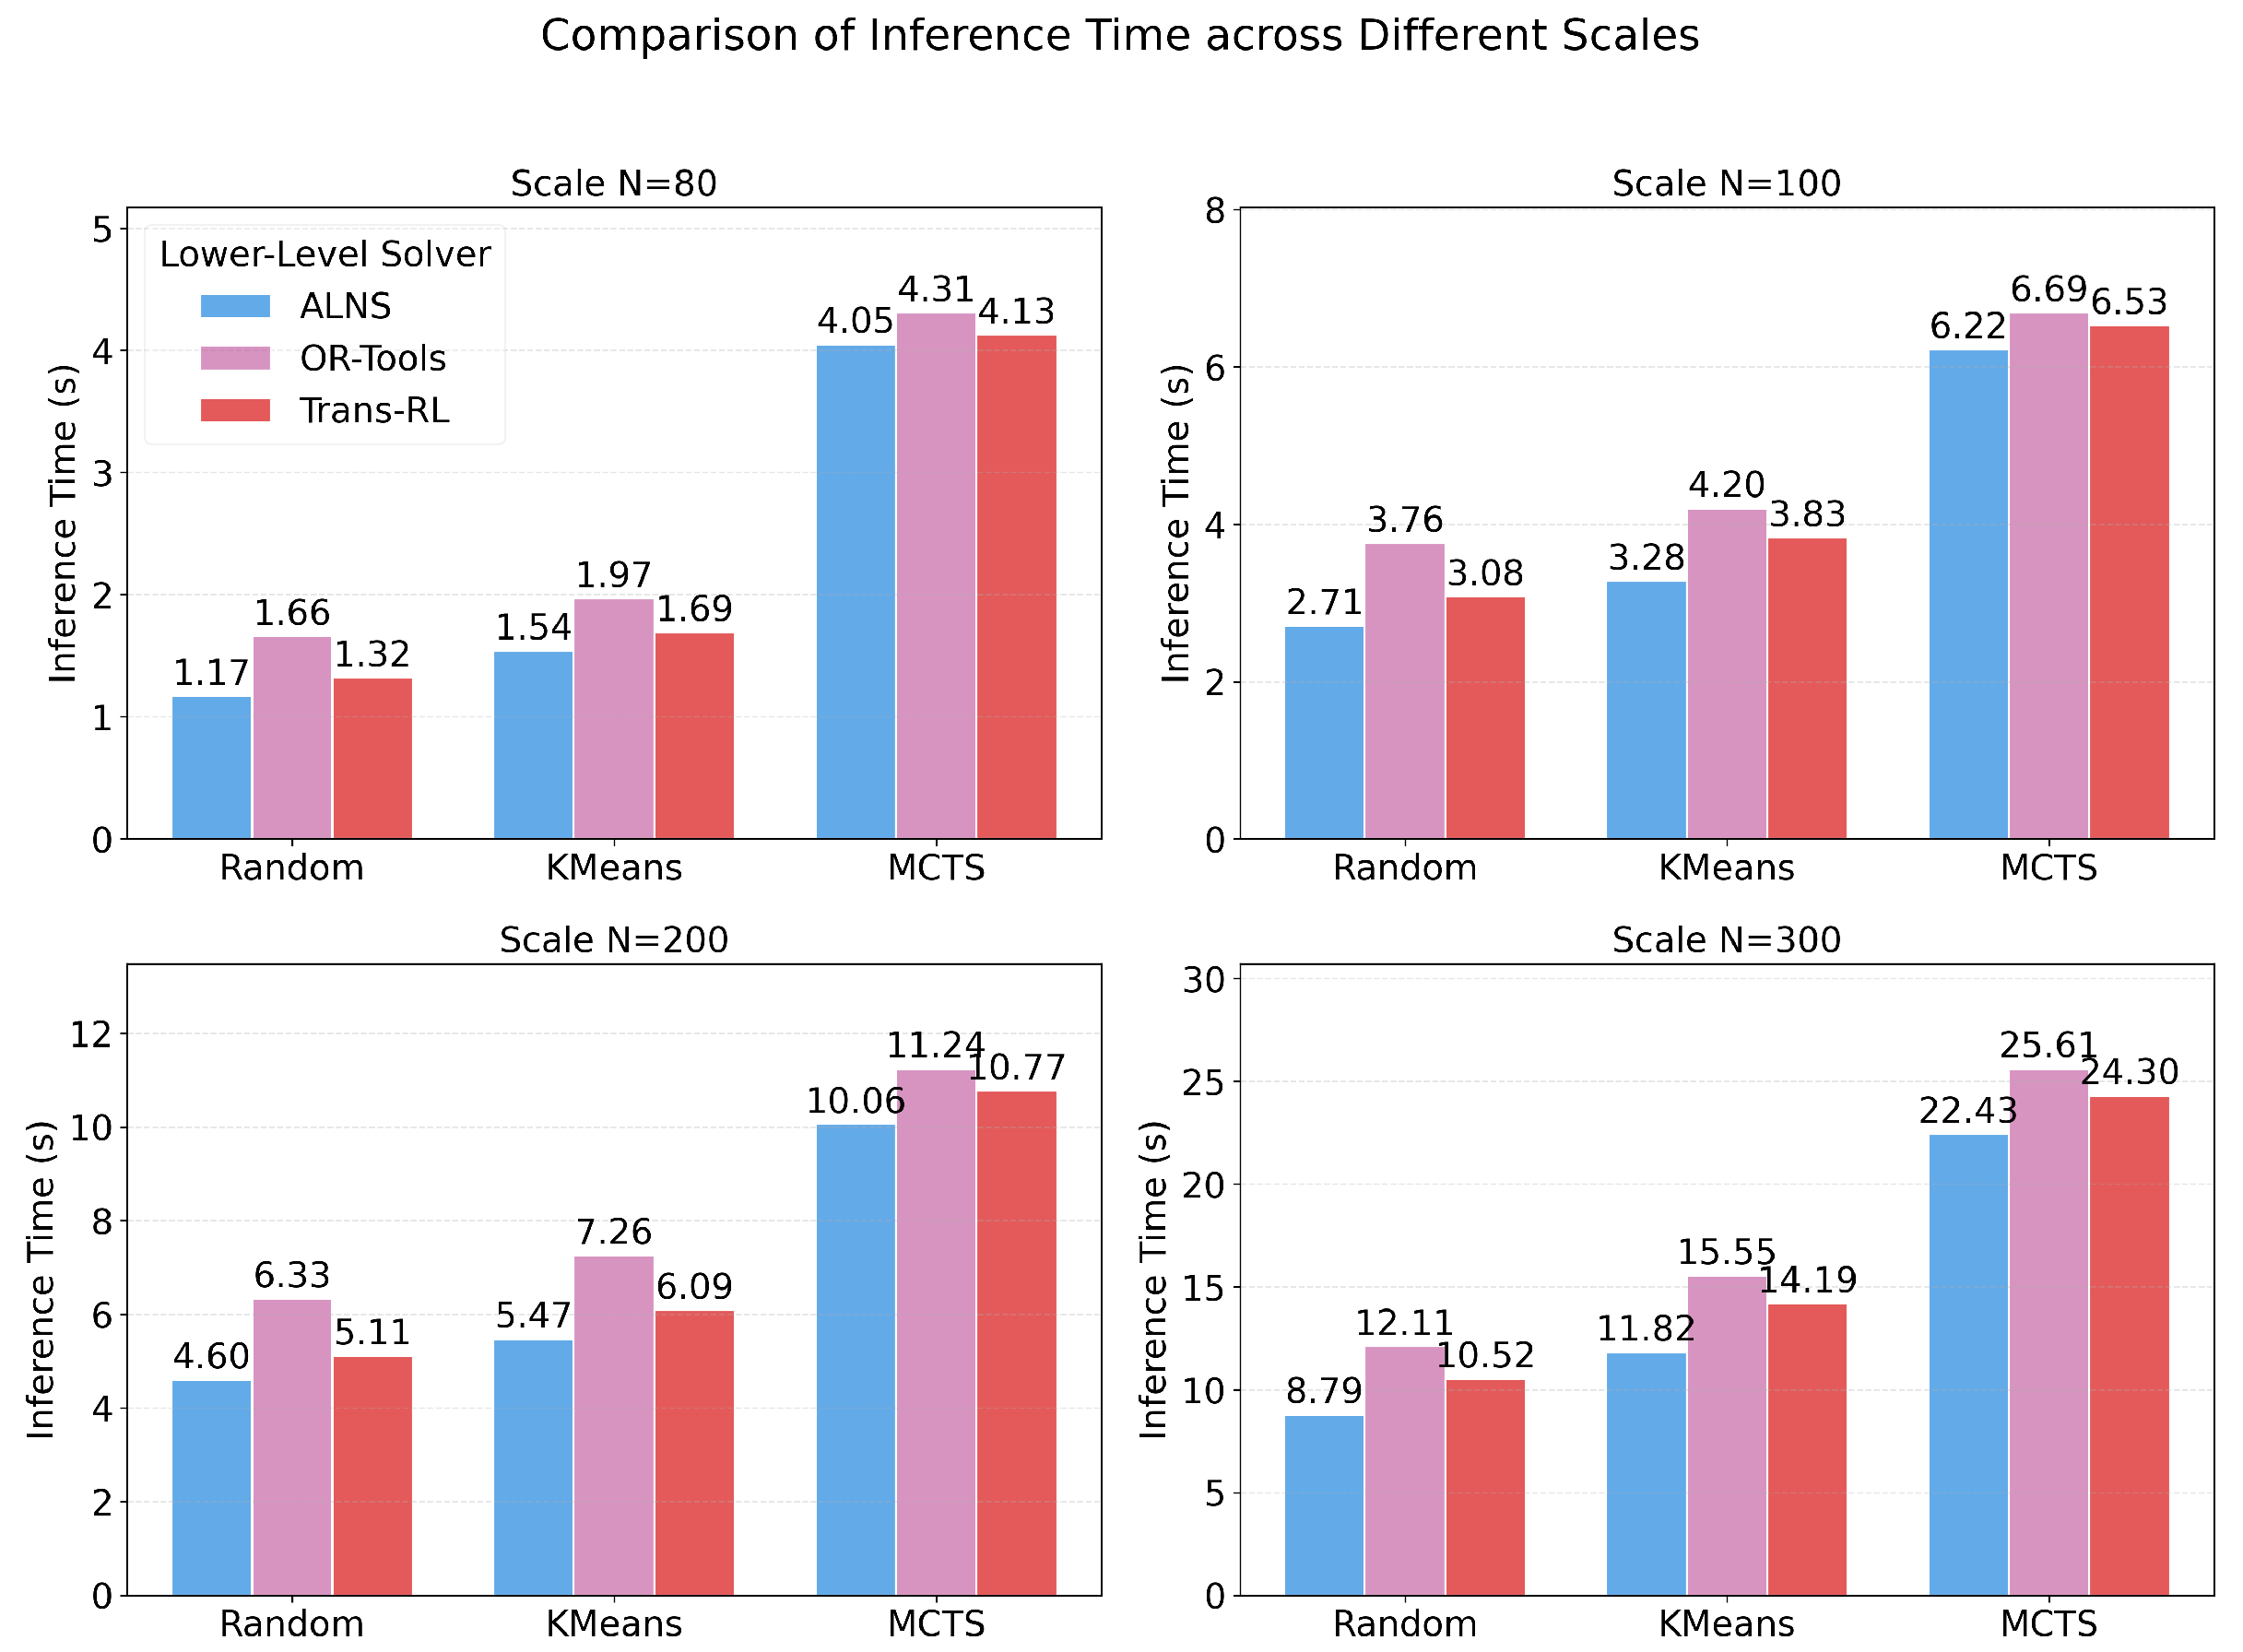
Figure 11 plots framework inference times against baselines. The MCTS + Trans computational cost exhibits sub-quadratic growth. It scales from 4.13 s at
to 24.30 s at
. The MCTS + OR method incurs accelerating overhead as the sub-problem complexity grows. It demands 25.61 s at
. Heuristic baselines like Random + ALNS operate with lower latency (8.79 s at
). They suffer from optimality gaps exceeding 50%. The proposed framework controls these trade-offs by investing computation into upper-level tree search. This isolates high-quality decompositions. Parallelized neural network inference recovers speed in the lower level. The MCTS + Trans configuration produces solutions within 24.30 s at
, satisfying the temporal constraints of operational decision support.