Article

Fiber-Tethered UAV-Enabled Adaptive Aerial Optical Access Networks and Ground-to-Air-to-Ground Optical Bridging

1
Department of Information and Telecommunication Engineering, Incheon National University, Incheon 22012, Republic of Korea
2
Energy Excellence & Smart City Lab., Incheon National University, Incheon 22012, Republic of Korea
3
Department of Embedded System Engineering, Incheon National University, Incheon 22012, Republic of Korea
4
Institute of Photonics, University of Strathclyde, Glasgow G1 1RD, UK
*
Author to whom correspondence should be addressed.
Drones 2026, 10(4), 236; https://doi.org/10.3390/drones10040236
Submission received: 15 February 2026 / Revised: 15 March 2026 / Accepted: 18 March 2026 / Published: 25 March 2026

Highlights

What are the main findings?
  • It is found that a fiber-tethered aerial optical network, where UAVs deploy flexible optical backhaul and access links, significantly minimizes service outage in wide-area scenarios.
  • The proposed system also achieves superior service availability with lower infrastructure density than terrestrial baselines, the feasibility of which is validated by a stable multi-gigabit experimental link.
What are the implications of the main findings?
  • The adaptive architecture supports both rapid disaster recovery and on-demand network densification, bypassing ground-level obstructions to deliver fiber-grade connectivity.
  • This approach extends high-capacity optical networks into the air, offering a scalable alternative to radio-frequency systems that is inherently immune to spectral congestion.

Abstract

This work proposes a fiber-tethered UAV-enabled adaptive aerial passive optical network (AA-PON) framework for rapid extension of optical access and backhaul in hard-to-reach or temporarily disrupted environments. The proposed architecture supports two distinct operating modes: (i) an aerial base station (ABS) mode for wide-area service extension and (ii) a ground-to-air-to-ground (G2A2G) mode for targeted high-speed optical bridging to ground terminal units. Unlike conventional UAV relay approaches, the proposed framework is developed as a network-level optical access/backhaul architecture based on tether-assisted aerial nodes and reconfigurable optical topology formation. In the ABS mode, representative Bus, Ring, and Star topologies are analyzed to evaluate serviceability, outage, deployment latency, and scalability as the number of UAV nodes increases. In the G2A2G mode, a stochastic-geometry-based analysis is used to characterize blockage-limited optical serviceability and infrastructure-density trade-offs. To complement the analytical study, a 2 Gb/s proof-of-concept FSO link between two fiber-tethered UAVs is demonstrated as an initial feasibility validation of the end-to-end optical link. The results show that the proposed AA-PON provides a flexible aerial optical networking framework that combines reconfigurable topology support with localized high-capacity optical access extension.

1. Introduction

Current communication networks provide broad wireless access, but the rapid increase in mobile traffic means these systems are likely to reach capacity limits in the near future [1,2,3]. Thus, non-terrestrial networks (NTNs) are expected to be essential for maintaining high speeds and coverage in broad areas [4,5]. Unmanned aerial vehicle (UAV) systems, in particular, receive significant attention in this area. They serve as adaptable additions to ground-based networks, effectively extending connectivity to places where signals are weak or infrastructure is damaged [6,7,8,9].
Systems that provide broadband and can be deployed quickly are vital for rural areas and disaster recovery efforts [10,11]. However, standard radio frequency (RF) communication could face problems due to a large number of devices using up the limited available bands [5]. Therefore, optical wireless communication (OWC), particularly free-space optical (FSO) links, serves as a strong alternative. These links utilize unlicensed spectrum and offer high efficiency and better security, making them suitable for high-capacity aerial backhaul [12,13,14]. Despite these benefits, standard UAVs suffer from short flight times due to battery limits and cannot carry heavy broadcasting equipment [15,16]. Although automatic charging has been suggested, fiber-tethered UAVs can offer a more reliable solution.
Also, the tether can provide constant power and uses optical fibers to send data at high speeds, removing the need for heavy transmitters on the drone [16,17,18]. Currently, most studies limit tethered UAVs to acting as flying base stations that send RF signals from the air. While this approach improves coverage, it still faces the speed limits of wireless connections for tasks requiring high bandwidths.
To tackle this, two distinct configurations for an adaptive aerial passive optical network (AA-PON) are investigated in this work. Here, the term ‘adaptive’ denotes the capability of the proposed AA-PON framework to support multiple topology formations and operating modes according to deployment needs, rather than a fully specified real-time control mechanism. The first is the aerial base station (ABS) scenario, a concept where high-capacity UAVs directly broadcast wireless signals to users in a specific area from the air. The second is the ground-to-air-to-ground (G2A2G) scenario, a more practical approach where tethered UAVs act as aerial bridges. In this setup, the UAV replaces physical cables to connect a ground-based service unit, which then handles the wireless transmission. Hence, the ABS configuration is designed to provide broad reach for users spread across a large area, and the G2A2G approach concentrates more on delivering reliable high-speed connections to specific points requiring densification or critical missions, such as field hospitals and emergency points. Compared with RF-based aerial and satellite systems, the proposed AA-PON targets a different operating point, that is, a localized high-capacity extension of terrestrial optical access networks. While RF-satellite systems offer broader-area wireless coverage, they remain constrained by spectrum availability and interference management.
By contrast, the proposed optical framework emphasizes fiber-grade backhaul capacity and direct integration with existing optical access infrastructure, making it suitable as a complementary solution for temporary or hard-to-reach deployment scenarios. As summarized in Table 1, the proposed architecture uniquely combines fiber-grade optical backhaul capacity, aerial deployment flexibility, optical-access integration, and network reconfigurability, whereas existing approaches typically sacrifice at least one of these properties.
The remainder of this paper shows the system architecture in Section 2 and evaluates the topology performance in Section 3. Experimental validation is provided in Section 4, followed by conclusions in Section 5.

2. System Architecture of Aerial Passive Optical Network

2.1. Operational Modes

The proposed fiber-tethered UAV-based system can serve as a flexible platform, where the aerial layer consistently readjusts its formation according to the specific requirements and connects UAVs using high-speed optical links. It supports two distinct configurations. The first mode is the ABS mode. It uses UAVs as flying optical relays and cell towers to create wide coverage with its flexibility and long reach. In this setup, the UAVs receive optical signals through tethered fiber from the backhaul and convert them into radio signals for users on the ground or relay them to adjacent UAVs using FSO links. This approach is well-suited for providing wide connectivity even to the users who are out of reach under a conventional network. It is noted that sustained operation in this mode may require optical wireless charging, a capability currently being advanced in related research [19]. In this work, sustained relay operation is assumed but not explicitly modeled, allowing the proposed AA-PON to be evaluated at the network-topology level. The Bus, Ring, and Star configurations are therefore treated as logical topologies after deployment. Practical issues such as tether management, staged deployment, relay replacement, and optical wireless charging are beyond the scope of this work.
In contrast, the G2A2G scenario acts as a practical tactical optical extension cord. Instead of broadcasting radio signals from the sky, the leaf UAVs use the fiber tether to bring a physical connection directly down to a ground terminal unit (GTU). This ensures that the data path remains entirely optical, traveling from the main ground network, through the air via lasers, and down the tether to the specific user. This design is built for specific, high-priority locations where speed and security are crucial, such as field hospitals or command centers. By completely avoiding wireless radio links, the system provides the same high performance as a standard fiber cable, delivering multi-gigabit speeds to temporary locations that are otherwise hard to install.

2.2. Network Infrastructure and Scenarios

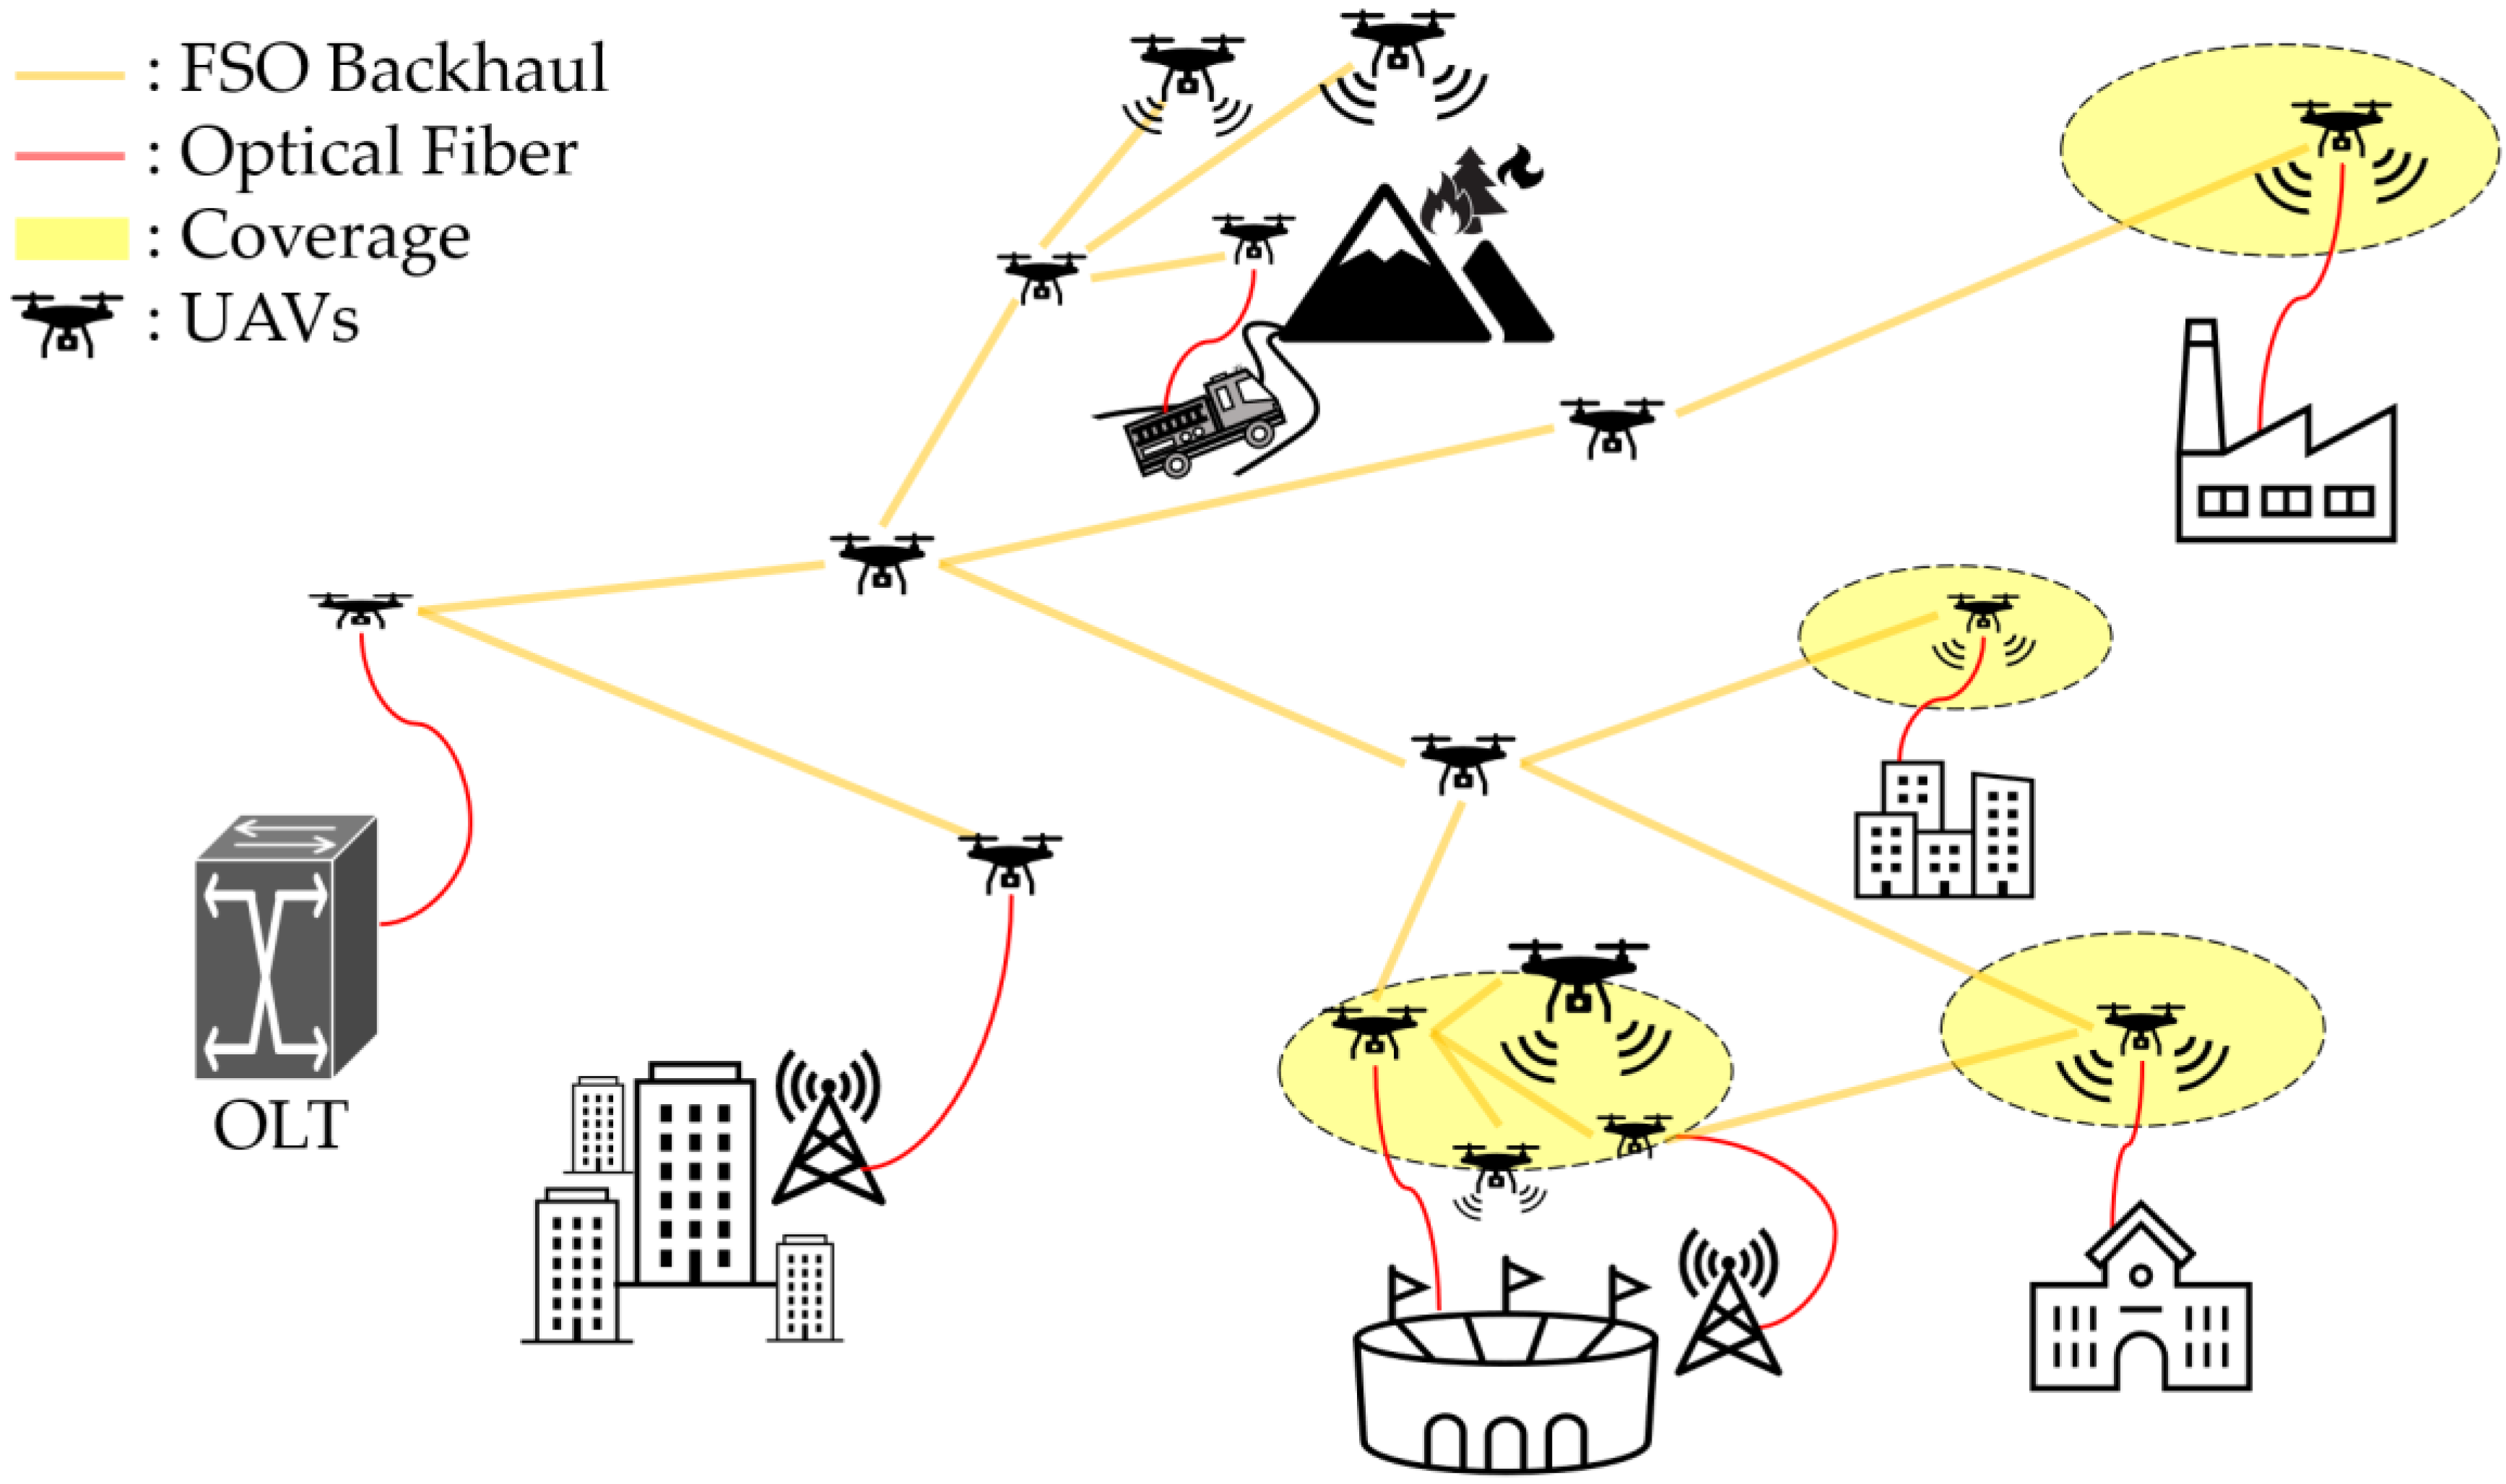
Modular designs made up of three main parts, including the optical line terminal (OLT) anchor, aerial relay nodes, and GTUs, are considered, which work together as a fast-deploying system. It is assumed that the aerial section transports data over a diverse and challenging terrain, while the ground section ensures stable connections for users. The overall system-level schematic of the proposed fiber-tethered UAV-enabled adaptive aerial optical network is shown in Figure 1. The network starts at the aerial OLT node. This node acts as the gateway connecting the main ground network to the UAV swarm. The OLT UAV takes off vertically from the vehicle, pulling a high-capacity fiber cable. This cable feeds the optical signal from the ground into the air network. Once at the right height, the UAV uses an onboard laser transmitter to change the signal from the cable into a focused beam, starting the wireless optical connection.
Intermediate connections are managed by fiber-tethered relay nodes, which act as optical repeaters in the sky. Unlike ground-based relays that are often blocked by obstacles, these UAVs hover at altitudes of 100 to 150 m. This height can allow them to maintain a clear line of sight over buildings, trees, or debris. Each relay connects to a mobile ground station via a tether. In this study, this cable is assumed to provide continuous power, allowing the UAV to operate indefinitely without battery changes. In this role, the tether serves mainly as a power supply and an anchor to keep the UAV stable, while data travels horizontally through the air using FSO links. The network ends at GTUs.
The GTU can act as a launchpad for the leaf UAV and as the receiver for the data. Once the leaf UAV is in position, it uses its tether to send high-speed data down from the air to the ground unit. The GTU then converts the optical signal and distributes it through standard connections, such as Ethernet for field hospitals or Wi-Fi for emergency shelters. This approach can act as a bridge between the aerial network and user devices. It keeps sensitive optical equipment safely in the air while making robust connection ports accessible to users on the ground. In practical multi-UAV deployment, the mechanical management of fiber tethers constitutes an important constraint that is not explicitly modeled in the present analysis. In particular, Bus and Ring topologies may involve multiple simultaneous inter-UAV tether segments, which can increase the risk of tether tangling, tension imbalance, strain during formation reconfiguration, wind-induced oscillation, and restricted flight-corridor maneuverability. These factors may reduce the practical deployability of certain formations even when their network-level coverage or latency characteristics are favorable. Accordingly, the topology comparisons in this work should be interpreted as an idealized network-level benchmark under simplified tether-management assumptions, while future deployment-oriented studies should jointly consider optical-network performance together with mechanical tether-management constraints.

3. Topology Analysis and Performance Evaluation

3.1. Simulation Framework

To evaluate the system under realistic conditions, a simulation framework focusing on a small and rapidly deployable fleet of UAVs intended for immediate local use or disaster response, rather than a massive network, is developed. The physical parameters are selected to ensure reliability and meet safety standards. The maximum horizontal distance between UAVs is set to 1000 m. Although commercial systems can theoretically reach further, this limit is chosen to guarantee high speeds even in poor visibility, such as smoke or haze often found in disaster areas. The UAV height is fixed at 150 m. This altitude is high enough to clear obstacles like buildings and trees but remains low enough to stay out of restricted airspace.
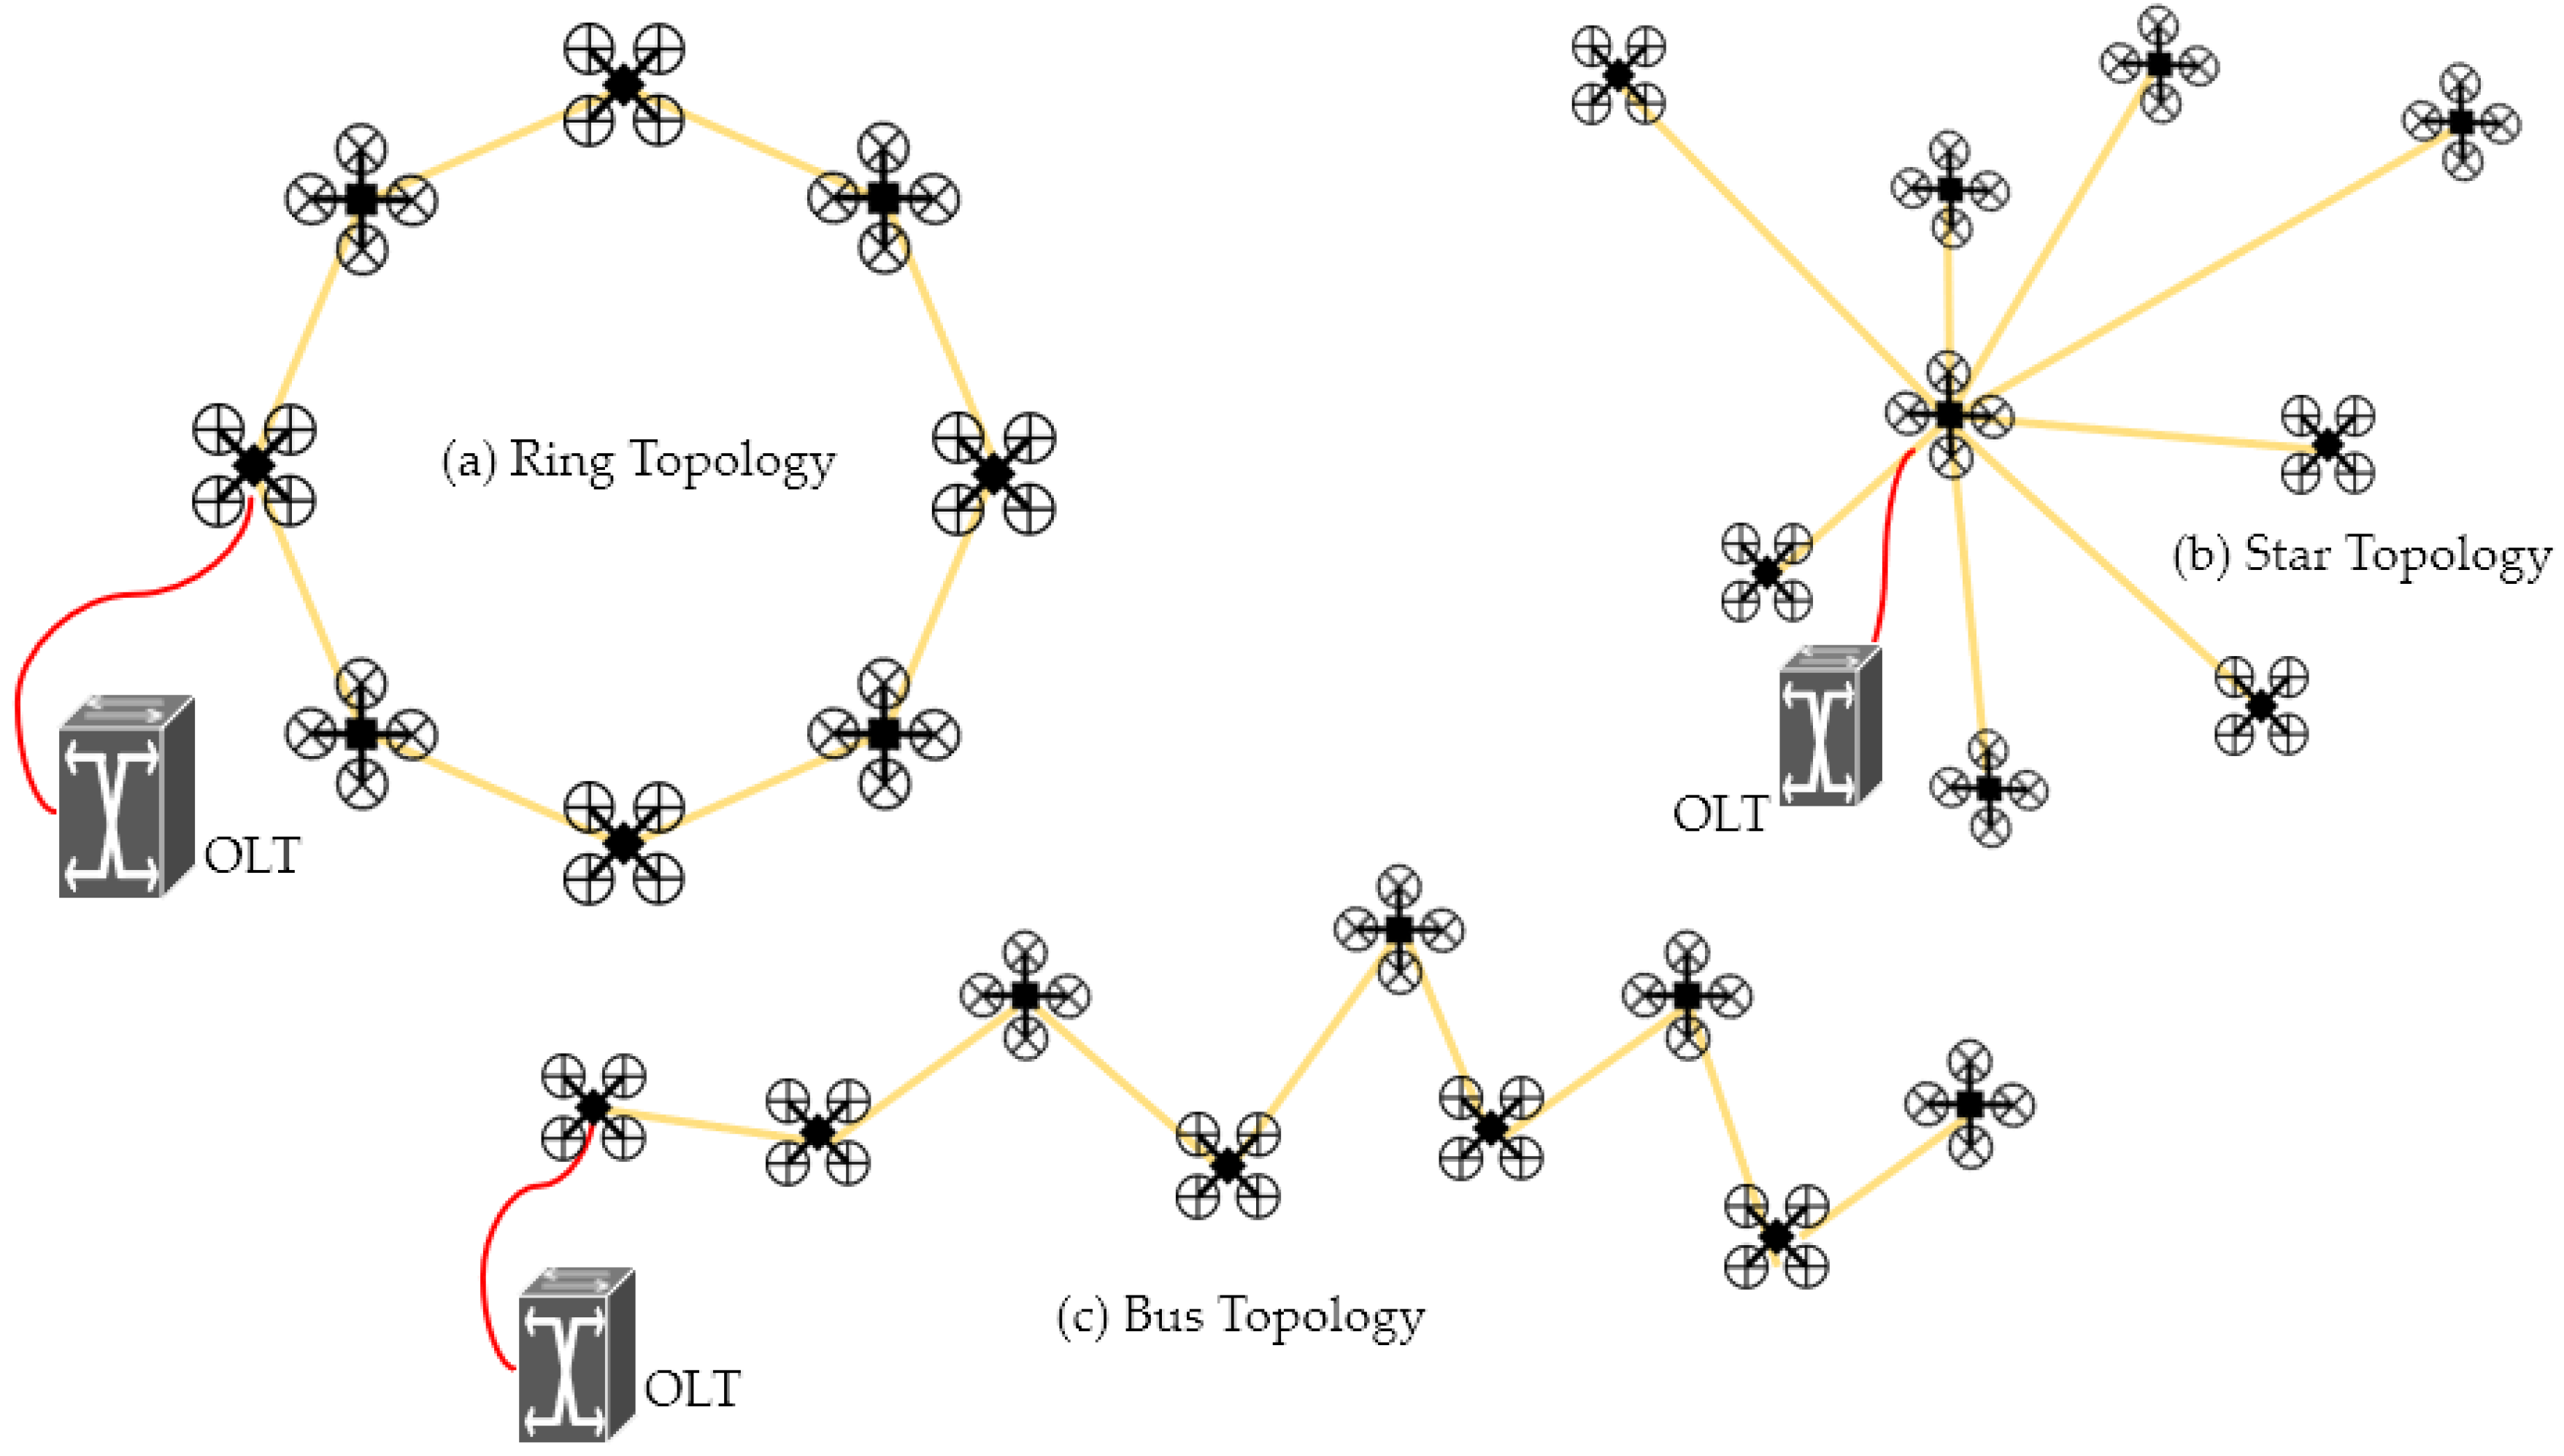
Based on these parameters, three network shapes are considered, as shown in Figure 2. The bus topology places nodes in a single line, similar to a chain, which is designed to extend the network as far as possible from the source. In contrast, the star topology clusters all nodes around a central point. This focuses capacity in one specific area but limits the range to a single connection distance. The ring topology arranges nodes in a closed loop, creating a backup path to improve resilience against failures, although it covers less distance than the linear layout.
The numerical results in the following subsections are obtained using MATLAB 2025-based evaluation under representative baseline assumptions. For the ABS-mode analysis in Section 3.2, the representative Bus, Ring, and Star topologies are compared through a deterministic evaluation. For the latency analysis, the number of UAV relay nodes from 3 to 1000, corresponding to 998 evaluated node-count configurations per topology is simulated. The purpose of this analysis is to compare relative topology-dependent scaling trends in serviceability and delay under a unified baseline scenario, rather than to perform detailed packet-level or Monte Carlo simulation. The G2A2G results in Section 3.3 are treated separately using an analytical stochastic-geometry framework to evaluate blockage or LoS-limited optical serviceability. Thus, the overall methodology combines deterministic topology comparison for the ABS case with stochastic-geometry-based analytical modeling for the G2A2G case.

3.2. Performance Analysis: Aerial Base Station (ABS) Mode

In the ABS scenario, the main goal is to provide wireless service to the largest possible area. To measure how well such network layouts achieve this, a geometric service-outage ratio is used in this analysis, representing the percentage of the target area that is not covered by the UAV swarm under a common nominal service radius. This simplified metric is intentionally adopted to isolate the first-order effects of network topology on service-area dimensioning and deployment trade-offs within a unified analytical framework. Therefore, the outage considered here should not be interpreted as a full PHY-layer radio outage probability derived from RF interference, fading, or SINR thresholds.
P o u t a g e = 1 A c o v A h e x
A c o v refers to the total service area provided by the UAV swarm, and A h e x is the size of the standard hexagonal zone targeted for service. To ensure a fair comparison across all network shapes, the size of this target zone is standardized by the maximum possible reach of the linear bus layout, which acts as the baseline for the size of network. The size of the target macrocell is then determined by the widest possible reach of the linear Bus layout, as calculated:
A hex = 3 3 2 ( 1 sin ( 60 ) × ( ( N 1 ) d max ) + D coverage ) 2
where N represents the total number of UAV nodes, d max is the maximum FSO link distance between UAVs, and D coverage denotes the diameter of the wireless service area provided by a single leaf UAV.
Under these conditions, the star topology offers the smallest service area. This happens because the UAVs are restricted to a single connection hop, forcing them to cluster close to the central anchor. Consequently, they cannot extend far into the target zone. The outage ratio for this setup is calculated as:
P outage star = 1 π ( d max   +   D coverage ) 2 A hex
In contrast, the bus topology maximizes the network’s reach through its linear design. By extending the UAVs over N 1 hops, it covers the widest area and achieves the lowest outage ratio, as shown below:
P outage bus = 1 π ( ( N 1 ) d max   +   D coverage ) 2 A hex
Finally, the ring topology forms a closed loop, arranging the UAVs into a regular polygon. This shape places a geometric limit on the network’s reach. The effective service area is determined by the diameter of the circle formed by N UAVs with a link distance of d max , resulting in the following outage ratio:
P outage ring = 1 π ( 2 × ( d max 2 cos ( π 2 π N ) ) + D coverage ) 2 A hex      
This comparison highlights a clear difference in efficiency. While the bus topology scales well to cover the target zone, the ring and star topologies leave significantly more area unserved. This is due to their inherent structural limits; specifically, the closed-loop shape of the ring and the centralized clustering of the star.
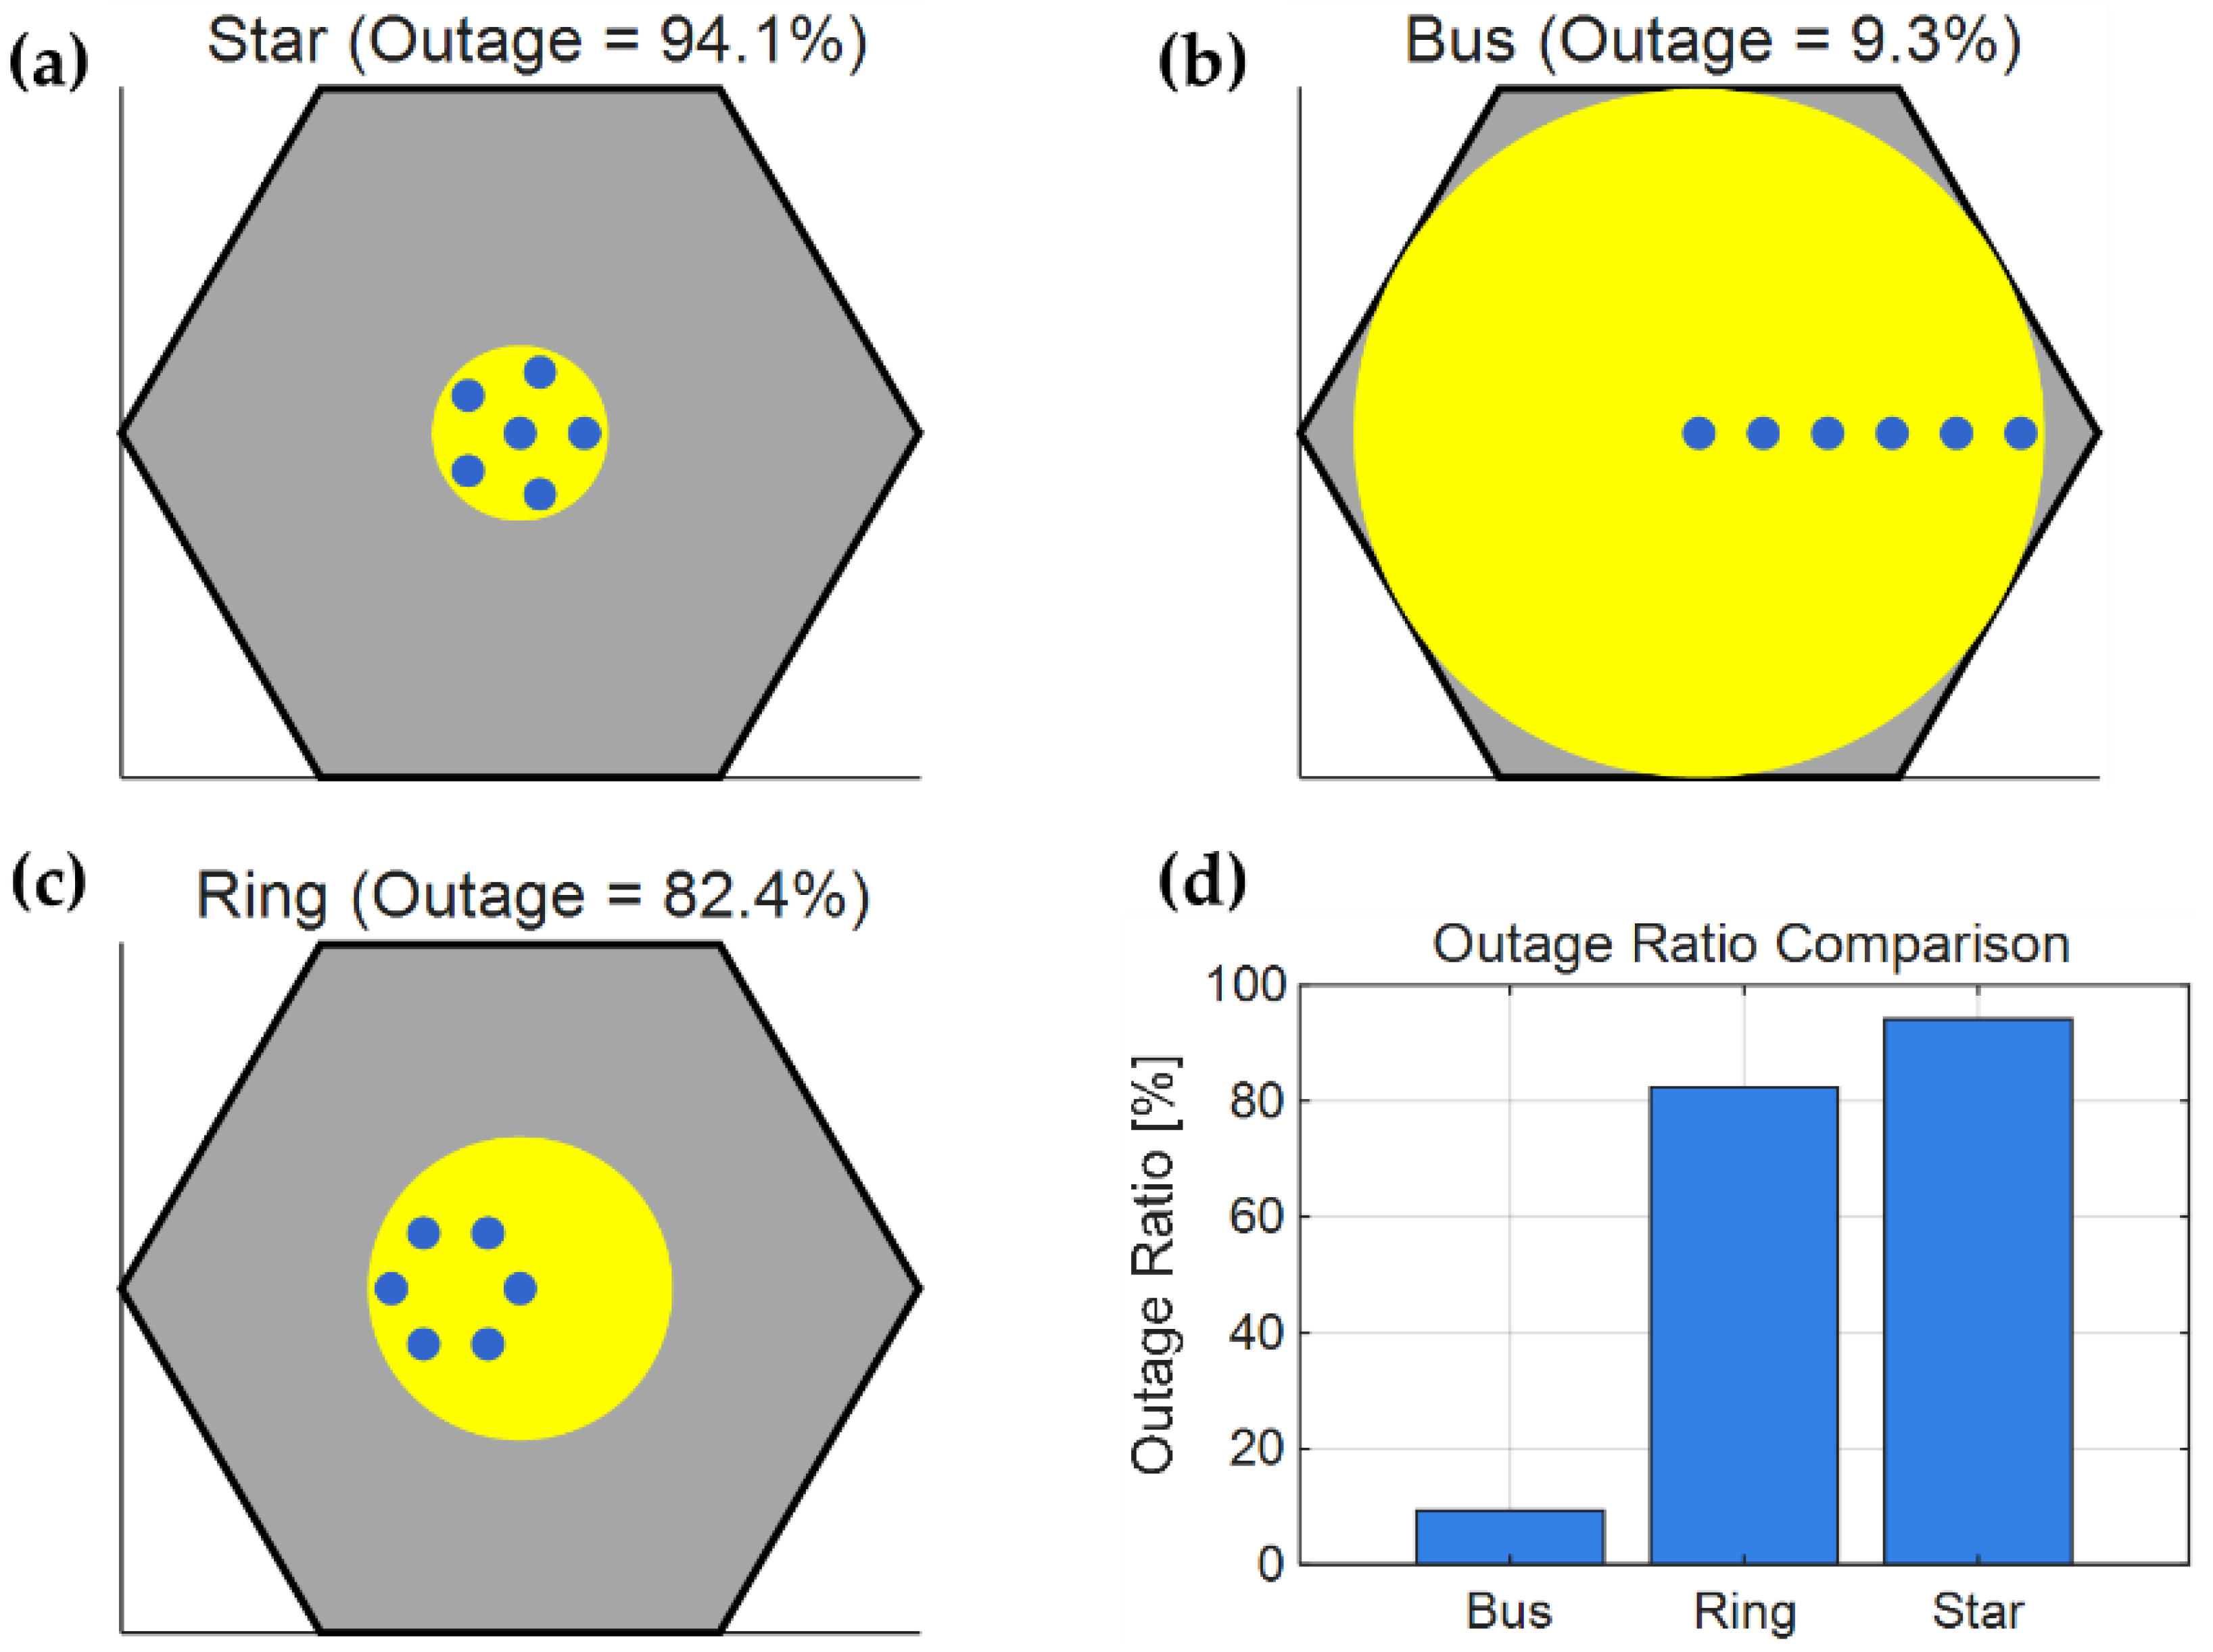
Figure 3 presents the spatial coverage simulation and corresponding outage ratios for a network of six UAVs ( N = 6 ) with a standardized link distance. In the maps shown in Figure 3a–c, blue markers indicate the UAV positions, while yellow regions represent the effective wireless coverage. These zones are displayed over a gray hexagonal background representing the target service area. To ensure a fair comparison, the size of this area is fixed based on the widest possible reach of the bus topology. The quantitative impact is summarized in Figure 3d, which compares the outage ratio, defined as the percentage of the area that remains uncovered (the visible gray region). The bus topology achieves the most efficient coverage with a minimal outage of only 9.3%. Meanwhile, the ring and star topologies exhibit significantly higher outage ratios of 82.4% and 94.1%, respectively.
In addition to coverage, the speed of deployment is a critical factor for time-sensitive missions. This initial latency ( T init ) could vary by initial locations of UAVs and topologies. Here, for a generalization T init is defined as the time required for the UAV swarm to move from the central anchor to their operational positions. This metric directly determines how quickly the network can become active. To calculate this, it is assumed that the average distance the UAVs must travel is half of the network’s maximum radius ( R topo ). Using a constant flight speed ( v ), the initial latency is expressed as:
T init = R topo 2 v
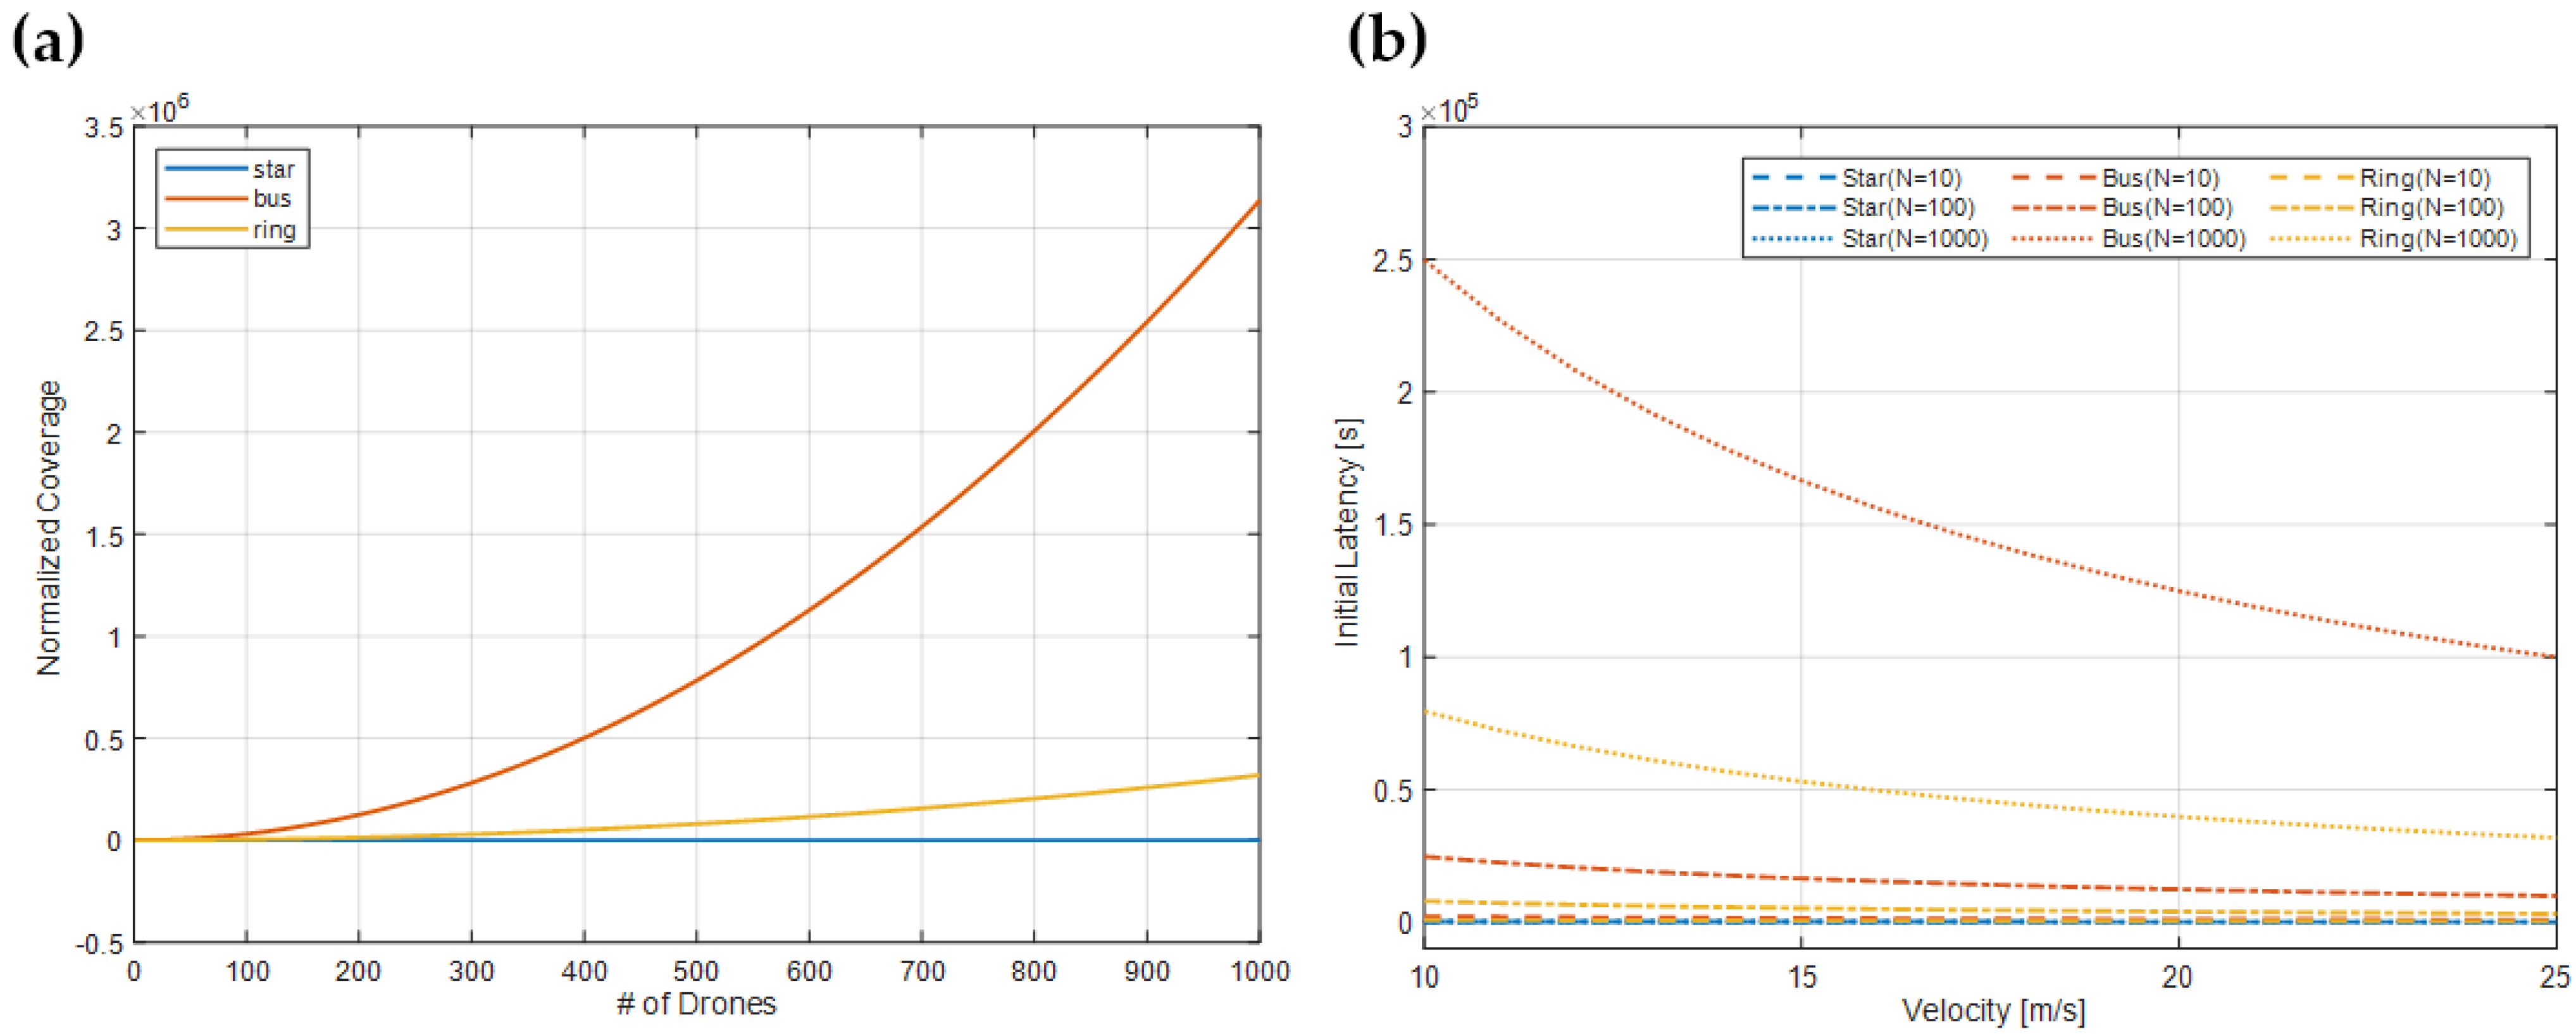
This analytical relationship shown in Figure 4 highlights a fundamental trade-off between spatial coverage and deployment speed. Specifically, the bus topology achieving the lowest outage ratio due to its extensive linear reach ( N 1 ) d m a x , in practice creates the highest initial latency. In contrast, the star topology offers the most rapid deployment because its reach is restricted to a single-hop distance d m a x , even though this results in a higher probability of service outage. The ring topology exhibits an intermediate latency profile, sitting between these two extremes. These findings highlight the clear trade-off between structural resilience and the ability to expand coverage, highlighting the importance of balancing coverage requirements with time-critical constraints when selecting an appropriate topology for emergency or dynamic scenarios. The Ring topology improves resilience relative to the Bus topology by providing an alternative path in the event of a link interruption. However, this resilience interpretation is limited to static topology redundancy. A more complete resilience and fault-tolerance evaluation would require dynamic modeling of node failures and their impact on end-to-end latency, temporary blockage, adverse weather, and adaptive rerouting/recovery mechanisms, which are beyond the scope of this work.
Then, for an overall latency analysis given the initial installation, the topology is modeled as a directed graph G ( V , E ) , where V represents the set of UAV nodes including the OLT and optical network units, and E represents the FSO links. The primary goal is to calculate the end-to-end (E2E) latency by combining the physical characteristics of the XGS-PON standard [20] with the multi-hop nature of the UAV network. Specifically, the total latency for a packet traveling from a source node s to a destination node d is defined as the sum of all delay components at each hop along the path. Letting P ( s , d ) denote the set of links between s and d , the resulting E2E latency T E 2 E is expressed as:
T E 2 E = ( u , v ) P ( s , d ) ( T p r o p ( u , v ) + T t r a n s + T p r o c ( v ) + T q u e u e ( v ) + T D B A )
where P ( s , d ) denotes the set of links in the path from source s to destination d , with ( u , v ) representing the optical link connecting node u to node v . The terms T p r o p , T t r a n s , T p r o c ( v ) , T q u e u e ( v ) , and T D B A represent the propagation, transmission, nodal processing, queuing, and dynamic bandwidth allocation (DBA) delays, respectively.
The propagation delay T p r o p is the time required for the optical signal to travel through the air. Since the system uses FSO links between UAVs, this delay is determined by the speed of light in the atmosphere. By letting d ( u , v ) denote the distance between two connected UAVs, u and v . The propagation delay is then calculated as:
T p r o p ( u , v ) = d ( u , v ) c / n a i r
where c 3 × 10 8   m / s is the speed of light in a vacuum, and n a i r 1.0003   is the refractive index of air. While this delay is often negligible in short-range ground networks, it becomes significant in aerial systems covering large areas. In a network spanning several kilometers, the accumulation of delays over multiple hops can impact the strict timing requirements.
The transmission delay T t r a n s   is determined by the connection speed and the packet size. This study uses the Ethernet standard [21], which works seamlessly with XGS-PON. The total packet length L p k t   is the sum of the data payload, the media access control (MAC) header, and the frame check sequence (FCS), calculated as:
L p k t = L p a y l o a d + L M A C + L F C S
By applying standard values of 1500 bytes for the payload, 14 bytes for the header, and 4 bytes for the FCS, the total packet size becomes 1518 bytes. Given the XGS-PON symmetric line rate R l i n e of 10 Gb/s, the transmission delay is calculated as:
T t r a n s = L p k t   ×   8 R l i n e
Since this delay remains constant for every link, the total number of hops becomes the primary factor that determines the overall transmission latency.
At every node, the signal undergoes optical-to-electrical conversion, electronic processing, and electrical-to-optical reconversion. In this work, the corresponding nodal processing delay T p r o c is modeled as a fixed value of 2.3 ms for comparative network-level latency evaluation. This value is adopted as a reference processing-budget assumption informed by prior XGS-PON front-haul literature reporting a 2.3 ms processing window in an LTE/XGS-PON system context [22]. It is therefore used here to provide a consistent baseline for topology comparison, rather than to represent a universal per-hop hardware constant specified by ITU-T G.9807.1. The proposed latency model can be directly updated for other implementations by substituting the corresponding device-specific T p r o c value. To account for variable traffic patterns, each node is modeled as an M/M/1 queuing system. This means the queuing delay ( T q u e u e ) depends on the traffic load, which is described by the utilization factor ( ρ ) as follows:
ρ = λ R l i n e  
where λ denotes the incoming traffic arrival rate in bits per second. As ρ approaches unity, the queuing delay increases nonlinearly, indicating congestion effects. The expected queuing delay is therefore expressed as
T q u e u e = ρ 2 1 ρ × T t r a n s
Finally, for upstream transmission in time-division multiplexed (TDM) PON architectures, the system incurs additional latency due to DBA. In this study, a status-reporting DBA (SR-DBA) scheme is assumed, which introduces a fixed scheduling delay. The DBA delay T D B A is set to 500 μ s, reflecting the typical polling cycle duration observed in standard XGS-PON implementations.
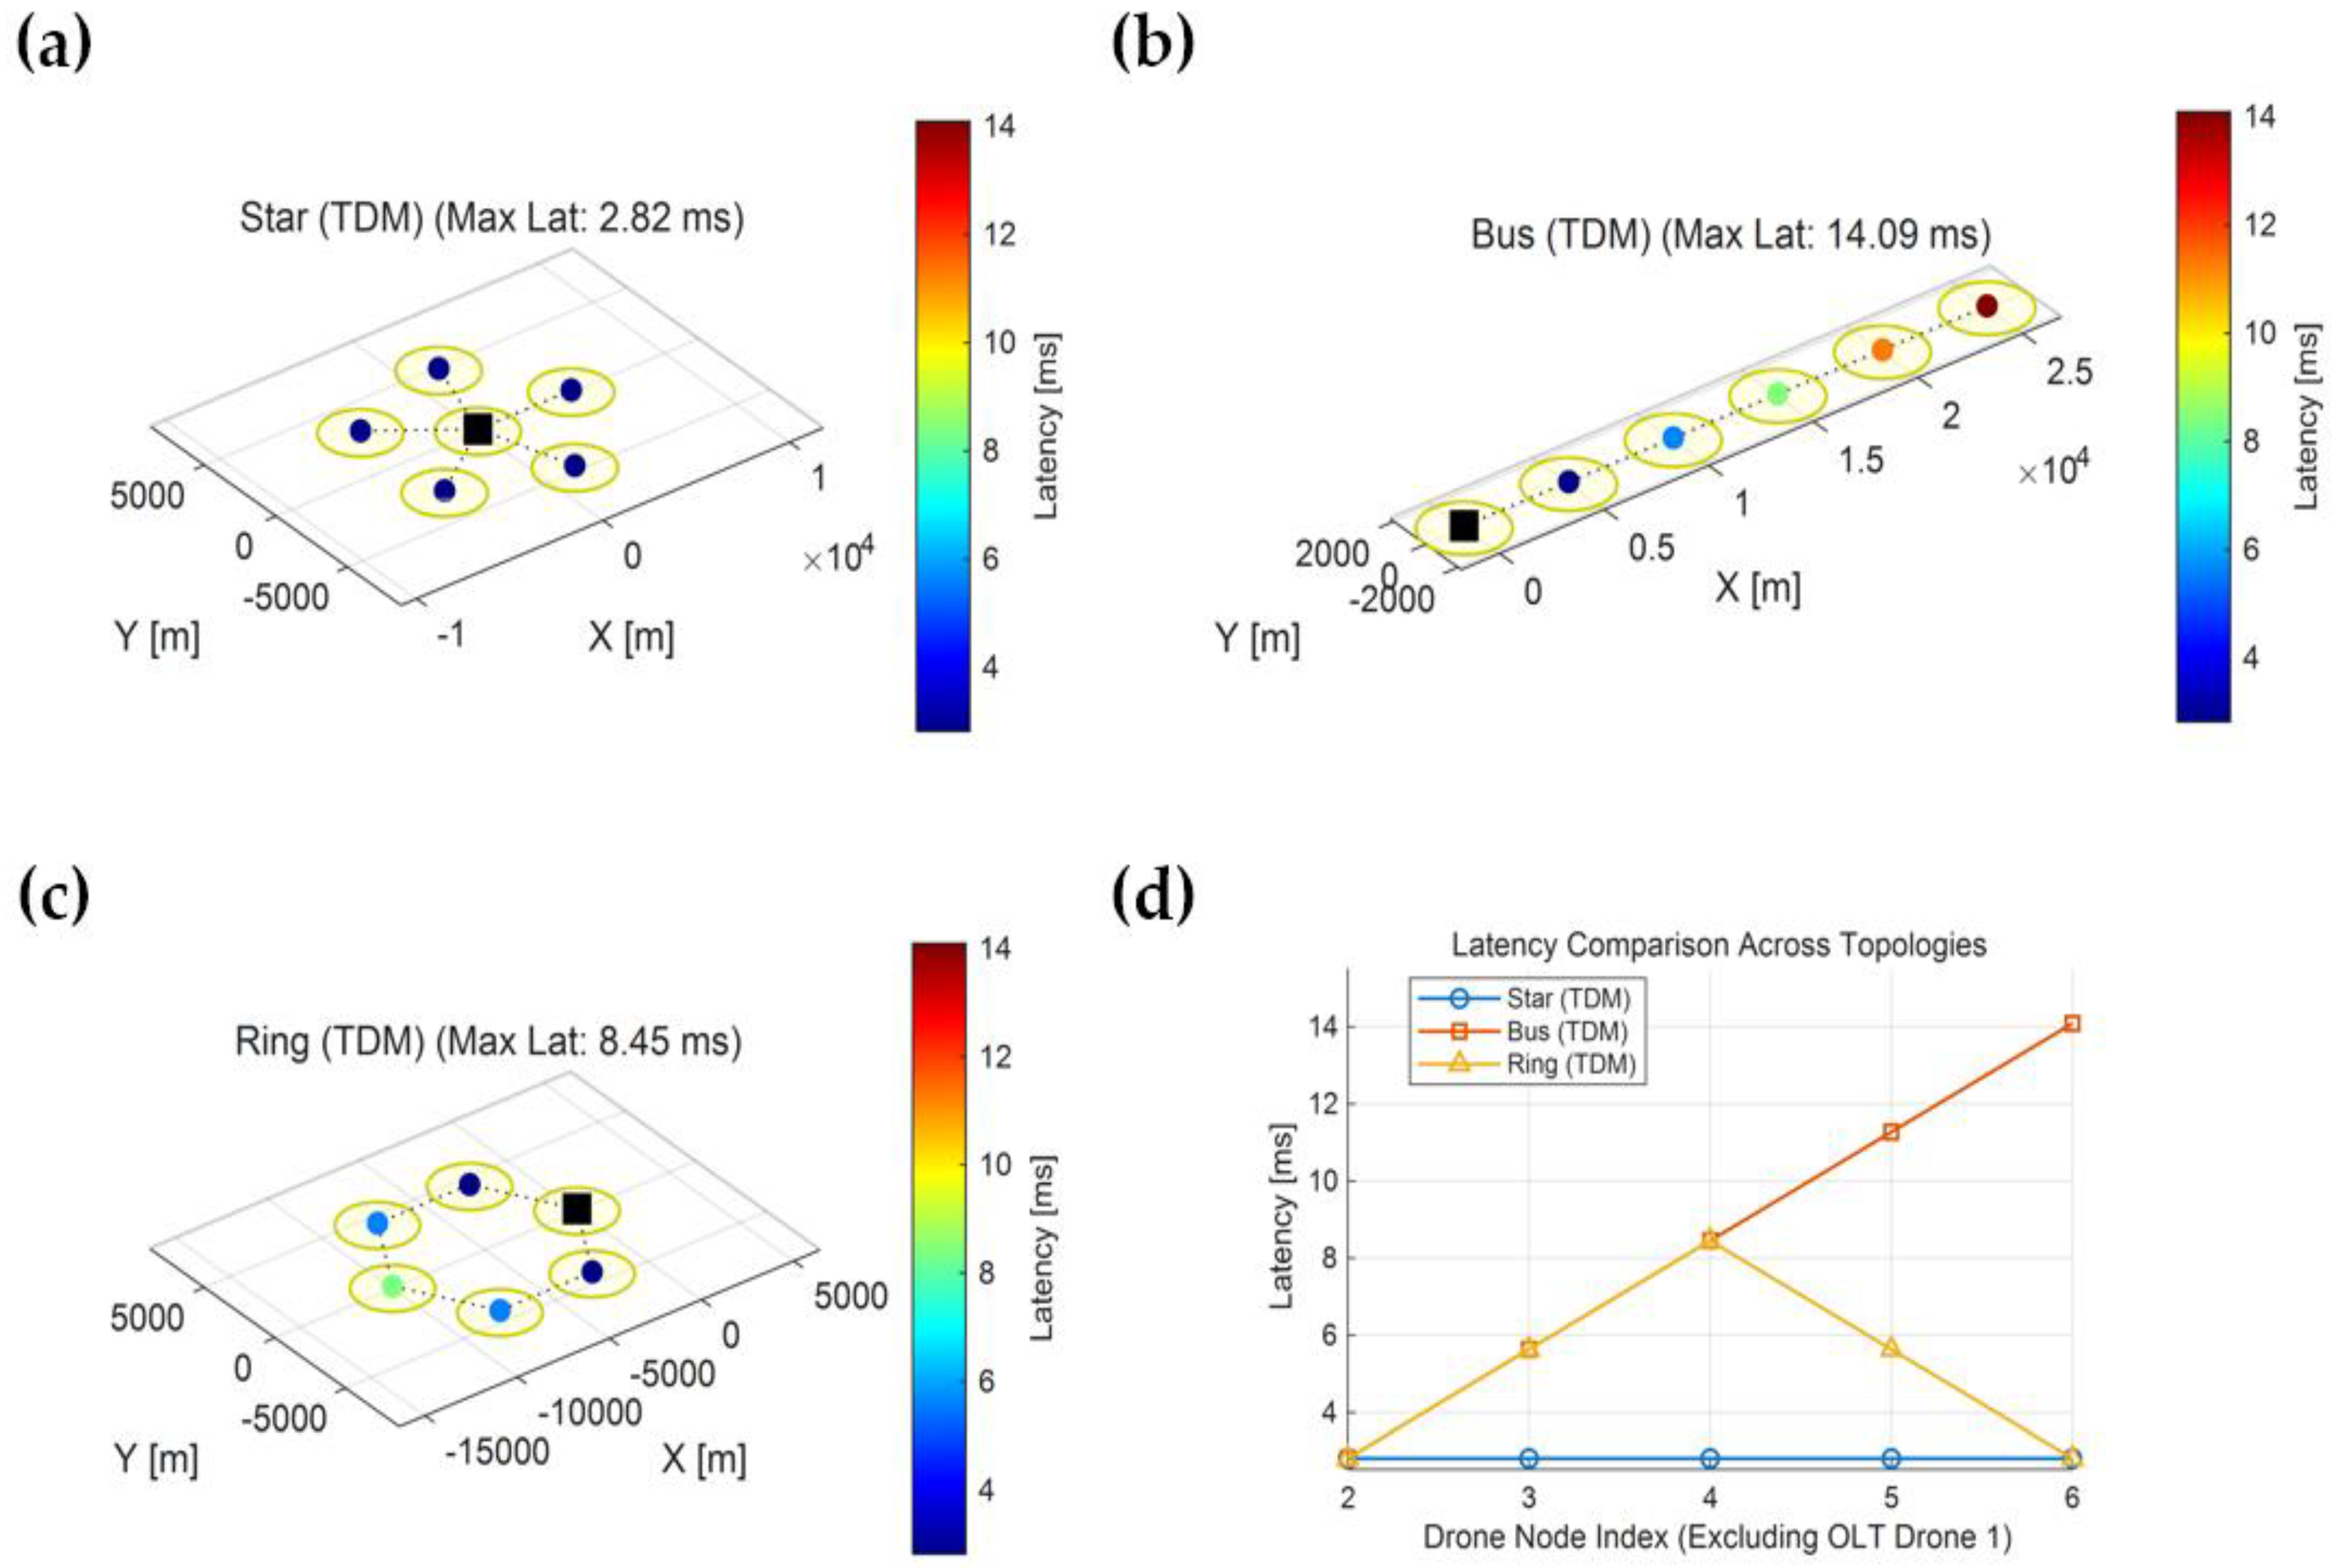
Figure 5 shows the end-to-end latency distribution across nodes in the three multi-hop topologies. As illustrated in Figure 5a,d, the star topology exhibits the lowest and most uniform performance, maintaining a constant latency of approximately 2.82 ms across all nodes because every UAV connects directly to the OLT via a single hop. In contrast, the bus topology (Figure 5b) demonstrates a linear increase in delay as the distance from the source grows, reaching a maximum latency of 14.09 ms at the furthest node due to the accumulation of processing and queuing delays at each intermediate relay. The ring topology (Figure 5c) offers a balanced compromise with a maximum latency of 8.45 ms. Its latency profile peaks at the middle node (Node 4) and decreases for subsequent nodes, effectively utilizing the closed-loop structure to reduce the maximum hop count compared to the linear bus configuration.

3.3. Performance Analysis: Ground-to-Air-to-Ground (G2A2G) Mode

In the G2A2G operational mode, the network functions as a reconfigurable optical bridge, designed to extend existing ground fiber networks to specific points of need. Unlike the ABS mode, which focuses on broadcasting signals over a broad area, the main purpose of the G2A2G architecture is its ability to establish high-bandwidth connections at on-demand specific locations. These locations, whether they are temporary emergency shelters or urban areas where underground fiber is inaccessible, are modeled as randomly distributed demand points. Consequently, the performance evaluation focuses more on the probability of service availability and the responsiveness of deployment.
To evaluate the network’s spatial reach, a geometric probability model is employed. Specifically, the concept of the statistical effective service radius ( R e f f ) is introduced. This metric reflects the blockage-limited serviceability of the G2A2G architecture, where coverage is determined primarily by whether a physical line-of-sight (LoS) path exists, rather than by detailed link-quality metrics such as SNR or SINR. Considering the ITU-R P.1410 propagation model, the probability of having a clear line of sight, P L O S , at a radial distance r , is determined by the statistical distribution of building heights in the environment. This abstraction is mainly adopted to reveal the first-order architectural feasibility and spatial scaling behavior of the proposed framework in a tractable manner. Therefore, detailed FSO channel impairments such as atmospheric turbulence, weather-induced attenuation, background-light noise, and pointing-acquisition-tracking (PAT) errors under UAV motion are not explicitly incorporated in the present model and are left for future investigation.
P L O S ( r , h R x ) = e x p ( β · r · m a x ( 0,1 h R x h a v g ) )
where β represents the building density parameter, h a v g is the average building height, and h R x denotes the receiver altitude. Unlike RF networks, the effective coverage area A c o v of an optical node is derived by integrating this LoS probability over the optical power budget limit d m a x :
A c o v ( h R x ) =   0 d m a x P L O S ( r , h R x ) · 2 π r   d r  
Consequently, the effective service radius is defined as the equivalent disk radius, given by R e f f   =   A c o v / π . This metric establishes a direct link between the physical deployment altitude and the network capacity.
To quantify the macroscopic performances, the locations of accessible fiber access points (here, GTUs) are used as a spatial Poisson point process (PPP), ϕ G , with intensity λ G . Using the Boolean model of stochastic geometry, the probability P c o v that a randomly located user x falls within the service footprint of at least one active GTU is given by:
P c o v = 1 e x p ( λ G · A c o v ( h R x ) )
For a terrestrial baseline, where h R x   h a v g , the decay coefficient is maximized, resulting in a microscopic effective radius ( R e f f   120   m ) , while the proposed aerial G2A2G architecture elevates the height to a node altitude ( h o p t ) higher than   h a v g , effectively nullifying the blockage decay coefficient. In this regime, the effective radius is limited only by the FSO range ( R e f f d m a x 1000   m ). It is then possible to define a dimensioning optimization problem to determine the minimum number of tethered GTUs ( N r e q ) required to guarantee a target service probability P t a r g e t (e.g., 99%) within a macrocell of area A c e l l . Solving for the required density shows:
N r e q l n ( 1 P t a r g e t ) · A c e l l π ( R e f f ) 2
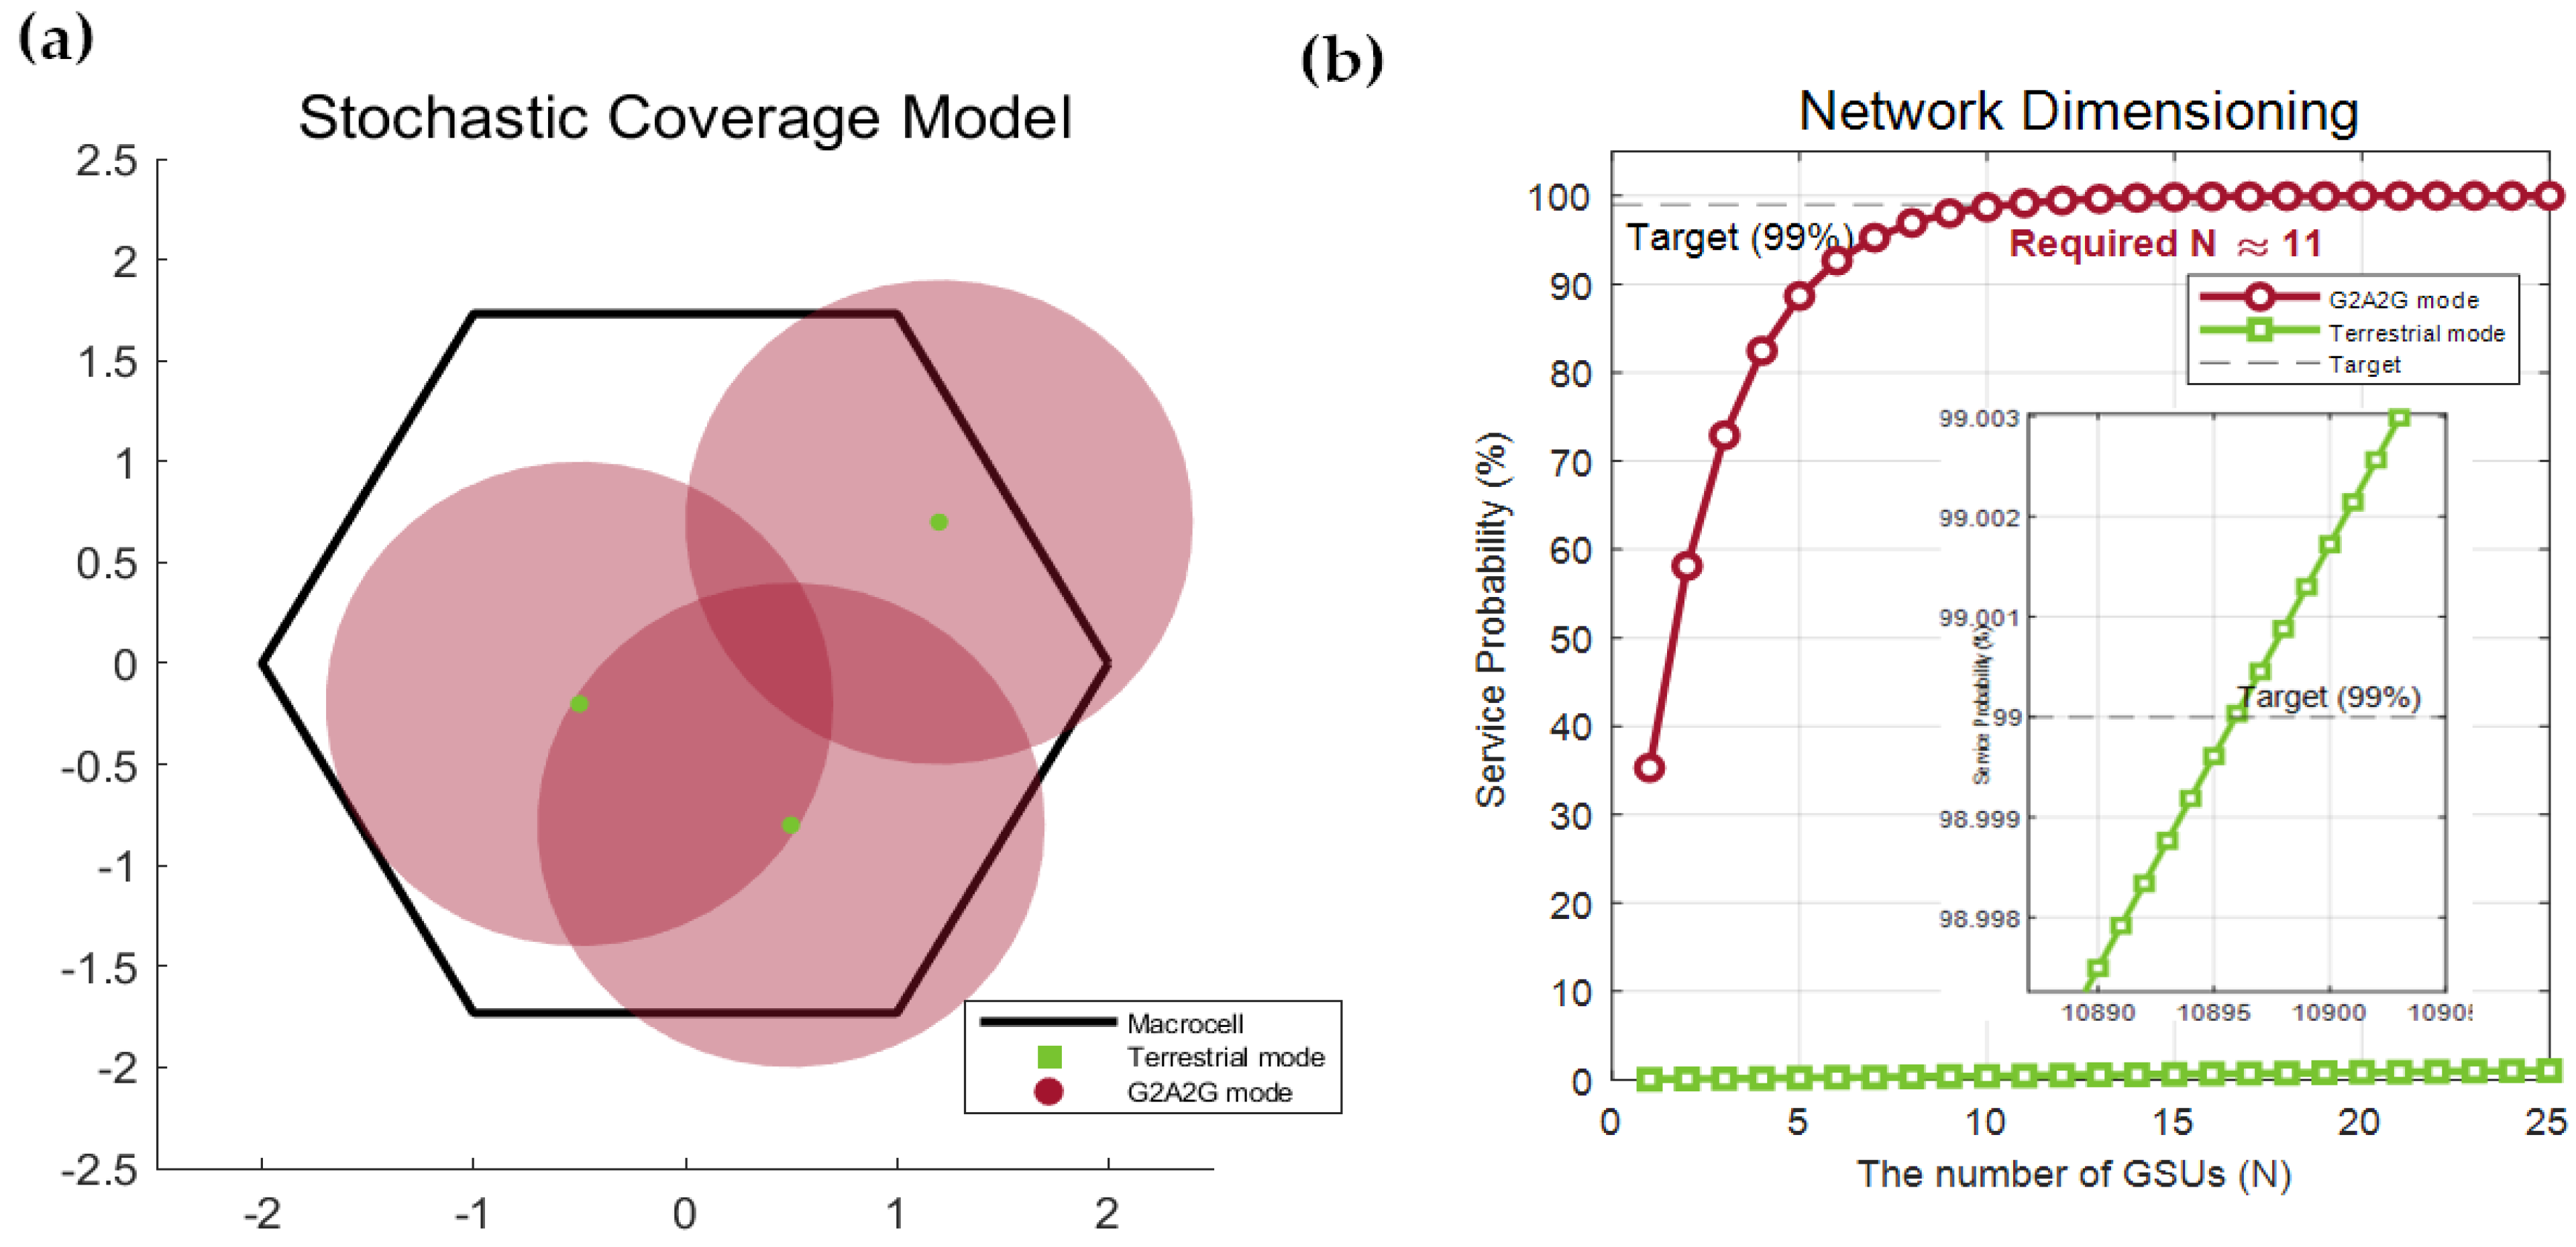
Figure 6 presents the stochastic performance evaluation of the proposed G2A2G architecture compared to the terrestrial baseline. Figure 6a shows the spatial coverage within a standardized macrocell. The terrestrial nodes exhibit fragmented, island-like footprints due to high building blockage, whereas the aerial nodes (red circles) achieve broad, continuous coverage regions enabled by the improved LoS probabilities. Figure 6b quantifies the network dimensioning efficiency, plotting the aggregate service probability as a function of the number of GTUs. The simulation results show that the G2A2G mode rapidly converges to the 99% target service probability with a minimal deployment of approximately 11 nodes, while the terrestrial mode remains ineffective even with high node density.

4. Feasibility Study of Fiber-Tethered UAV-to-UAV Link

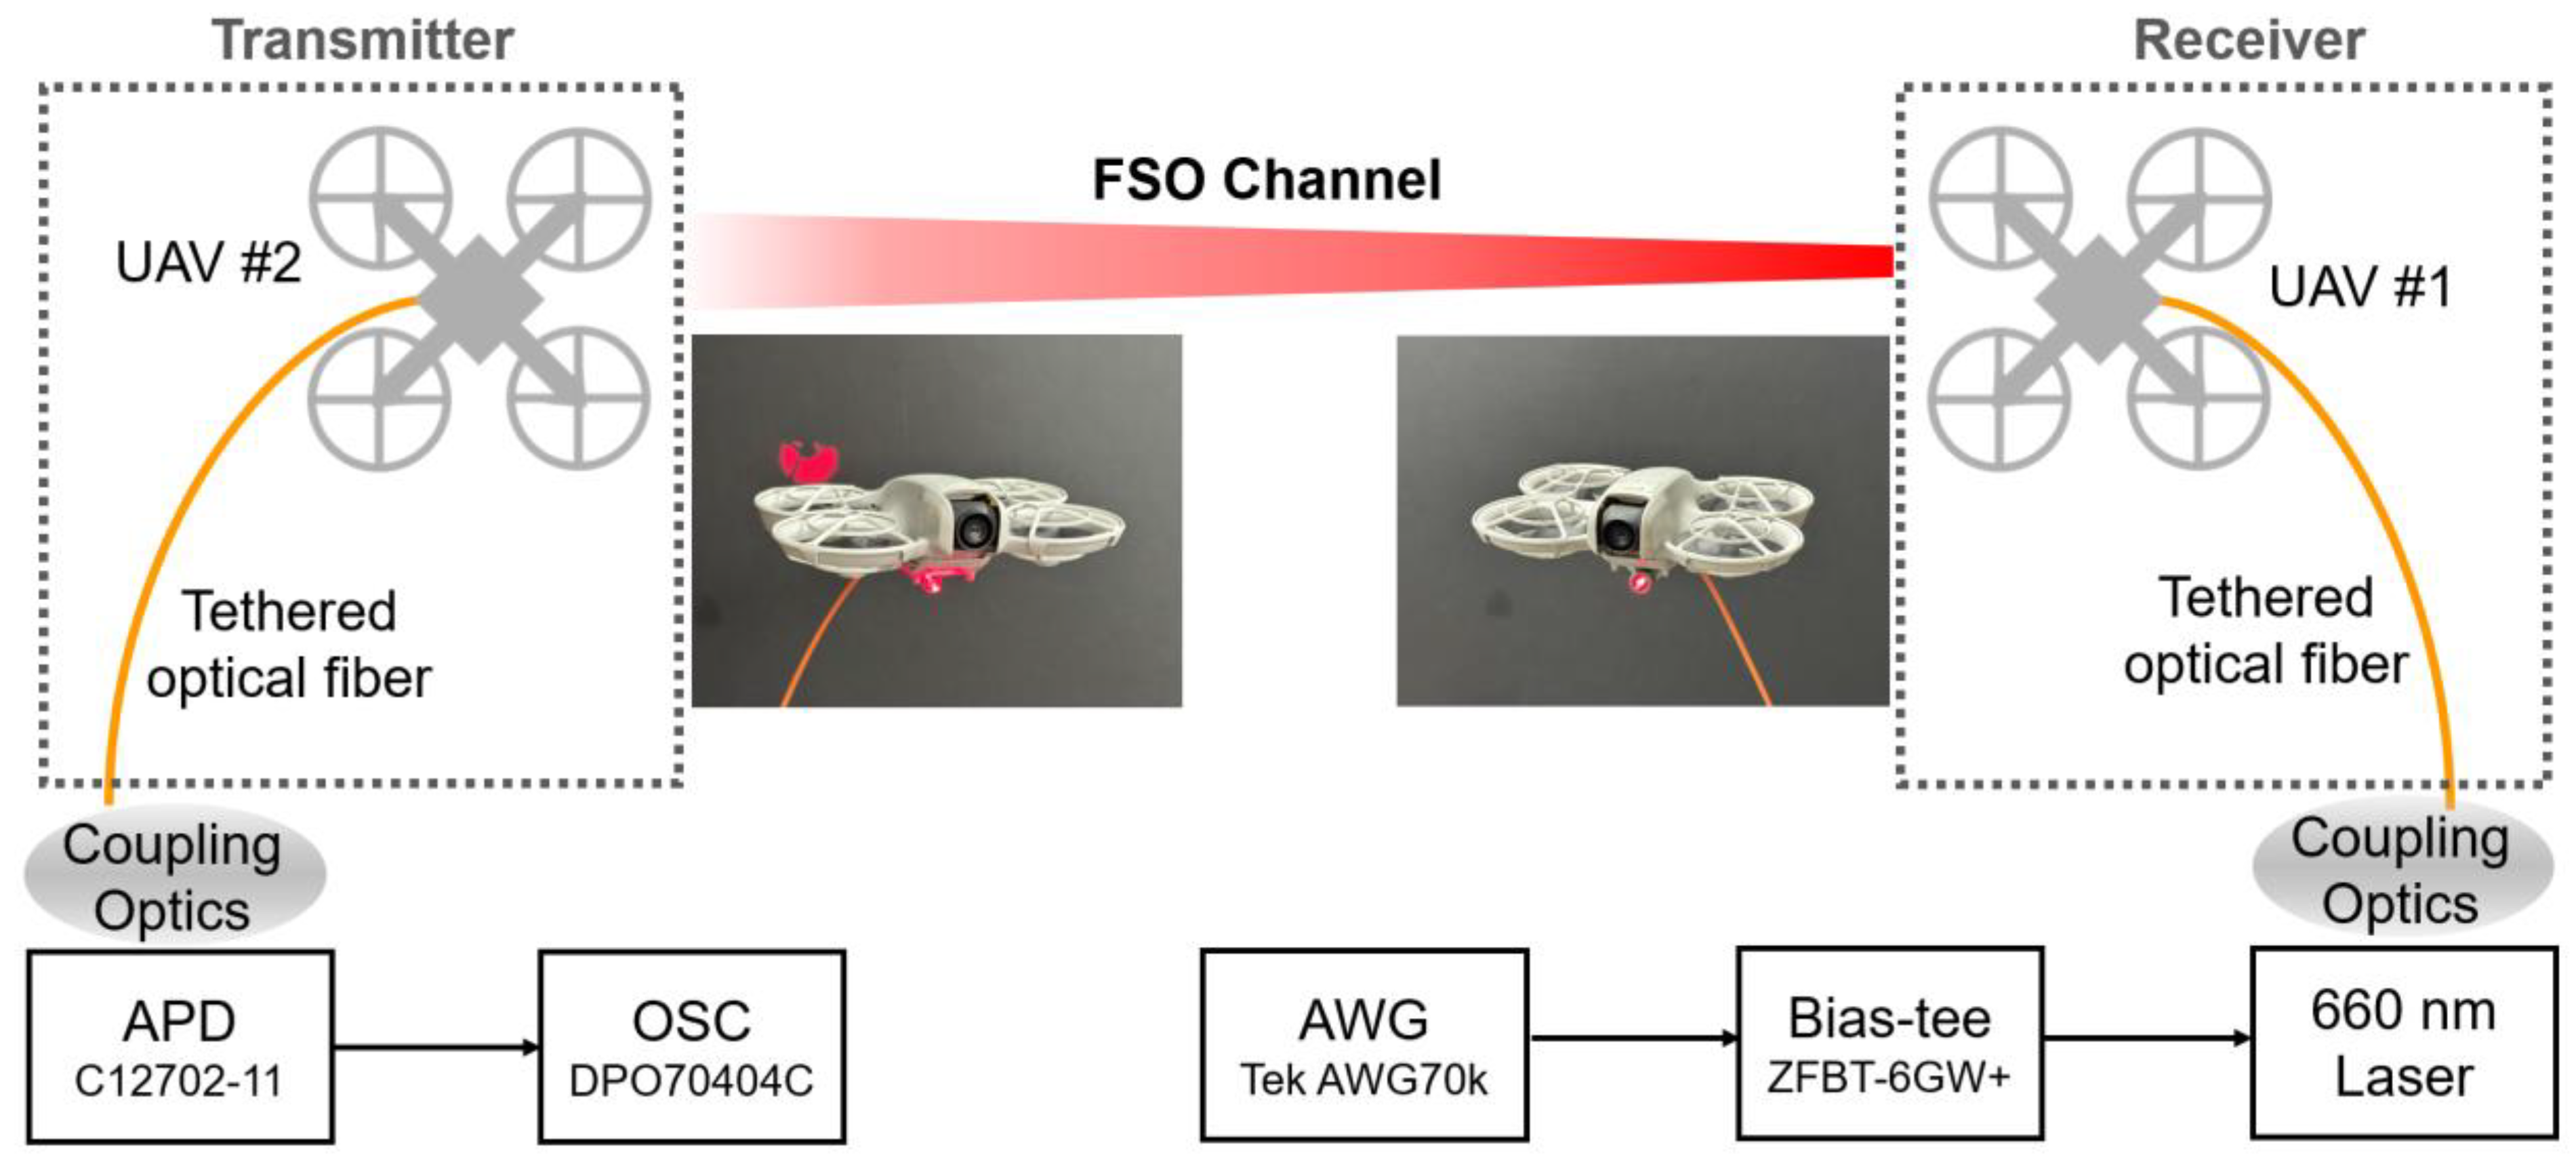
To validate the feasibility of the systems and scenarios proposed in this work, a lab-scale indoor proof-of-concept (PoC) demonstration is conducted. In this experiment, the two UAV platforms are operated in hovering flight during the measurement. The purpose of this setup is to evaluate the basic end-to-end electro-optical communication feasibility of the tethered UAV-to-UAV FSO link under controlled conditions with offline digital signal processing (DSP) and bit error rate (BER) evaluation, rather than to assess flight-dynamic or outdoor propagation effects. Figure 7 shows a schematic of the experimental setup, which is divided into a transmitter and a receiver part.
The transmitter consists of UAV #1 equipped with a collimator tethered by an optical fiber delivering a 660 n m light from a laser diode. An arbitrary waveform generator (AWG) with a bias-T is used to generate a directly modulated communication signal. An on-off keying (OOK) modulated signal is generated by a computer and converted into a voltage signal by the AWG. This signal then passes through the bias-T, where a 3 V direct current (DC) bias is applied to increase its DC level. The final electrical signal drives the laser, which converts it into an optical signal. This optical signal is transmitted through the optical fiber tethered to UAV #1, and a collimator attached to the fiber end adjusts the beam divergence for free-space transmission.
The receiver part includes UAV #2, a tethered fiber with coupling optics, an avalanche photodiode (APD), and an oscilloscope (OSC). Both UAV #1 and UAV #2 used in the experiment are off-the-shelf models (DJI Neo). The signal modulated on the light propagated through the FSO channel is received by the optical fiber. It is then focused onto the APD via a focusing lens. The APD converts the received optical signal back into an electrical signal, which is captured by the oscilloscope and sent to the computer for digital signal processing (DSP) for the communication performance analysis.
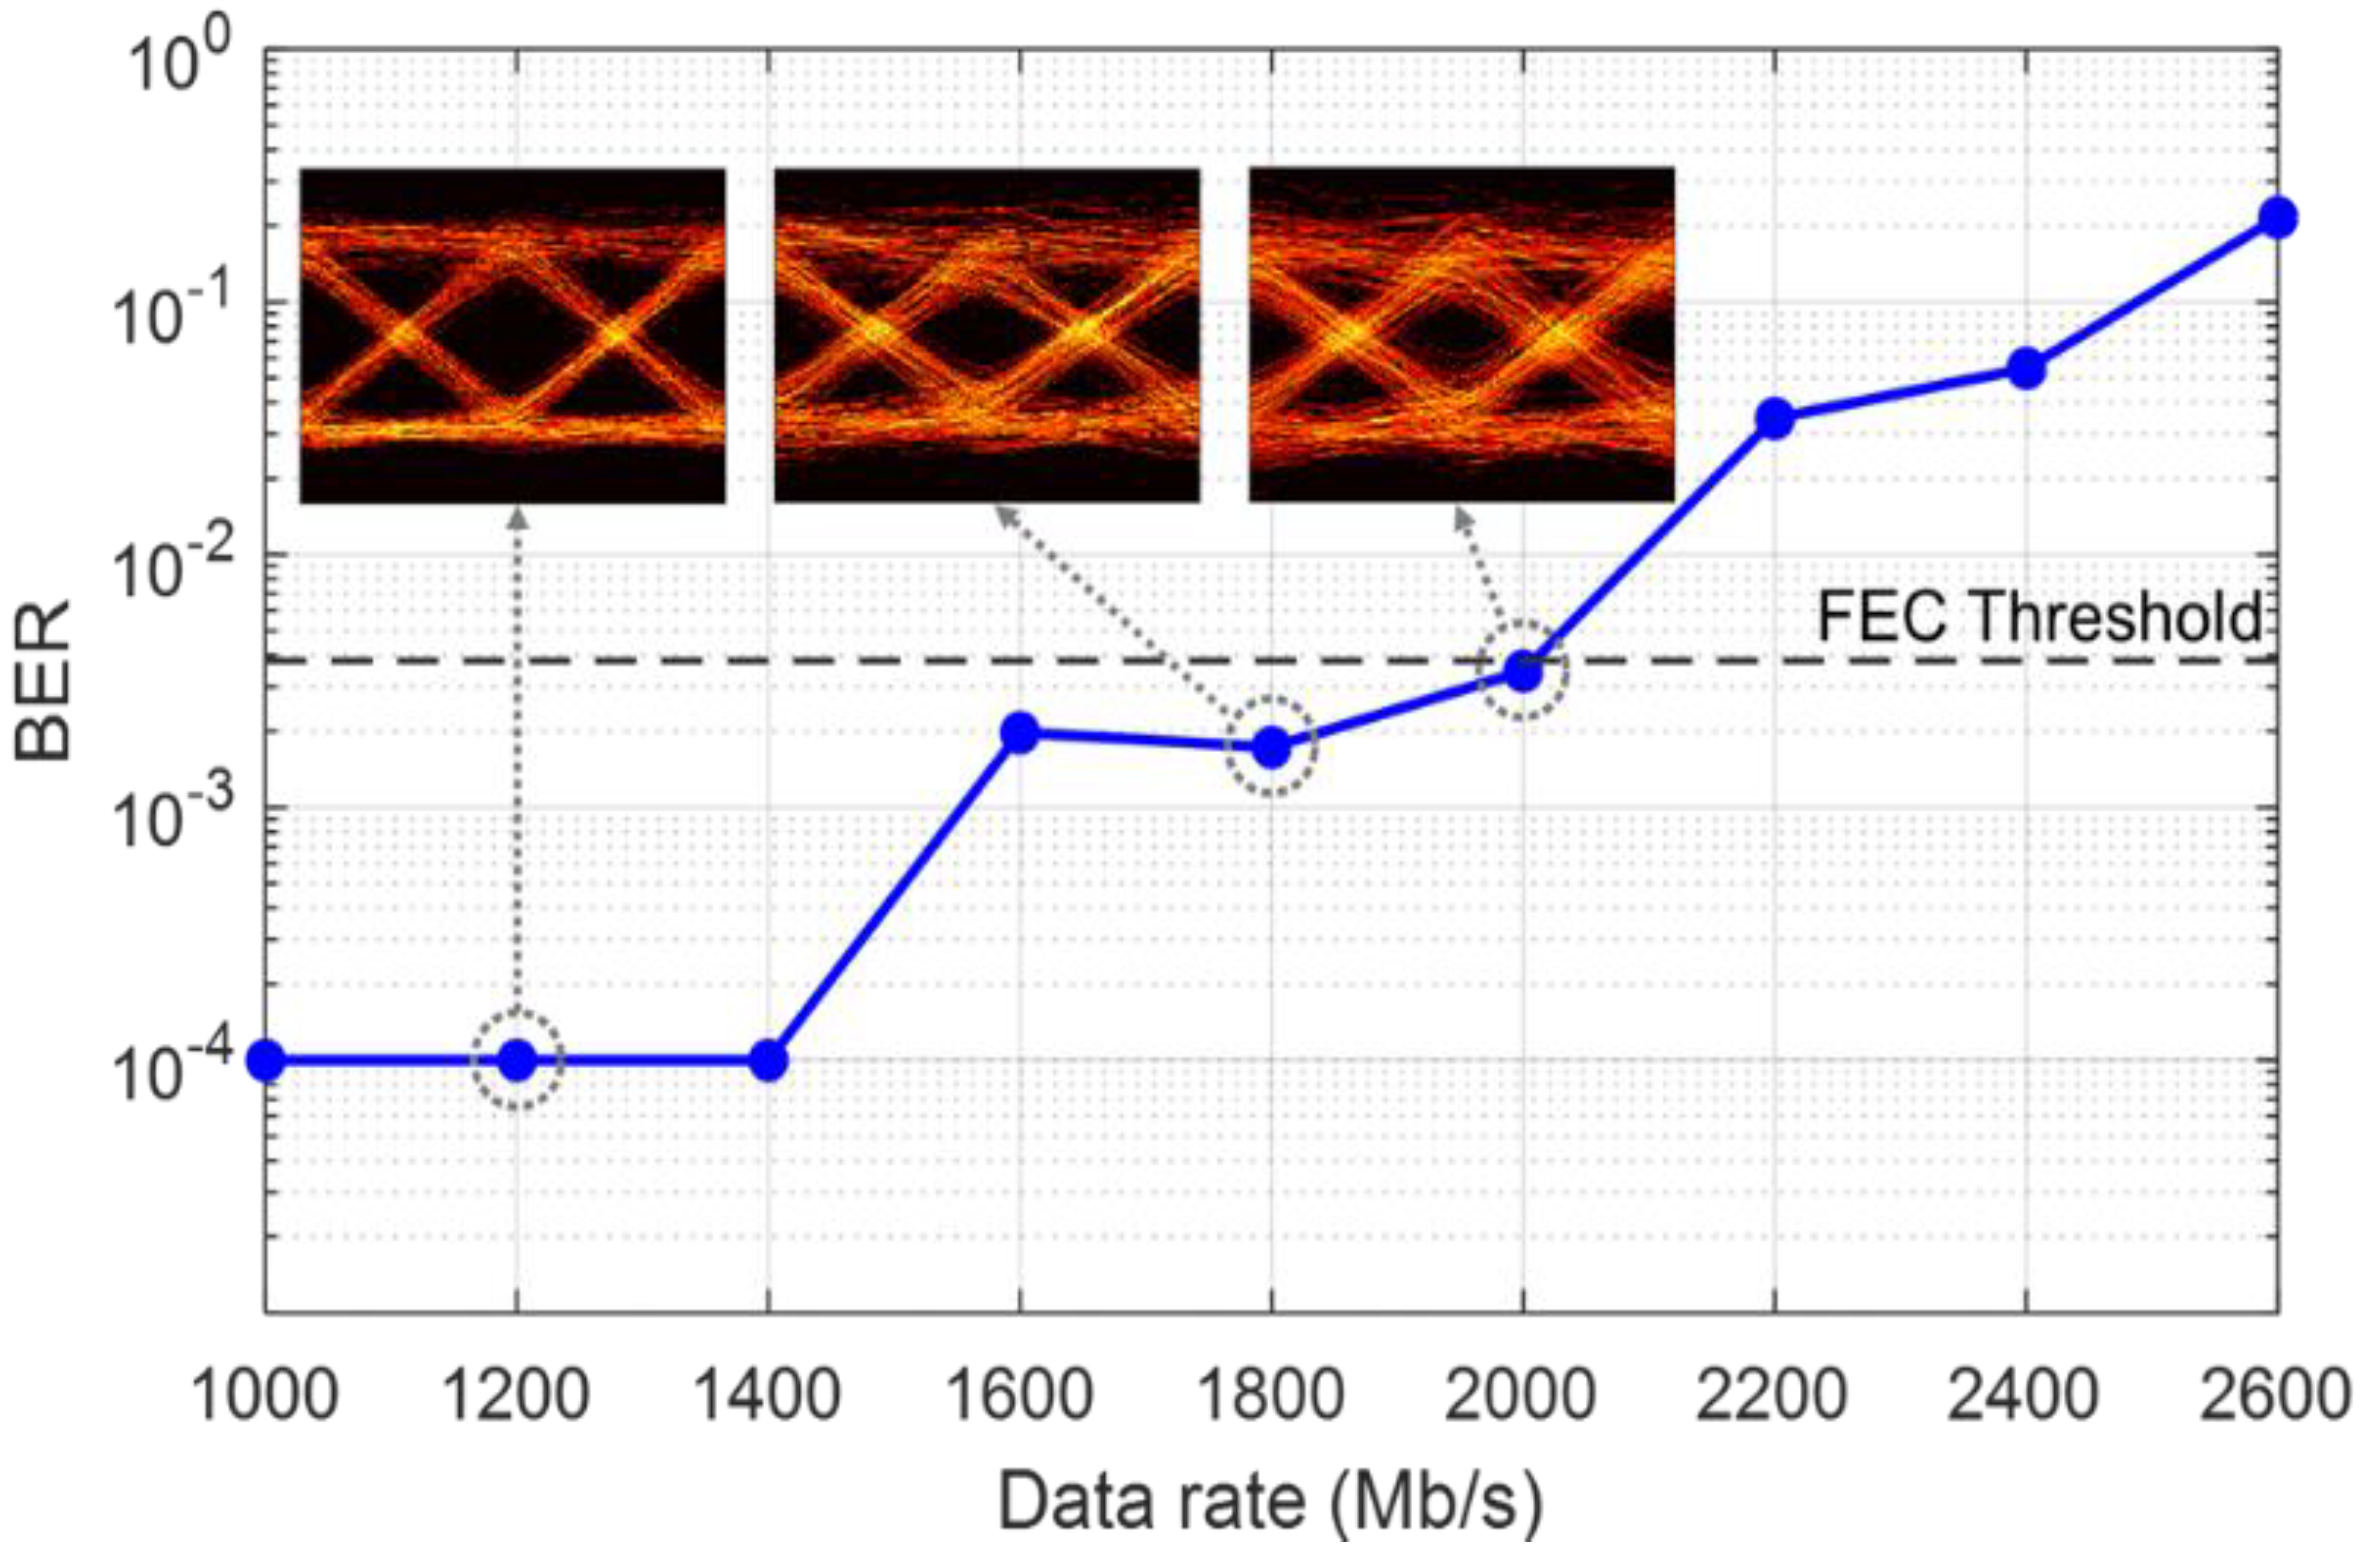
Figure 8 illustrates the BER performance as a function of data rate, with selected eye diagrams. For data rates of 1000, 1200, and 1400 Mb/s, a BER of 0 is measured but shown as 10 4 , which corresponds to the BER floor of the applied experimental setup. As the data rate increases, the BER shows an upward trend. To improve the clarity of the experimental description, Table 2 summarizes the main setup parameters and testing conditions of the indoor proof-of-concept demonstration. The experimental results demonstrate that the proposed system can achieve reliable communication performance up to 2 Gb/s, maintaining the BER under the forward error correction (FEC) threshold of 3.8 × 10 3 , although the eye diagram is slightly degraded compared to the case at 1200 Mb/s. Despite the limited lab-scale demonstration, the experimental PoC presented here supports the basic end-to-end feasibility of using fiber-tethered UAVs for the proposed system concept. The inter-UAV free-space link distance in the indoor experiment is 2 m, and the setup is intentionally designed as a controlled first-step validation of the core electro-optical modulation, transmission, and tether-coupled system integration mechanisms. The 660 nm laser source is selected primarily for laboratory-scale feasibility verification, including compatibility with the available directly modulated source/receiver chain and practical alignment and observation convenience in a short-range indoor environment. Accordingly, this wavelength choice should not be interpreted as an optimized design choice for outdoor scalable FSO deployment. A field-realistic aerial FSO system would require separate consideration of wavelength-dependent link budget, beam divergence, atmospheric attenuation, eye-safety constraints, and PAT robustness.

5. Conclusions and Future Work

A flexible AA-PON architecture enabled by fiber-tethered UAVs was investigated under two operational modes: an ABS mode for wide-area service and a G2A2G mode for targeted gigabit-class optical bridging to critical locations. In the ABS mode, the bus configuration maximized spatial reach and achieved the lowest outage of 9.3% in the representative N = 6 study but caused the largest time-to-first-service due to the extended deployment radius. The star topology enabled the fastest initial deployment but showed the highest outage, while the ring topology showed an intermediate reach and path redundancy. In the G2A2G mode, a stochastic-geometry analysis showed that elevating optical nodes substantially improves service availability relative to terrestrial baselines by mitigating blockage-limited footprints, effectively reducing the infrastructure density required to meet the service targets. Finally, a proof-of-concept 2 Gb/s FSO link between two fiber-tethered UAVs validated the end-to-end optical feasibility of the proposed aerial relaying concept, supporting the feasibility of the proposed architectures.
Future work should extend the present framework toward field-realistic validation, deployment-aware modeling, and tighter system-level integration. First, outdoor experiments at longer link distances should be conducted to quantify the impact of turbulence, weather attenuation, background light, and pointing-acquisition-tracking (PAT) dynamics on both inter-UAV FSO backhaul and tether-delivered access. These factors are essential for evaluating alignment robustness and practical service continuity under UAV hover instability and environmental fluctuations. Second, the analytical framework should be extended to jointly incorporate such physical-layer effects with time-varying demand, node failures, adaptive topology control, tether-management constraints, flight-corridor/regulatory limitations, UAV positioning and stabilization accuracy, and multi-UAV coordination mechanisms, thereby enabling a more comprehensive evaluation of coverage, latency, and robustness under realistic deployment conditions. Third, tighter coupling with standardized PON mechanisms (for example, dynamic bandwidth allocation behavior under bursty loads) and practical endpoint design (portable terminals supporting secure wired/wireless breakout) should be essential for deployment-ready prototypes. Also, extensions of the proposed AA-PON may also consider integrating UAV-mounted intelligent metasurface or hybrid optical-electronic processing capabilities to enhance aerial sensing, beam control, and adaptive communication functions [23,24].

Author Contributions

Conceptualization, J.-Y.L., B.L., K.J., H.K. and H.C.; Methodology, H.C.; Software, J.S.H. and S.R.; Validation, J.-Y.L.; Formal analysis, G.S.; Investigation, J.-Y.L., J.S.H. and G.S.; Writing—original draft, J.-Y.L. and G.S.; Writing—review and editing, B.L., K.J., H.K., S.R. and H.C.; Visualization, J.-Y.L. and G.S.; Supervision, H.C.; Project administration, H.C. All authors have read and agreed to the published version of the manuscript.

Funding

This work was supported by Research Project Support Program for Excellence Institute 2022-0377 (2022) in Incheon National University.

Data Availability Statement

The original contributions presented in this study are included in the article. Further inquiries can be directed to the corresponding authors.

Conflicts of Interest

The authors declare no conflicts of interest.

References

  1. Chowdhury, M.Z.; Shahjalal, M.; Ahmed, S.; Jang, Y.M. 6G Wireless Communication Systems: Applications, Requirements, Technologies, Challenges, and Research Directions. IEEE Open J. Commun. Soc. 2020, 1, 957–975. [Google Scholar] [CrossRef]
  2. Tariq, F.; Khandaker, M.R.A.; Wong, K.-K.; Imran, M.A.; Bennis, M.; Debbah, M. A Speculative Study on 6G. IEEE Wirel. Commun. 2020, 27, 118–125. [Google Scholar] [CrossRef]
  3. Akbar, M.S.; Hussain, Z.; Ikram, M.; Sheng, Q.Z.; Mukhopadhyay, S.C. On challenges of sixth-generation (6G) wireless networks: A comprehensive survey of requirements, applications, and security issues. J. Netw. Comput. Appl. 2025, 233, 104040. [Google Scholar] [CrossRef]
  4. Rinaldi, F.; Maattanen, H.L.; Torsner, J.; Pizzi, S.; Andreev, S.; Iera, A.; Koucheryavy, Y.; Hoymann, C. Non-Terrestrial Networks in 5G & Beyond: A Survey. IEEE Access 2020, 8, 165178–165200. [Google Scholar] [CrossRef]
  5. Giordani, M.; Zorzi, M. Non-Terrestrial Networks in the 6G Era: Challenges and Opportunities. IEEE Netw. 2021, 35, 244–251. [Google Scholar] [CrossRef]
  6. Azari, M.M.; Solanki, S.; Chatzinotas, S.; Kodheli, O.; Mevrel, H.; Sharma, S.K. Evolution of Non-Terrestrial Networks from 5G to 6G: A Survey. IEEE Commun. Surv. Tutor. 2022, 24, 2633–2672. [Google Scholar] [CrossRef]
  7. López-Villegas, I.; Martínez-Ríos, E.A.; Izquierdo-Reyes, J.; Bustamante-Bello, R.; Falcone, F. A Systematic Literature Review of Emergency Communications Assisted by Unnamed Aerial Vehicles. Ad Hoc Netw. 2025, 182, 104063. [Google Scholar] [CrossRef]
  8. Zeng, Y.; Wu, Q.; Zhang, R. Accessing from the Sky: A Tutorial on UAV Communications for 5G and Beyond. Proc. IEEE 2019, 107, 2327–2375. [Google Scholar] [CrossRef]
  9. Silva, F.A.; Fe, I.; Brito, C.; Araujo, G.; Feitosa, L.; Nguyen, T.A.; Jeon, K.; Lee, J.W.; Min, D.; Choi, E. Aerial Computing: Enhancing Mobile Cloud Computing with Unmanned Aerial Vehicles as Data Bridges—A Markov Chain based Dependability Quantification. ICT Express 2024, 10, 406–411. [Google Scholar] [CrossRef]
  10. Wang, F.; Zhang, S.; Yang, H.; Quek, T.Q.S. Non-Terrestrial Networking for 6G: Evolution, Opportunities, and Future Directions. Engineering 2025, 54, 56–68. [Google Scholar] [CrossRef]
  11. Zeng, Y.; Zhang, R.; Lim, T.J. Wireless communications with unmanned aerial vehicles: Opportunities and challenges. IEEE Commun. Mag. 2016, 54, 36–42. [Google Scholar] [CrossRef]
  12. Alsaedi, W.K.; Ahmadi, H.; Khan, Z.; Grace, D. Spectrum Options and Allocations for 6G: A Regulatory and Standardization Review. IEEE Open J. Commun. Soc. 2023, 4, 1787–1812. [Google Scholar] [CrossRef]
  13. Khalighi, M.A.; Uysal, M. Survey on Free Space Optical Communication: A Communication Theory Perspective. IEEE Commun. Surv. Tutor. 2014, 16, 2231–2258. [Google Scholar] [CrossRef]
  14. Alzenad, M.; Shakir, M.Z.; Yanikomeroglu, H.; Alouini, M.-S. FSO-Based Vertical Backhaul/Fronthaul Framework for 5G+ Wireless Networks. IEEE Commun. Mag. 2018, 56, 218–224. [Google Scholar] [CrossRef]
  15. Zeng, Y.; Zhang, R. Energy-Efficient UAV Communication with Trajectory Optimization. IEEE Trans. Wirel. Commun. 2016, 16, 3747–3760. [Google Scholar] [CrossRef]
  16. Fujii, K.; Higuchi, K.; Rekimoto, J. Endless Flyer: A Continuous Flying Drone with Automatic Battery Replacement. In Proceedings of the IEEE 10th International Conference on Ubiquitous Intelligence and Computing (UIC-ATC), Vietri sul Mare, Italy, 18–21 December 2013. [Google Scholar]
  17. Rodriguez, V.; Tipantuña, C.; Reinoso, D.; Carvajal-Rodriguez, J.; Egas Acosta, C.; Proaño, P.; Hesselbach, X. An Experimental Tethered UAV-Based Communication System with Continuous Power Supply. Future Internet 2025, 17, 273. [Google Scholar] [CrossRef]
  18. Shindo, N.; Kobatake, T.; Masson, D.; Fafard, S.; Matsuura, M. Optically Powered and Controlled Drones Using Optical Fibers for Airborne Base Stations. Photonics 2022, 9, 882. [Google Scholar] [CrossRef]
  19. Ahmadi, K.; Serdijn, W.A. Advancements in Laser and LED-Based Optical Wireless Power Transfer for IoT Applications: A Comprehensive Review. IEEE Internet Things J. 2025, 12, 18887–18907. [Google Scholar] [CrossRef]
  20. G.9807.1; 10-Gigabit-Capable Symmetric Passive Optical Network (XGS-PON). International Telecommunication Union: Geneva, Switzerland, 2016.
  21. IEEE Std 802.3-2022; Revision of IEEE Std 802.3-2018. IEEE: New York, NY, USA, 2022; pp. 1–7025.
  22. Mikaeil, A.M.; Hu, W.; Hussain, S.B.; Sultan, A. Traffic-Estimation-Based Low-Latency XGS-PON Mobile Front-Haul for Small-Cell C-RAN Based on an Adaptive Learning Neural Network. Appl. Sci. 2018, 8, 1097. [Google Scholar] [CrossRef]
  23. Lin, S.; An, J.; Gan, L.; Debbah, M. UAV-Mounted SIM: A Hybrid Optical-Electronic Neural Network for DoA Estimation. In Proceedings of the ICASSP 2025–2025 IEEE International Conference on Acoustics, Speech and Signal Processing (ICASSP), Hyderabad, India, 6–11 April 2025; pp. 1–5. [Google Scholar]
  24. Fan, M.; Sun, G.; Pan, H.; Wang, J.; An, J.; Du, H.; Yuen, C. Joint Association and Phase Shifts Design for UAV-Mounted Stacked Intelligent Metasurfaces-Assisted Communications. arXiv 2025, arXiv:2508.00616. [Google Scholar]
Figure 1. System-level schematic of the proposed fiber-tethered UAV-enabled adaptive aerial optical network.
Drones 10 00236 g001
Figure 2. Aerial backhaul topologies considered in the ABS-mode analysis: (a) ring-, (b) star-, and (c) bus topology.
Drones 10 00236 g002
Figure 3. Spatial coverage maps and outage-ratio comparison for a six-UAV deployment (N = 6) under the three candidate topologies: (a) Star, (b) Bus, (c) Ring, and (d) their comparison.
Drones 10 00236 g003
Figure 4. Scalability trade-off between serviceable coverage and time-to-first-service in the ABS mode: (a) Normalized coverage and (b) Initial latency versus UAV flight speed.
Drones 10 00236 g004
Figure 5. End-to-end latency distribution across nodes in the multi-hop AA-PON: (a) Star, (b) Bus, (c) Ring, and (d) their comparison.
Drones 10 00236 g005
Figure 6. Stochastic-geometry evaluation of G2A2G service availability and network dimensioning: (a) Conceptual coverage footprints and (b) aggregate service probability versus the number of deployed ground terminals.
Drones 10 00236 g006
Figure 7. Experimental proof-of-concept setup for a fiber-tethered UAV-to-UAV FSO link.
Drones 10 00236 g007
Figure 8. BER result of the fiber-tethered UAV-to-UAV FSO communication link.
Drones 10 00236 g008
Table 1. Comparison of representative aerial/backhaul networking frameworks.
FrameworkBackhaul
Capacity/Bandwidth
Deployment
Flexibility
Integration with Existing Optical Access
Infrastructure
Network
Reconfigurability/Multi-Mode Operation
Optical Network
(Standard Fiber)
OXOX
Untethered FSO
UAVs
OOXΔ
Tethered RF
UAVs
ΔOXX
Proposed AA-PON
(ABS and G2A2G)
OOOO
Notation: “O” = strong/inherent, “Δ” = partial, “X” = limited/not inherent.
Table 2. Experimental device/equipment/setup.
ParameterValue/Description
Test environmentUAV Hovering, Indoor laboratory, daytime
Link typeFiber-tethered UAV-to-UAV free-space optical (FSO) link
Inter-UAV free-space link distance2 m
Optical source wavelength660 nm
Optical source power100 µW
Modulation formatOn-off keying (OOK)
Demonstrated data rate1–2 Gb/s
BER conditionOperation below FEC threshold
Beam-shaping opticsBeam collimator used
Receiver typeAvalanche photodiode (APD)
Receiver modelThorlabs APD210
Receiver bandwidth1 GHz
Receiver responsivity35 A/W at 650 nm
OscilloscopeDPO70404, Tektronix (Beaverton, OR, USA)
Arbitrary waveform generatorAWG70K, Tektronix (Beaverton, OR, USA)
Disclaimer/Publisher’s Note: The statements, opinions and data contained in all publications are solely those of the individual author(s) and contributor(s) and not of MDPI and/or the editor(s). MDPI and/or the editor(s) disclaim responsibility for any injury to people or property resulting from any ideas, methods, instructions or products referred to in the content.