Proceeding Paper

New Insights in the Quality of Phaseolus vulgaris L.: Nutritional Value, Functional Properties and Development of Innovative Tools for Their Assessment †

1
National Institute for Agricultural and Veterinary Research (INIAV), I.P., 2780-157 Oeiras, Portugal
2
Centre for the Research and Technology of Agro-Environmental and Biological Sciences, University of Trás-os-Montes and Alto Douro (CITAB-UTAD), 5000-801 Vila Real, Portugal
3
CoLAB Vines&Wines—National Collaborative Laboratory for the Portuguese Wine Sector, Associação para o Desenvolvimento da Viticultura Duriense (ADVID), Régia Douro Park, 5000-033 Vila Real, Portugal
*
Author to whom correspondence should be addressed.
Presented at the 1st International Electronic Conference on Food Science and Functional Foods, 10–25 November 2020; Available online: https://foods_2020.sciforum.net/.
Proceedings 2021, 70(1), 25; https://doi.org/10.3390/foods_2020-07726
Published: 10 November 2020

Abstract

:
Common beans (Phaseolus vulgaris L.) globally represent the most consumed and produced grain legume for direct human consumption, due to their rich nutritional and functional value. Concomitantly, innovative methodologies and approaches have been developed, which improves the quality evaluation of food products, in order to replace conventional analysis, reduce the use of chemicals, save time, and minimize sample handling. The main objectives of this work are the characterization of beans and the study of their uses in the enrichment of food products, with added value for the agrifood chain. Linked to this objective is also envisaged the development of new methods, for the determination of relevant compounds present in bean cultivars, using Fourier Transform Infrared Spectroscopy (FTIR), through the multivariate analysis. Navy, black, and pink eyed cultivars are the most promising protein and amino acid sources, which can be used for nutritional enrichment. Red kidney and arikara yellow cultivars offer the best functional proprieties due to their higher phytochemical composition, in vitro antioxidant activity, and individual phenolic compounds. We also found that the FTIR techniques are suitable for the evaluation of an array of relevant macro compounds, as well as compounds present in low concentrations. In conclusion, the results of this work state a progress in the knowledge of the nutrients, phytochemicals, and in vitro antioxidant activity of each cultivar and their potential for food applications, besides proofing the suitability of the innovative and eco-friendly FTIR methodology as a routine method in laboratories and food industry.

1. Introduction

The recent awareness of the importance of food composition on human health has triggered a rising worldwide consumer interest in eating foods that are particularly important sources of nutrients and bioactive compounds [1]. Of all the potential foods, the present study focuses on legumes for important reasons. Firstly, legumes represent a good and cheap alternative to partly replace meat based food products due to their rich nutritional and phytochemical composition. Secondly, experts indicate that legumes play a key role in food security and climate challenges by i. providing proteins and lysine to complement cereals in human nutrition, ensuring a balanced diet for vegetarians and vegans, and ii. contributing to diversified crop rotations and nitrogen-fixing in the soil, thus reducing the use of fertilizers and greenhouse gas emissions. Lastly, legumes, particularly common beans, are rich in protein, carbohydrates, and dietary fiber, as well as a source of essential nutrients including vitamins, minerals, phenolic compounds, and lower amounts of fat, all contributing to associated health benefits [2].
On one hand, this rising adoption of beans as high protein alternatives for food and enrichment is beneficial, however on the other hand, recent concerns have been raised about the use of rapid and eco-friendly methodologies in food industries and laboratories for assessment of beans quality. The evaluation of beans’ quality is traditionally performed through the use of mainly high liquid chromatography (HPLC), gas chromatography-mass spectroscopy (GC-MS) and spectrophotometry that are time-consuming, use chemicals, and are destructive for the samples. One of the current innovative methodologies is Fourier transform infrared spectroscopy (FTIR) which is simple to apply, faster, does not use chemicals, and is non-destructive for samples. This methodology focuses in mid-Infrared (MIR) region 400–3600 cm−1 and near-Infrared region (NIR) defined as encompassing 4000–14,000 cm−1, which the absorption of spectrum are related to the vibrations of functional groups [3].
In summary, a detailed study with composition of different bean cultivars is essential to determine their potential uses in the food industry. Associated to this need, there is a methodological challenge to develop eco-friendly methodologies to evaluate the nutritional composition, total phenol, and in vitro antioxidant capacity of different bean cultivars quickly and non-destructively.

2. Methods

2.1. Sampling

Fourty-two common bean samples used were classified according to their morphological characteristics, resulting in 10 common bean cultivars clustered as: arikara yellow (A), butter bean (B), cranberry (C), red kidney (K), navy (N), pinto (P), black (Bk), brown eyed (BE), pink eyed (PE), and tarrestre (M). The seeds were the collection held at the Research Unit of Biotechnology and Genetic Resources (INIAV, Oeiras, Portugal) and were cultivated in Cabrela (near Sintra, Portugal). All bean seeds were ground through the Falling Number 3100 mill (Perten, Hägersten, Sweden) using a 0.8 mm screen and stored at room temperature in sealed plastic bags until further analysis.

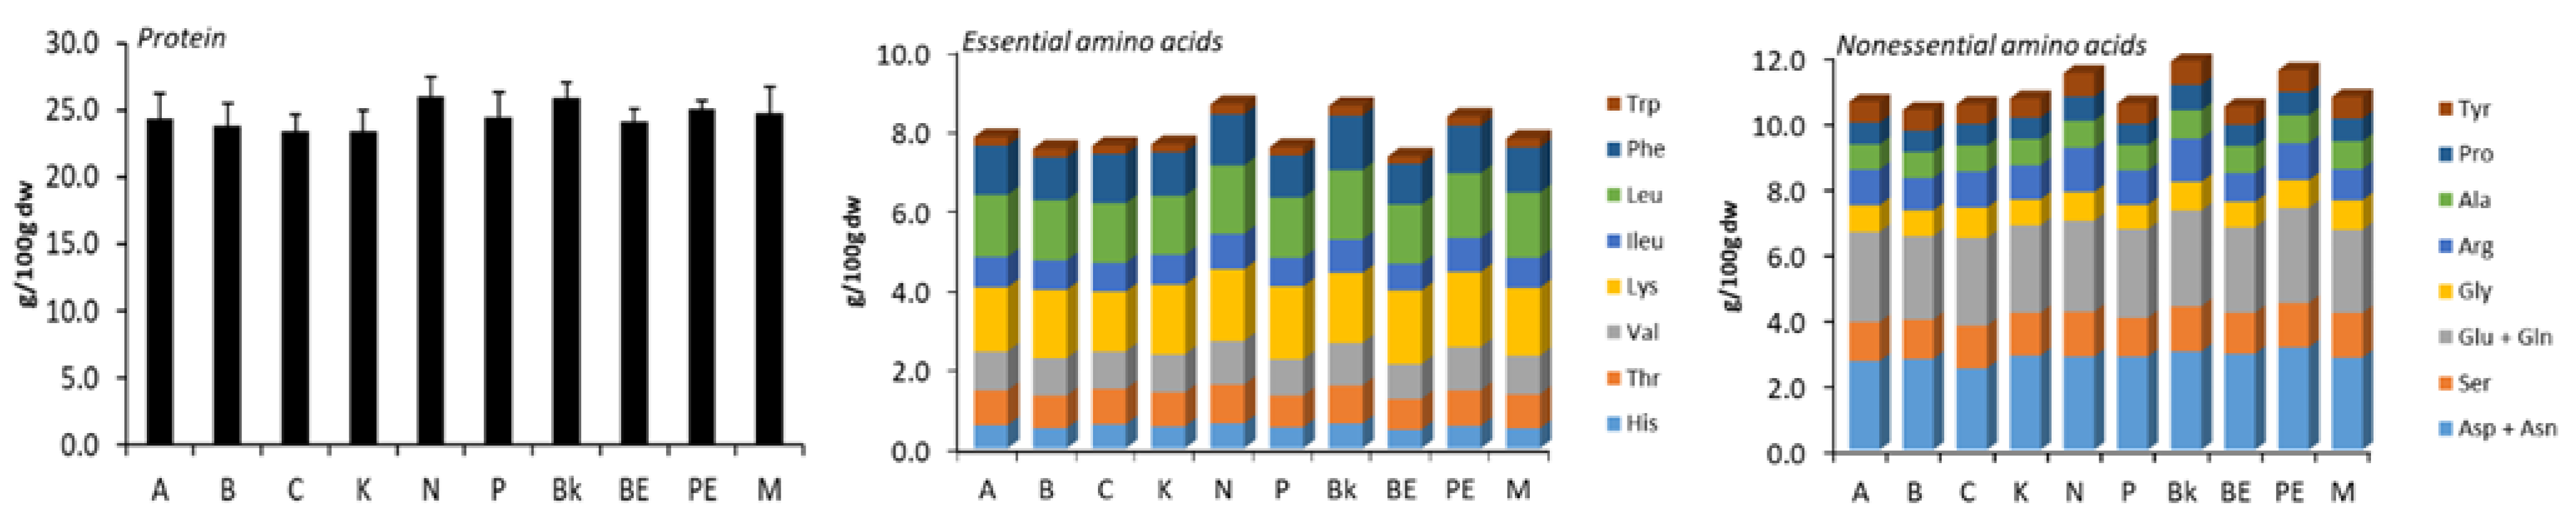
2.2. Protein Content

The protein content of samples was determined by the method 954.01 (AOAC, 2005). The results are presented as grams of protein per hundred grams of sample dry weight (g/100 g dw).

2.3. Amino Acids Composition
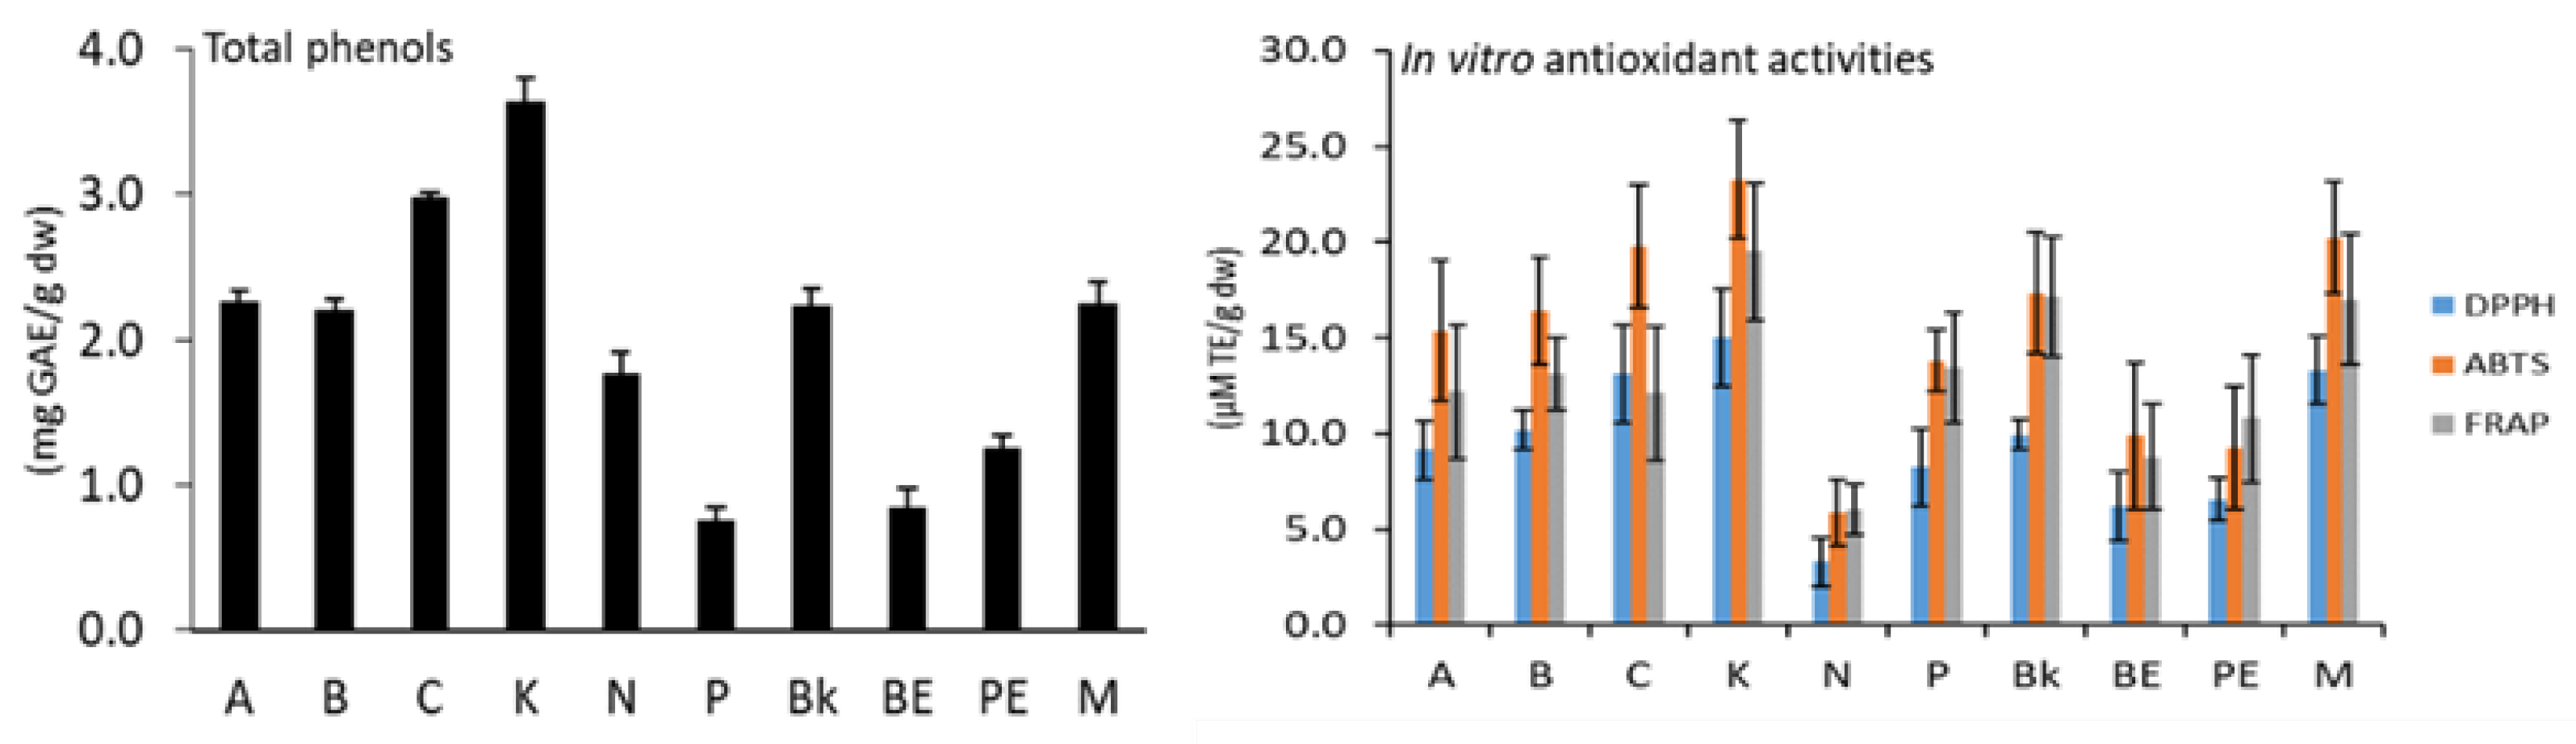
The amino acids were quantified by HPLC as the method described by Machado et al. [4]. The results expressed as grams per one hundred gram of sample dry weight (g/100 g dw).

2.4. Total Phenols

The quantification of the total phenols content of each bean extract was determined according to the method of Mena et al. [5], with minor modifications. The absorbance was measured at 750 nm, and the results expressed as milligrams of gallic acid equivalents per gram dry weight (mg GAE/g dw).

2.5. In Vitro Antioxidant Activities
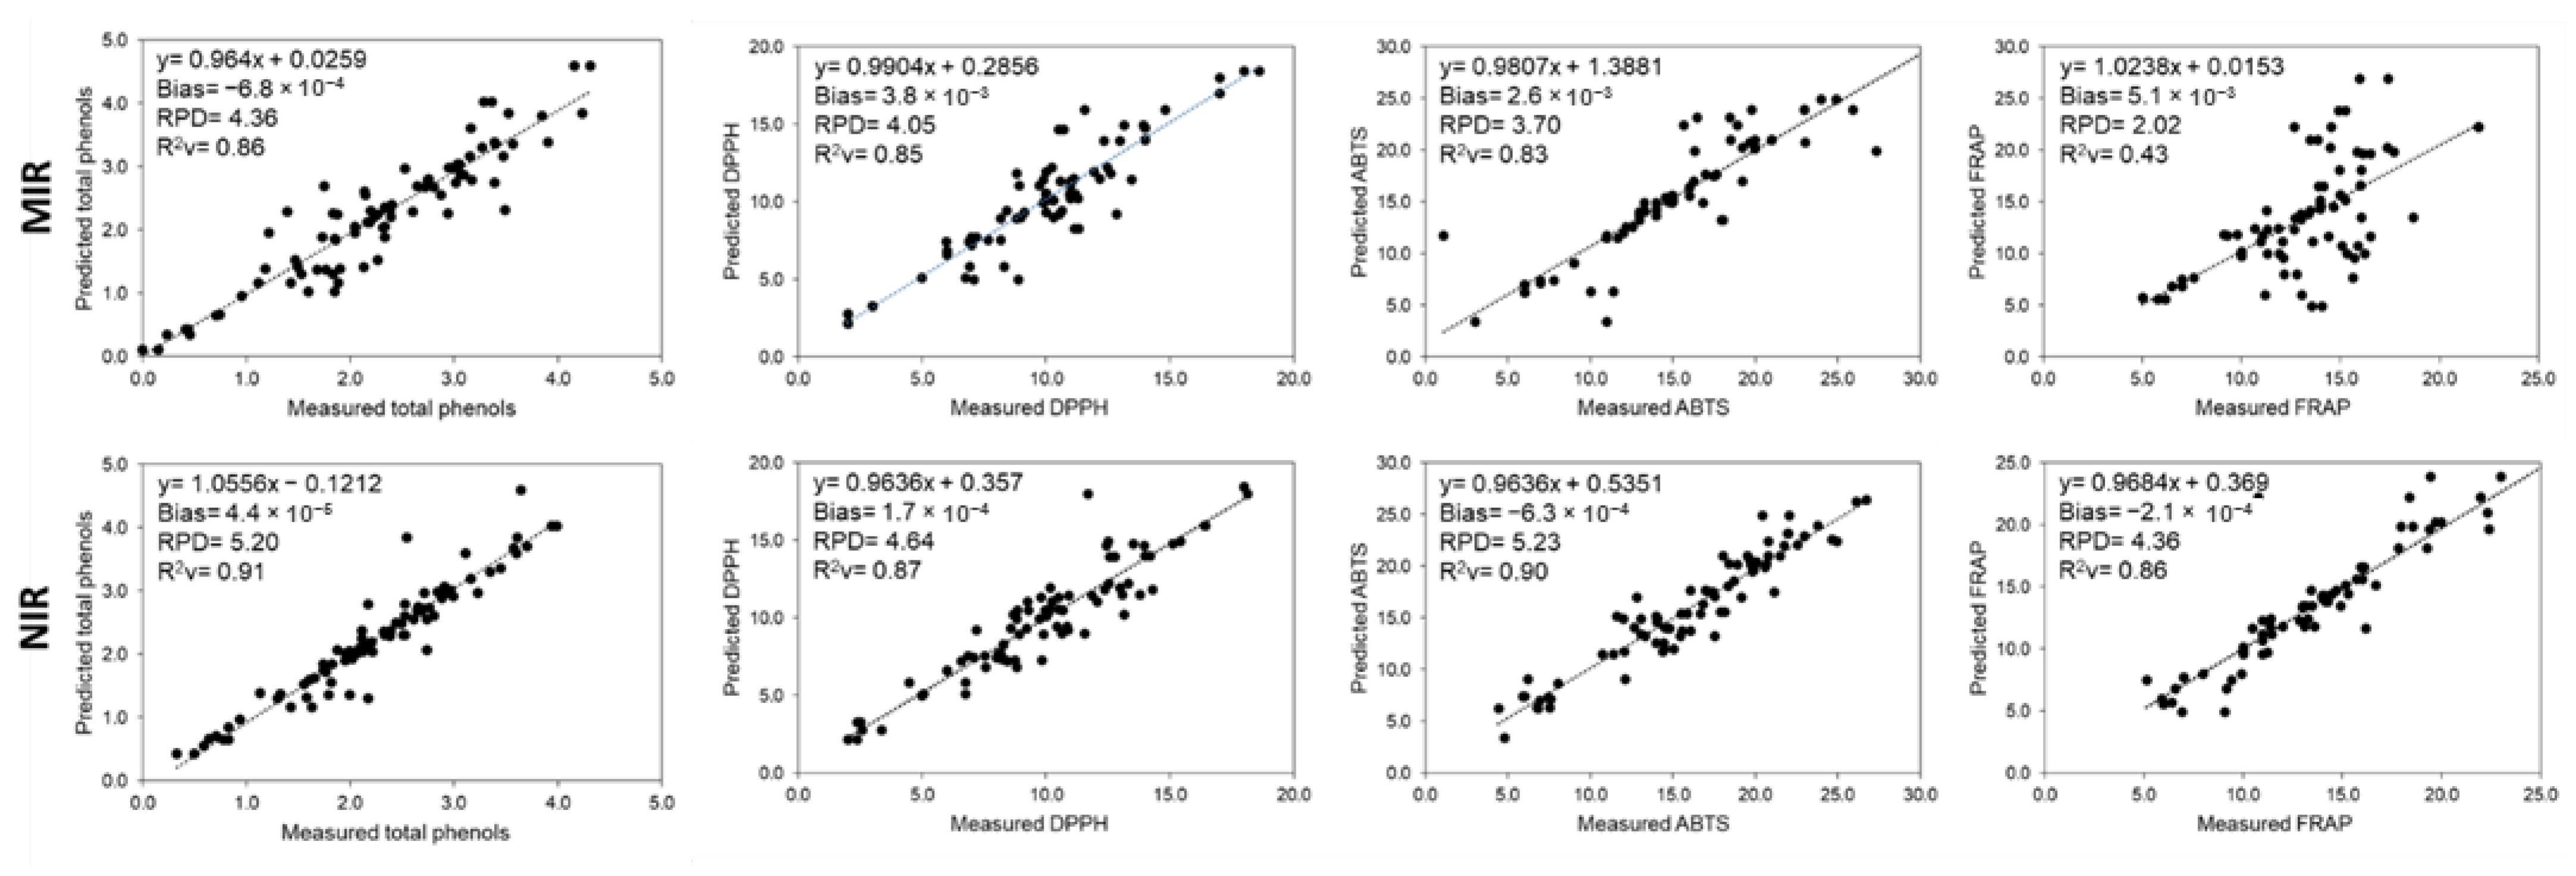
The free radical scavenging (DPPH and ABTS) assays and ferric reducing antioxidant power (FRAP) assay were performed according to the methods described by Espín et al. [6], with slight modifications. The absorbance was measured at room temperature after 30 min of reaction at 520 nm for DPPH, at 734 nm for ABTS and at 593 nm for FRAP. The results of all procedures were measured as µM of trolox equivalents per gram of dry weight (µM TE/g dw).

2.6. FTIR Analysis

Infrared spectra (IR) of bean flours were collected in two regions (MIR and NIR), using a Thermo Scientific Nicolet iS50 FTIR spectrometer (Thermo Fisher Scientific Inc., Waltham, MA, USA), possessing both the Diffuse Reflectance Infrared Fourier Transformed (DRIFT) and attenuated total reflection (ATR) accessories, corresponding to NIR and MIR capabilities, respectively, being controlled by the Omnic software Version 9.2.28 (Thermo Fisher Scientific Inc., Waltham, MA, USA).

2.7. Statistical Analysis

NIR and MIR spectra were processed using the OriginPro 9.1 software (OriginLab, Northampton, MA, USA), which has been also used for the multivariate analyses. The spectral treatments applied in both methodologies (MIR and NIR) comprised mean normalization (spectra), 1st derivative of spectra (1st deriv) and 1st derivative after mean normalization (1st deriv MN). Partial least squares (PLS) regression was used to correlate the spectra with analytical contents [7]. The optimal models were evaluated through cross-validation (CV) and external validation. The accuracy of the models calibrated was evaluated through the values obtained regarding prediction error sums of squares (PRESS), and the determination coefficients observed between analytical and predicted values (R2), which were calculated for both the calibration (R2c) and validation (R2v) sets, bias values, which should be close to zero [8,9], and residual prediction deviation (RPD). The contents in protein, amino acids, total phenols, and in vitro antioxidant activity, were assessed in triplicate. The statistical analyses applied to the analytical results were performed using SPSS Statistics 21.0 software (SPSS inc., Chicago, IL, USA).

3. Results and Discussion

The protein content varied between 23.38 and 26.01 g/100 g dw (Figure 1). Lys and Asp + Asn were the most predominant amino acids in the cultivars, showing 1.5–1.9 g/100 g, and 2.5–3.1 g/100 g, respectively (Figure 1). These results are consistent with those previously reported by Kan et al. [2].
N, Bk, and PE beans showed the highest amounts of protein content and profile in amino acids, and a similar tendency was verified by Du et al. [10]. Altogether, this detailed characterization of the distinct groups of beans enables a potential boost of the use of specific beans in the food industry for the development or enrichment of food products with health benefits [11]. For instance, N cultivars can be particularly used for nutritional enrichment of normal or for gluten-free products, mainly due to their higher protein content and essential amino acids (lysine).
The cultivars of type K and cranberry reported higher total phenols and in vitro antioxidant activity, while the lower amounts were found in uncolored cultivars including N, BE, and PE [11] (Figure 2). On the other hand, K bean cultivars showed considerable potential to be used as a functional ingredient to develop novel foodstuffs due to their higher amounts of phenolic compounds and antioxidant properties.
The results obtained with the PLS regressions developed for the MIR and NIR region, regarding the evaluation of protein, essential and nonessential amino acids are summarized in Table 1.
MIR and NIR regions proved to be reliable approaches for the prediction of protein and most amino acids present in bean flours, except for His, Lys, and Arg in both regions. The determination coefficients for quantification of protein using NIR and MIR region, were higher than the coefficients published by Plans et al. [12]. Hence, and according to the present results, the best treatment for the development of analytical models to quantify the protein and amino acids, was the 1st derivative. Concerning MIR, the use of the LF assessed (450–1800 cm−1) represented the most reliable approach for the development of analytical models [13].
The predicted models in the MIR and NIR region with the best calibration coefficients from the correlation between measured and predicted values of total phenols and in vitro antioxidant activities (DPPH, ABTS and FRAP) are presented in Figure 3.
In both techniques (MIR and NIR approaches) displayed suitability to be used for the quantification of total phenols and in vitro antioxidant activity (except FRAP). The MIR approach providing the best results was the 1st derivative MN, applied to the restricted LF region (450–1799 cm−1) [14]. As for NIR, the best models were developed using the 1st derivative treatment and its performance in assessing bioactive compounds was better than in MIR region, with R2v between 0.86 and 0.91 and RPD from 4.36 to 5.23.

4. Conclusions

Our study has identified the cultivars of Phaseolus vulgaris L. with the best nutrient specific profile and functional proprieties for an increasing requirement for healthy food. Additionally, our results revealed that the spectroscopical methodologies may represent an accurate and rapid method for quantification of protein, total phenols, and in vitro antioxidant activity of beans, thus, their applicability in the food industry represents a good alternative to the traditional approaches.

Author Contributions

Conceptualization, B.C. and N.M.; methodology, B.C.; software, B.C. and N.M.; validation, N.M., E.A.S.R. and A.I.R.N.A.B.; formal analysis, B.C.; investigation, C.B., N.M., E.A.S.R. and A.I.B.; data writing—original draft preparation, B.C.; writing—review and editing, N.M., C.B., E.A.S.R. and A.I.R.N.A.B.; supervision, N.M., E.A.S.R. and A.I.R.N.A.B.; project administration, C.B., E.A.S.R. and A.I.R.N.A.B.; funding acquisition, C.B., E.A.S.R. and A.I.R.N.A.B. All authors have read and agreed to the published version of the manuscript.

Funding

This research was funded by National Funds by FCT—Portuguese Foundation for Science and Technology, under the projects UIDB/04033/2020 and BEGEQA—PTDC/AGR-TEC/3555/2012. The first author also acknowledges the financial support provided by the FCT-Portuguese Foundation for Science and Technology (PD/BD/128277/2017), under the Doctoral Program “Agricultural Production Chains—from fork to farm” (PD/00122/2012).

Institutional Review Board Statement

Not applicable.

Informed Consent Statement

Not applicable.

Data Availability Statement

The data presented in this study are available in doi:10.3390/antiox9020186, doi:10.1016/j.foodchem.2019.125509 and doi:10.1007/s11947-020-02457.

Acknowledgments

The authors are grateful to Maria Manuela Veloso and José António Passarinho from INIAV, for the multiplication of common bean cultivars and for providing the seeds.

Conflicts of Interest

The authors declare no conflicts of interest.

References

  1. Calles, T.; Xipsiti, M.; del Castello, R. Legacy of the International Year of Pulses. Environ. Earth Sci. 2019, 78, 1–8. [Google Scholar] [CrossRef]
  2. Kan, L.; Nie, S.; Hu, J.; Wang, S.; Bai, Z.; Wang, J.; Zhou, Y.; Jiang, J.; Zeng, Q.; Song, K. Comparative study on the chemical composition, anthocyanins, tocopherols and carotenoids of selected legumes. Food Chem. 2018, 260, 317–326. [Google Scholar] [CrossRef] [PubMed]
  3. Tao, L.; Lin, Z.; Chen, J.; Wu, Y.; Liu, X. Mid-infrared and near-infrared spectroscopy for rapid detection of Gardeniae Fructus by a liquid-liquid extraction process. J. Pharm. Biomed. Anal. 2017, 145, 1–9. [Google Scholar] [CrossRef] [PubMed]
  4. Machado, N.; Oppolzer, D.; Ramos, A.; Ferreira, L.; Rosa, E.A.S.; Rodrigues, M.; Domínguez-Perles, R.; Barros, A.I.R.N.A. Evaluating the freezing impact on the proximate composition of immature cowpea (Vigna unguiculata L.) pods: Classical versus spectroscopic approaches. J. Sci. Food Agric. 2017, 97, 4295–4305. [Google Scholar] [CrossRef] [PubMed]
  5. Mena, P.; García-Viguera, C.; Navarro-Rico, J.; Moreno, D.A.; Bartual, J.; Saura, D.; Martí, N. Phytochemical characterisation for industrial use of pomegranate (Punica granatum L.) cultivars grown in Spain. J. Sci. Food Agric. 2011, 91, 1893–1906. [Google Scholar] [CrossRef] [PubMed]
  6. Espín, J.C.; Soler-Rivas, C.; Wichers, H.J.; García-Viguera, C. Anthocyanin-based natural colorants: A new source of antiradical activity for foodstuff. J. Agric. Food Chem. 2000, 48, 1588–1592. [Google Scholar] [CrossRef] [PubMed]
  7. Wold, S.; Sjöström, M.; Eriksson, L. PLS-regression: A basic tool of chemometrics Original Research Article. Chemom. Intell. Lab. Syst. 2001, 58, 109–130. [Google Scholar] [CrossRef]
  8. Kadiroğlu, P.; Aydemir, L.Y.; Akcakaya, F.G. Prediction of functional properties of registered chickpea samples using FT-IR spectroscopy and chemometrics. LWT 2018, 93, 463–469. [Google Scholar] [CrossRef]
  9. Wang, J.; Liu, H.; Ren, G. Near-infrared spectroscopy (NIRS) evaluation and regional analysis of Chinese faba bean (Vicia faba L.). Crop J. 2014, 2, 28–37. [Google Scholar] [CrossRef]
  10. Du, S.; Jiang, H.; Yu, X.; Jane, J. Physicochemical and functional properties of whole legume flour. LWT Food Sci. Technol. 2014, 55, 308–313. [Google Scholar] [CrossRef]
  11. Carbas, B.; Machado, N.; Oppolzer, D.; Ferreira, L.; Queiroz, M.; Brites, C.; Rosa, E.A.S.; Barros, A.I.R.N.A. Nutrients, antinutrients, phenolic composition, and antioxidant activity of common bean cultivars and their potential for food applications. Antioxidants 2020, 9, 186. [Google Scholar] [CrossRef] [PubMed]
  12. Plans, M.; Simó, J.; Casañas, F.; Sabaté, J.; Rodriguez-Saona, L. Characterization of common beans (Phaseolus vulgaris L.) by infrared spectroscopy: Comparison of MIR, FT-NIR and dispersive NIR using portable and benchtop instruments. Food Res. Int. 2013, 54, 1643–1651. [Google Scholar] [CrossRef]
  13. Carbas, B.; Machado, N.; Oppolzer, D.; Ferreira, L.; Brites, C.; Rosa, E.A.S.; Barros, A.I.R.N.A. Comparison of near-infrared (NIR) and mid-infrared (MIR) spectroscopy for the determination of nutritional and antinutritional parameters in common beans. Food Chem. 2020, 306. [Google Scholar] [CrossRef] [PubMed]
  14. Carbas, B.; Machado, N.; Oppolzer, D.; Queiroz, M.; Brites, C.; Rosa, E.A.S.; Barros, A.I.R.N.A. Prediction of Phytochemical Composition, In Vitro Antioxidant Activity and Individual Phenolic Compounds of Common Beans Using MIR and NIR Spectroscopy. Food Bioprocess Technol. 2020, 13, 962–977. [Google Scholar] [CrossRef]
Figure 1. Protein content, essential and nonessential amino acids of common bean cultivars. “Cultivars: arikara yellow (A), butter bean (B), cranberry (C), red kidney (K), navy (N), pinto (P), black (Bk), brown eyed (BE), pink eyed (PE), and tarrestre (M)”.
Proceedings 70 00025 g001
Figure 2. Total phenols and in vitro antioxidant activities (DPPH, ABTS, FRAP) of common bean cultivars. “Cultivars: arikara yellow (A), butter bean (B), cranberry (C), red kidney (K), navy (N), pinto (P), black (Bk), brown eyed (BE), pink eyed (PE), and tarrestre (M)”.
Proceedings 70 00025 g002
Figure 3. Correlation between the measured and predicted values by the calibration models obtained by MIR and NIR for the total phenols (MIR: 1st deriv MN; NIR: 1st deriv) and the in vitro antioxidant activities (DPPH (MIR: 1st deriv MN; NIR: 1st deriv), ABTS (MIR: spectra; NIR: 1st deriv) and FRAP (MIR: 1st deriv; NIR: 1st deriv MN)).
Proceedings 70 00025 g003
Table 1. Partial least squares (PLS) regressions for the prediction of protein and amino acids assessed, corresponding to the best calibration developed with mid-Infrared region (MIR) and near-Infrared region (NIR).
MIRNIR
Analytical ParametersTreatmentPRESS (NF)R2cR2vAnalytical ParametersTreatmentPRESS (NF)R2cR2v
Protein1st deriv (FI)0.283 (4)0.990.96Protein1st deriv0.284 (4)0.990.98
Thr1st deriv MN (LF)0.714 (7)0.980.90Thr1st deriv MN0.748 (2)0.770.75
His1st deriv (FI)0.935 (2)0.610.51His1st deriv MN0.900 (2)0.650.62
Val1st deriv MN (HF)0.530 (4)0.950.88ValSpectra0.530 (4)0.890.88
LysSpectra (FI)0.978 (1)0.410.37LysSpectra0.962 (1)0.460.44
IleuSpectra (HF)0.550 (6)0.920.88Ileu1st deriv0.629 (3)0.910.89
Leu1st deriv (LF)0.319 (5)0.990.96Leu1st deriv MN0.410 (4)0.980.97
Phe1st deriv (LF)0.881 (6)0.970.87Phe1st deriv MN0.876 (2)0.680.65
Trp1st deriv (FI)0.790 (4)0.900.84Trp1st deriv0.859 (3)0.820.77
Asp + Asn1st deriv MN (HF)0.649 (4)0.930.86Asp + Asn1st deriv0.644 (2)0.870.86
Ser1st deriv MN (HF)0.791 (4)0.910.78SerSpectra0.727 (6)0.810.78
Glu + GlnSpectra (LF)0.691 (2)0.790.76Glu + Gln1st deriv0.716 (2)0.850.83
Gly1st deriv (LF)0.762 (5)0.950.89Gly1st deriv MN0.814 (2)0.740.70
Arg1st deriv (FI)0.916 (2)0.640.58Arg1st deriv MN0.929 (2)0.650.61
Ala1st deriv MN (FI)0.491 (4)0.960.93Ala1st deriv MN0.486 (2)0.920.91
Pro1st deriv (LF)0.458 (6)0.990.95Pro1st deriv0.561 (2)0.910.89
Tyr1st deriv MN (LF)0.865 (4)0.930.84Tyr1st deriv0.752 (5)0.960.91
FI—Full region; LF—Low-frequency region; HF—High-frequency region; NF—Number of factors.
Publisher’s Note: MDPI stays neutral with regard to jurisdictional claims in published maps and institutional affiliations.

