Abstract
A pitcher’s action, when delivering a fastball, was analyzed from the data provided by a smart baseball. The spin rate at the release of the ball was merely 15.7 rps, however, the peak torque was excessively high, namely 0.396 Nm. The reason why the pitcher was not able to translate the torque entirely to angular kinetic energy and this to the spin rate was that the spin axis changed its direction suddenly three times when moving across the ball’s surface. This resulted in angles between torque and angular velocity vectors of greater than 90°, high precession and precession torque, and negative spin torques, causing a very low efficiency (5.4%) and a slow spin rate at the release of the ball.
Keywords:
baseball; smart baseball ball; profiling; performance; skill; spin rate; torque; pitching potential 1. Introduction
In cricket, the spin rate-related potential of a cricket bowler should not be judged based merely on the spin rate, but rather on the “bowling potential” [1], which is the ratio of the peak torque (Tmax) to the maximum spin rate (ωmax) times 100. As a theoretical rule of the thumb, verified empirically and experimentally [1], a torque of 0.01 Nm is required to produce a spin rate of 1 rps in a cricket ball, yielding a unity ratio (100 · Tmax/ωmax = 1 cNms). A ratio greater than 1 indicates that too much torque is produced for too little a spin rate, but also that the bowling potential is high, as the spin rate has the potential of being improved and therefore could be faster if the bowling or pitching efficiency were optimized. This principle was applied to the action of a baseball pitcher, whose coach suspected that the action was not optimal but was unaware of the reason. A smart baseball (Figure 1a) developed from an existing smart cricket ball [2,3] was used for this purpose. The smart cricket ball was already developed by Fuss et al. [1,2,3,4,5] in 2011 and has been used for research since this time. The aim of this paper is to present a case report on a pitcher’s action, by explaining in detail how the inefficient pitching action is analyzed.
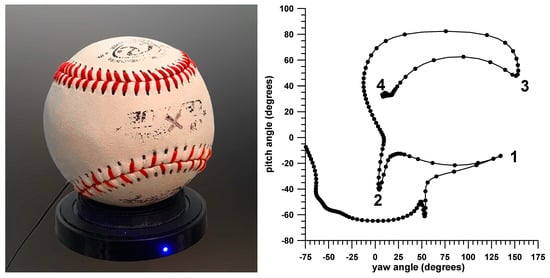
Figure 1.
(left): smart baseball on charging dock; (right): pitch angle against yaw angle of the spin axis (angular velocity vector); the graph shows how the spin axis moves on the surface of the ball; the dots represent the position of the spin axis at a frequency of 407.5 Hz (the greater the distance between the dots, the faster the spin axis moves across the ball’s surface); 1, 2, 3 = change of direction of the spin axis; 4 = spin axis at release.
2. Materials and Methods
The smart baseball (Figure 1) was developed in the same way the smart cricket ball was built [2]. The smart baseball is comprised of a printed circuit board (Ø 30 mm), Bluetooth module (for the communication with the smart ball software [1,2,3,4,5] and for the wireless data download), three high-speed gyros (measuring up to 50 rps), a rechargeable battery, a coil for inductive charging, a touch sensor for switching on the ball and a small electric motor (vibrator) for providing biofeedback to the user when switching on the ball. The electronics were posted and protected by heavy duty foam and a 3D-printed Nylon12 shell. The total mass of the ball was 142 g, i.e., within the rules of Major League Baseball [6], and the ball was covered with the leather patches of a regulation baseball. The electronics were arranged such that the ball’s center of mass was as close to its centroid as possible. The calibration process of the gyros was extensively described by Fuss et al. [7], who aligned the 3 gyros to the axes of an orthogonal coordinate system, mounted on a board, which was connected to a perpendicular shaft, driven by an electric motor. The speed of the motor was measured with an optical encoder. In turn, the accuracy of the encoder was verified with a handheld gas discharge stroboscope at 500, 1000, 1500 and 2000 rpm, and no measurement error was detected [7].
A pitcher delivered a fastball with the smart baseball (Figure 1a). The smart ball was pitched into a net. The data were analyzed from the parameters provided by the smart ball [4,5], including the new pitching potential [1]. This study was granted an ethics approval by the Swinburne University Human Ethics Committee (approval no. 20191582-3216) and adhered to the Declaration of Helsinki.
The smart ball software [1,2,3,4,5] generated the performance parameters as a function of time (at an 815 Hz sampling rate) as well as 4D angular velocity vector diagrams.
3. Results and Discussion
The spin rate at the release of the ball was merely 15.7 rps, and the peak torque was 0.396 Nm. Accordingly, the pitching potential was very high, namely 2.52 cNms. Comparatively, a cricket bowler (wrist spinner) producing 0.4 Nm could ideally bowl the ball with a spin rate of at least 40 rps [1]. The pitcher’s efficiency was merely 5.4%. The ball was pitched with a backspin (fastball), comparable to fast bowlers in cricket, who, in the worst inefficient case have a pitching potential of close to 2 cNms (data from [1]).
During the pitching action, the spin axis changed its path abruptly three times (‘1, 2, 3’ in Figure 1, Figure 2 and Figure 3). The pitcher wasted too much energy for changing the path of the spin axis, instead of adopting a fluent and smooth motion pattern.
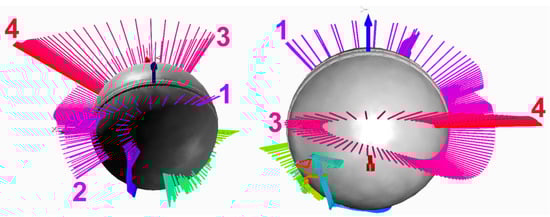
Figure 2.
4D spin axis (angular velocity) vector diagrams (the time as a 4th dimension is color coded) from 2 different aspects; 1, 2, 3 = change of direction of the spin axis; 4 = spin axis at release.
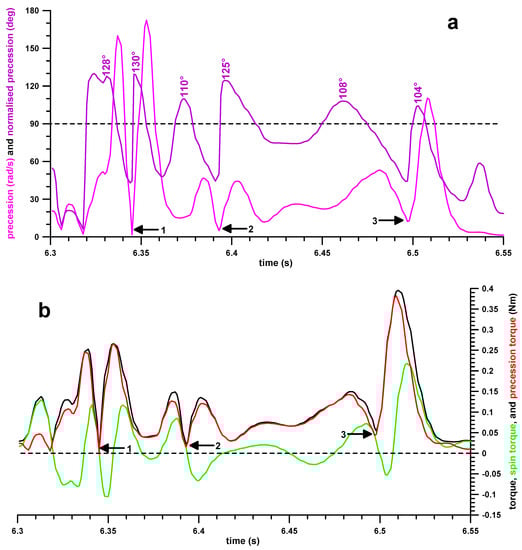
Figure 3.
(a): precession and normalized precession against the time; (b): torques against the time; 1, 2, 3 = change of direction of the spin axis.
Figure 3a shows the precession speed (velocity of the moving spin axis) and the normalized precession (angle between torque vector and angular velocity vector). Before and after each direction change of the spin axis, the normalized precession reached a peak, with an angle greater than 90° (104°–130°). As a result, the spin torque, which is supposed to increase the angular velocity, became negative (Figure 3b) six times and thus decreased the spin rate. This explains why the efficiency was merely 5.4%. Note that the peaks of the normalized precession (labeled in Figure 3a) coincided with the minima of the (negative) spin torque (Figure 3b) on the time axis. The normalized precession peaks preceded the precession peaks [1]. The normalized precession decreased to approximately 45° after the first five peaks, and to 30° after the last peak (major torque spike, increasing the spin rate of the ball immediately before release).
The same effect seen in the behavior of the precession (Figure 3a), namely a peak before and after each direction change of the spin axis, was mirrored in the torque resultant, and in the precession torque which caused the precession (Figure 3b). The spin torque, however, which changed the spin rate, moved from positive to negative at each direction change of the spin axis (and thereby decreased the spin rate).
In summary, there were three events during the pitching action that take the angular kinetic energy out of the baseball. These events were linked to a sudden change in the spin axis’ direction by almost 180°, to angles between torque and angular velocity vectors of greater than 90°, high precession and precession torque, and negative spin torques. These events resulted in a low efficiency and a slow spin rate at the release of the ball. Conversely, the pitching potential was very high (2.5 cNms), and so was the resultant torque (0.4 Nm), a torque typical of high-performing wrist spinners in cricket. Analyzing the pitcher’s action in detail will reveal the imperfections of his motions, which can be corrected through intervention. There is evidence for such a process [8] where an imperfect motion pattern was recognized from the data of a smart cricket ball [1,2,3,4], which was subsequently corrected though interventional training, and its effect verified by the smart ball. It can be argued that the spin rate is not important for fast balls, and that only the translational speed counts. However, the spin rate is essential for the flight stability of the ball. A spin rate of merely 15.7 rps makes the ball vulnerable to aero-torques [4] that are aerodynamically imparted at the seams and are oriented perpendicularly to the spin axis.
The limitation of the smart baseball is that it does not provide the translational velocity of the ball. Trackman (Vedbæk, Denmark) or FlightScope Mevo (FlightScope, Orlando, FL, USA), used for baseball data analysis, measure the translational speed and the spin rate, but provide only one datum each per pitch. Our smart baseball (and the smart cricket ball) measures five physical performance parameters and five skill parameters at a frequency of 815 Hz [1,2,3,4,5].
Funding
No funds were received for conducting this study.
Conflicts of Interest
The author declares no conflict of interest.
References
- Fuss, F.K.; Doljin, B.; Ferdinands, R.E.D.; Beach, A. Dynamics of spin bowling: The normalized precession of the spin axis analysed with a smart cricket ball. Proc. Eng. 2015, 112, 196–201. [Google Scholar] [CrossRef][Green Version]
- Doljin, B.; Fuss, F.K. Development of a smart cricket ball for advanced performance analysis of bowling. Proc. Technol. 2015, 20, 133–137. [Google Scholar] [CrossRef]
- Fuss, F.K.; Doljin, B.; Ferdinands, R.E.D. Effect of the grip angle on off-spin bowling performance parameters, analysed with a smart cricket ball. Proceedings 2018, 2, 204. [Google Scholar] [CrossRef]
- Fuss, F.K.; Doljin, B.; Ferdinands, R.E.D. Effect on Bowling Performance Parameters When Intentionally Increasing the Spin Rate, Analysed with a Smart Cricket Ball. Proceedings 2018, 2, 226. [Google Scholar] [CrossRef]
- Fuss, F.K.; Doljin, B.; Ferdinands, R.E.D. Bowling performance assessed with a smart cricket ball: A novel way of profiling bowlers. Proceedings 2020. submitted (In Proceedings of the 13th conference of the International Sports Engineering Association, Tokyo, Japan, 22–25 June 2020). [Google Scholar]
- Office of the Commissioner of Baseball. Official Baseball Rules, 2018 Edition (Rule 3.01 The Ball); Major League Baseball: New York, NY, USA, 2018; Available online: http://mlb.mlb.com/documents/0/8/0/268272080/2018_Official_Baseball_Rules.pdf (accessed on 10 October 2019).
- Fuss, F.K.; Smith, R.M.; Subic, A. Determination of spin rate and axes with an instrumented cricket ball. Procedia Eng. 2012, 34, 128–133. [Google Scholar] [CrossRef]
- Fuss, F.K.; Doljin, B.; Ferdinands, R.E.D. Unpublished data. 2019. [Google Scholar]
© 2020 by the authors. Licensee MDPI, Basel, Switzerland. This article is an open access article distributed under the terms and conditions of the Creative Commons Attribution (CC BY) license (https://creativecommons.org/licenses/by/4.0/).