Proceeding Paper

Measuring Earthquake-Induced Deformation in the South of Halabjah (Sarpol-e-Zahab) Using Sentinel-1 Data on November 12, 2017 †

by
Hamit Beran GUNCE
1 and
Bekir Taner SAN
2,*
1
Department of Geological Engineering 1, Akdeniz University, 07058 Konyaalti/Antalya, Turkey
2
Department of Geological Engineering 2, Akdeniz University, 07058 Konyaalti/Antalya, Turkey
*
Author to whom correspondence should be addressed.
Presented at the 2nd International Electronic Conference on Remote Sensing, 22 March–5 April 2018; Available online: https://sciforum.net/conference/ecrs-2.
Proceedings 2018, 2(7), 346; https://doi.org/10.3390/ecrs-2-05159
Published: 22 March 2018
(This article belongs to the Proceedings of The 2nd International Electronic Conference on Remote Sensing)

Abstract

:
Synthetic aperture radar interferometry (InSAR) technology is one of the powerful tools to measure deformation and/or deposition on the ground’s surface. In addition to this, mass movement can also be monitored using InSAR techniques. The earthquake that occurred on November 12, 2017 in the south of Halabjah with a magnitude of 7.2 caused 350 people to lose their lives, and over 2500 people were injured. The aim of this study is to measure the deformation resulting from the earthquake using the “Interferometric Wide Swath”, which is one of the four display types of Sentinel-1 data. In order to carry out this process, two types of datasets were used, SRTM data and Sentinel-1 images acquired on November 7 and 19, 2017. In this study, VV polarization with the C band was used to generate an interferogram. During the study, SNAP 5.0 free image analysis and processing software by the European Space Agency (ESA). According to the obtained results, the minimum and maximum surface displacements were −0.45 and 0.49 m. When comparing the results with faults, the results are appropriate for the tectonic structures. Using InSAR technologies with open-source software and free data, it is possible to produce displacement maps just after earthquakes.

1. Introduction

Earthquakes are one of the most destructive natural phenomena in the world. The rapid and accurate estimation of the location and the amount of deformation is a challenging task in geoscience. In addition, it is important for rescue operations [1,2]. Synthetic aperture radar interferometry (InSAR) technology is one of the powerful tools to measure deformation and/or deposition on the ground’s surface. Sentinel-1(A/B) data provides synthetic aperture radar (SAR) images for investigating geohazards all over the world [3]. Sentinel-1 provides radar data with a range of between 5 to 22 m, depending on the different products [4]. Before Sentinel-1 began operating, there were other SAR systems, such as ERS-1 and -2, Radarsat-1 and -2, ENVISAT, and JERS. However, these sensor systems have completed their lives. Sentinel-1 can be easily accessible and was launched in 2014 [5,6].
A destructive earthquake of magnitude 7.2 struck to the south of Halabjah (Sarpol-e-Zahab) on November 12, 2017. Oblique-thrust faulting at mid-crustal depth (almost 19 km) caused the earthquake. The preliminary mechanism solutions revealed that the rupture occurred on a fault dipping shallowly to the east–northeast or on a fault dipping steeply to the southwest. The Arabian plate moves towards the north at a rate of approximately 26 mm/year. The earthquake’s location was in this area [7]. As a result of the two convergent plates (i.e., Eurasia and Arabia plates), the Zagros mountains in Iran were formed. This earthquake caused at least 452 people to lose their lives, and thousands of people were injured [8].
As a result of this devastating earthquake, no good news was obtained; the extent of the damage to the area could be determined by remote-sensing. The aim of this study is to measure the deformation due to the earthquake using the “Interferometric Wide Swath”, which is one of the four display types of Sentinel-1 data.

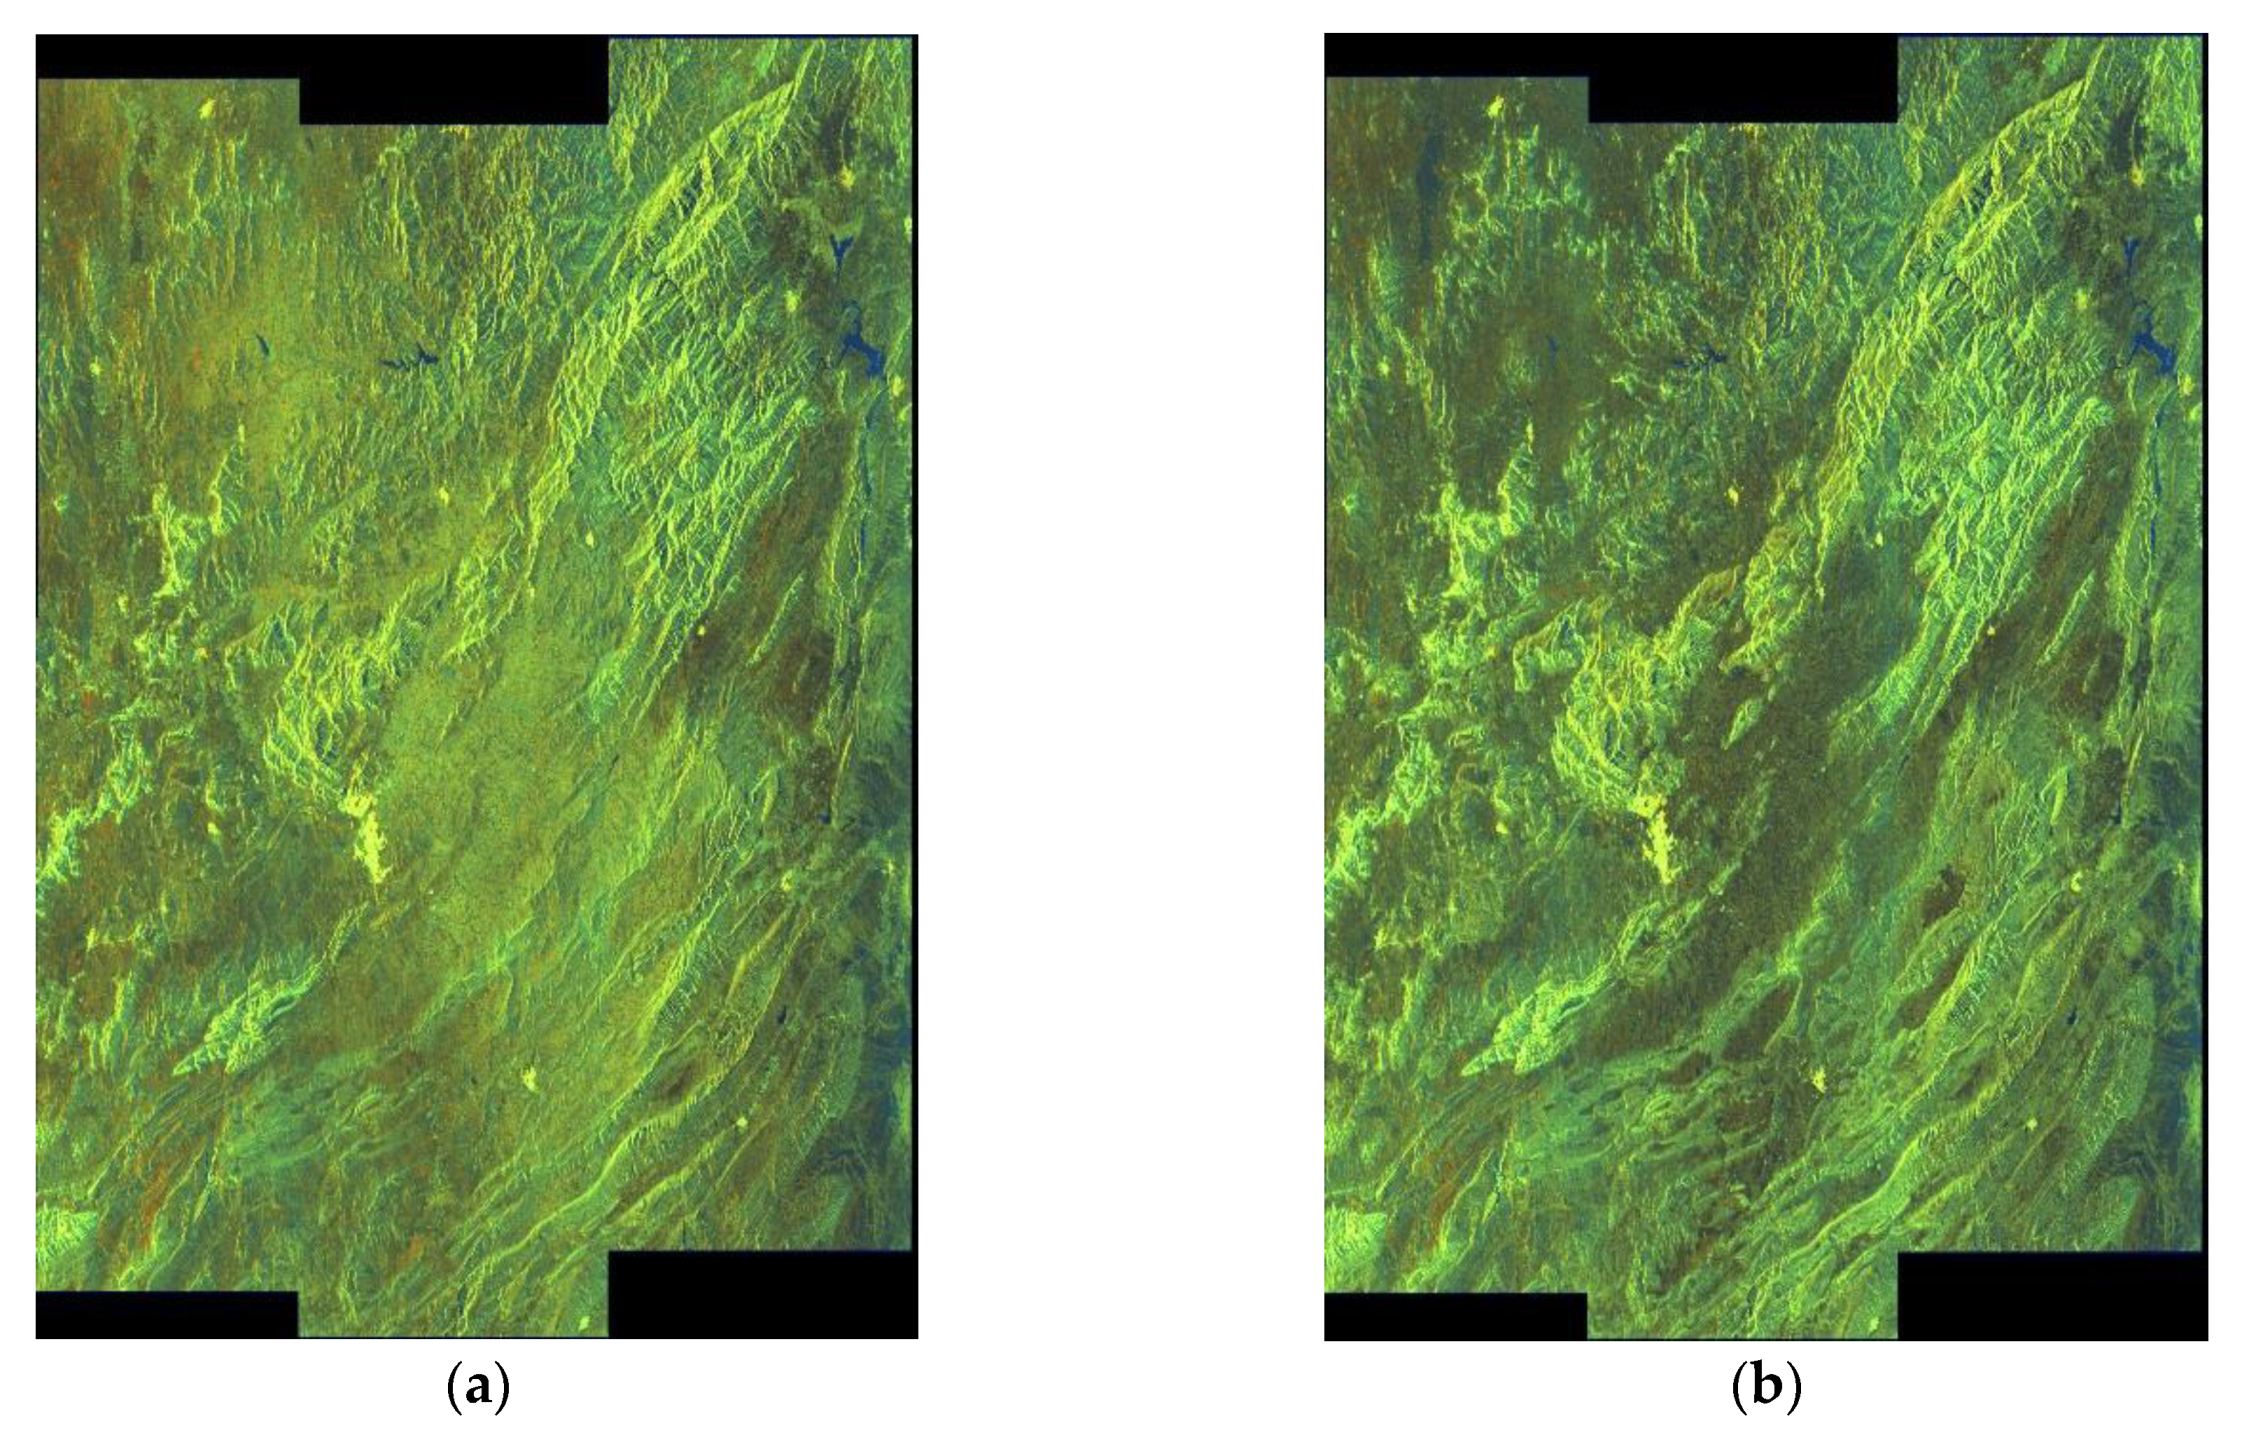
2. Study Area and Data Used

The study area is located to the south of Halabjah, the closest city to the earthquake’s epicenter, which was located at 34.88° N and 45.84° E near the Iran–Iraq border (according to the National Center of Broadband Seismic Network of Iran). Most of the damage occurred in the Sarpol-e Zahab, Qasr-e Shirin, and Eslamabad-e Gharb counties [9] (Figure 1).
In this study, the main data source was provided by Sentinel-1 datasets. The Sentinel-1A satellite was launched on 3 April 2014, by the European Space Agency (ESA) [5,6]. In this study, a dataset was used that consisted of four SARs with the C-band from the S1A sensor of the Sentinel satellite in TOPS mode [5] (Figure 2).
During the study, image processing was carried out using the open-source software SNAP 5.0 from the ESA [10]. The study area was covered by the data, and three slices of SAR data were assembled along tracks for better ground coverage. Figure 2 shows the Sentinel-1 images of the datasets used.
A pair of Sentinel-1A radar images were acquired in TOPS mode on the descending track, and six were used, as shown in Table 1. These datasets had the shortest temporal and perpendicular baselines available (Table 1).

3. Methodology

This study could be categorized into four main processing steps, which are the coregistration of SAR images, InSAR data analysis, phase unwrapping, and finally displacement measurements. At the beginning of all processing steps, the Sentinel-1 Interferometric Wide Swath (IWS) single-look complex (SLC) datasets were acquired from the ESA’s Sentinel Scientific Data Hub Website. This product contained three sub-swaths (“burst SLC”). Figure 3 shows the processing steps of the methodology. After radiometric calibration, the individual bursts could be merged into one SLC. Next, resampling of the SLC was performed with a reference SLC image. This is called a rough coregistration process. This operation was performed with consideration of the terrain topography.

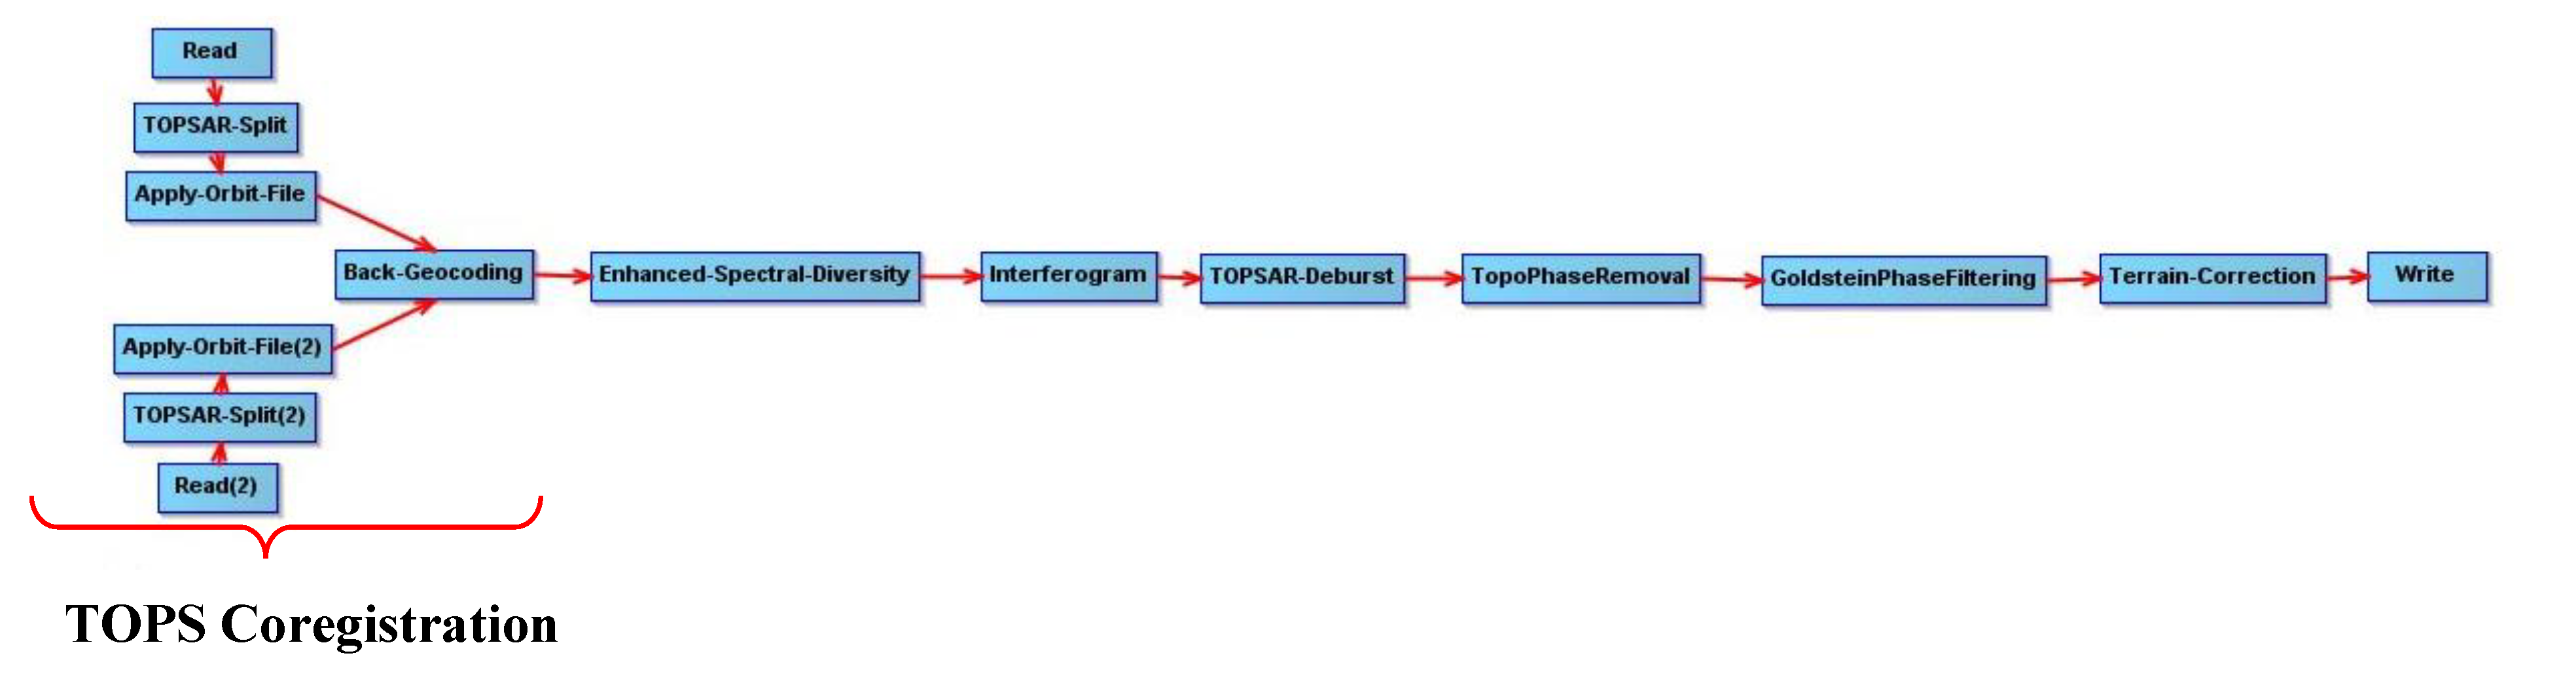
3.1. Coregistration of the Datasets

The coregistration process is an indispensable step for InSAR image processing. This is because this step directly affects the resultant data. The accuracy of the coregistration can be obtained at the 1/100 azimuth pixel level [11]. The strong Doppler variations within each burst cause significant phase jump effects, even with a coregistration accurcy at the 1/100 pixel level in the azimuth direction.

3.2. InSAR Data Analysis

In order to generate an interferogram, a minimum of two coregistered images are required. One image is used for the master and the other(s) is (are) used as the slave(s) [12]. The interferometric image was created by cross-multiplying the master image with the complex conjugate of the slave. The phase represents the phase difference between the two images; the amplitude of both images is multiplied [12]. In this study, the minimum time period of the two image datasets was 12 days. One was from before the earthquake, and the other was from after the earthquake [13].

3.3. Phase Unwrapping

Another important processing step is phase unwrapping, which is related to interferogram determination [14]. The information about the height is computed from the interferometric phase using a SAR analysis technique. This computation also performs the generation of the digital elevation model (DEM) [15]. The fundamental observation is the 2-D phase signal, which is one of the absolute phase signals for interferometric applications [16].
The interferograms were smoothed with a power spectrum filter and then unwrapped using SNAPHU software. SNAPHU is a statistical-cost network-flow algorithm for phase unwrapping developed at Stanford University by Curtis Chen and Howard Zebker [12].

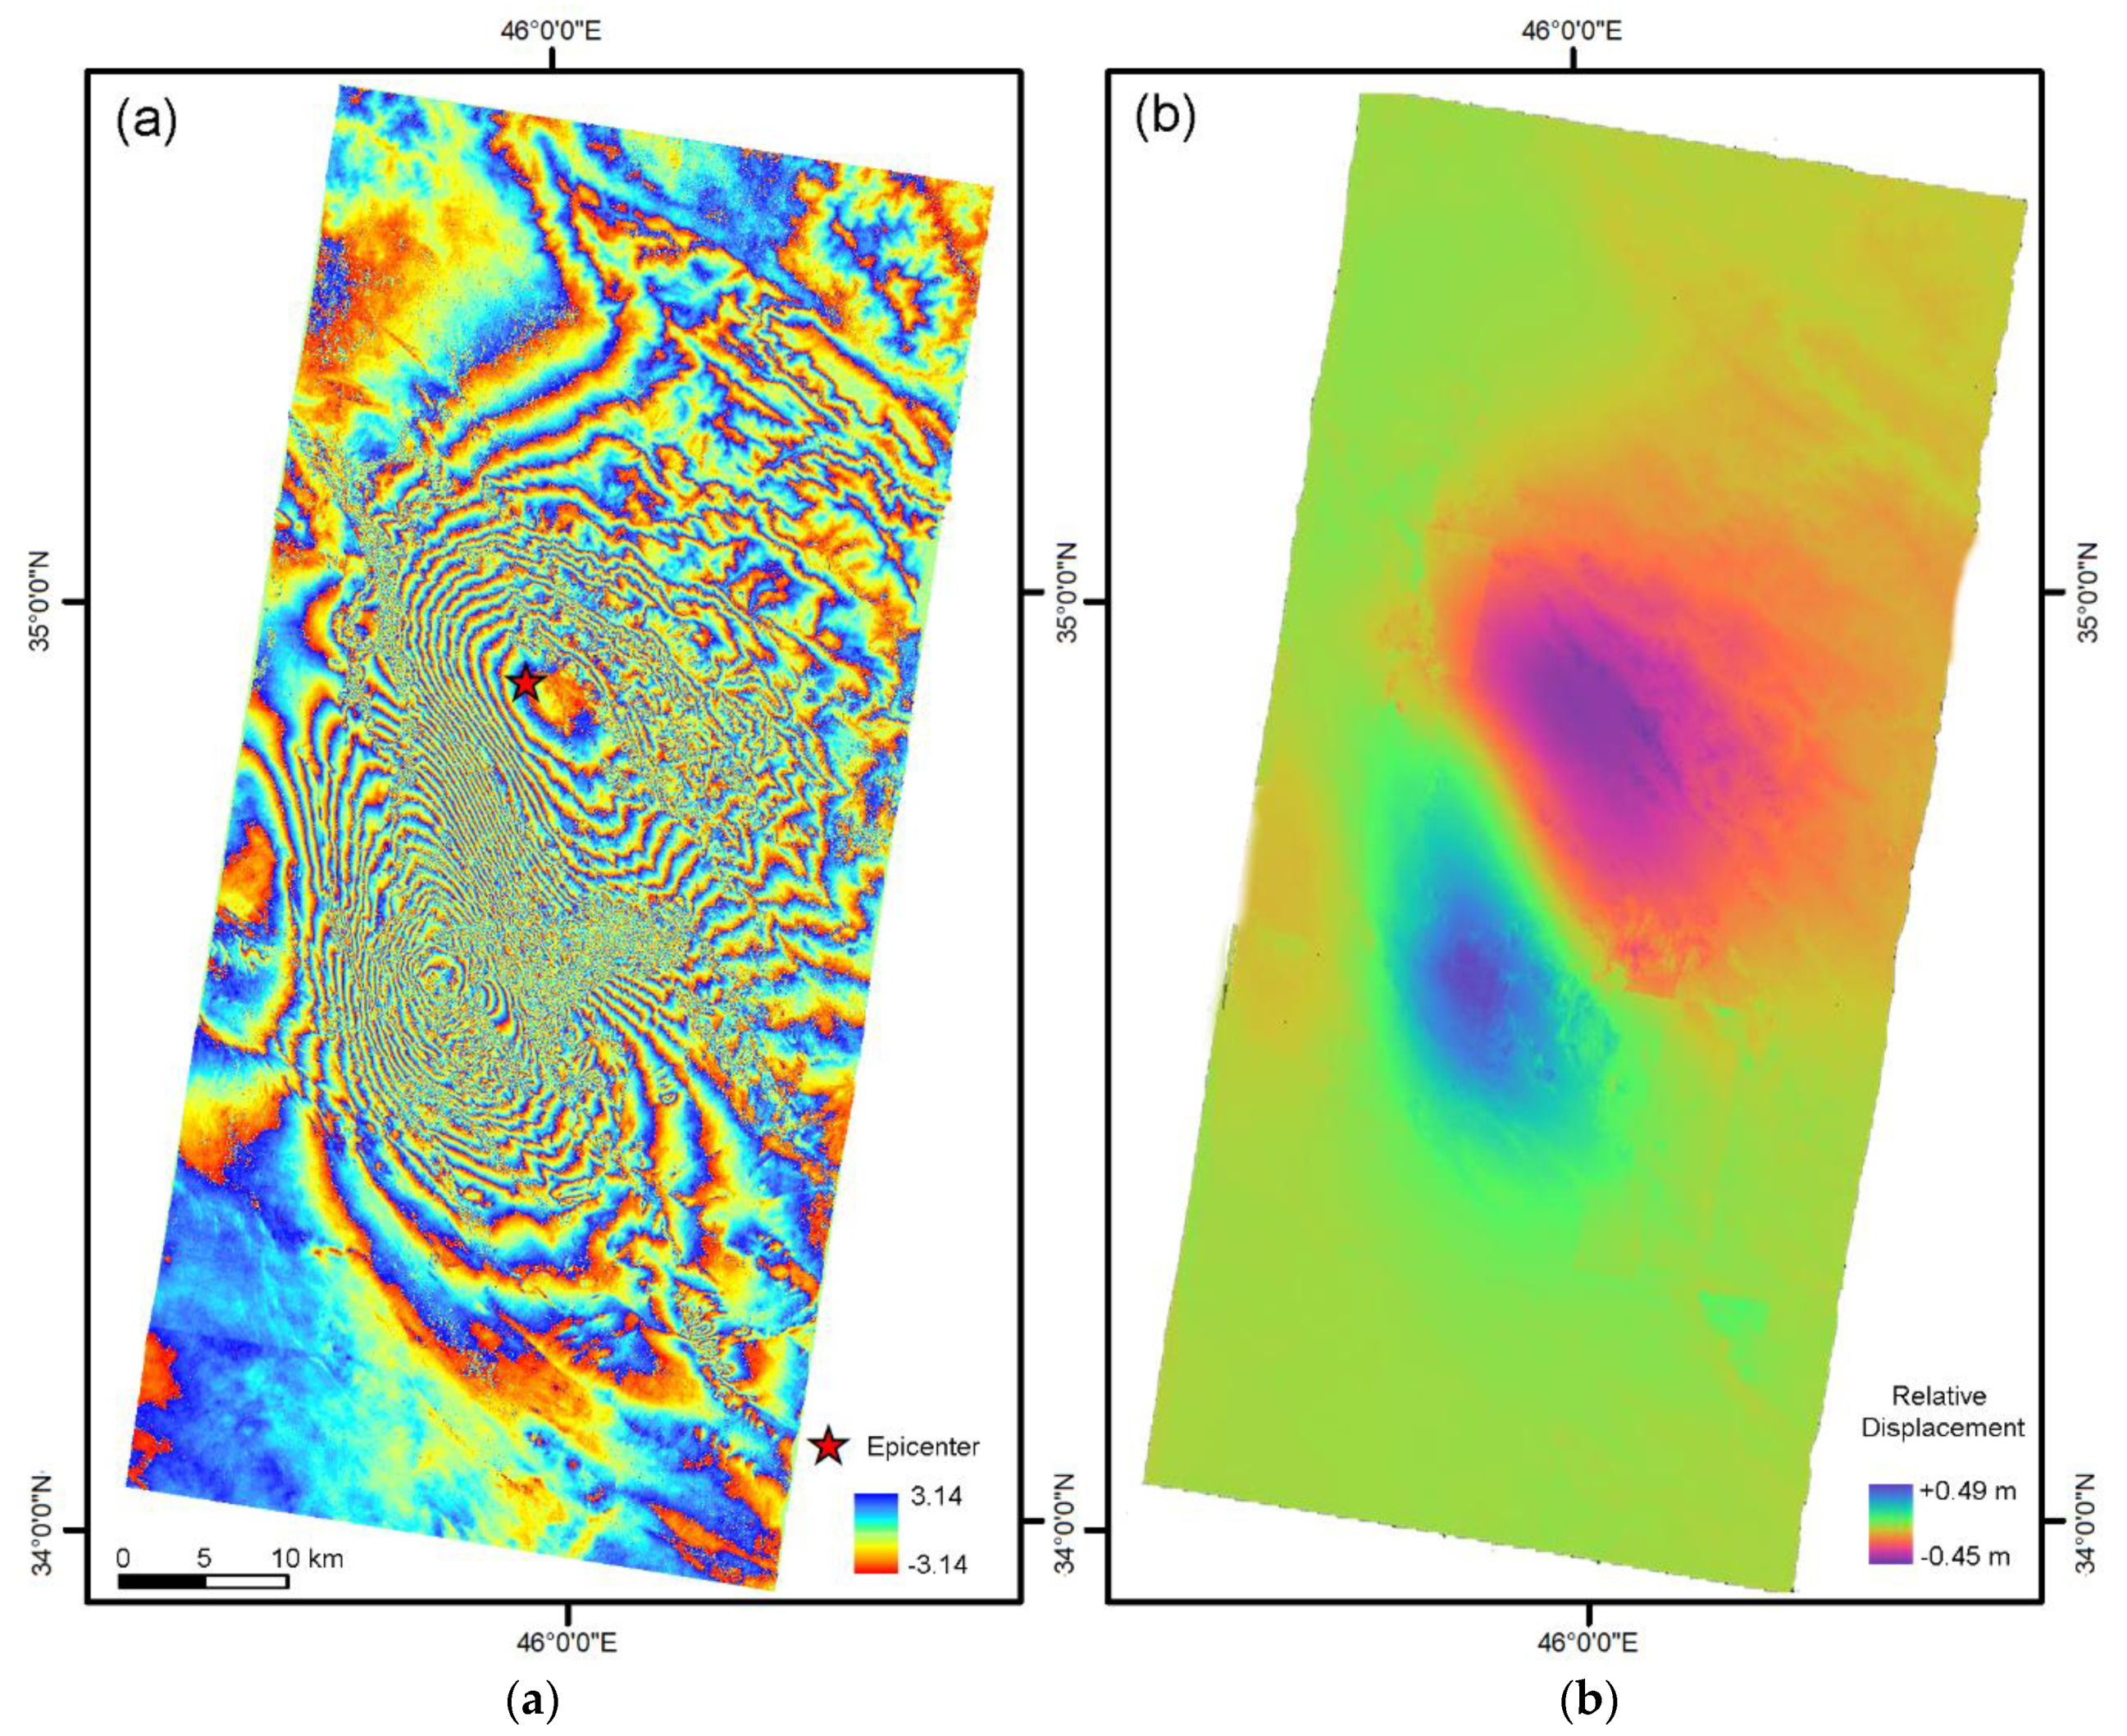
3.4. Displacement Measurements

During the InSAR application, a variation in the range of the look direction was measured. However, this measurement was not able to determine the 3-D displacement vector. In order to measure the displacement vector, additional information is required, such as information from interferograms from both ascending and descending satellite orbits, or integrated data from multiple platforms, which can be defined as different satellite positions [15].

4. Results and Discussion

The interferogram and the deformation obtained from the Sentinel-1 datasets on the study area are given in Figure 4a,b. This results were obtained over a 12 day period, as given previously. In Figure 4a, each rainbow color cycle shows the deformation fringes. These can be thought of as deformation contours. These color fringes are close to each other in the high-deformation areas. As can be seen from Figure 4a, the fault line that resulted in the earthquake can be clearly detected.
Finally, all the color fringes were unwrapped using the image processing operation. In Figure 4b, reddish and bluish colors show relative deformations. This figure also provides the thrust fault along the study area. In the study, the minimum and the maximum surface deformations were obtained as −0.45 and 0.49 m, according to the InSAR process. The obtained deformation amounts were directly related to the distance of the sensors. These measurements gave the differences in distance between the sensors and the terrain. Although this information is the result of relative measurements, it gives us an idea about the spatial distribution of the measurements and the relative amount of surface deformation.

5. Conclusions

In this study, the Halabjah earthquake on November 12, 2017 was investigated using Sentinel-1 images. Determining surface deformation is an important task for earth scientists, planners, and also rescue teams. It is also important for the quick response of producing scientific outputs. This study was carried out using free datasets (i.e., Sentinel-1) by the ESA.
The number of studies of high accuracy will be increased by increasing the number of free datasets for scientists and researchers in the future. These types of various satellite images are required for determining and understanding our tectonically dynamic planet.

Acknowledgments

The authors would like to thank the ESA for serving Sentinel-1 datasets via the Web server.

Conflicts of Interest

The authors declare no conflict of interest.

References

  1. Turker, M.; San, B.T. Detection of collapsed buildings caused by the 1999 Izmit, Turkey earthquake through digital analysis of post-event aerial photographs. Int. J. Remote Sens. 2004, 25, 4701–4714. [Google Scholar] [CrossRef]
  2. Turker, M.; San, B.T. SPOT HRV data analysis for detecting earthquake-induced changes in Izmit, Turkey. Int. J. Remote Sens. 2003, 24, 2439–2450. [Google Scholar] [CrossRef]
  3. Mora, O.; Ordoqui, P.; Iglesias, R.; Blanco, P. Earthquake Rapid Mapping Using Ascending and Descending Sentinel-1 TOPSAR Interferograms. Procedia Comput. Sci. 2016, 100, 1135–1140. [Google Scholar] [CrossRef]
  4. User Guides—Sentinel-1 SAR—Level-1 Single Look Complex—Sentinel Online. Available online: https://sentinel.esa.int/web/sentinel/user-guides/sentinel-1-sar/resolutions/level-1-single-look-complex (accessed on 9 February 2018).
  5. Zuo, R.; Qu, C.; Shan, X.; Zhang, G.; Song, X. Coseismic deformation fields and a fault slip model for the Mw7.8 mainshock and Mw7.3 aftershock of the Gorkha-Nepal 2015 earthquake derived from Sentinel-1A SAR interferometry. Tectonophysics 2016, 686, 158–169. [Google Scholar] [CrossRef]
  6. Yague-Martinez, N.; Prats-Iraola, P.; Gonzalez, F.R.; Brcic, R.; Shau, R.; Geudtner, D.; Eineder, M.; Bamler, R. Interferometric Processing of Sentinel-1 TOPS Data. IEEE Trans. Geosci. Remote Sens. 2016, 54, 2220–2234. [Google Scholar] [CrossRef]
  7. M 7.3—29 km S of Halabjah, Iraq. Available online: https://earthquake.usgs.gov/earthquakes/eventpage/us2000bmcg#executive (accessed on 9 February 2018).
  8. Iran-Iraq Earthquake is Deadliest of 2017—CNN. Available online: https://edition.cnn.com/2017/11/12/middleeast/iraq-earthquake/index.html (accessed on 9 February 2018).
  9. Yekrangnia, M.; Eghbali, M.; Seyri, H.; Panahi, M.; Zanganeh, S.Y.; Beyti, M.; Hayatgheybi, D.S.V.; Nazarpour, M.; Amiri, G.G. A Preliminary Report on School Buildings Performance during M 7.3 Ezgeleh; Iran Earthquake of Participants Project Team Steering Committee Advisory Committee: Ezgeleh, Iran, 2017. [Google Scholar]
  10. Sun, J.; Shen, Z.-K.; Li, T.; Chen, J. Thrust faulting and 3D ground deformation of the 3 July 2015 Mw 6.4 Pishan, China earthquake from Sentinel-1A radar interferometry. Tectonophysics 2016, 683, 77–85. [Google Scholar] [CrossRef]
  11. Dai, K.; Li, Z.; Tomás, R.; Liu, G.; Yu, B.; Wang, X.; Cheng, H.; Chen, J.; Stockamp, J. Monitoring activity at the Daguangbao mega-landslide (China) using Sentinel-1 TOPS time series interferometry. Remote Sens. Environ. 2016, 186, 501–513. [Google Scholar] [CrossRef]
  12. Veci, L. Sentinel-1 Toolbox TOPS Interferometry Tutorial; ESA: Paris, France, 2016; pp. 1–20. [Google Scholar]
  13. Barra, A.; Monserrat, O.; Mazzanti, P.; Esposito, C.; Crosetto, M.; Scarascia Mugnozza, G. First insights on the potential of Sentinel-1 for landslides detection. Geomat. Nat. Hazards Risk 2016, 7, 1874–1883. [Google Scholar] [CrossRef]
  14. Zebker, H.A.; Lu, Y. Phase unwrapping algorithms for radar interferometr residue-cut least-squares, and synthesis algorithms. J. Opt. Soc. Am. A 1998, 15, 586–598. [Google Scholar] [CrossRef]
  15. Burgmann, R.; Rosen, P.A.; Fielding, E.J. Synthetic Aperture Radar Interferometry To Measure Earth’s Surface Topography and It’s Deformation. Annu. Rev. Earth Planet. Sci. 2000, 28, 169–209. [Google Scholar] [CrossRef]
  16. Hanssen, R.F. Radar Interferometry; Springer: Berlin, Germany, 2001; Volume 276, ISBN 0792369459. [Google Scholar]
Figure 1. Study area (from Google Earth).
Proceedings 02 00346 g001
Figure 2. Sentinel-1 data: 20171107 (a), and 20171119 (b).
Proceedings 02 00346 g002
Figure 3. Flow chart of the Sentinel-1 TOPS data coregistration.
Proceedings 02 00346 g003
Figure 4. Geocoded interferogram (a), and geocoded unwrapped phase (b).
Proceedings 02 00346 g004
Table 1. Detailed parameters of the Sentinel-1 data.
Master–Slave(yymmdd)Orbit DirectionTrackIncidence (Degree)Pixel Spacing in Slant Range (m)Pixel Spacing in Azimuth (m)Wavelength(cm)
20171107–20171119Descending641–462.313.95.6
Publisher’s Note: MDPI stays neutral with regard to jurisdictional claims in published maps and institutional affiliations.

