Smartphone Motion Mode Recognition †

Abstract
:1. Introduction
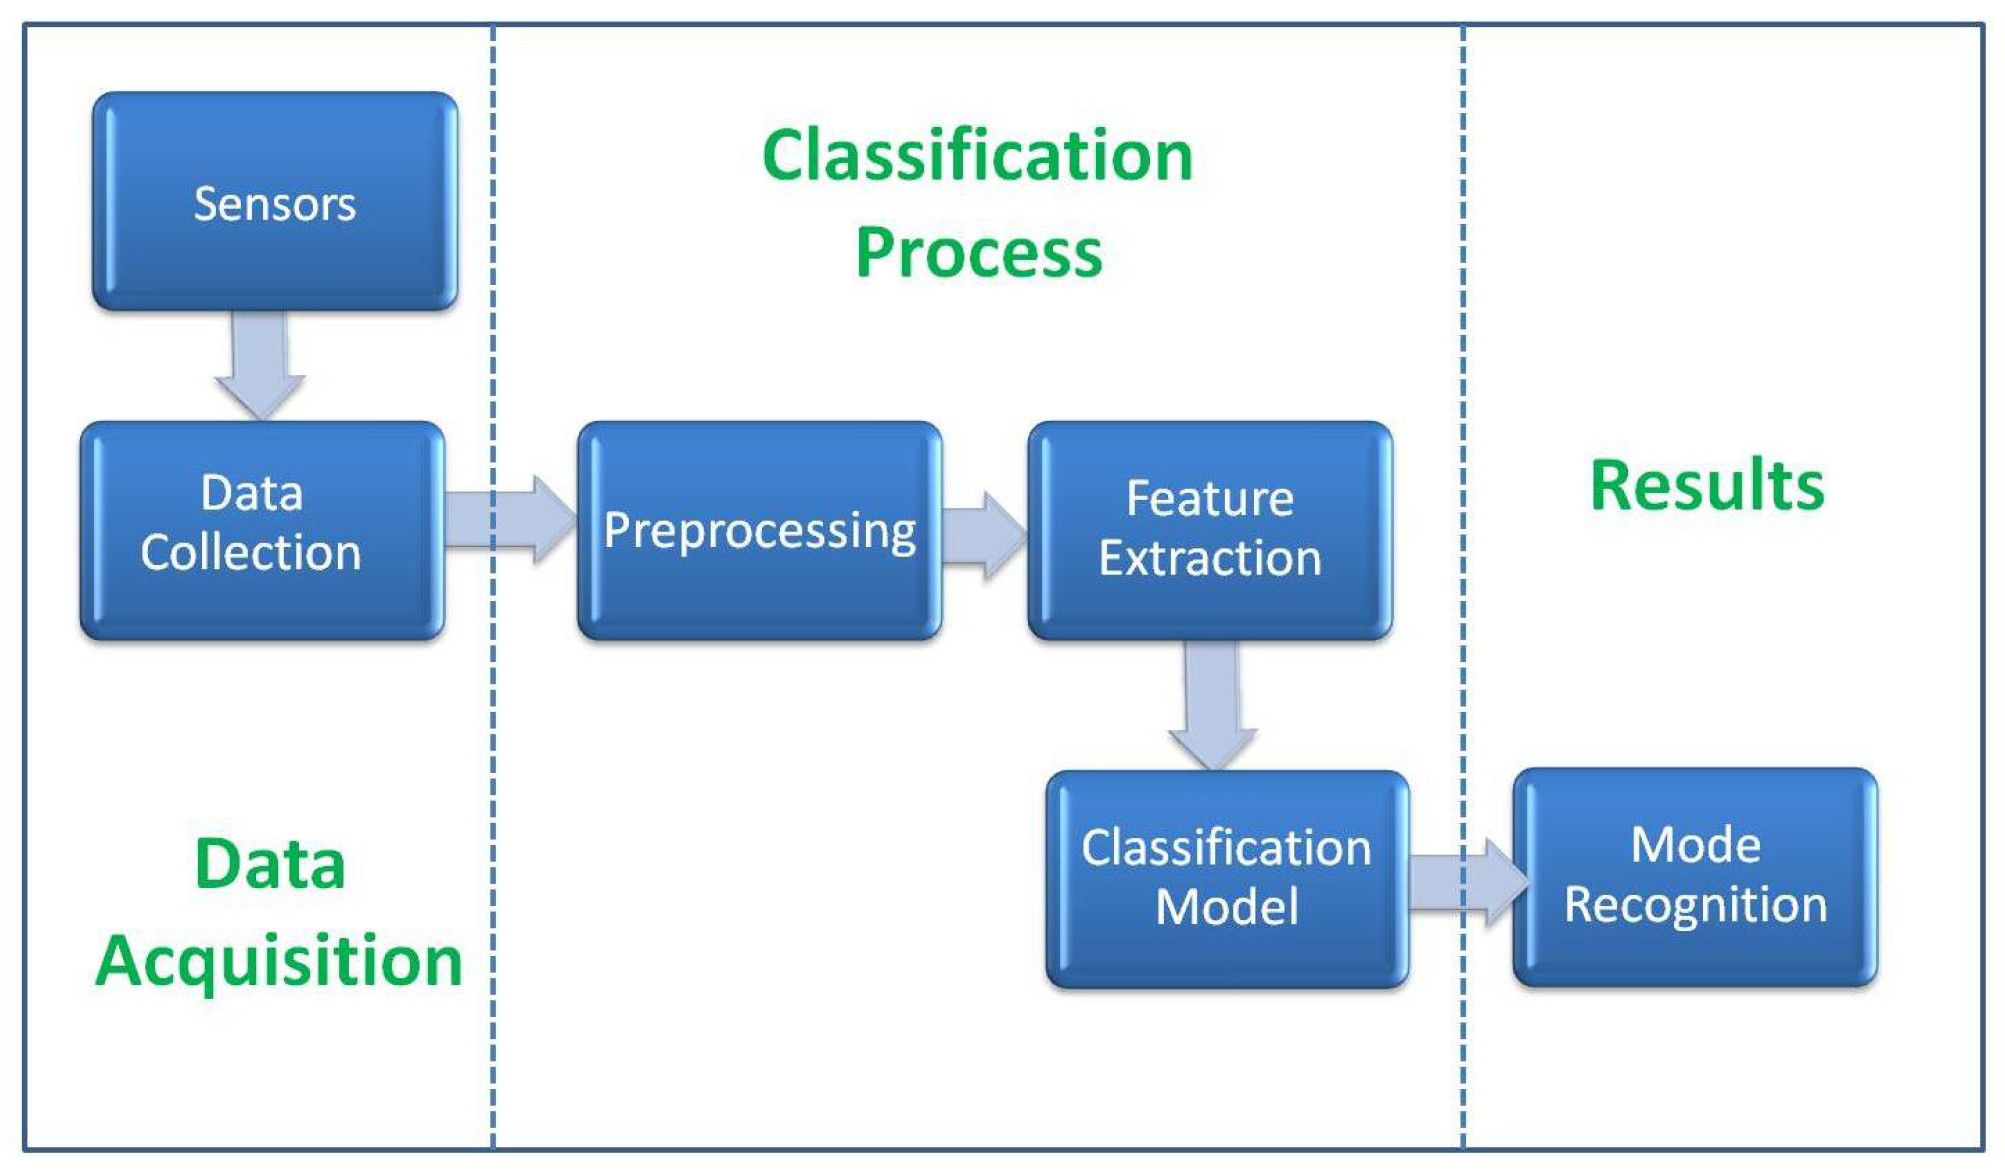
2. Methodology
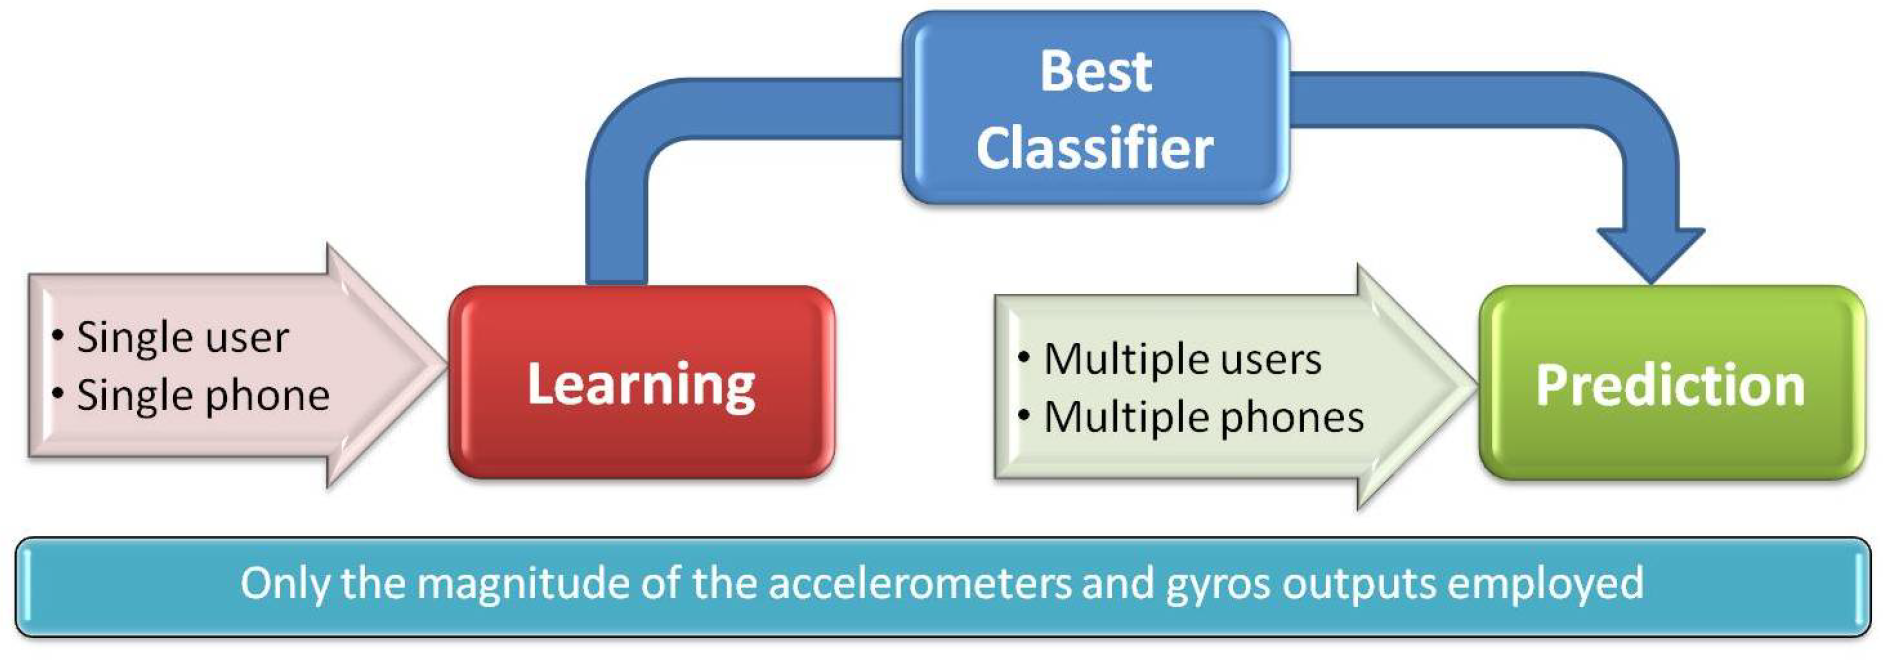
2.1. Strategy
2.2. Smartphone Sensors
2.3. Feature Extraction
2.3.1. Statistical Features
- Mean. The mean of a signal.
- Median. The median is the middle value separating the higher half of a data sample from the lower half.
- Standard deviation. The square root of the variance (measure of the spread of data around the mean).
- Average absolute difference. Measure of the spread of data around its mean, taking the absolute difference between values and the mean.
- Interquartile range (iqr). It is the difference between 75th percentile and 25th percentile of the data where percentile of is the value separating the higher 100- of a data sample from the lower of the data.
- Skewness. A measure of the asymmetry of the probability distribution of a signal.
- Kurtosis. A measure of the ‘tailedness’ of the probability distribution of a signal.
- Signal energy. The sum of the squares of signal values.
- Signal magnitude area. The sum of absolute values of a signal.
- Max. The maximum value in the window of the signal.
- Min. The minimum value in the window of the signal.
- Amplitude. The absolute difference between the maximum value and minimum value.
2.3.2. Time-Domain Features
- Number of peaks. The count of the number of maximum points within the desired window of the signal where the maximum points should be above a predefined value and located after w samples from the last maximum point.
2.3.3. Cross Sensor Features
- Gyro-Accelerometer Correlation. Is the cross-correlation coefficient between the gyro and acceleration sensors.
- Gyro-Accelerometer Maximum. The multiplication result of the gyro and acceleration maximum values.
- Gyro-Accelerometer Standard Deviation. The multiplication result of the gyro and acceleration standard deviation values.
3. Experimental Results and Discussion
3.1. Experimental Setup
3.2. The Learning Process
4. Conclusions
Conflicts of Interest
References
- Rainer, M. Indoor Positioning Technologies. Ph.D. Thesis, Swiss Federal Institute of Technology Zurich, Zurich, Switzerland, 2012. [Google Scholar]
- Groves, P.D. Principles of GNSS, Inertial and Multisensor Integrated Navigation Systems, 2nd ed.; Artech House: Norwood, MA, USA, 2013. [Google Scholar]
- Cliff, C.; Randell, D.; Muller, H.L. Personal position measurement using dead reckoning. In Proceedings of the Seventh IEEE International Symposium on Wearable Computers, White Plains, NY, USA, 21–23 October 2003; pp. 166–173. [Google Scholar]
- Beauregard, S.; Haas, H. Pedestrian Dead Reckoning: A Basis for Personal Positioning. In Proceedings of the 3rd Workshop on Positioning, Navigation and Communication, Hannover, Germany, 16 March 2006. [Google Scholar]
- Qian, L.; Ma, J.; Ying, R.; Liu, P.; Pei, P. An improved indoor localization method using smartphone inertial sensors. In Proceedings of the International Conference on Indoor Positioning and Indoor Navigation (IPIN), Montbeliard-Belfort, France, 28–31 October 2013; pp. 1–7. [Google Scholar]
- Elhoushi, M.; Georgy, J.; Noureldin, A.; Korenberg, M. Online motion mode recognition for portable navigation using low-cost sensors. J. Inst. Navig. 2015, 62, 273–290. [Google Scholar] [CrossRef]
- Elhoushi, M.; Georgy, J.; Noureldin, A.; Korenberg, M. A Survey on approaches of motion mode recognition using sensors. IEEE Trans. Intell. Transp. Syst. 2017, 18, 1662–1686. [Google Scholar] [CrossRef]
- Jekeli, C. Inertial Navigation Systems with Geodetic Applications; Walter de Gruyter: Berlin, Germany, 2000. [Google Scholar]
- Titterton, D.H.; Weston, J.L. Strapdown Inertial Navigation Technology, 2nd ed.; The American Institute of Aeronautics and Astronautics and the institution of electrical engineers: Reston, VA, USA, 2004. [Google Scholar]
- Kempe, V. Inertial MEMS Principles and Practice; Cambridge University Press: Cambridge, UK, 2011. [Google Scholar]
- Hastie, T.; Tibshirani, R.; Friedman, J. The Elements of Statistical Learning, Data Mining, Inference and Prediction, 2nd ed.; Springer: Berlin, Germany, 2009. [Google Scholar]
- Raschka, S. Python Machine Learning; Packt Publishing: Birmingham, UK, 2016. [Google Scholar]


| Mode | Number of Windows Training | Number of Windows Test |
|---|---|---|
| 38,492 | 6320 | |
| Swing | 60,812 | 17,523 |
| Talking | 27,697 | 7348 |
| Texting | 27,434 | 13,655 |
| Classifier | Accuracy (%) |
|---|---|
| MLP | 86.2 |
| SVM | 84.1 |
| KNN | 82.7 |
| RF | 86.7 |
Publisher’s Note: MDPI stays neutral with regard to jurisdictional claims in published maps and institutional affiliations. |
© 2018 by the authors. Licensee MDPI, Basel, Switzerland. This article is an open access article distributed under the terms and conditions of the Creative Commons Attribution (CC BY) license (https://creativecommons.org/licenses/by/4.0/).
Share and Cite
Klein, I.; Solaz, Y.; Ohayon, G. Smartphone Motion Mode Recognition. Proceedings 2018, 2, 145. https://doi.org/10.3390/ecsa-4-04929
Klein I, Solaz Y, Ohayon G. Smartphone Motion Mode Recognition. Proceedings. 2018; 2(3):145. https://doi.org/10.3390/ecsa-4-04929
Chicago/Turabian StyleKlein, Itzik, Yuval Solaz, and Guy Ohayon. 2018. "Smartphone Motion Mode Recognition" Proceedings 2, no. 3: 145. https://doi.org/10.3390/ecsa-4-04929
APA StyleKlein, I., Solaz, Y., & Ohayon, G. (2018). Smartphone Motion Mode Recognition. Proceedings, 2(3), 145. https://doi.org/10.3390/ecsa-4-04929