Abstract
User footprint left in Virtual Learning Environments (VLE) can be used to monitor the learning process, to reduce dropout rates by identifying risk cases, to ensure and improve quality, and could be precursor of the, so persecuted, adaptive or personalized learning. All of this has opened a new field of research in education called Learning Analytics (LA). The objective of the present work is to apply LA methodology for analyzing the behavior of students with regards to Moodle activities and resources with the final aim of improving learning outcomes. The data collected from the Moodle platform are analyzed in spreadsheets, without help of any specific tool, and compared for the last three academic years. Specifically, results of general activity, visualization of educational videos, parameters related to solve different questionnaires and use of other learning resources are here presented and discussed.
1. Introduction
Educational platforms, such as Moodle or BlackBoard, have become the habitual University environment of communication between students and teachers, where multimedia resources are easily distributed. Thanks to new functionalities, such as forums, wikis or questionnaires, they are increasingly also used for learning and evaluation purposes. In this Virtual Learning Environments (VLE), each user leaves a digital footprint of their activities that can be analyzed and processed to establish patterns of behavior or learning and can be used to inform the student and the teacher about the learning progress, even to predict the final success [1]. All this has opened a new field of research, Learning Analytics (LA) whose potential is only beginning to be glimpsed at present [2,3,4].
The present work applies LA to find the most influential factors on learning outcomes. Specifically, the data collected during the last three academic years from the Moodle platform are here presented for the subject of Engineering Thermodynamics.
2. Materials and Methods
The present study has been carried out with students of the subject “Engineering Thermodynamics and Fundamentals of Heat Transmission” of the Degree in Engineering of Industrial Technologies at the University of Zaragoza. Specifically, data from the academic courses 2015–2016, 2016–2017 and 2017–2018 will be compared.
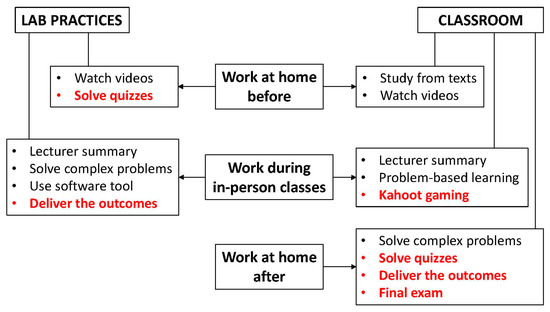
Figure 1 summarizes the work of the student in the subject, both for laboratory sessions and master classes, indicating in red the assessment activities. The teaching methodology follows the flipped classroom model in some extent (see details Ref. [5]).

Figure 1.
Summary of student’s activities.
Since most of the evaluation and a lot of learning activities are done through Moodle, there is a large amount of available information that can be used to monitor the teaching-learning process.
In the following section, the data recorded during the last three academic years are presented and compared (further details in Refs. [6,7]).
3. Results
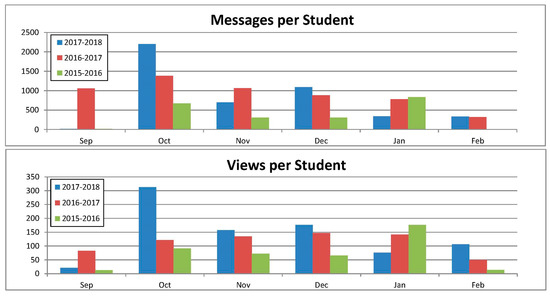
Global activity in Moodle can be found in the menu Administration/Reports/Statistics. Views include passive user activities, while Messages refer to active user responses [8]. The graphs of Figure 2 show the results of the last three courses from September to February.

Figure 2.
Global activity in Moodle Platform.
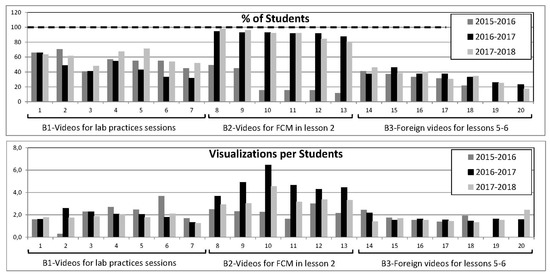
A total of 20 teaching videos are currently being used in the subject. The results obtained from the opinion surveys carried out on the students were very positive and were analyzed in detail in previous publications [6,9]. The percentage of students who have seen at least once the video and the average number of visualizations per student are show in Figure 3.

Figure 3.
Summary about the use of educational videos.
Table 1 show the student’s participation and time dedicated to solve questionnaires for assessment (5% of final grade) and self-assessment (not compulsory). Regarding the former, the spent time has been reduced more than 50%, while the mean grade has risen 2 points. Taking into account the final success, it could be said that there have been bad practices in this activity.

Table 1.
Questionnaires for assessment (cols. 2–6): percentage of students (S), number of attempts per students (A/S), time spent in each attempt (T/A), time spent per question (T/Q) and mean grade. Questionnaires for self-assessment (cols. 7–9): total attempts (A), percentage of students (S) and number of attempts per students (A/S).
As for the self-assessment questionnaires, the percentage of students who made at least one attempt is 10 percentage points higher during the 2016–2017 course, although the number of attempts per student is lower than in the previous course.
Table 2 shows the number of students enrolled in each course, the average grades in different activities and the percentage of students who passed the exam in the first call.

Table 2.
Comparison of learning outcomes.
5. Conclusions
In the current paper, the data collected from the Moodle platform for the subject “Engineering Thermodynamics and Fundamentals of Heat Transmission” of the Degree in Engineering of Industrial Technologies at the University of Zaragoza were presented and analyzed in spreadsheets, and compared for the last three academic years with some learning success indicator. Some conclusions can be extracted from this study and some solutions are proposed to improve the learning outcomes in next courses.
- It is essential to reduce the possibilities of copying in the assessment tasks.
- Regarding laboratory sessions, it could be useful to make a brief evaluation at the beginning of the session, being able to practice only the students who have actually prepared it.
- As for guided tasks, the use of forms to introduce the results during this course has the advance of automating the correction, but it seems to have encouraged the fraudulent copy, since many more cases have been detected than in previous courses. It will be necessary to take coercive measures or design multiple cases to reduce it.
- Although it is not really the role of the teacher, it seems necessary to remind the student the usefulness of non-compulsory resources such as videos, self-assessment questionnaires or summaries to carry out meaningful and effective learning.
- Implementing an evaluation by rubrics so that the student has clear progress in the course, could be motivating but the teacher has to find an efficient way to manage them, since Moodle tool is not an acceptable option in large groups as for the case study [10].
Finally, it should be noted that the study would be more effective in predicting the success rate if the analysis of the data had been done per student, instead of using average values. However, this task is very time-consuming if automated tools are not available.
Acknowledgments
This work was financed by the Innovation project PIIDUZ_17_299 (Program for Promoting Teaching Innovation at the University of Zaragoza).
References
- Boyer, A.; Bonnin, G. Higher Education and the Revolution of Learning Analytics. Report of the International Council for Open and Distance Education (ICDE). 2016. Available online: icde.memberclicks.net/assets/RESOURCES/anne_la_report%20cc%20licence.pdf (accessed on 18 April 2018).
- Sclater, N.; Peasgood, A.; Mullan, J. Learning Analytics in Higher Education: A review of UK and international practice. Full Report of Jisc (UK). 2016. Available online: www.jisc.ac.uk/reports/learning-analytics-in-higher-education (accessed on 18 April 2018).
- Wanli, X.; Rui, G.; Eva, P.; Sean, G. Participation-based student final performance prediction model through interpretable Genetic Programming: Integrating learning analytics, educational data mining and theory. Comput. Hum. Behav. 2015, 47, 168–181. [Google Scholar]
- Ferguson, R.; Brasher, A.; Clow, D.; Cooper, A.; Hillaire, G.; Mittelmeier, J.; Rienties, B.; Ullmann, T.; Vuorikari, R. Research Evidence on the Use of Learning Analytics—Implications for Education Policy; Vuorikari, R., Castaño Muñoz, J., Eds.; JRCSP Report; EUR 28294 EN, 2016. Available online: publications.jrc.ec.europa.eu/repository/bitstream/JRC104031/lfna28294enn.pdf (accessed on 18 April 2018).
- Peña, B.; Zabalza, I.; Usón, S.; Llera, E.M.; Martínez, A.; Romeo, L.M. Experiencia piloto de aula invertida para mejorar el proceso de enseñanza-aprendizaje en la asignatura de Termodinámica Técnica. In Actas del Congreso INRED 2017; Universidad Politécnica de Valencia: Valencia, Spain, 2017; Available online: http://ocs.editorial.upv.es/index.php/INRED/INRED2016/paper/view/4430 (accessed on 18 April 2018). [CrossRef]
- Zabalza, I.; Peña, B.; Llera, E.M.; Usón, S.; Martínez, A.; Romeo, L.M. Development of educational videos as reusable learning objects for their integration into an Open Courseware on fundamentals of thermodynamics and thermal engineering. In Proceedings of the 11th Annual International Technology, Education and Development Conference (INTED17), Valencia, Spain, 6–8 March 2017; IATED Academy: Valencia, Spain, 2017; pp. 4453–4461. [Google Scholar] [CrossRef]
- Peña, B. Uso de recursos y rendimiento en las actividades evaluación: Análisis y comparación de resultados en el Grado en Ingeniería de Tecnologías Industriales. In Actas del Congreso INRED 2018; Universidad Politécnica de Valencia: Valencia, Spain, 2018; Available online: http://ocs.editorial.upv.es/index.php/INRED/INRED2018/paper/viewFile/8583/4153 (accessed on 30 August 2018). [CrossRef]
- Moodle.org. Course Overview Report. 2013. Available online: docs.moodle.org/25/en/Course_overview_report (accessed on 19 April 2018).
- Zabalza, I.; Peña, B.; Llera, E.M.; Usón, S. Improving the teaching-learning process using educational videos as reusable learning objects in the field of Thermal Engineering. In Proceedings of the 8th International Conference on Education and New Learning Technologies (EDULEARN16), Barcelona, Spain, 4–6 July 2016; IATED Academy: Barcelona, Spain, 2016; pp. 363–372. [Google Scholar] [CrossRef]
- Peña, B. Defining quantitative and automated rubrics from assessment activities scores. In Proceedings of the 10th Annual International Technology, Education and Development Conference (EDULEARN18), Palma de Mallorca, Spain, 2–4 July 2018; IATED Academy: Valencia, Spain, 2018; pp. 2054–2058. [Google Scholar] [CrossRef]
Publisher’s Note: MDPI stays neutral with regard to jurisdictional claims in published maps and institutional affiliations. |
© 2018 by the author. Licensee MDPI, Basel, Switzerland. This article is an open access article distributed under the terms and conditions of the Creative Commons Attribution (CC BY) license (https://creativecommons.org/licenses/by/4.0/).