Extended Abstract

Study of pH Changes in Media during Bacterial Growth of Several Environmental Strains †

by
Rubén Sánchez-Clemente
,
María Isabel Igeño
,
Ana G. Población
,
María Isabel Guijo
,
Faustino Merchán
and
Rafael Blasco
*
Departamento de Bioquímica y Biología Molecular y Genética, Facultad de Veterinaria, and Instituto Universitario de Investigación de Carne y Productos Cárnicos (IProCar), Universidad de Extremadura, 10003 Cáceres, Spain
*
Author to whom correspondence should be addressed.
Presented at Environment, Green Technology and Engineering International Conference (EGTEIC 2018), Caceres, Spain, 18–20 June 2018.
Proceedings 2018, 2(20), 1297; https://doi.org/10.3390/proceedings2201297
Published: 22 October 2018

Abstract

:
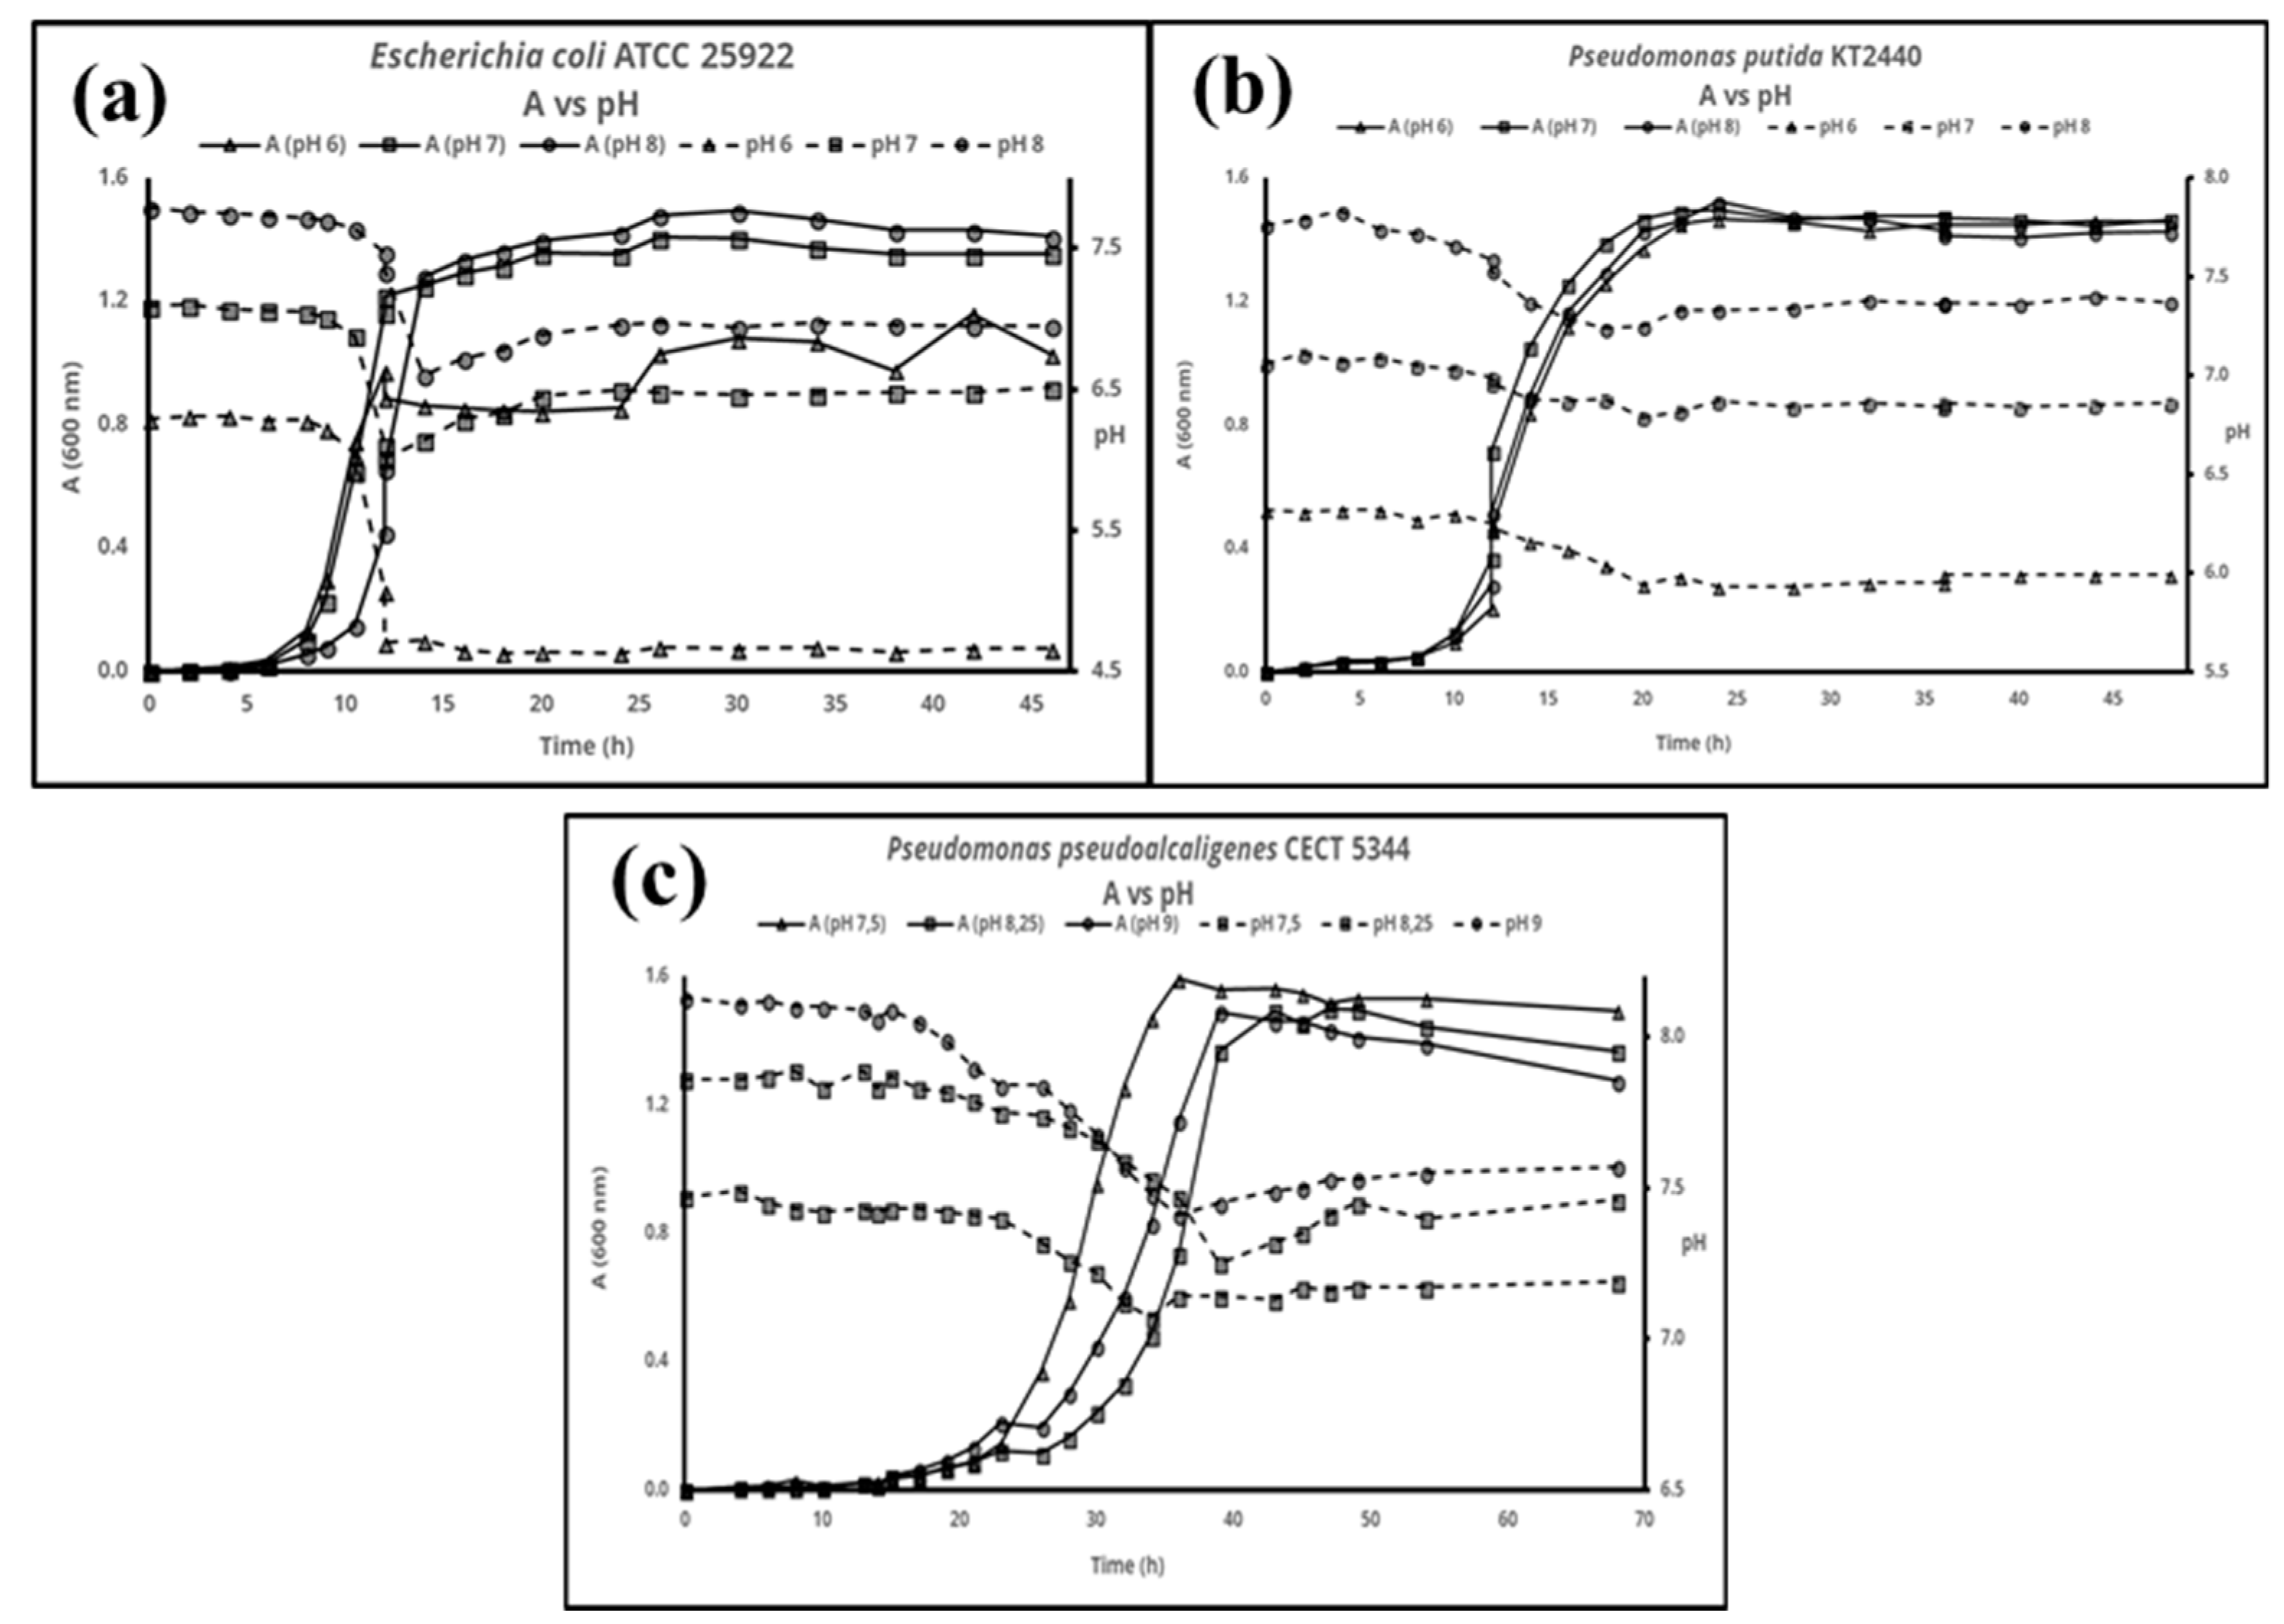
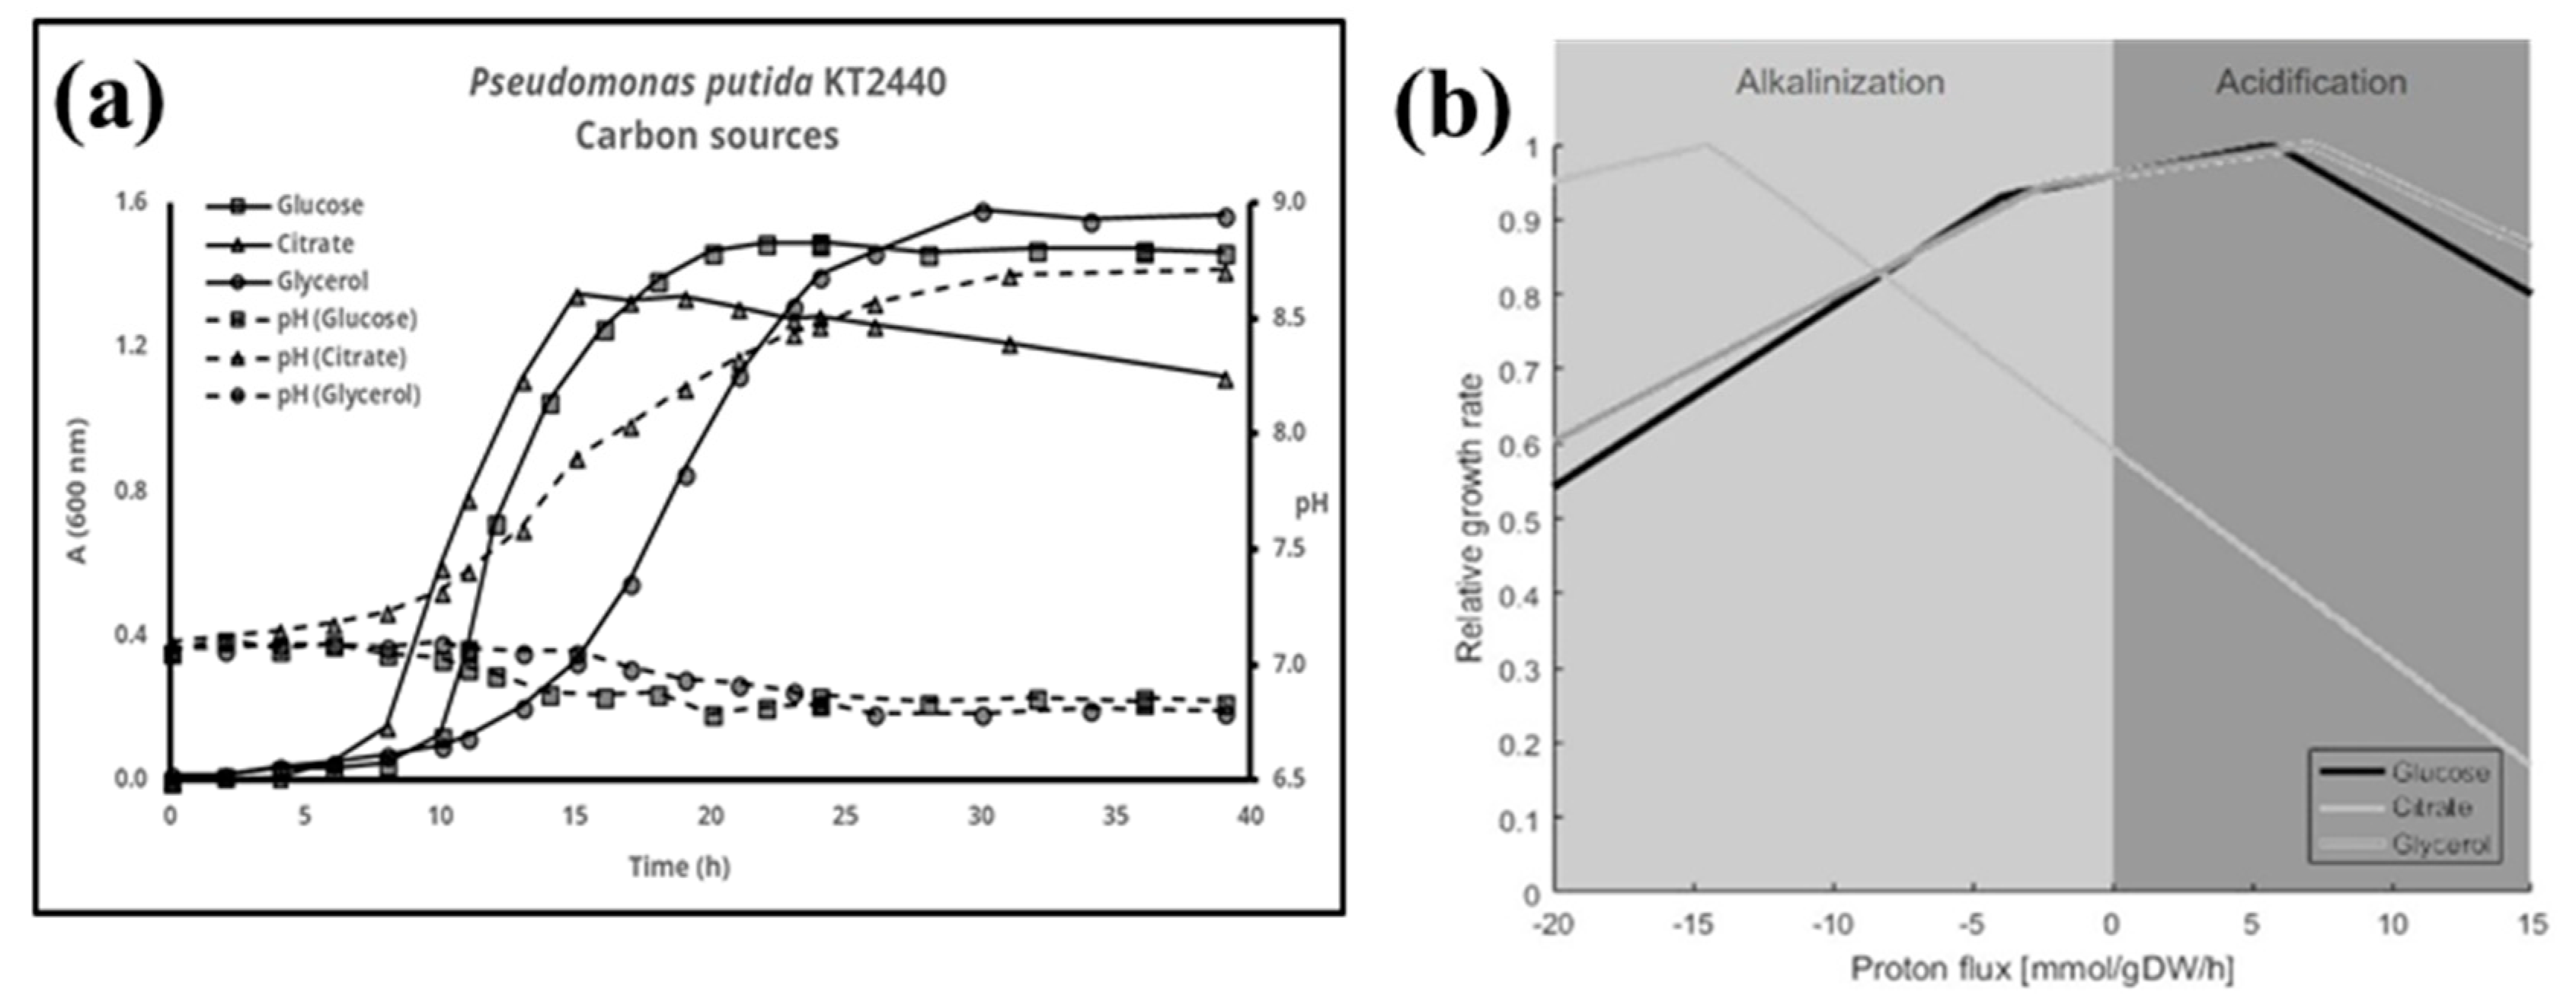
The effect of pH on bacterial cell-growth and the evolution of extracellular pH triggered by bacterial growth has been monitored for three bacterial strains, Escherichia coli ATCC 25922 and Pseudomonas putida KT2440 as reference strains, and Pseudomonas pseudoalcaligenes CECT 5344 because of its capacity to assimilate cyanide as the sole nitrogen source under alkaline conditions. In a first instance, the influence of the initial pH in the growth curve has been texted in LB-medium adjusted to pH 6, 7 and 8, for E. coli and P. putida, and 7.5, 8.25 and 9 for P. pseudoalcaligenes. Although the initial pH were different, the pH of the extracellular medium at the end of the stationary phase converged to a certain pH that is specific for each bacterium. Similar experiments were carried out in minimal medium with glucose as the carbon source. In this case, the pHs of the culture of both Pseudomonadaceae strains were almost constant, whereas it suddenly dropped during the exponential growth phase of E. coli. When the initial pH was 6 the extracellular pH fell sharply to 4.5, which irreversibly prevented further cellular growth. Nevertheless, at higher initial pH values subsequent cellular growth of E. coli restored the medium to the initial pHs values. Finally, in all cases the evolution of the pH has been shown to depend on the carbon source used. Among the sources used, cellular growth with glucose or glycerol did not affect the extracellular pH, whereas citrate caused the alkalinization of the media. This phenotype is in concordance with computational predictions, at least in the case of the genome-scale metabolic model of Pseudomonas putida KT2440.

1. Introduction

The pH homeostasis in metabolism is critical for several reasons. First, because the structure/function of biological macromolecules, especially proteins, depends on the pH. Second, because pH, as any other cellular metabolite concentration, may affects the kinetic and thermodynamic force of chemical reactions involving protons as metabolites. Finally, because pH changes severely affect the energetic metabolism, provided that the proton motive force use to be the main source of electrochemical potential for ATP synthesis. There are molecular mechanism to maintain intracellular pHs under certain values in the different subcellular compartments. In eukaryotes, mitochondria and chloroplast are surrounded by the cytoplasm, which exhibit strict pH homeostasis [1]. In contrast, bacteria thrive in different habitats, and the pH of the environment affect the lifestyle and is the basis for classifying them into acidophiles (pH 1–3), alkalophiles (pH 10–13) and neutralophiles (pH 5.5–9). Nevertheless, as in eukarya, the intracellular pH of bacteria is close to neutrality and remains almost constant in order to preserve the metabolic capacity and cellular integrity. Bacterial pH-homeostasis include diverse mechanism for direct sensing and adapting to extracellular pH [2]. The extracellular pH may changes due to several factors. The first variable is the initial pH and composition of the media. The second is the growth phase, and the third the physiology and optimum pH of the bacterium. Metabolism itself may change the extracellular pH. Therefore, bacterial growth of a certain bacterial strain may disturbs the bacterial growth of neighboring strains sharing the same ecological niche, and these changes can decide the fate of bacterial populations [3]. From this point of view, understanding pH homeostasis may have implications and applications in fields as diverse as bioremediation assays or the behavior of pathogenic bacteria.
There are many studies describing how the initial pH of the media affects bacterial growth, or the production of certain metabolites, but only a few studying the evolution of the pH of the medium during microbial growth. The aim of this work was to describe ant understanding the pH changes during bacterial growth identifying the factors involved in these variations. As a proof of concept, we have demonstrated that the “in silico” prediction of the pH evolution using a well-curated genome-scale metabolic model of Pseudomonas putida KT2440 [4] agrees to the experimental pH variation, at least with glucose, glycerol and citrate as carbon sources.

2. Materials and Methods

Liquid Culture media: Prior autoclaving, LB media was adjusted to desired pHs with NaOH. M63 minimal medium was adjusted at the desired pHs with KOH. Glucose, citrate and glycerol were used as carbon source at a final concentration 4 g/L. Cells were cultured aerobically in orbitary shakers at 200 rpm, and 30 °C for Pseudomonas and 37 °C for E. coli. Bacterial Cell growth was followed turbidimetrically at 600 nm. The culture pH was measured with a conventional pH electrode (CRISON). Genome-scale metabolic model for Pseudomonas putida was iJN1411 [4]. The script used for the evaluation of the proton exchange as a function of the carbon source has been previously described [5].

3. Results

In order to evaluate the pH change during bacterial growth, E. coli ATCC 25922 and P. putida KT2440, were used as neutralophilic reference organisms, whereas P. pseudoalcaligenes CECT 5344 was choose as an alkaliphilic bacterium with a great biotechnological potential [6]. In a first instance, the evolution of the pH was followed in cultures of the three bacterial strains in LB medium adjusted to different pHs (Figure 1).
Similar experiments were ran in defined minimal M63 media with glucose (4 g/L) as the sole carbon source (Figure 2).
Glucose has an oxidation number of 0, been a readily consumable C-source for may bacteria. Nevertheless, in natural habitats glucose availability use to be scarce. For this reason, glycerol (as constituent of lipids), and citrate (as Krebs cycle metabolite) were also used in similar experiments. The result was that, fixing the initial pH, the pH of the culture evolves depending on the C-source used. Figure 3a shows the cell-growth and the evolution of the pH of the culture media of P putida KT2440 using glucose, glycerol or citrate as the sole C-source, starting at pH 7. Since a metabolic model is available for P. putida KT2440 [4], including an script for evaluating the effect of modifying the proton-exchange flux on the growth rate [5], the predicted evolution of the pH was computed using the same C-sources (Figure 3).

4. Discussion

By using the same medium (LB), it is evident that the evolution of the pH depends mainly on the bacterial strain (Figure 1). LB is widely used in microbiology, but its composition can vary [7]. Therefore, instead of LB, Glucose, at a final concentration of 4 g/L, in the defined minimal medium described in Material and methods, was used (Figure 2).
The assimilation of glucose by E. coli caused a severe drop in the external pH (Figure 2). E. coli has been shown to transiently accumulate acetate during aerobic growth with glucose, and the inhibitory effect of this compound has been described [8]. Moreover, here we show that when the initial pH is below 6, the medium becomes so acid (around 4.5) that the bacterium can nor restart growth. The drop was similar at initial pH of 7 and 8, but under these circumstances the metabolism of the bacterium re-equilibrated the pH to a pH similar to the initial values. Similar behavior was observed for both Pseudodomonaceae, that is, a final pH similar to the initial one with glucose as C-source.

Acknowledgments

Financed by IB16062, Junta de Extremadura (Consejería de Economía e Infraestructuras), Fondo Europeo de Desarrollo Regional, European Union. Ana Gómez Población acknowledge a fellowship from the Fundación Tatiana Pérez de Guzmán el Bueno. We thank Juan Nogales for his help in metabolism modeling of P. putida.

Conflicts of Interest

The authors declare no conflict of interest.

References

  1. Casey, J.R.; Grinstein, S.; Orlowski, J. Sensors and regulators of intracellular pH. Nat. Rev. Mol. Cell Biol. 2009, 11, 50. [Google Scholar] [CrossRef] [PubMed]
  2. Krulwich, T.A.; Sachs, G.; Padan, E. Molecular aspects of bacterial pH sensing and homeostasis. Nat. Rev. Microbiol. 2011, 9, 330–343. [Google Scholar] [CrossRef] [PubMed]
  3. Ratzke, C.; Gore, J. Modifying and Reacting to the Environmental pH Drives Bacterial Interactions. bioRxiv 2017. [Google Scholar] [CrossRef]
  4. Nogales, J.; Gudmundsson, S.; Duque, E.; Ramos, J.L.; Palsson, B.O. Expanding The Computable Reactome In Pseudomonas putida Reveals Metabolic Cycles Providing Robustness. bioRxiv 2017. [Google Scholar] [CrossRef]
  5. Nogales, J.; Gudmundsson, S.; Knight, E.M.; Palsson, B.O.; Thiele, I. Detailing the optimality of photosynthesis in cyanobacteria through systems biology analysis. Proc. Natl. Acad. Sci. USA 2012, 109, 2678–2683. [Google Scholar] [CrossRef]
  6. Luque-Almagro, V.M.; Acera, F.; Igeño, M.I.; Wibberg, D.; Roldán, M.D.; Sáez, L.P.; Hennig, M.; Quesada, A.; Huertas, M.J.; Blom, J.; et al. Draft whole genome sequence of the cyanide-degrading bacterium Pseudomonas pseudoalcaligenes CECT5344. Environ. Microbiol. 2013, 15, 253–270. [Google Scholar] [CrossRef] [PubMed]
  7. Sezonov, G.; Joseleau-Petit, D.; D’Ari, R. Escherichia coli Physiology in Luria-Bertani Broth. J. Bacteriol. 2007, 189, 8746–8749. [Google Scholar] [CrossRef] [PubMed]
  8. Luli, G.W.; Strohl, W.R. Comparison of growth, acetate production, and acetate inhibition of Escherichia coli strains in batch and fed-batch fermentations. Appl. Environ. Microbiol. 1990, 56, 1004–1011. [Google Scholar] [CrossRef] [PubMed]
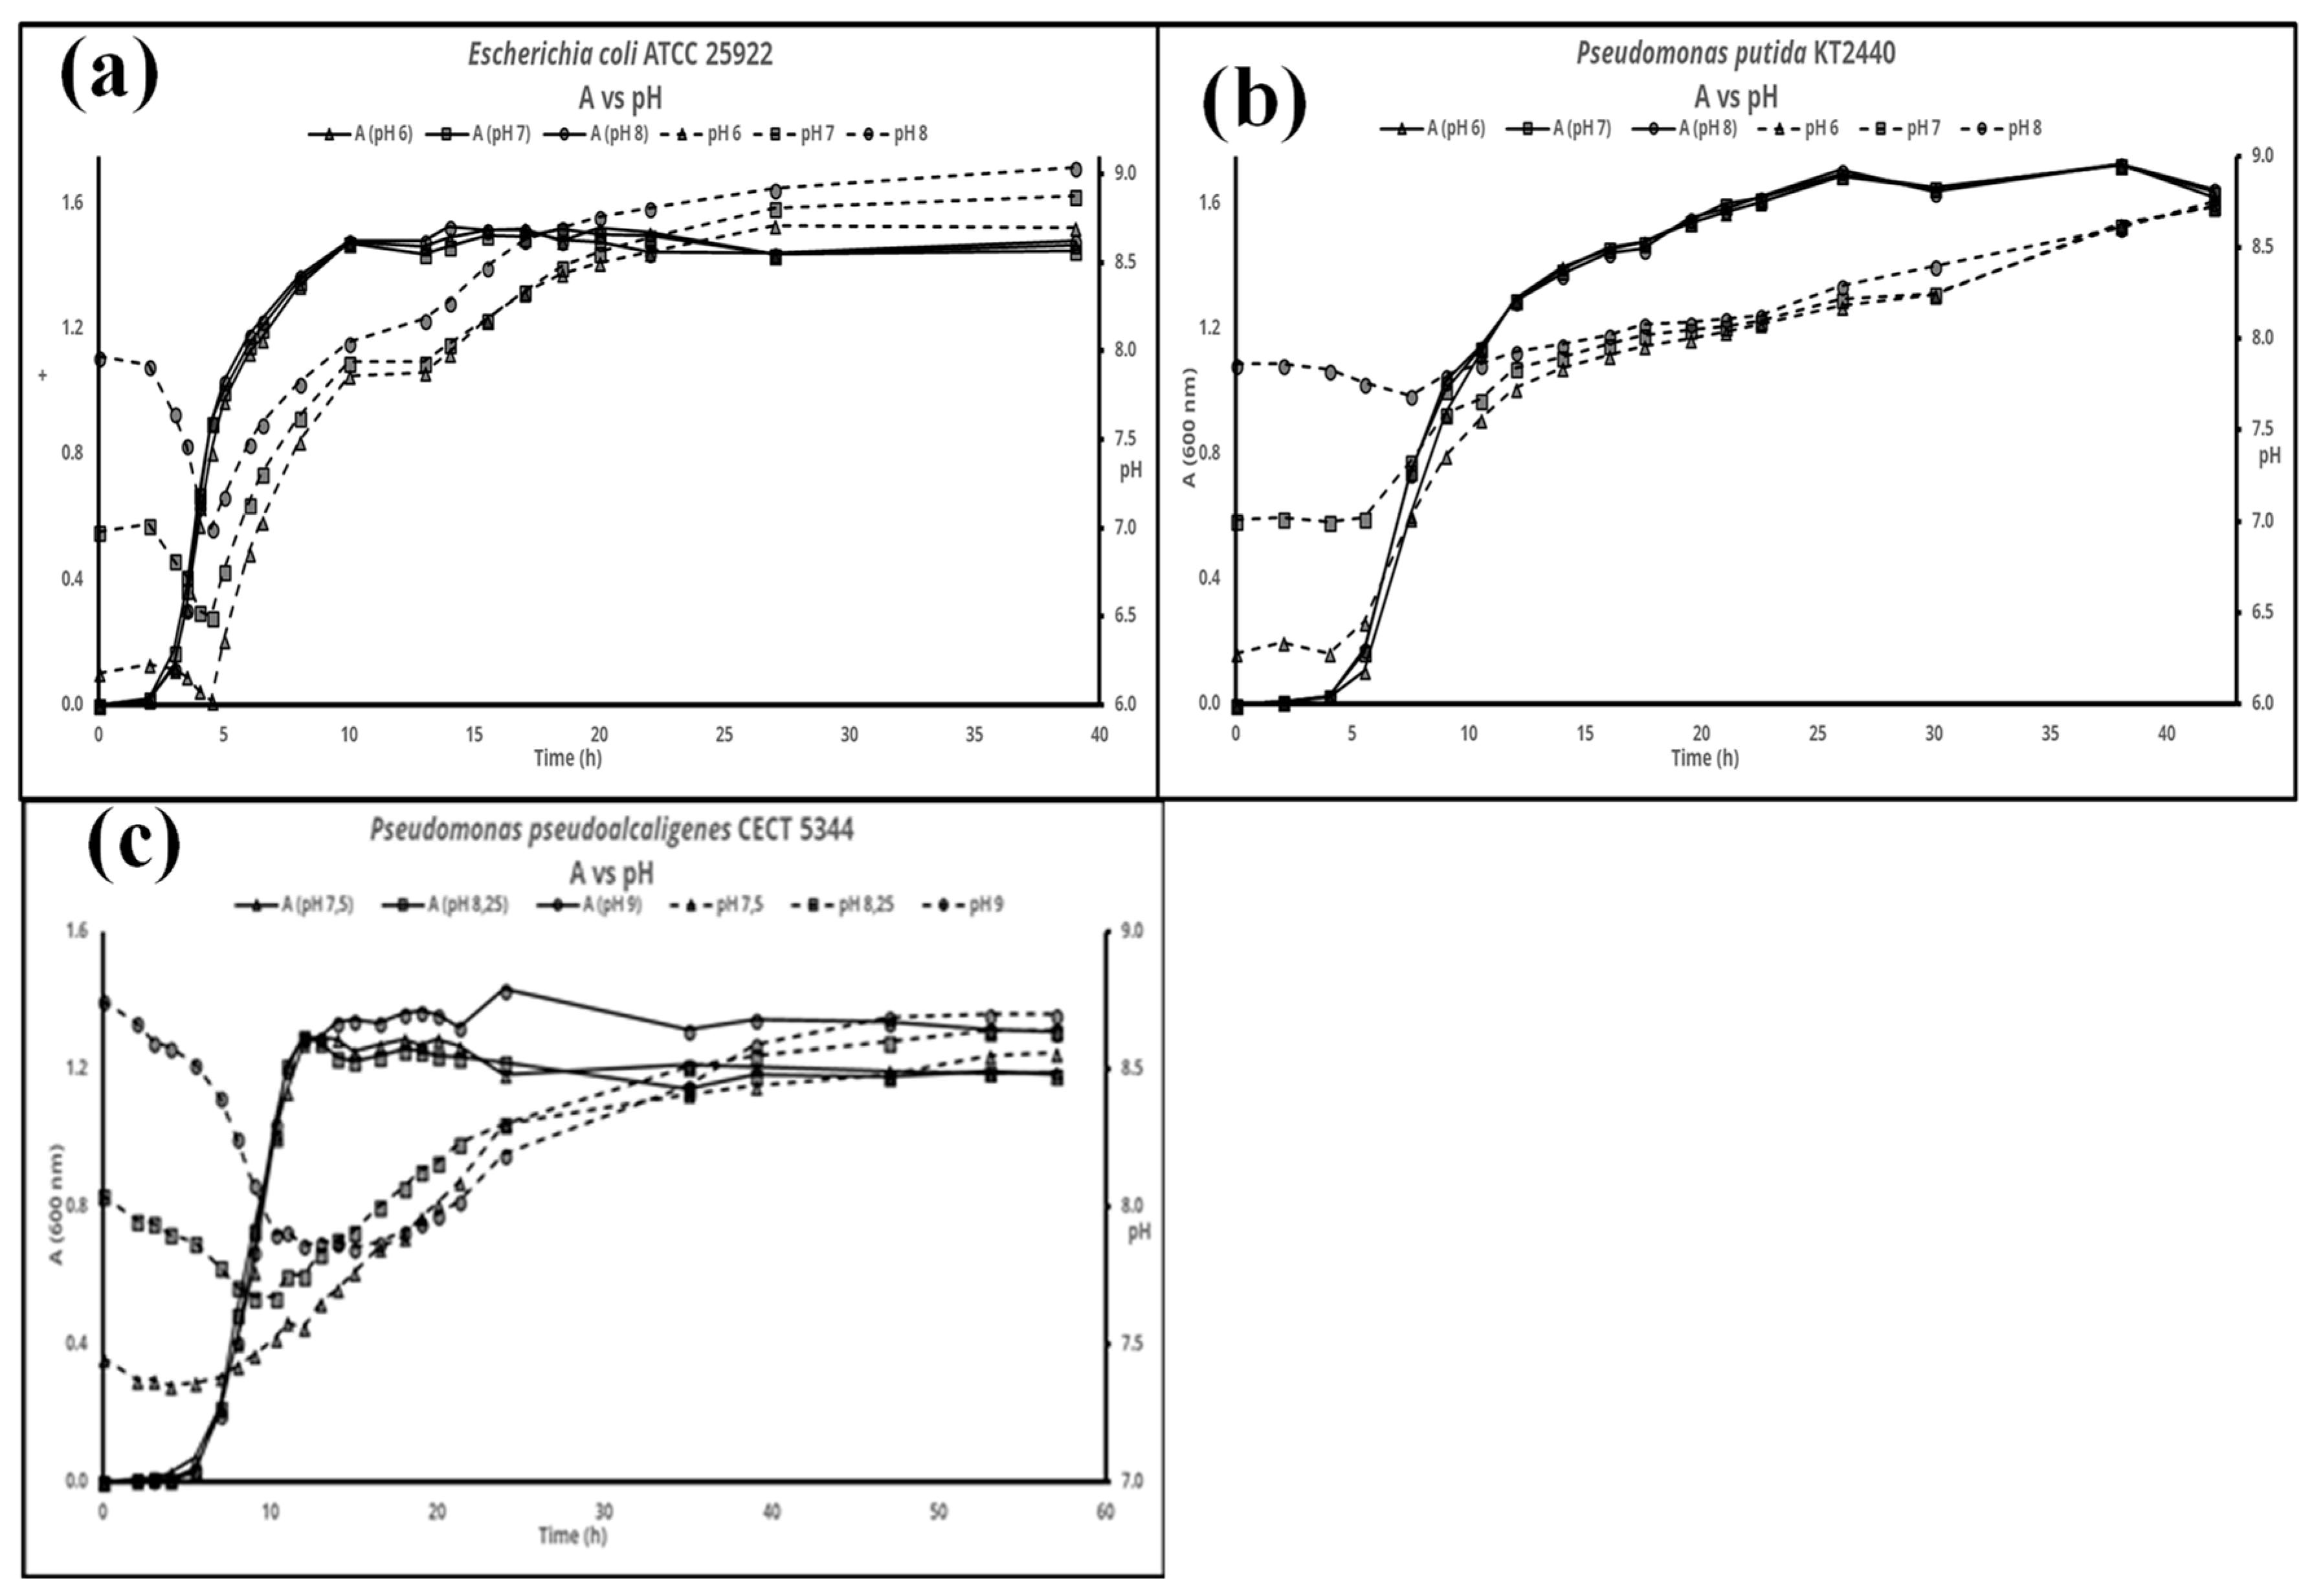
Figure 1. Evolution of the pH during the bacterial growth in LB media at different initial pHs: (a) E. coli ATCC 25922, (b) P. putida KT2440 and (c) P. pseudoalcaligenes CECT 5344 were inoculated at the indicated pHs and cell growth (solid lines) an pH of the media (dashed lines) were measured along the experiments, that were run in triplicate. A representative experiment is shown here.
Proceedings 02 01297 g001
Figure 2. Evolution of the pH during the growth of several strains in M63 media with glucose (4 g/L) as C-source, at different initial pHs. (a) E. coli ATCC 25922, (b) P. putida KT2440, and (c) P. pseudoalcaligenes CECT 5344 were inoculated at the indicated pHs and cell growth (solid lines) an pH of the media (dashed lines) were measured along the experiments, that were run in triplicate. A representative experiment is shown here.
Proceedings 02 01297 g002
Figure 3. (a) Cell-growth (solid lines) and evolution of the pH during bacterial growth of P. putida KT2440 in M63 media supplemented with different carbon sources. The initial pH was 7.0. (b) Evaluation of the growth ratio as a function of proton exchange for media with glucose, citrate and glycerol like carbon source using iJN1411 as genome scale model [4].
Proceedings 02 01297 g003
Publisher’s Note: MDPI stays neutral with regard to jurisdictional claims in published maps and institutional affiliations.