Proceeding Paper

Electromagnetic Sensing for Non-Destructive Real-Time Fruit Ripeness Detection: Case-Study for Automated Strawberry Picking †

1
Faculty of Science and Technology, Norwegian University of Life Sciences, 1432 Ås, Norway
2
Animalia AS, Norwegian Meat Research Institute, 0513 Oslo, Norway
*
Author to whom correspondence should be addressed.
Presented at the Eurosensors 2018 Conference, Graz, Austria, 9–12 September 2018.
Proceedings 2018, 2(13), 980; https://doi.org/10.3390/proceedings2130980
Published: 10 December 2018
(This article belongs to the Proceedings of EUROSENSORS 2018)

Abstract

:
Rapid non-destructive measurement or prediction of ripeness, quality and fungal infection in various fruits is a challenge currently affecting automation of fruit harvesting and gathering. This is especially true for delicate and difficult to store fruit such as strawberries, which are traditionally delivered directly to the customer from the farm. However, transportation of the product, often overseas, means that fruits’ condition at the time of gathering should be precisely planned. This paper reports on the initial trials of using non-invasive athermal microwave spectroscopy as a tool to assist in real-time fruit ripeness detection. The trials were conducted during June 2018 and have illustrated that the proposed method can distinguish between strawberries at different stages in ripening (R2 = 0.788, p = 0.0283). The findings support further development of the technique, which aims for integration with the Thorvald II agricultural robotic system.

1. Introduction

This work is focused on developing a real-time strawberry ripeness analysis tool for the use with the Thorvald II robotic system, which can be configured modularly depending on the specific agricultural product and need. This robot (Figure 1) has been successful in demonstrating its capabilities for applying UV light to strawberries with a goal to investigate the effect of UV light on mildew [1]. The robot used an inertial measurement unit, encoder odometry and LiDAR together with a map for localisation, and navigates to pre-recorded way-points in a predefined map. A cartesian-type harvesting robot for strawberry picking was reported in [2]. A point cloud was generated by a RGB-D camera and used to assist in strawberry harvesting, the overall efficiency of the robot was approx. 65.3%, but reached more than 95% for single strawberries without occlusion or in clusters. The approach of using real-time microwave spectroscopy aims to achieve much higher efficiency for sustainable agricultural applications.
Microwave sensing is a versatile and attractive novel technology which has already been successfully used for various industrial applications including water level measurements, material moisture content, in construction industry for non-invasive evaluation of structures and even in the healthcare industry for real-time monitoring of patients’ health indicators [3,4]. Its application in food evaluation and analysis is also attracting attention especially due to non-destructive and hygienic means suitable for a variety of foods [5]. In this work the feasibility of using planar type electromagnetic wave sensors for real-time non-destructive strawberry ripeness evaluation was assessed for further commercial exploitation with robotic agricultural systems.

2. Materials and Methods

Nobel strawberries were picked in Drøbak, Norway during the harvest season (June 2018). Selection of strawberries was based upon an approximate visual grading regime, with grades (G) 1- 4 as indicated in Table 1. Since picking was completed near the beginning of the harvest season, there were no “over-ripe” fruits, and therefore the final grade (G5) was produced from leaving the G4 fruits to ripen at room temperature for approx. 3 days after picking. Some weight loss was noted for G5, likely due to drying, but this considered small (approx. 1g per fruit, or 6% of weight at picking). Variation in colour between the grades is illustrated in Figure 2. Prior to measurement, the number of strawberries in each grade were counted, and a total weight for each grade was measured.
Measurements of individual fruits were taken using a silver coated 8-pair interdigitated electrode (IDE) type sensor, connected to a Rohde and Schwarz ZLV13 Vector Network Analyser (VNA). S-parameter measurements where recorded, namely reflected power (S11), for each fruit in the frequency range 9 kHz to 13.6 GHz (16,000 discrete points). An output power of 0 dBm (1 mW) was used. Room temperature was logged throughout the measurement period (Extech Instruments, SDL200), with the mean temperature recorded at 19.9 °C (σ = 0.530).
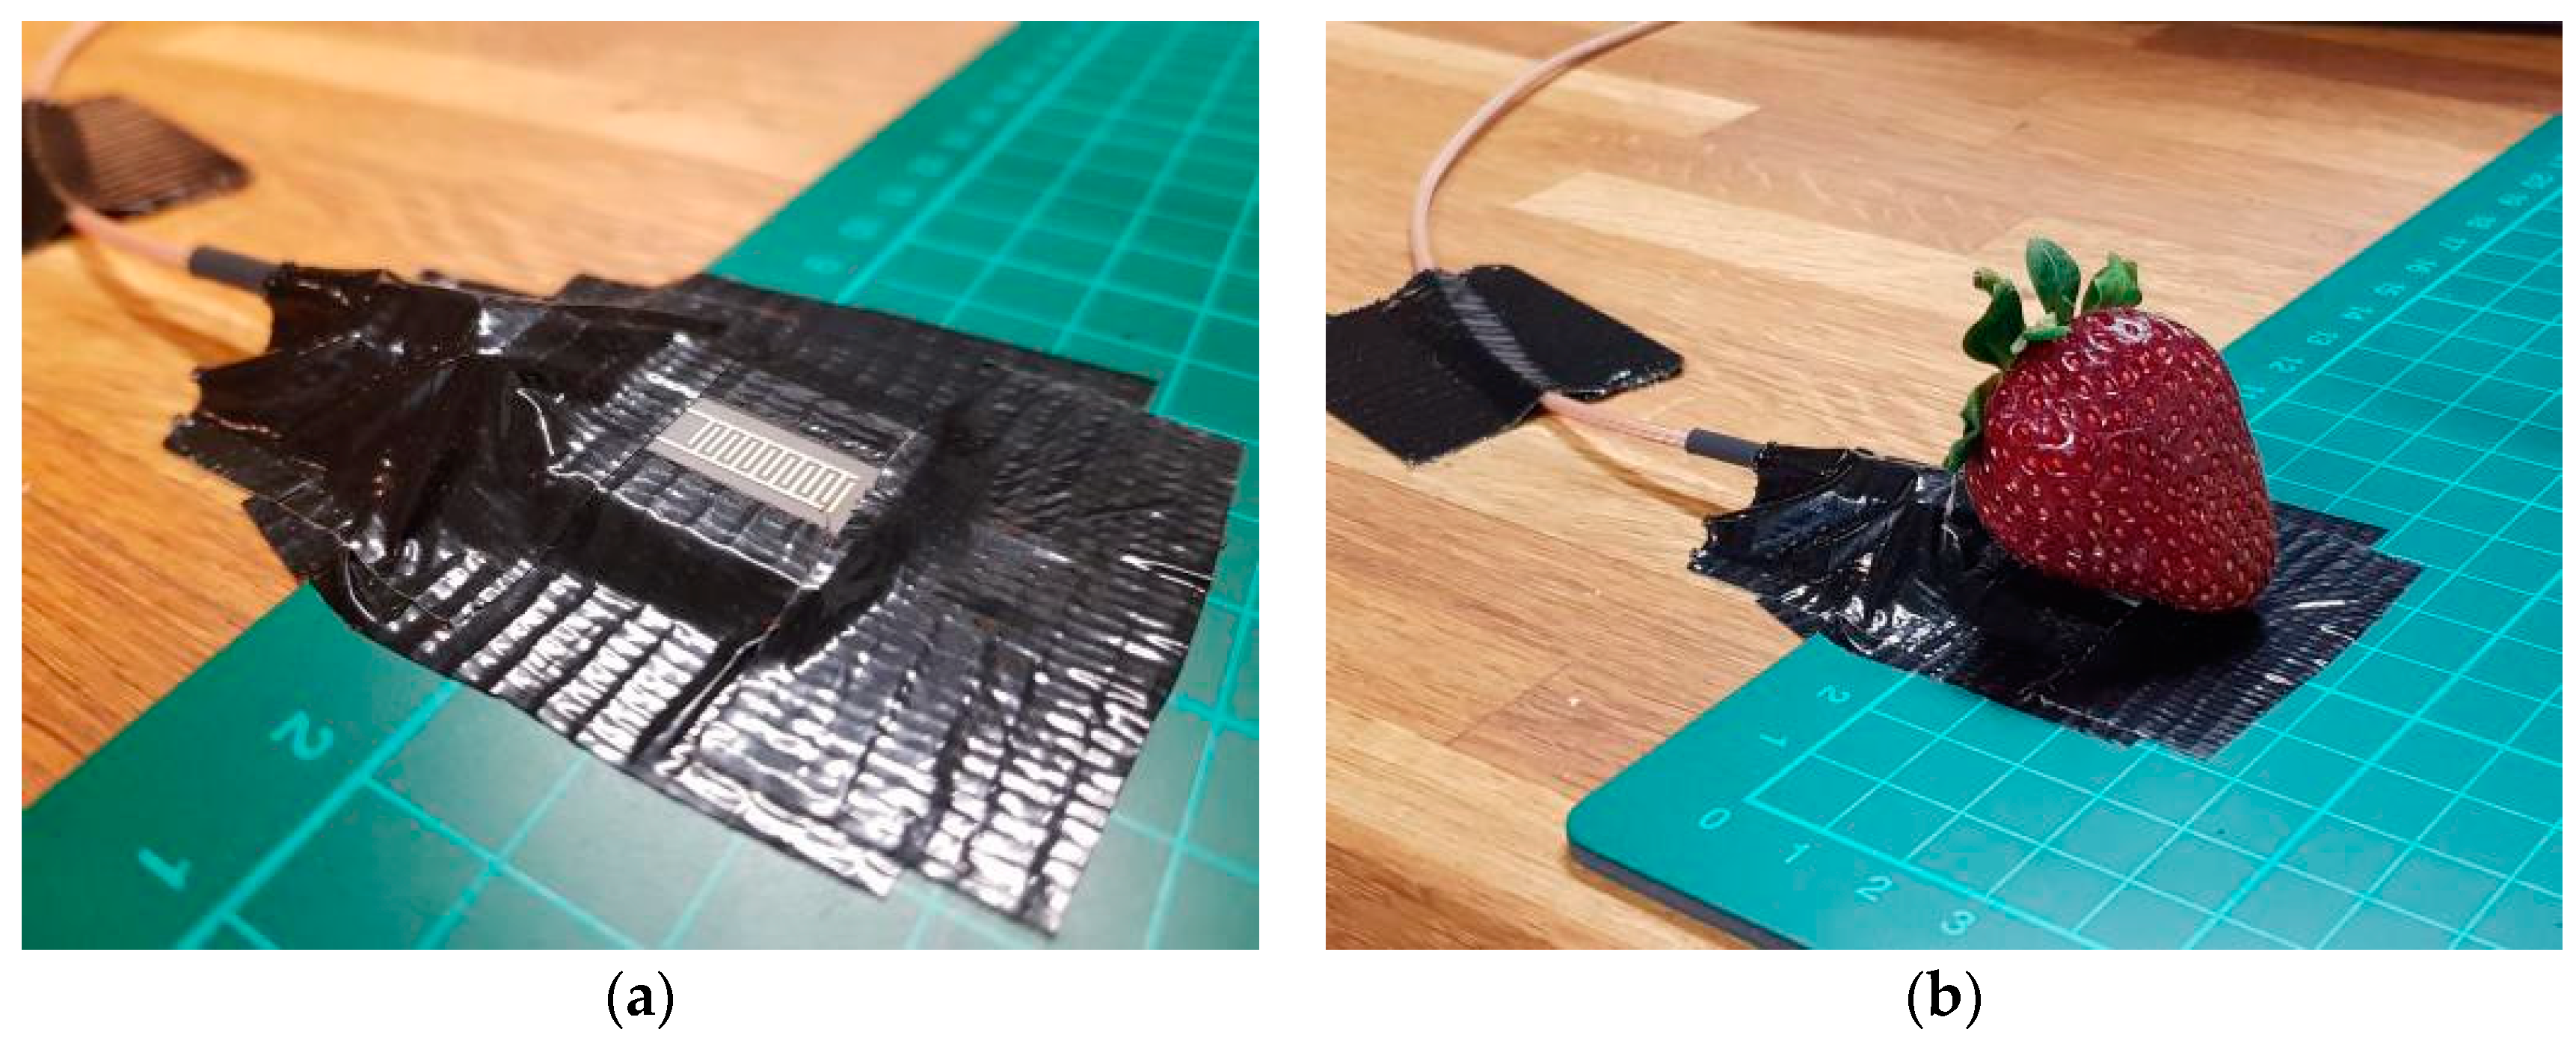
Each fruit was measured 3 times consecutively; no tagging of individual fruits was undertaken so acquired data was grouped according to grade for analysis. Placement of the fruit on the sensor was standardised such that the stalk was always nearest to the SMA connection. The sensor was fixed to a surface using duct tape, and only the IDE element was exposed for direct contact with the fruit – see Figure 3. For calibration purposes, measurements of the sensor without fruit were also taken, before each fruit measurement and also after the final fruit measurement.
For the purposes of this paper, an outlier filter was applied for post-processing of data based on z-scoring at each discrete frequency. A z-score threshold of |1.5| was set, so any data within a group which had 1.5 standard deviations above the mean was rejected. Visual analysis of the resultant spectra was used to target a specific frequency band for closer inspection. Correlation coefficients were then calculated and regression analysis was used to determine significance.

3. Results and Discussion

Visual inspection of the spectra yielded a clear separation of signals in the 200 – 600 MHz frequency range, as illustrated in Figure 4. Analysis, for the purposes of this paper, was therefore focussed on this region. Z-score filtering led to the rejection of 23 measurements (≈ 9% of collected measurement data). Aggregated signal amplitudes for each group were calculated, in addition standard deviation; descriptive statistics are given in Table 2. Using this aggregated data, it was possible to establish a linear fit correlation (see Figure 5); adjusted R2 = 0.788. Regression analysis showed that p = 0.0283, indicating that the result is significant (i.e., p < 0.05).
Sensor drift and variation during the experimental work was minimal, as indicated by the low mean signal amplitude and standard deviation recorded for “Air” in Table 2. Variation due to placement and position of the fruit, in addition to the non-homogenous nature of the material, is likely responsible for the in-grade variation observed. The results indicate that it is possible to determine the difference, using microwave-based sensing, between unripe and over-ripe fruits. However, the ability of the sensor in its current configuration to distinguish between subtler changes during the latter stages of ripening (i.e., when the fruit transitions from green to red) is limited, as indicated by the plateau in Figure 4. Further exploration of the chemical properties of the strawberries during this transition period, along with appropriate design changes to the sensor, may yield an improved outcome.

4. Conclusions

The reported trails of the microwave spectroscopy method based on a planar electromagnetic wave sensor have proven it feasible for real-time strawberry ripeness assessment. Further work is required to improve the sensitivity to the latter stages of ripening, in addition to integration of the system with the Thorvald II robotic platform.

Acknowledgments

The authors would like to thank Saxebøl bær, Per Fredrik Saxebøl strawberry farm in Norway for proving Nobel strawberries for the research purposes. This is a special type of strawberries developed in Norway, further information can be found here: http://graminor.no/sorter/baer/jordbaer/nobel/. Special thanks goes to Ellen Opsahl Mæhle for assistance with logistics of the experiment

Conflicts of Interest

The authors declare no conflict of interest.

References

  1. Grimstad, L.; From, P. The Thorvald II agricultural robotic system. Robotics 2017, 6, 24. [Google Scholar] [CrossRef]
  2. Nagata, M.; Cui, Y.; Jasper, G. Study on cartesian-type harvesting robot for strawberry. In Proceedings of the 3rd IFAC International Workshop on Bio-Robotics, Information Technology and Intelligent Control for Bioproduction Systems, Sapporo, Japan, 9–10 September 2006; pp. 266–270. [Google Scholar]
  3. Mason, A.; Korostynska, O.; Louis, J.; Cordova-Lopez, L.E.; Abdullah, B.; Greene, J.; Connell, R.; Hopkins, J. Noninvasive in-situ measurement of blood lactate using microwave sensors. IEEE Trans. Biomed. Eng. 2018, 65, 698–705. [Google Scholar] [CrossRef] [PubMed]
  4. Korostynska, O.; Mason, A.; Al-Shamma’a, A. Microwave sensors for the non-invasive monitoring of industrial and medical applications. Sens. Rev. 2014, 34, 182–191. [Google Scholar] [CrossRef]
  5. Meng, Z.; Wu, Z.; Gray, J. Microwave sensor technologies for food evaluation and analysis: Methods, challenges and solutions. Trans. Inst. Meas. Control 2017. [Google Scholar] [CrossRef]
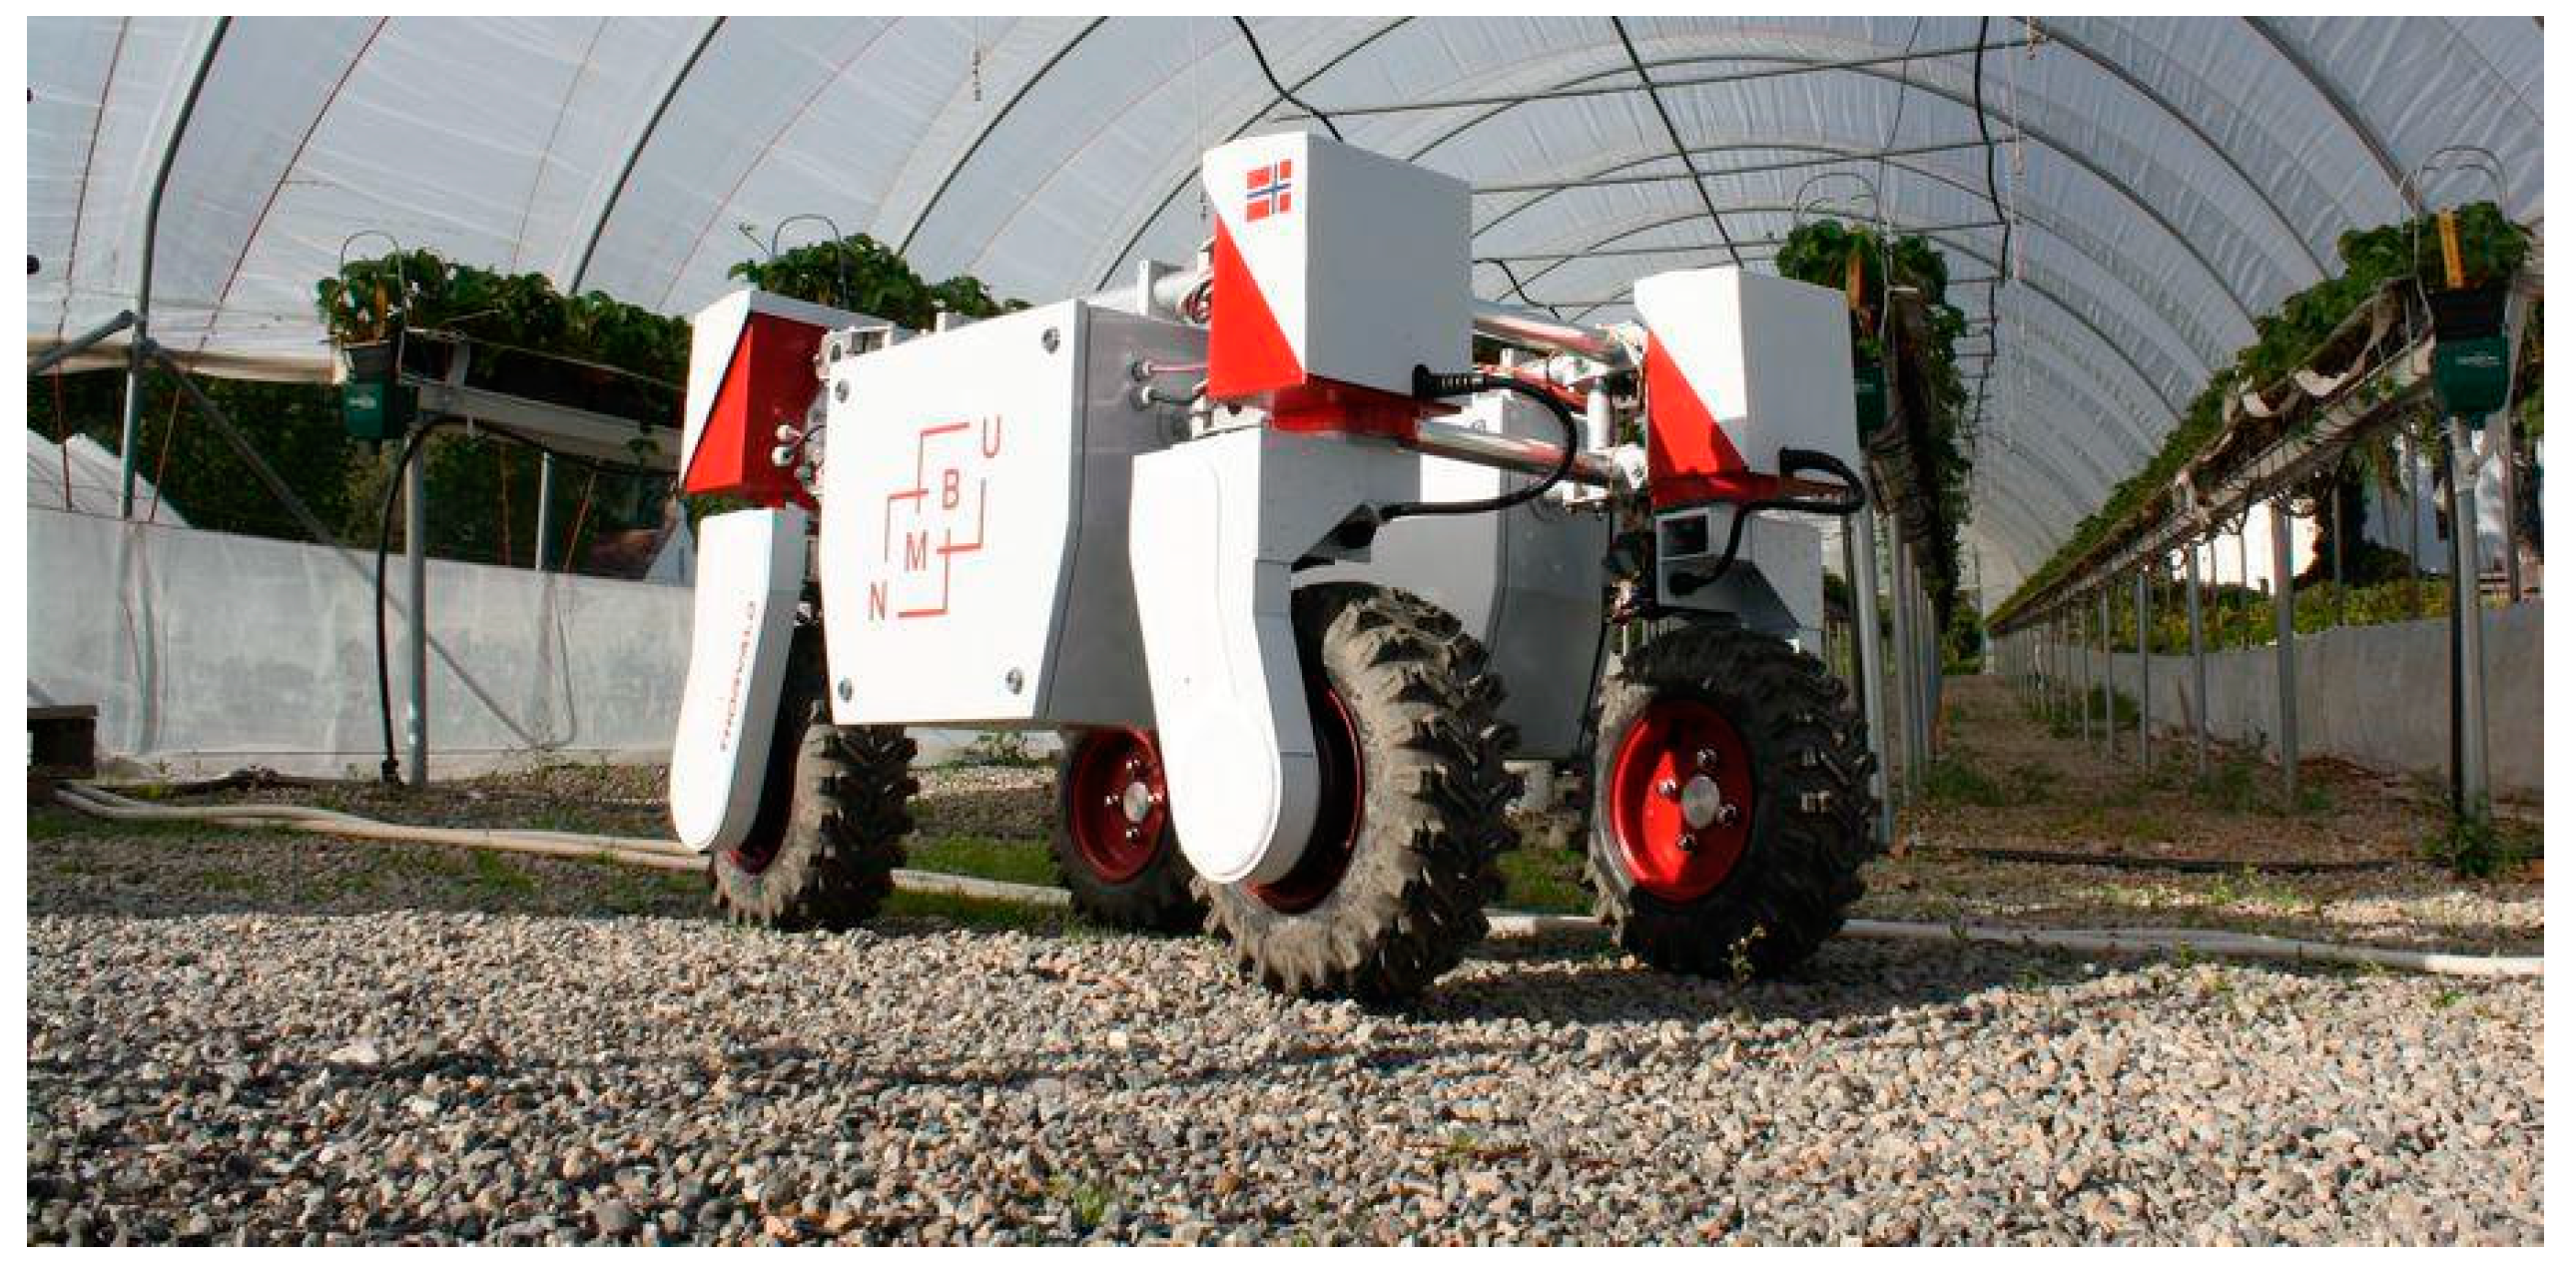
Figure 1. Thorvald II agricultural robotic system.
Proceedings 02 00980 g001
Figure 2. G1–G4 fruits (left to right), indicating variation in colour of fruits picked.
Proceedings 02 00980 g002
Figure 3. (a) 8-pair IDE sensor, with only sensitive element exposed and (b) example with fruit in place for measurement.
Proceedings 02 00980 g003
Figure 4. Spectral data between 9 kHz and 1 GHz; observation highlights a clear separation between the spectral data between 200 and 600 MHz.
Proceedings 02 00980 g004
Figure 5. Correlation between strawberry grade (1–5) and sensor signal in the 200–600 MHz range.
Proceedings 02 00980 g005
Table 1. Fruit grading information.
Grade (G)Grade Description *nTotal Grade Weight (g)Mean Fruit Weight (g)
1Green; completely unripened.242249.3
2<50% red; partially ripened, but less than half of surface area of fruit has red colour.1522615.1
3>50% red; perhaps almost ripe, but still significant green colouration.1114913.5
4Ripe; 100% surface redness.1424117.2
5Over-ripe; Deep red colouration, fruit has increased softness. G4 fruits were left at 20 °C for 3 days to develop the over-ripe state.1422716.2
* Based on visual grading at the time of picking.
Table 2. Descriptive statistics from spectra between 200 and 600 MHz.
GradeTotal Measure-MentsTotal z- Score RejectionsMean signal Amplitude (dBm)Standard Deviation
1633−0.6640.422
2455−1.110.576
3333−1.160.917
4423−1.170.866
5429−1.540.640
Air **2100.0004430.0125
Total24623--
** Air represents the control measurements taken to ensure the sensor and system were operating correctly, and to determine unexpected system variation due to drift or sensor contamination, for example.
Publisher’s Note: MDPI stays neutral with regard to jurisdictional claims in published maps and institutional affiliations.