Abstract
Gas distribution modelling can provide potentially life-saving information when assessing the hazards of gaseous emissions and for localization of explosives, toxic or flammable chemicals. In this work, we deployed a three-dimensional (3D) grid of metal oxide semiconductor (MOX) gas sensors deployed in an office room, which allows for novel insights about the complex patterns of indoor gas dispersal. 12 independent experiments were carried out to better understand dispersion patters of a single gas source placed at different locations of the room, including variations in height, release rate and air flow profiles. This dataset is denser and richer than what is currently available, i.e., 2D datasets in wind tunnels. We make it publicly available to enable the community to develop, validate, and compare new approaches related to gas sensing in complex environments.
1. Introduction
Advances in gas distribution mapping and localization algorithms are hindered by the lack of experimental measurements over 3D volumes. Flow visualization based on optical methods, such as particle image velocimetry (PIV) or particle tracking velocimetry (PTV) can produce results with high temporal and spatial resolution in 3D. However, the high cost of these techniques together with the need of seeding the flow with tracer particles restrict the practical application considerably [1].
An inexpensive, alternative solution for investigating gas dispersion patterns without adding tracers is to deploy a grid of chemical sensors in the target area to perform simultaneous and spatially distributed gas concentration measurements. So far, reported experiments with chemical sensor grids have been restricted to 2D [2,3]. Zakaria et al. [2] deployed a 2D grid of 72 MOX sensors in an indoor arena (6 × 3 m2) to visualize the temporal evolution of a chemical plume created by artificial air flow. Murai et al. [3] used a 2D grid of 30 MOX sensors in a small area (3.5 × 3.5 m2) within an office room, to study the gas distribution under weak air flow conditions. Whereas a well-defined and stable plume was developed in the former scenario, in the latter case a fuzzy gas cloud with unpredictable movements could be observed. These studies highlight that air flow has a major impact on the gas distribution, at least in the 2D slice observable at ground level.
A 3D study of indoor gas dispersion with and without artificial airflow, using a 3D grid of MOX sensors, is the main contribution in this paper. Since the analysis relies on the same sensors that can be mounted on mobile robots for gas sensing tasks, we used the recorded signals to study gas distribution patterns and estimators of source proximity, such as the ‘bouts’ [4]. A ‘bout’ is a segment of the MOX sensor signal in which the derivative is continuously rising and might indicate contact with individual filaments in a gas plume. It was previously found that the bout frequency is correlated to the distance to a gas source, in 2D wind tunnel experiments. A second contribution of this work is to extend the bout frequency analysis to a real-world 3D environment with different air flow profiles. The third contribution is the dataset itself, that we make publicly available.
2. Materials and Methods
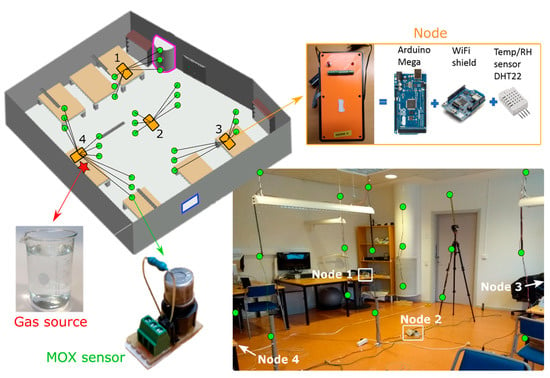
A 30 m2 office room was used as the test environment (Figure 1). The volume of the room (78 m3) was divided into a 3 × 3 × 3 grid (27 cells) of approximately 2.9 m3/cell. A MOX sensor mounted on a conditioning board (a voltage divider with load resistor of 68 kΩ) was placed in the center of each cell. The output signals of the 27 MOX sensors were acquired by 4 custom processing nodes based on Arduino Mega microcontrollers with WiFi shields (Arduino AG, Turin, Italy). The sensor signals, together with temperature and humidity measurements (DHT22, Adafruit Industries, New York, NY, USA) in different locations of the test room, were sent to a central computer via WiFi. The sensors were individually calibrated in a laboratory, in similar conditions of humidity and temperature than the test room.

Figure 1.
Test room (CAD drawing, key elements and photo). The 27 MOX sensors (Models: TGS 2600 (×7), 2602 (×7), 2610 (×5), 2611 (×2) and 2620 (×6), Figaro Engineering Inc., Osaka, Japan) are depicted as green circles, and the processing nodes as orange rectangles. The door and window were closed during the experiments.
During the first 15 min of each experiment, the baseline of the sensors was recorded. The gas release started by pouring 300 mL of ethanol into a glass. After 90 min, the ethanol glass was taken out of the room and the window and door were opened to clean the room. Mean gas distribution maps and bout frequency maps were computed from t = 40 to t = 90 min (to avoid transients).
3. Results and Discussion
A small subset of the results was selected for presentation in this paper. One experiment with airflow and one experiment without airflow are presented in in Section 3.1 and Section 3.2, respectively.
3.1. Gas Dispersion with Artificial Air Flow
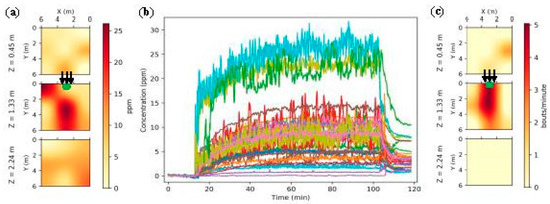
Under artificial air flow, a plume of high concentration (≈20 ppm) that extends downwind from the source, at constant height, was found in the mean gas distribution maps (Figure 2a). Although ethanol is heavier than air, average concentrations up to 12 ppm were found near the ceiling, and residual concentrations were found near the floor. The maximum of this map was not the closest cell to the gas source. The sensor signals are characterized by fast fluctuations around a mean value that stabilized in approx. 15 min (Figure 2b). The gas plume was more evident in the average bout frequency map (Figure 2c). Using this map, the gas plume could be tracked down to the source from at least 6 m of distance (this is limited by the dimensions of the room).

Figure 2.
Gas dispersion with artificial airflow. (a) Mean gas distribution map at different heights; (b) Temporal evolution of the instantaneous concentration (all sensor signals are stacked together); (c) Average bout frequency map (bout amplitude threshold [4] is 1 ppm). The gas source (green circle) was located at (3, 0.5, 1.0) m. The airflow (black arrows) was generated by a DC fan located behind the gas source. The maps in (a,c) were smoothed using spline interpolation.
3.2. Gas Dispersion without Artificial Air Flow
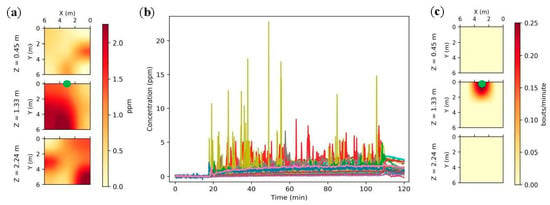
Without artificial airflow, the mean gas concentration in the room (≈1 ppm) is near the limit of detection of the sensors (Figure 3a). However, the average concentration is not representative of the concentration across the entire experiment, as indicated by the high variability of the sensor signals (Figure 3b). Measurements taken near the gas source (yellow trace) showed short and steep high concentration peaks followed by long inactive periods of up to 20 min (e.g., t = [60, 80] min). These conditions represent a challenge for gas source localization using a mobile robot, as success might be dependent on the time since the gas was released. In addition, any trace of unknown analyte or small changes in environmental factors can deteriorate the localization performance, due to the inherent cross-sensitivity of MOX sensors and the low concentrations. Although the bout frequency was much lower than in the experiments with artificial airflow, it was still a strong indicator of proximity to a source location, if the measurement window was long enough (4 min were necessary on average to capture one bout near the gas source). The lack of strong airflow reduced the maximum distance at which the gas source could be detected to approx. 1.5 m.

Figure 3.
Gas dispersion without artificial airflow. (a) Mean gas distribution map at different heights, (b) Temporal evolution of the instantaneous concentration (all sensor signals are plotted); (c) Average bout frequency map (bout amplitude threshold is 5 ppm).
4. Conclusions
Gas dispersion in indoor environments is a chaotic 3D phenomenon, which is the key challenge for mobile robot gas source localization. In our experiments, high average concentrations were found far from the source when strong air flow was induced, whereas the lack of a dominant air flow produced strongly time-varying gas distribution patterns that pose a bigger challenge to gas source localization. The bout frequency was nonetheless a good estimator of source proximity in both scenarios. It is worth noticing that more experiments are needed to optimize bout detection parameters (i.e., measurement window and amplitude threshold), or to test other estimators of source proximity. To achieve this and to enable other further follow-up research we made the dataset described above available under the GNU General Public License v3.0.
Supplementary Materials
The dataset and code used in this article is available online at https://github.com/jburgues/Orebro3DSEN, under the GNU General Public License v3.0.
Author Contributions
J.B. and V.H. conceived and designed the experiments; V.H. and A.L. provided access to the test room; J.B. and V.H. performed the experiments; A.L. supervised the experiments; J.B. analyzed the data; J.B. wrote the paper with inputs from all authors.
Acknowledgments
This work was partially funded by the Spanish MINECO program, under grants BES-2015-071698 (SEVERO-OCHOA) and TEC2014-59229-R (SIGVOL), and supported within H2020-ICT by the European Commission under grant agreement number 645101 (SmokeBot). The Institute of Bioengineering of Catalonia (IBEC) is a member of the CERCA Programme/Generalitat de Catalunya.
Conflicts of Interest
The authors declare no conflict of interest. The founding sponsors had no role in the design of the study; in the collection, analyses, or interpretation of data; in the writing of the manuscript, and in the decision to publish the results.
References
- Loomans, M. The Measurement and Simulation of Indoor Air Flow; University of Eindhoven: Eindhoven, The Netherlands, 1998; pp. 652–657. [Google Scholar]
- Syed Zakaria, S.; Visvanathan, R.; Kamarudin, K.; Ali Yeon, A.; Md. Shakaff, A.; Zakaria, A.; Kamarudin, L. Development of a Scalable Testbed for Mobile Olfaction Verification. Sensors 2015, 15, 30894–30912. [Google Scholar] [CrossRef] [PubMed]
- Murai, A.; Yoshimoto, K.; Takemura, R.; Matsukura, H.; Ishida, H. Robotic gas source localization assisted by active airflow generation. In Proceedings of the 2015 IEEE SENSORS, Busan, Korea, 1–4 November 2015. [Google Scholar]
- Schmuker, M.; Bahr, V.; Huerta, R. Exploiting plume structure to decode gas source distance using metal-oxide gas sensors. Sens. Actuators B Chem. 2016, 235, 636–646. [Google Scholar] [CrossRef]
Publisher’s Note: MDPI stays neutral with regard to jurisdictional claims in published maps and institutional affiliations. |
© 2018 by the authors. Licensee MDPI, Basel, Switzerland. This article is an open access article distributed under the terms and conditions of the Creative Commons Attribution (CC BY) license (https://creativecommons.org/licenses/by/4.0/).