Proceeding Paper

Tomographic Measurement of Ammonia Distribution on a Hot Gas Test Bench †

by
Bernhard Fischbacher
*,
Bernhard Lechner
and
Bernhard Brandstätter
Kompetenzzentrum—Das Virtuelle Fahrzeug Forschungsgesellschaft, 8010 Graz, Austria
*
Author to whom correspondence should be addressed.
Presented at the Eurosensors 2018 Conference, Graz, Austria, 9–12 September 2018.
Proceedings 2018, 2(13), 876; https://doi.org/10.3390/proceedings2130876
Published: 30 November 2018
(This article belongs to the Proceedings of EUROSENSORS 2018)

Abstract

:
In situ optical measurement systems for gas detection with high temporal resolution enable new possibilities of detection opportunities for continuous pipe gas streams. A tomographic absorption-based measurement system has been developed to detect the ammonia (NH3) concentration distribution within an exhaust pipe on a hot gas test bench. Multiple ammonia line concentrations are measured in situ by applying nondispersive absorption spectroscopy in the deep ultraviolet (DUV) region. The detectors consist of photodiodes in combination with optimized transimpedance amplifiers (TIV) allowing high sampling rates up to 3 kHz while providing a high signal-to-noise ratio (SNR). Despite the short path length of only eight centimeters a detection limit of 1 ppm has been achieved.

1. Introduction

The NOX emission reduction of diesel engines is still an important issue in engine development. The introduction of the current EURO 6c and upcoming emission legislations including the new real driving emission (RDE) cycle forces manufacturers to radically reduce NOX emission [1]. The most promising technology for exhaust aftertreatment is the selective catalytic reduction (SCR). SCR technology uses a urea-water solution (UWS) being injected into the exhaust gas. The UWS is converted to ammonia through thermolysis and hydrolysis and acts as reduction agent for NOX in the SCR reaction [2]. The ammonia concentration distribution entering the catalyst converter is a key parameter for best conversion performance. Commonly used methods extract gas from various discrete positions in the cross section which leads to poor temporal resolution and measurement uncertainties due to depositions and chemical reactions along the analysis path. This new approach enables the investigation of dynamic processes in the exhaust aftertreatment system to increase the system performance.
In situ optical measurement techniques are not intrusive and therefore offer the great advantage of not manipulating the original experiment. In addition, the measurement quantity is measured directly at the point of interest. For ammonia detection various measurement techniques are available [3]. Within absorption spectroscopy the light absorption by the gas of intertest is wavelength specific. By detecting the light absorption at the sensitive wavelengths with possibly no other gas species absorbing in this spectral range the line concentration can be determined. The concentration estimation follows the Beer-Lambert absorption law (Equation (1)). The absorbance A is defined by the ratio of the incident light and the detected light and is used to calculate the line concentration c using the calibrated absorption coefficient α and the path length l (Equation (1)). Since the sampling rate of spectrometers is limited by the integration time of the detector and hence the intensity of the light source, the developed measurement system applies non-dispersive techniques using an optical bandpass filter in the desired spectral range in combination with a photodiode.
A = ln(I0/I) = α·c·l
The line concentration per optical path represents the integral of gas concentration along the path. By applying as many optical paths as possible in different positions and angles through the cross section the information gain can be increased only limited by the optical access to the cross section. In this application 20 light paths are instrumented through the cross section. The resulting inverse problem is reconstructed by appliance of Least Squares regression and Tikhonov regularization [4] leading to 2D images of the ammonia concentration distribution in the measurement cross section.

2. Materials and Methods

Ammonia absorbs light mainly in three spectral ranges: in the DUV, near infrared and mid infrared region (Table 1). The measurement specification identified the deep ultraviolet (DUV) spectral region to be the best choice. The developed measurement system (Figure 1b) must be capable of detecting the ammonia concentration before as well as after the SCR catalyst converter. As shown in Table 1 the absorption coefficient defining the system sensitivity is highest in the DUV region and 10 times higher than in the MIR and 10,000 time higher than in the NIR region. The cross sensitivity to nitric oxides and aromatic compounds is no issue for measurements on the hot gas test bench but must be considered for migration of the system to the engine test bench.
To enable geometric localization of the gas concentration tomographic methods are applied. Reconstruction quality is strongly dependent on the number of projections and their intelligent arrangement. To choose the best optical beam arrangement, several scenarios were investigated and tested for their information content using randomized test data. The comparison of worst case arrangement, a random arrangement using optimization algorithm [5] and the finally chosen regular beam arrangement (Figure 2a) showed less difference in reconstruction error than expected.
The measurement path of the optical beams consists of a deuterium gas discharge lamp as light source for seven optical beams connected via a multifurcated solarization resistant UV fiber-optic cable. The optical access to the measurement cross section is realized via fused silica lenses acting as collimation lens for the fiber. On the detector side of the beam a fused silica lens is used as converging lens focusing the light on the detector. The detector consists of an optical bandpass filter and a photodiode directly connected to an optimized transimpedance amplifier (TIV). The bandpass filter has a central wavelength of 205 nm with a FWHM of 10 nm. Ammonia absorbs in the region of 200 nm to 225 nm meaning that the filter forms an integral over the spectral range of interest and hence realizes the non-dispersive measurement principle. The properties of the UV enhanced photodiode were considered designing the TIV with respect to amplification, speed and stability.

3. Results

The resulting measurement system prototype (Figure 1) has been installed at the hot gas test bench executing injection experiments on a hot flat plate positioned centric in a pipe with hot air stream and monitoring the ammonia conversion rate as well as its distribution. The cross section is scanned with the bespoken regular beam arrangement (Figure 2a) leading to 20 line concentration time signals (Figure 2b). After applying reconstruction algorithms on the time signals, a 2D image for each sample in the time domain is obtained. Figure 2c shows the concentration distribution at the peak of the injection pulse.
The inverse problem of limited data hard field tomography can be solved by appliance of Least Squares regression and Tikhonov regularization (Equation (2)). The formulation consists of the minimization of a measurement term and a regularization term. The regularization term consists of a weighting factor λ and a regularization matrix L, here a discrete Laplacian operator to introduce smoothness as a prior information. The introduction and correct weighting of prior information are key factors for the reconstruction quality of the results. The best tradeoff between extinction of artefacts and over-smoothing has to be found to minimize reconstruction error.
xreconst = argminx≥0{‖A·x − b‖2 + ‖λ·L·x‖2}
The image sequence in Figure 3 demonstrates the performance of the measurement system to visualize the dynamic processes during urea injection. Details like spray formation and conversion in the air stream (b) as well as evaporation from the flat plate (c) and the pipe wall film (d) can be clearly identified. The remaining visible reconstruction artefacts (a) are due to the limited number of projections and may be further reduced by improvements of the reconstruction algorithm or introduction of more advanced reconstruction methods like Bayesian approach of modeling.

4. Conclusions

The potential of in situ methods for ammonia concentration distribution in a gas stream has been clearly demonstrated. The investigation of dynamic processes, heat transfer characteristics and thermology are major improvements and deliver valuable data for simulation models on this topic. The low detection limit makes the system also suitable for ammonia slip measurements after the catalytic converter. Making this technology even more powerful, future development will deal with the modification of the system for usage on the engine test bench dealing with real exhaust gas where cross sensitivities to other gas species will cover the major part of work. Summarized, future improvement of the SCR technology will need advanced measurement technologies to gain the full potential of NOX reduction in order to fulfill upcoming emission legislation.

Acknowledgments

The project was partially funded by the Austrian FFG program “Industrienahe Dissertationen” and the Austrian Federal Ministry for Transport, Innovation and Technology (bmvit). The publication was written at VIRTUAL VEHICLE Research Center in Graz and partially funded by the COMET K2—Competence Centers for Excellent Technologies Programme of the Federal Ministry for Transport, Innovation and Technology (bmvit), the Federal Ministry for Digital, Business and Enterprise (bmdw), the Austrian Research Promotion Agency (FFG), the Province of Styria and the Styrian Business Promotion Agency (SFG).

Conflicts of Interest

The authors declare no conflict of interest.

References

  1. Stickoxid-Belastung Durch Diesel-Pkw Noch Höher Als Gedacht. Available online: https://www.umweltbundesamt.de/presse/pressemitteilungen/stickoxid-belastung-durch-diesel-pkw-noch-hoeher (accessed on 6 June 2018).
  2. Koebel, M.; Elsener, M.; Leemann, M. Urea-SCR: A promising technique to reduce NOX emissions from automotive diesel engines. Catal. Today 2000, 59, 335–345. [Google Scholar] [CrossRef]
  3. Hole, O.M. Measuring ammonia—Development and Application of Measurement Techniques for the Detection of Ammonia. Master’s Thesis, University of Lund, Lund, Sweden, 2012. [Google Scholar]
  4. Daun, K.J. Infrared species limited data tomography through Tikhonov reconstruction. J. Quant. Spectrosc. Radiat. Transf. 2010, 111, 105–115. [Google Scholar] [CrossRef]
  5. Twynstra, M.G.; Daun, K.J. Laser-absorption tomography beam arrangement optimization using resolution matrices. Appl. Opt. 2012, 51, 7059–7068. [Google Scholar] [CrossRef] [PubMed]
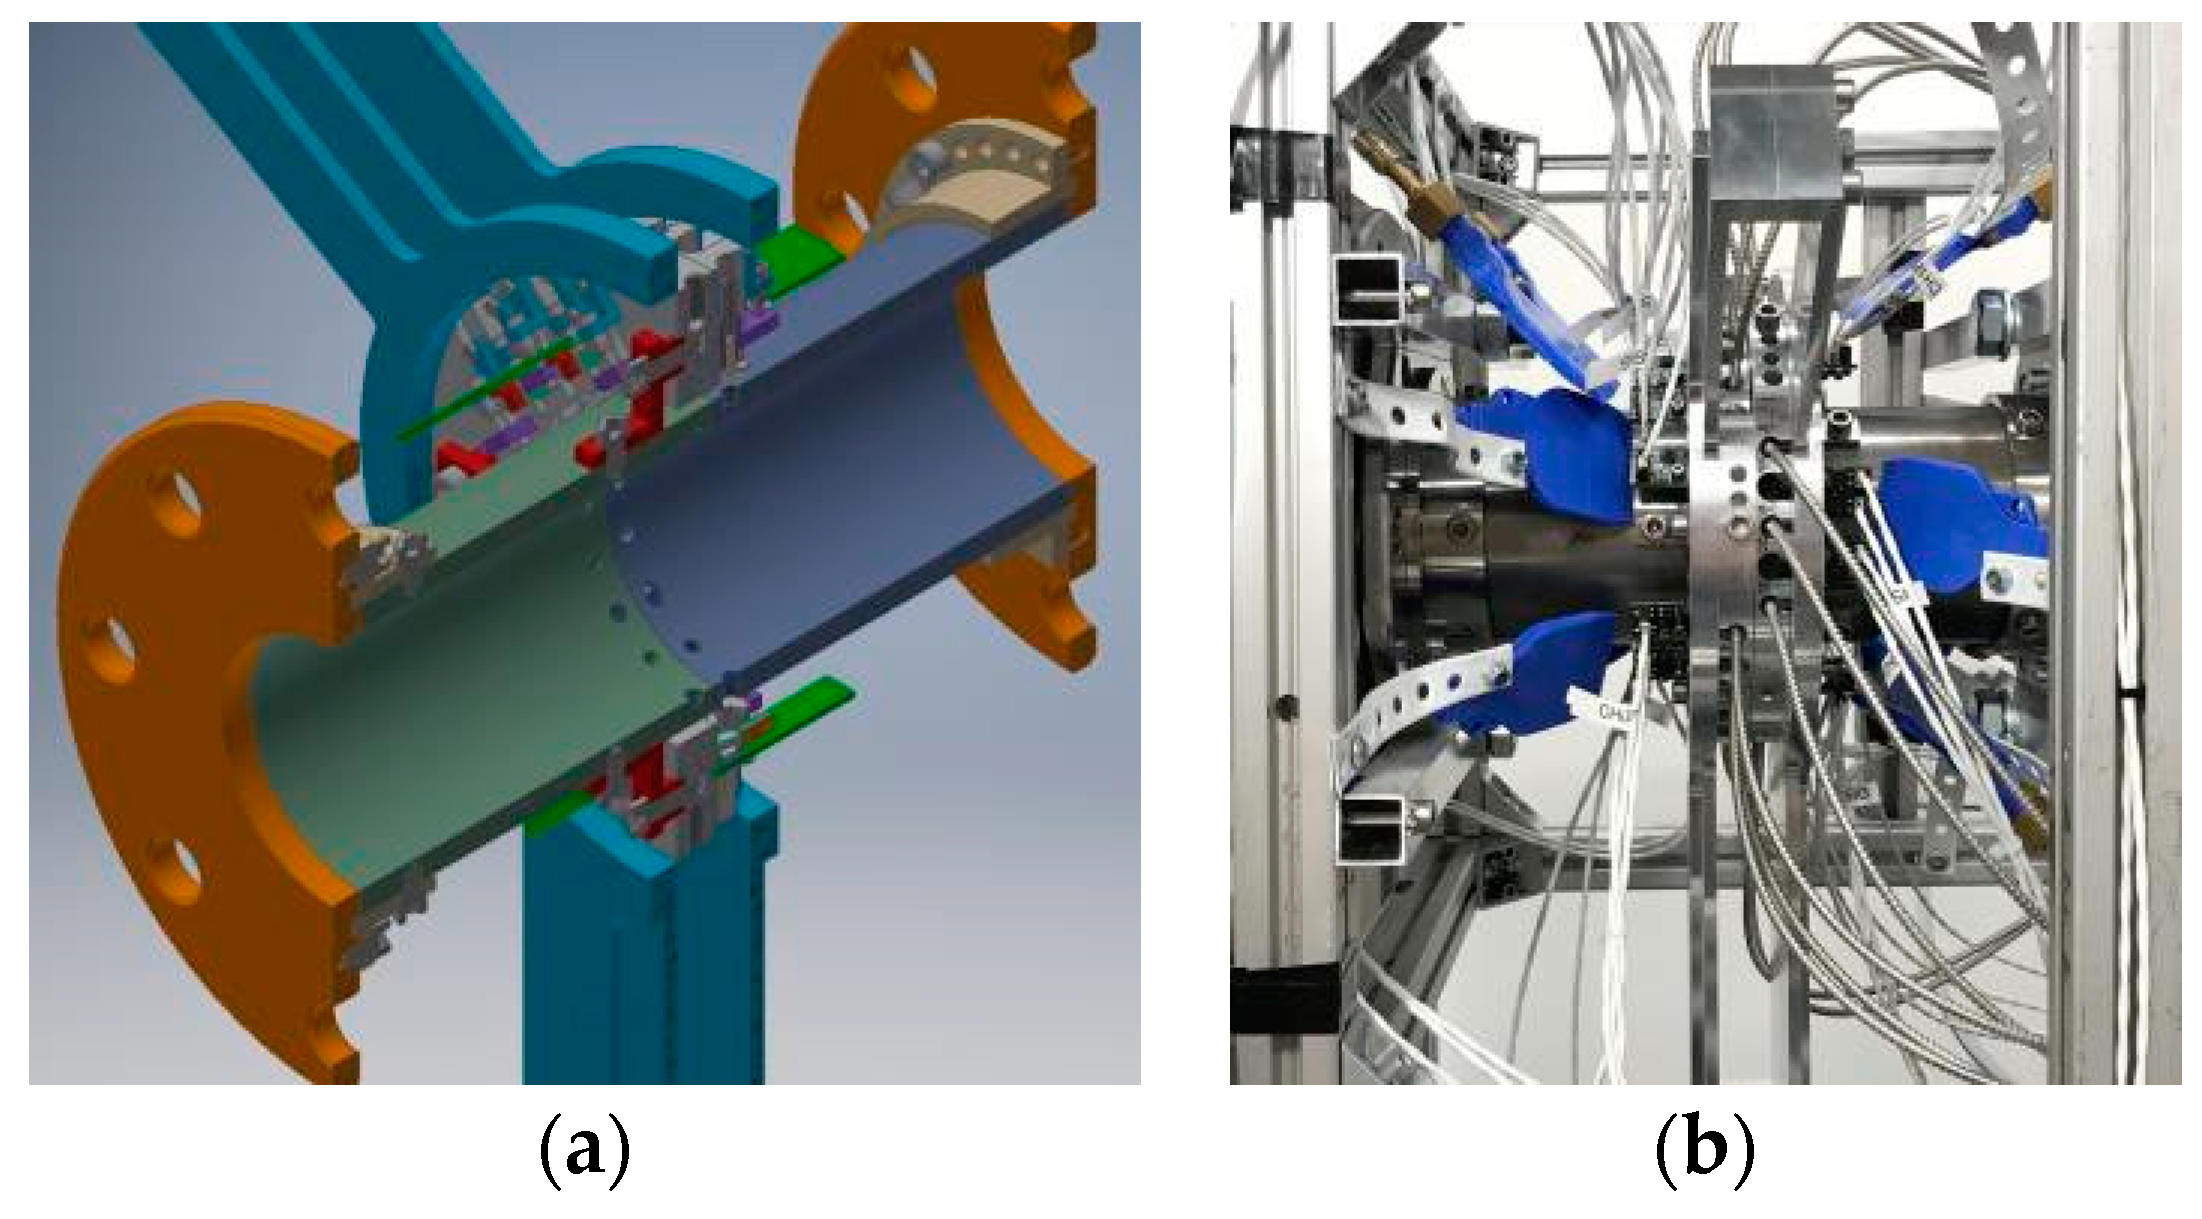
Figure 1. measurement system prototype; (a) CAD sectional model showing the structure of the inner pipe and the detection ring; (b) prototype installed on the hot gas test bench measuring the gas distribution of a urea injection experiment.
Proceedings 02 00876 g001
Figure 2. measurement procedure; (a) regular beam arrangement of 20 beams through the cross section; (b) time signal of one injection pulse measuring 20 line concentrations; (c) gas distribution result after reconstructing the line concentrations at a specific time.
Proceedings 02 00876 g002
Figure 3. The images (ae) show the reconstruction results of measurements from the hot gas test bench. The images sequence visualizes the ammonia concentration distribution of one urea injection pulse on a flat plate in the hot air stream at a distance of 120 cm downstream of the injection spot.
Proceedings 02 00876 g003
Table 1. properties of the three most sensitive ammonia absorption spectral ranges.
Near Infrared(NIR)Mid Infrared(MIR)Deep Ultraviolet(DUV)
spectral region1.6 µm10 µm210 nm
absorption coefficient10−21 cm210−18 cm22 × 10−17 cm2
--o+++
cost++--+
availabilitywide variety of materials at low pricehardly any temperature resistant materials moderate price, spectral limit for fibers and filters
++-o
cross sensitivityH2Ohot CO2NO, NO2
-+--
Publisher’s Note: MDPI stays neutral with regard to jurisdictional claims in published maps and institutional affiliations.