Ultrathin Amorphous Carbon as Active Part of Vibrating MEMS †

Abstract
:1. Introduction
2. Materials and Methods
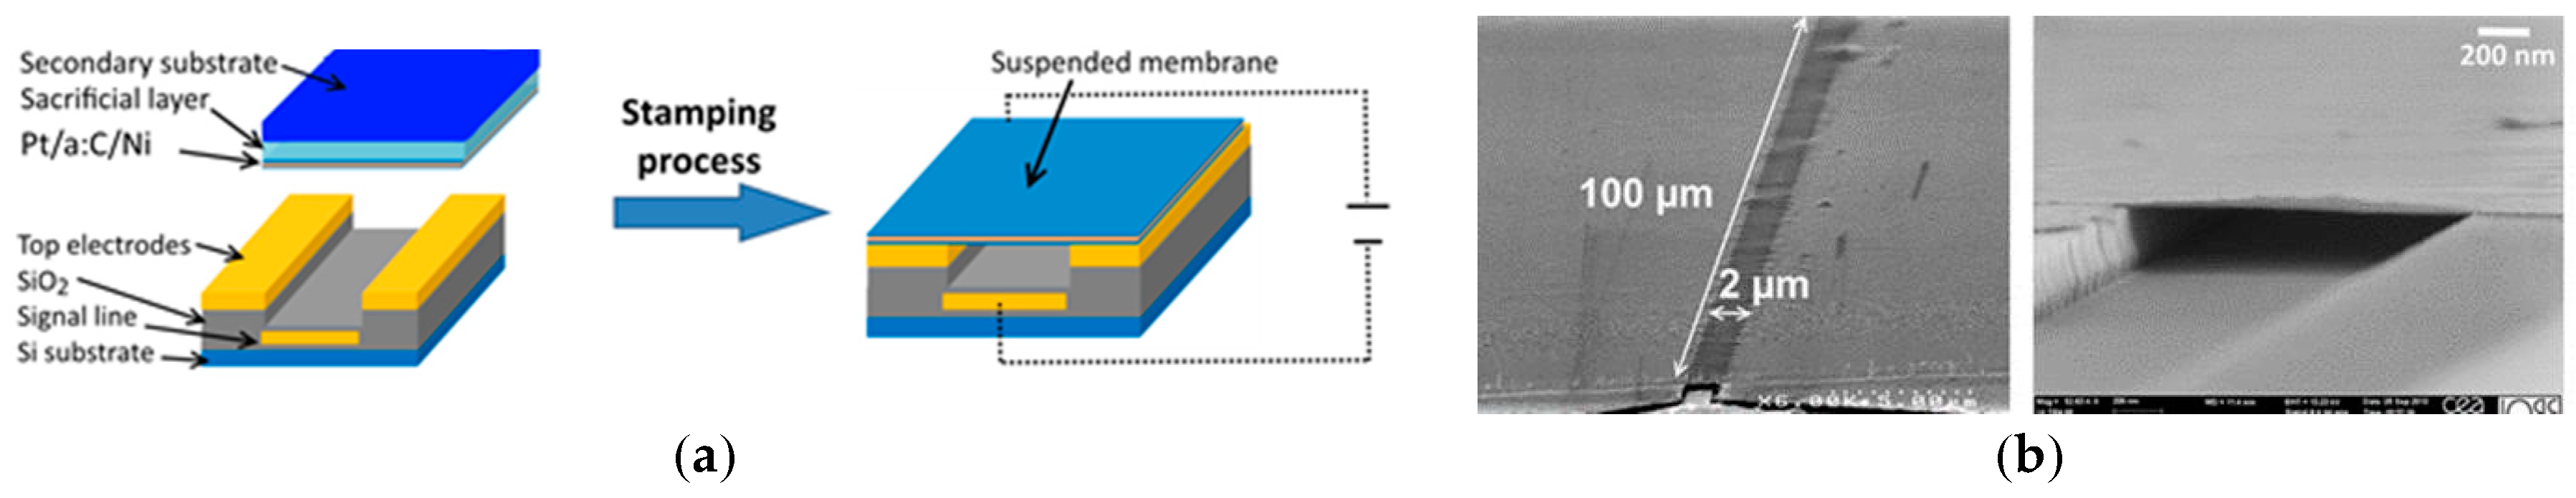
2.1. Device Description and Process
2.1.1. Ultrathin Membrane Material
2.1.2. Device Realization
2.2. Measurement Set Up
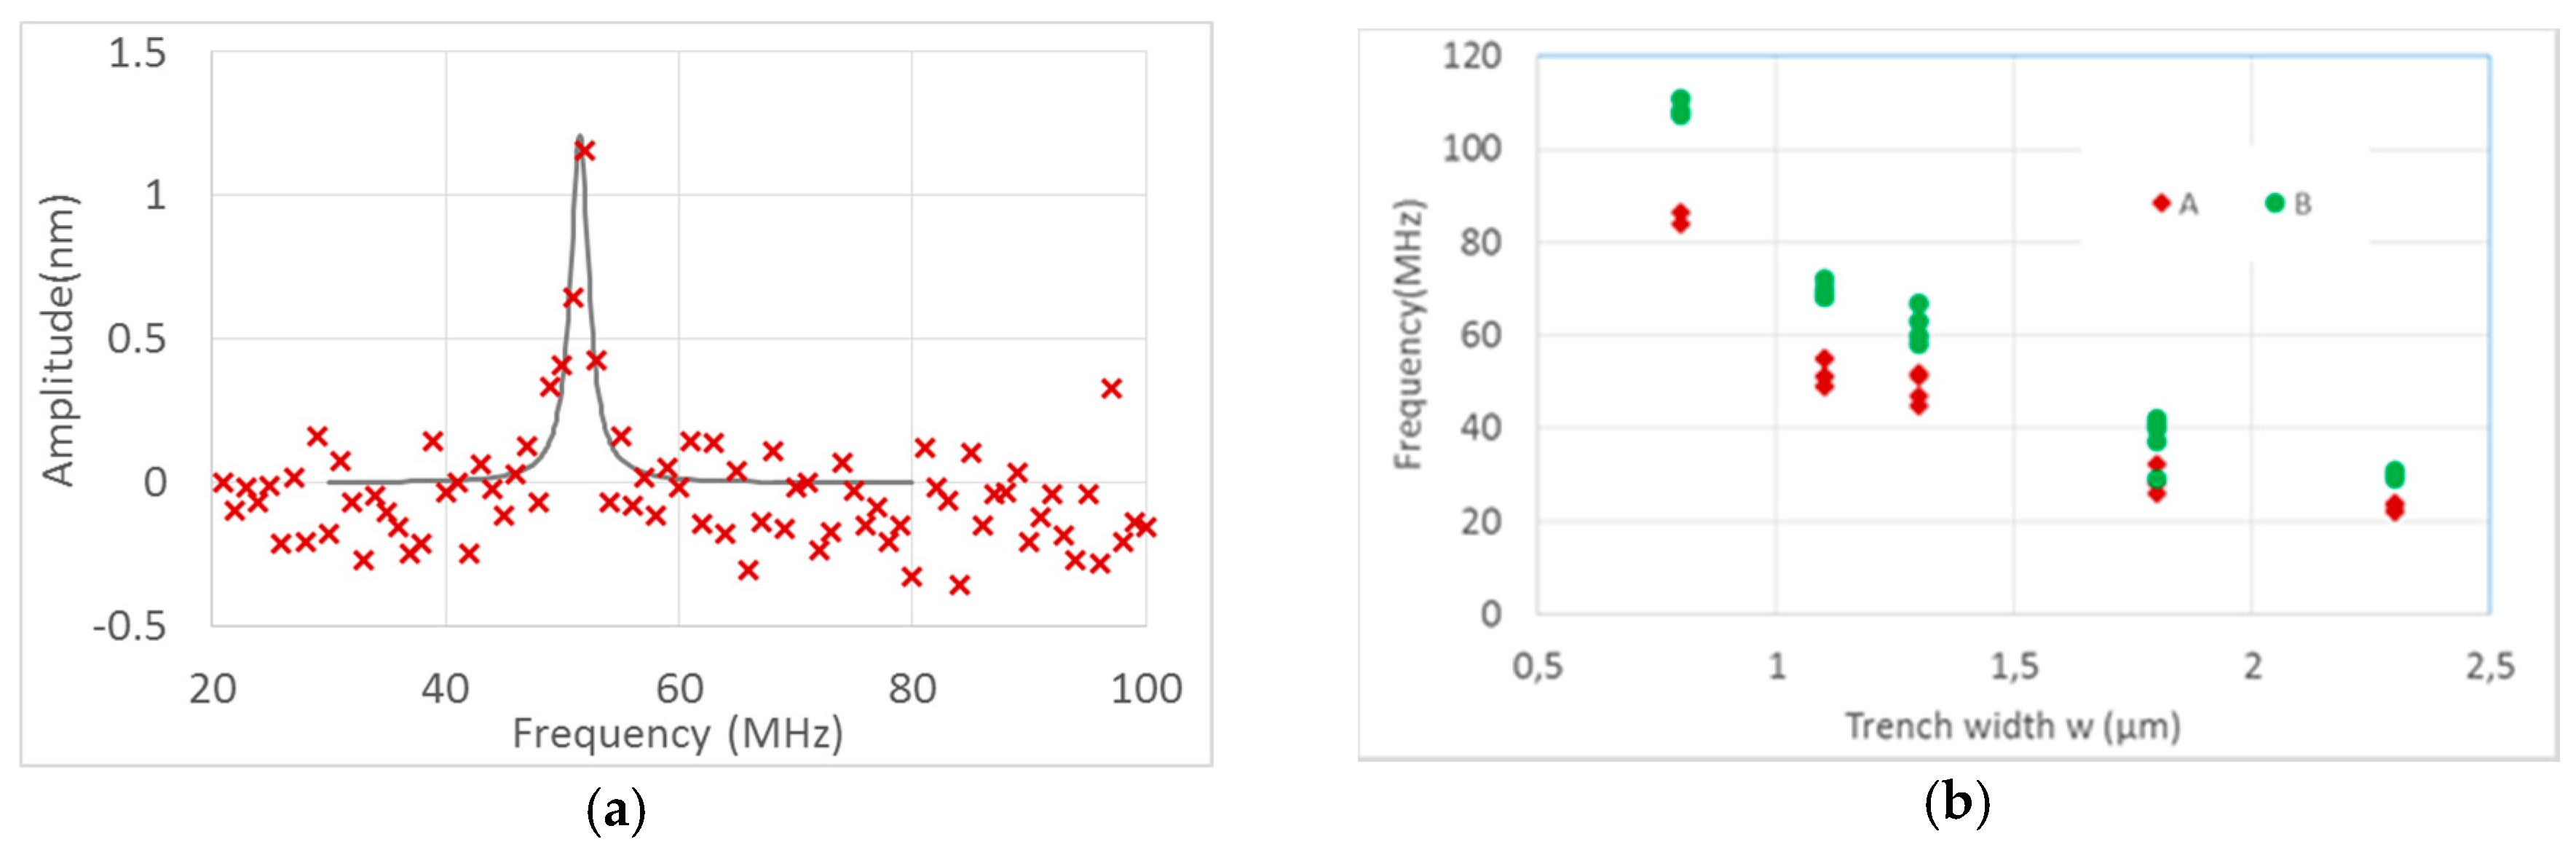
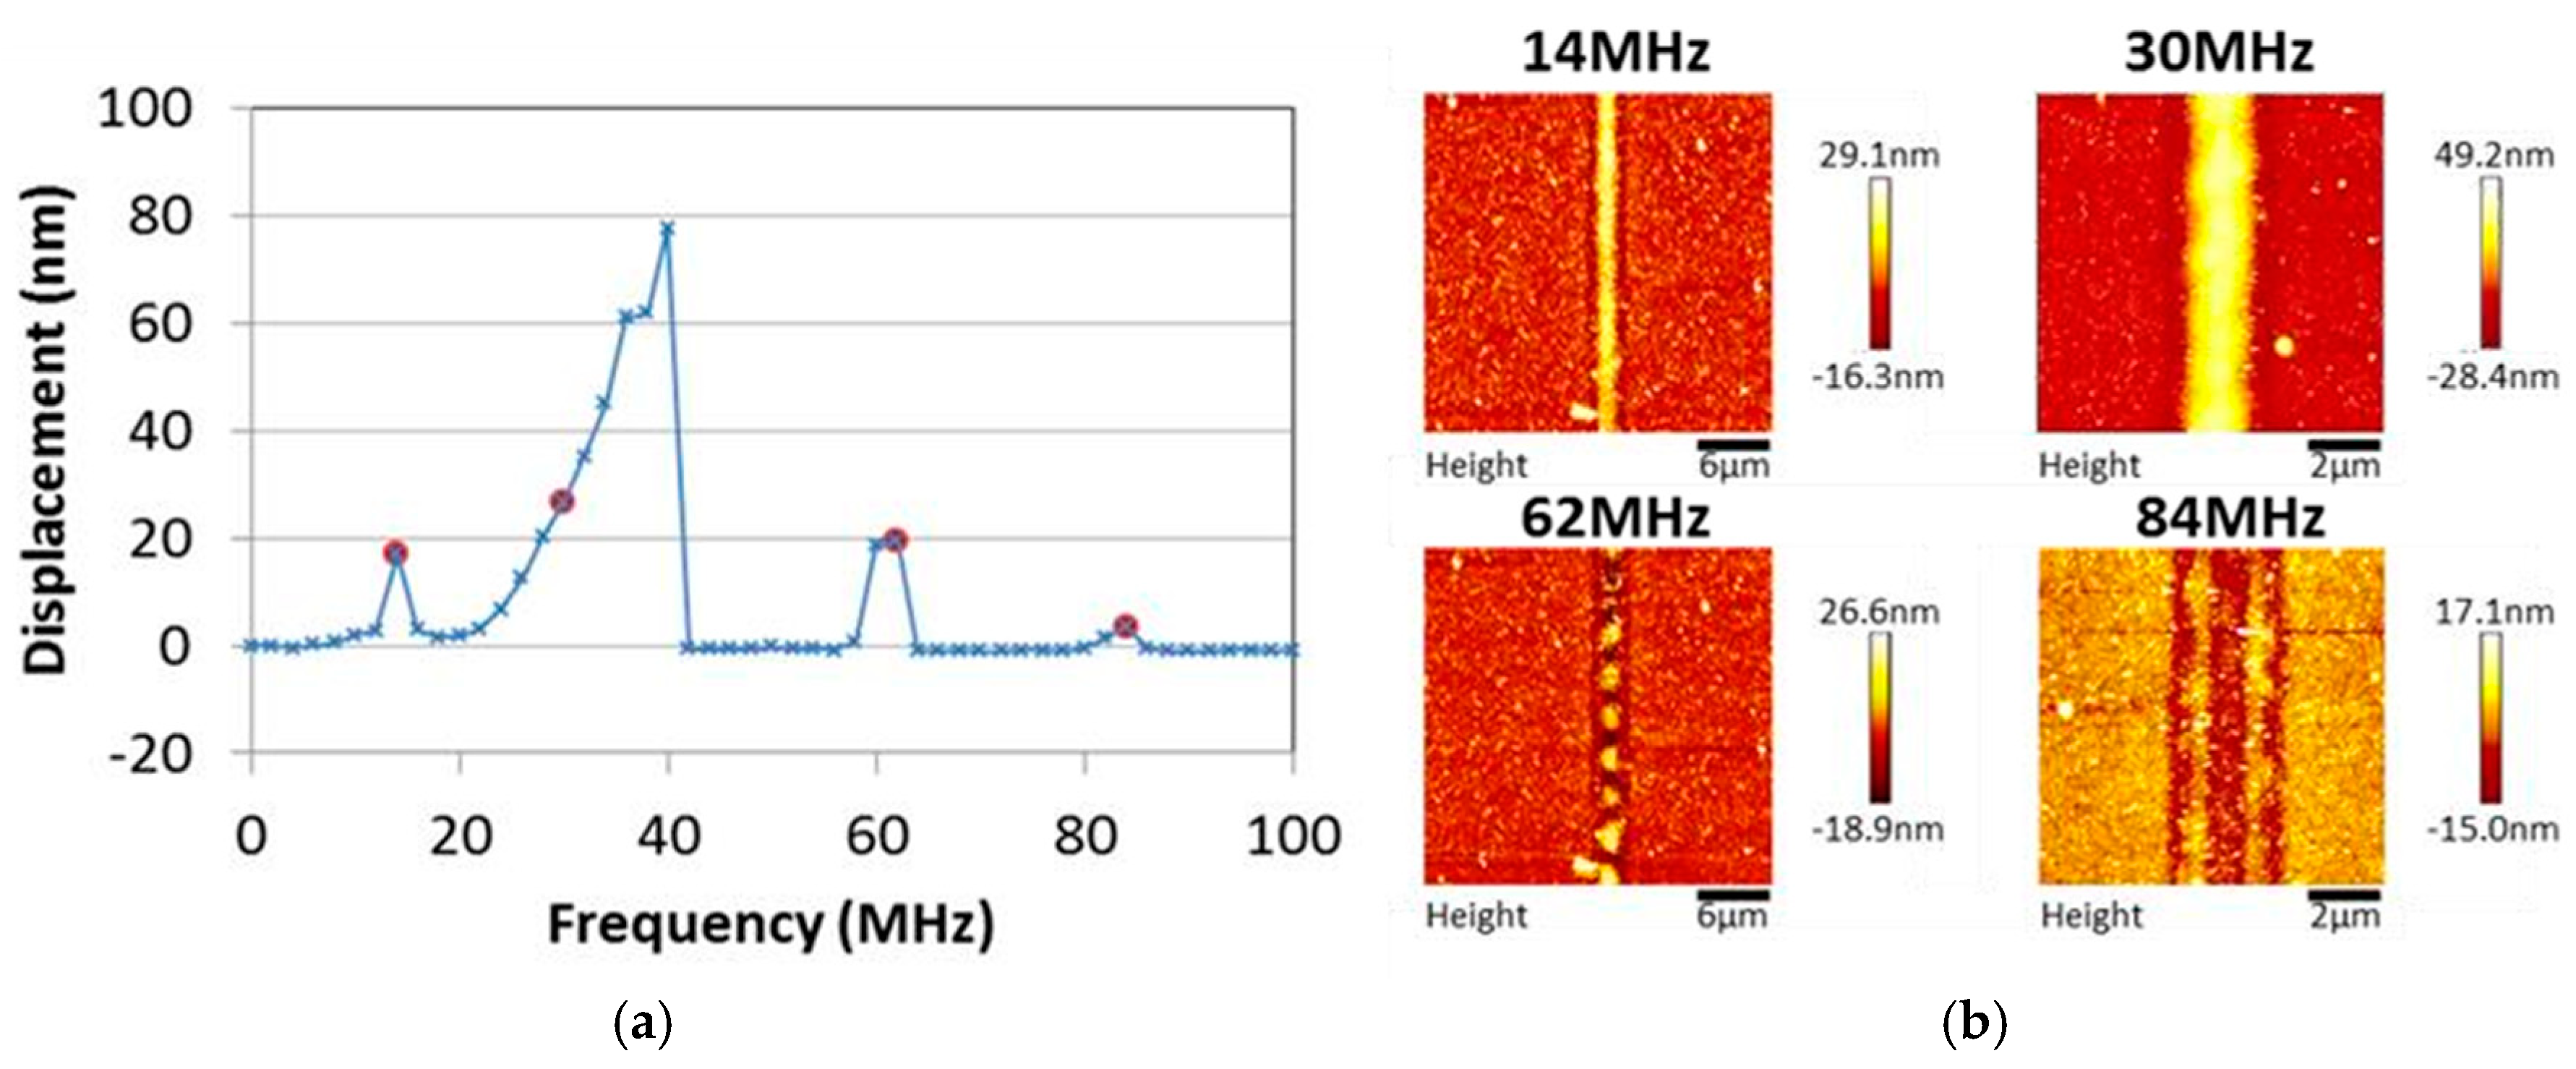
3. Results
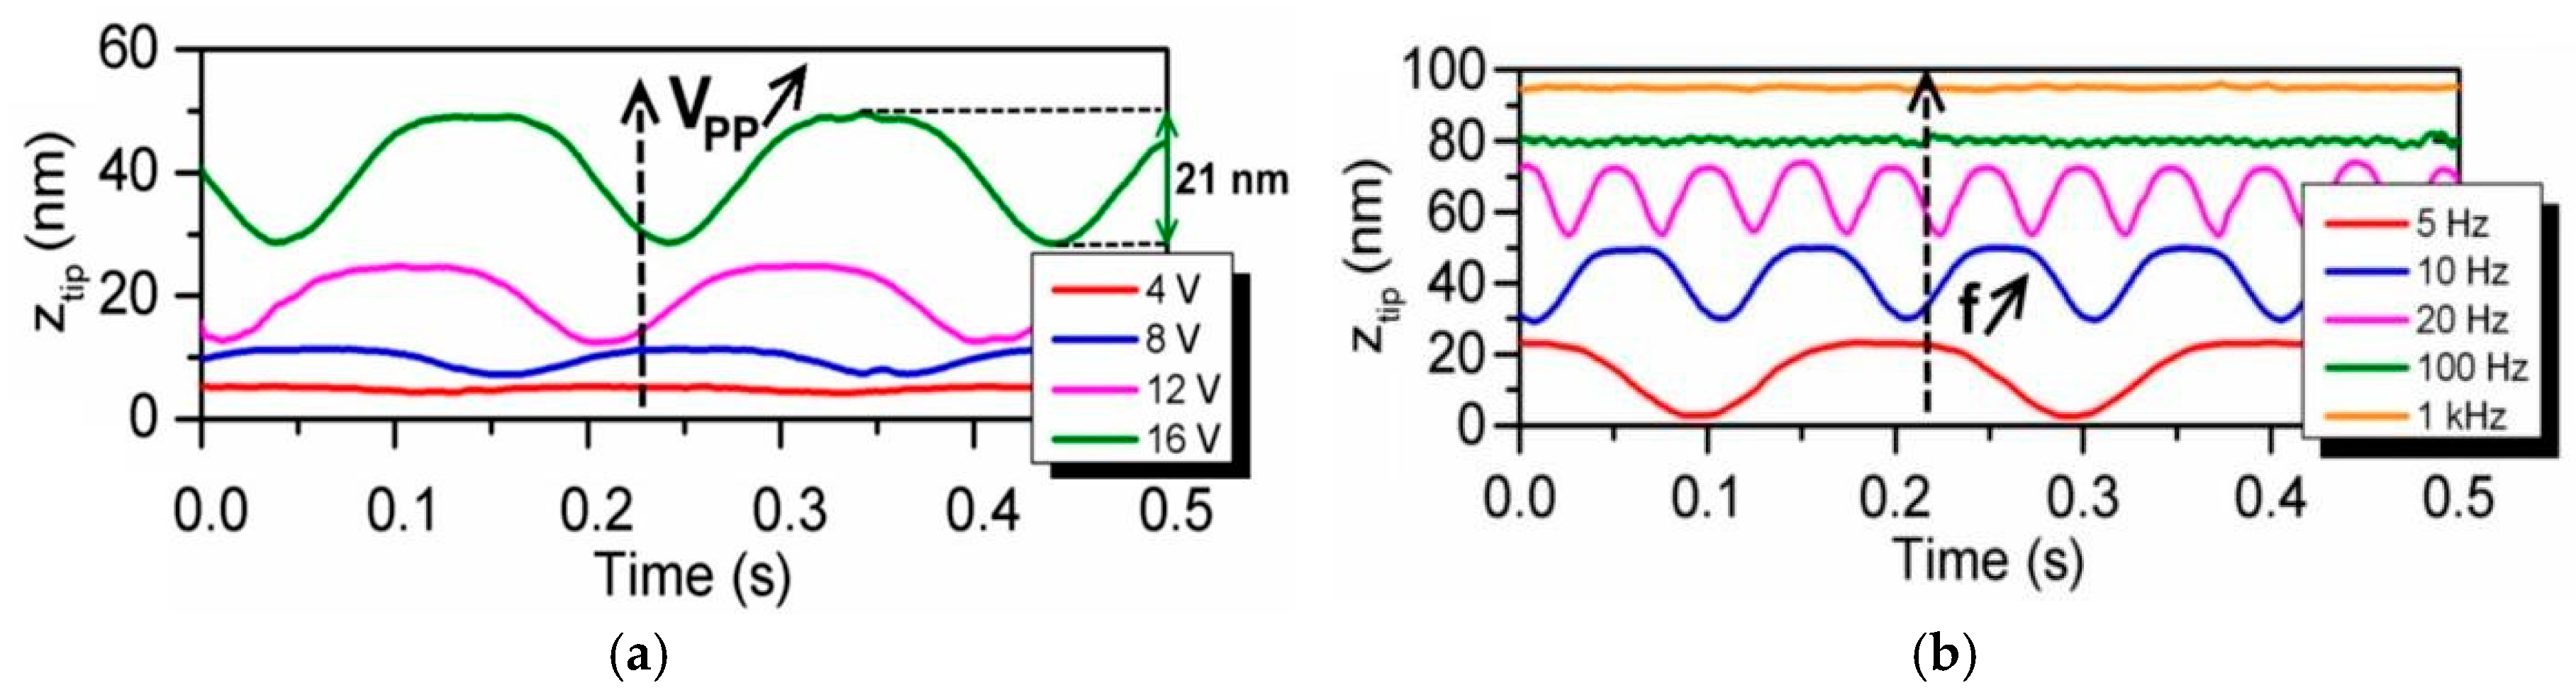
3.1. Low Frequency
3.2. Frequency Spectrum
4. Conclusions
Author Contributions
Acknowledgments
Conflicts of Interest
References
- Sébastien, T.; Delaunay, M.; Ghis, A. Carbon-Metal Vibrating Nanomembranes for High Frequency Microresonators. Diamond Relat. Mater. 2018, 81, 138–45. [Google Scholar] [CrossRef]
- Luo, J.K.; Fu, Y.Q.; Le, H.R.; Williams, J.A.; Spearing, S.M.; Milne, W.I. Diamond and Diamond-like Carbon MEMS. J. Micromech. Microeng. 2007, 17, S147–S63. [Google Scholar] [CrossRef]
- Delaunay, M.; Touchais, E. Electron Cyclotron Resonance Plasma Ion Source for Material Depositions. Rev. Sci. Instrum. 1998, 69, 2320–2324. [Google Scholar] [CrossRef]
- Suk, J.W.; Murali, S.; An, J.; Ruoff, R.S. Mechanical Measurements of Ultra-Thin Amorphous Carbon Membranes Using Scanning Atomic Force Microscopy. Carbon 2012, 50, 2220–2225. [Google Scholar] [CrossRef]
- Thibert, S.; Ghis, A.; Delaunay, M. AFM Study of 2D Resonators Based on Diamond-Like-Carbon. In Proceedings of the 2016 IEEE 16th International Conference on Nanotechnology (IEEE-NANO), Sendai, Japan, 22–25 August 2016; pp. 479–82. [Google Scholar]
- Lee, J.; Feng, P.X.-L. High Frequency Graphene Nanomechanical Resonators and Transducers. In Proceedings of the 2012 IEEE International Conference on Frequency Control Symposium (FCS), Baltimore, MD, USA, 21–24 May 2012; pp. 1–7. [Google Scholar]
- Zhang, X.; Waitz, R.; Yang, F.; Lutz, C.; Angelova, P.; Gölzhäuser, A.; Scheer, E. Vibrational Modes of Ultrathin Carbon Nanomembrane Mechanical Resonators. Appl. Phys. Lett. 2015, 106, 063107. [Google Scholar] [CrossRef]


Publisher’s Note: MDPI stays neutral with regard to jurisdictional claims in published maps and institutional affiliations. |
© 2018 by the authors. Licensee MDPI, Basel, Switzerland. This article is an open access article distributed under the terms and conditions of the Creative Commons Attribution (CC BY) license (https://creativecommons.org/licenses/by/4.0/).
Share and Cite
Ghis, A.; Thibert, S.; Delaunay, M. Ultrathin Amorphous Carbon as Active Part of Vibrating MEMS. Proceedings 2018, 2, 818. https://doi.org/10.3390/proceedings2130818
Ghis A, Thibert S, Delaunay M. Ultrathin Amorphous Carbon as Active Part of Vibrating MEMS. Proceedings. 2018; 2(13):818. https://doi.org/10.3390/proceedings2130818
Chicago/Turabian StyleGhis, Anne, Sébastien Thibert, and Marc Delaunay. 2018. "Ultrathin Amorphous Carbon as Active Part of Vibrating MEMS" Proceedings 2, no. 13: 818. https://doi.org/10.3390/proceedings2130818
APA StyleGhis, A., Thibert, S., & Delaunay, M. (2018). Ultrathin Amorphous Carbon as Active Part of Vibrating MEMS. Proceedings, 2(13), 818. https://doi.org/10.3390/proceedings2130818