Abstract
We developed and optimized a new fiber optic sensor using palladium foils attached to optical fiber Bragg gratings (FBG) for hydrogen measurements. Fifteen in parallel processed sensors were characterized and qualified in two custom tailored experimental set ups and their response to a 5% hydrogen/nitrogen gas mixture and the same gas bubbled trough transformer oil was measured. The hydrogen response is similar for both medium and close to the theoretical maximum sensitivity, but the response time was found to be very different, much slower in oil than in gas. A theoretical comparison of hydrogen diffusion trough palladium and hydrogen absorption on the palladium surface as well as a measurement of the hydrogen uptake and diffusion trough the oil to the sensor have been done to investigate the origin of the different response time. They indicate that the response time determining step is the absorption of hydrogen on the palladium surface and that this process is slowed down in oil compared to a pure gas environment.
1. Introduction
The most widely accepted indication for the health status of a transformer is dissolved gas analysis (DGA), with hydrogen being the most significant fault gas [1]. Conventionally an on-site collected sample of oil is analysed in a laboratory but due to increased demand on the electricity grid a recent approach is to monitor more and smaller transformers online. After demonstration of the first fiber optic based hydrogen sensor [2] a large number of sensors has been presented; several review papers give a good overview of the field [3,4]. FBG based sensors have the advantage of being cost efficient, intrinsically safe in combustible gases, insensitive to electromagnetic noise and able to tolerate harsh environments making them ideal candidates for online DGA.
2. Materials and Methods
2.1. Fibre Bragg Grating and Palladium Foil Based Hydrogen Sensor
Palladium is often the chosen material for hydrogen sensing as it selectively absorbs hydrogen at normal temperatures and pressures and goes along with a volumetric expansion of the palladium. The strain change can be measured via peak wavelength change of the back reflected light with a FBG. After evaluating different design concepts aiming for high hydrogen sensitivity, a sensor based on a 100 μm thick palladium foil and a bare (uncoated) FBG was chosen [5], see Figure 1. A new manufacturing process was developed to further improve the sensor sensitivity [6], which includes a vacuum bagging process of a palladium(foil)-fiber-composite. Vacuum bagging proved to be an excellent method for sensor manufacturing since a good fiber groove alignment was achieved; in addition the bond line thickness is decreased and several sensor can be manufactured simultaneously.
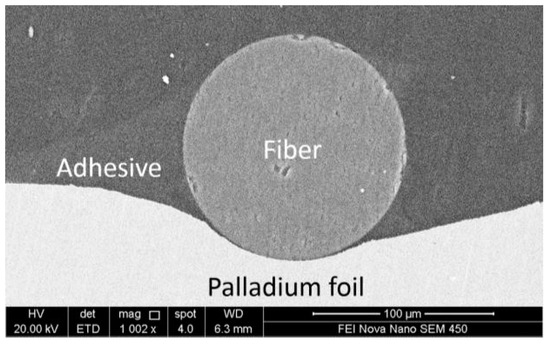
Figure 1.
SEM image of a palladium foil based FBG sensor.
2.2. Experimental Test Setups
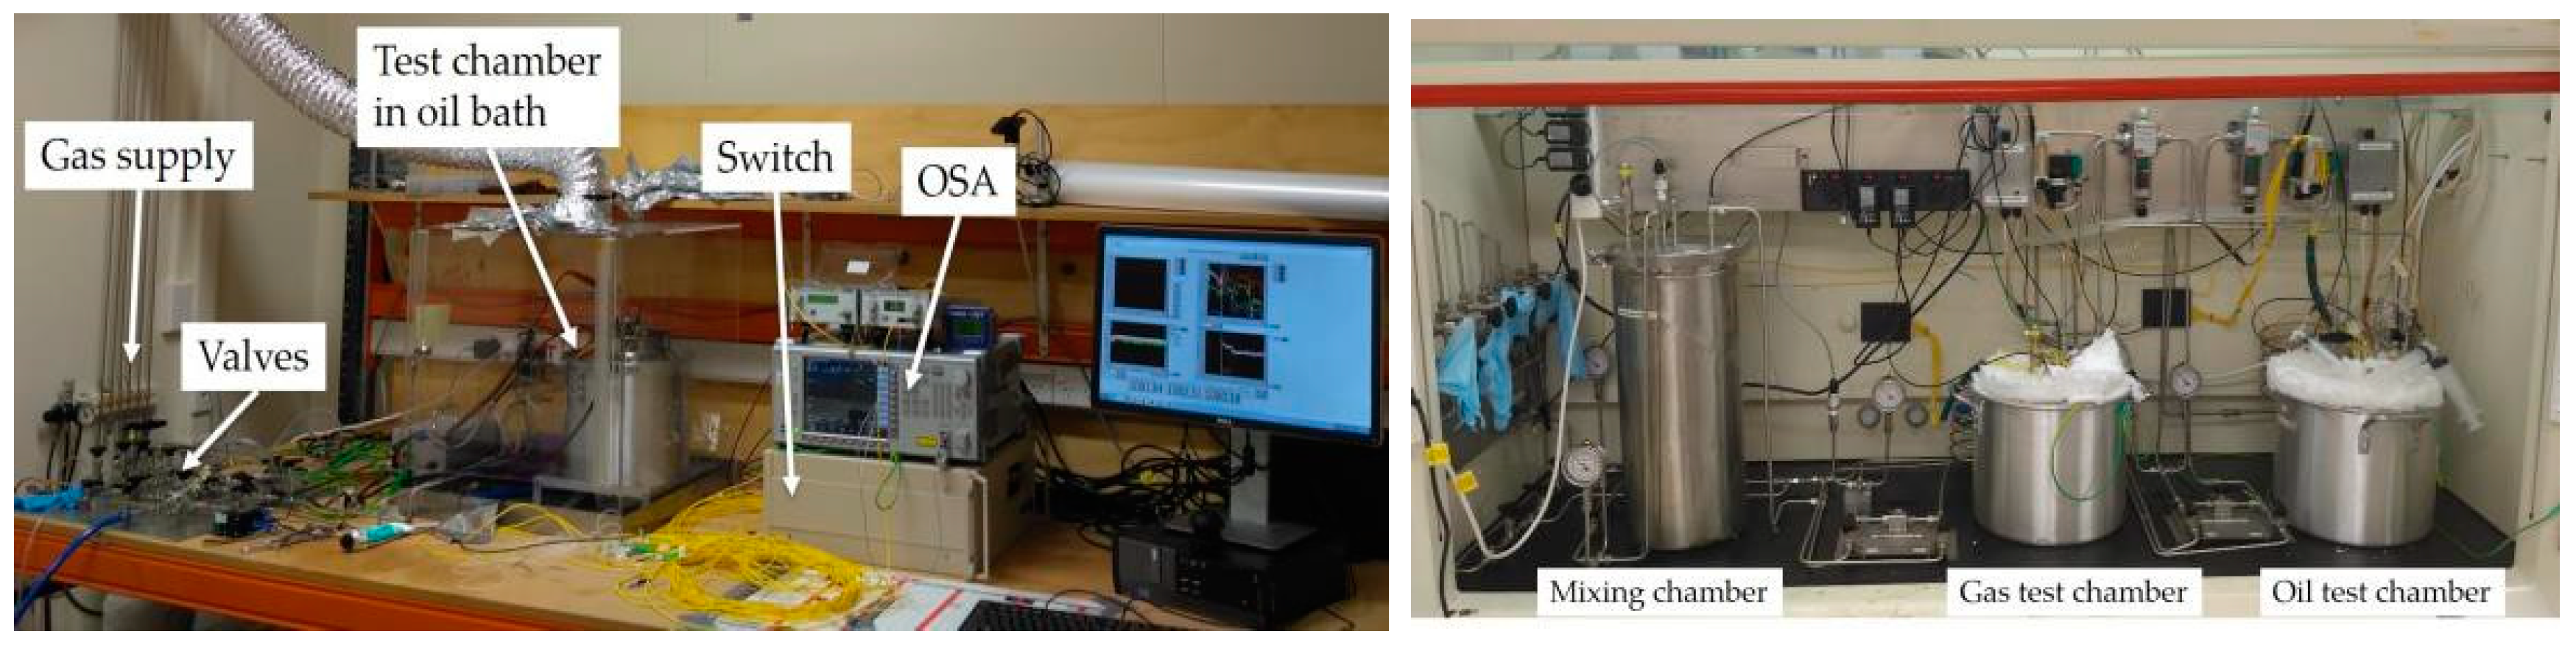
The sensors were characterised in two self-built test setups that are stable in temperature, pressure and gas concentration. They are described in detail in previous work [5,7]. Different H2 in N2 gas concentration values can be pre-mixed in a mixing chamber and then transferred into a gas measurement chamber or bubbled trough transformer oil (oil used: BS 148 class-I, Savita Oil Tech. Ltd). A photograph of both setups is shown in Figure 2. To measure the amount of dissolved gases in the oil a commercial DGA system (Myrkos-Version: Field package, Morgan Schaffer) was used.

Figure 2.
Experimental setups to measure the sensor response in hydrogen gas mixtures (left) and dissolved hydrogen in oil mixtures (right).
3. Results and Discussion
3.1. Sensor Repsonse in Gas and Oil
Fifteen sensors were manufactured in parallel using vacuum bagging, then tested in gas and finally transferred into oil. The response curve at 90 °C for a 5% H2 in N2 gas mixture at as well as the same gas bubbled trough oil are shown in Figure 3.
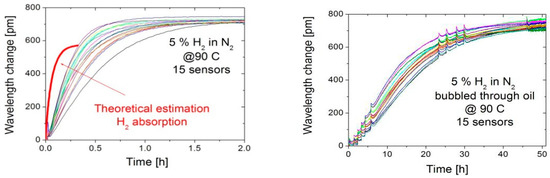
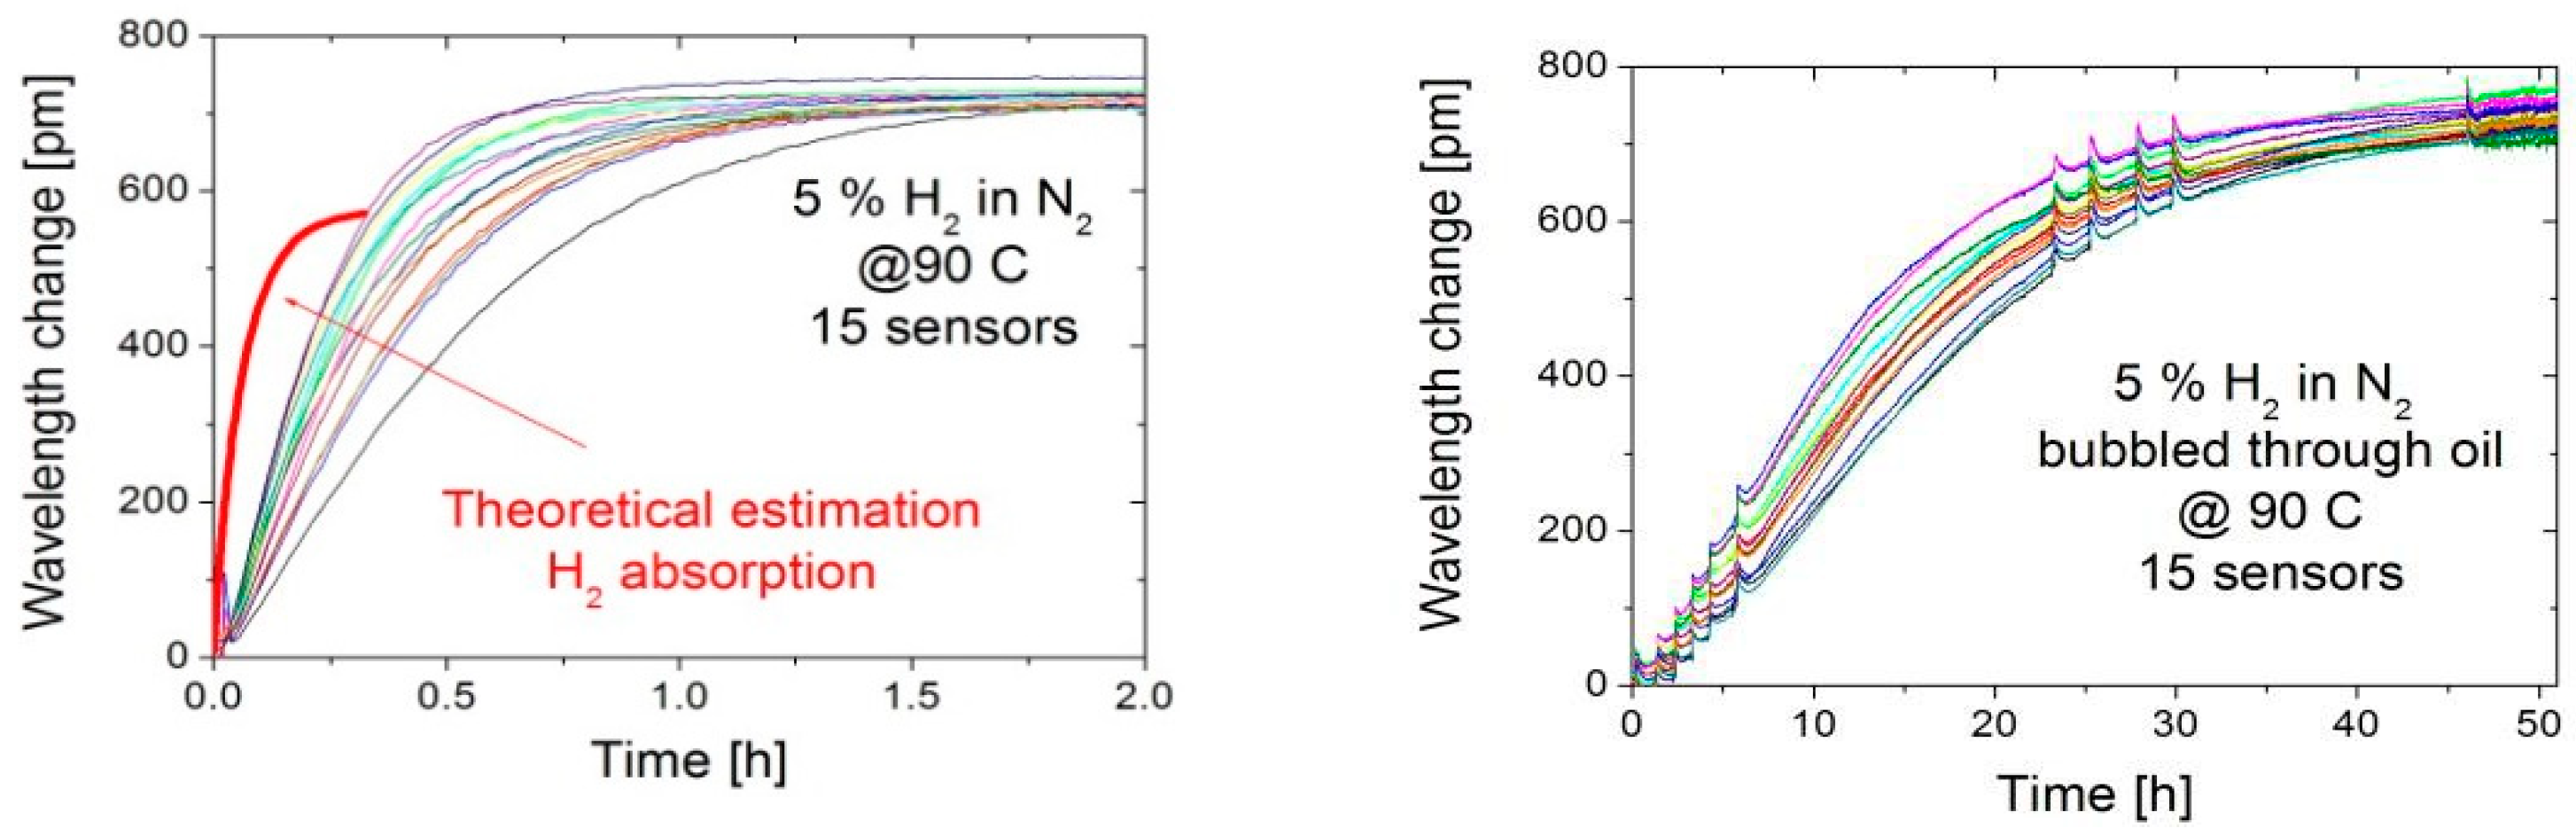
Figure 3.
Response of fifteen parallel processed sensors to 5% H2 in N2 gas mixture (left) and the same gas bubbled trough oil (right) both at 90 °C.
The sensors showed a very good overall final response with only small standard deviation between all 15 sensors; for 5% H2 in N2 gas mixture at 90 °C the average wavelength change was 724 pm with a low standard deviation of 13 pm. The gas bubbled trough oil resulted in 2700 ppm dissolved hydrogen in oil, the corresponding wavelength change was similar to the gas value; 790 pm ± 35 pm at 90 °C
The response time in both media is very different though. In gas the average response time, taken at the time of 99% final response value is 1.5 h with a standard deviation of 0.5 h. In oil the average response time is more than 50 times longer with an average value of 76.8 h and a standard deviation between all 15 sensors of 3.8 h.
3.2. Discussion: Sensor Response Time
To estimate the time for the hydrogen to diffuse into the palladium the diffusion equation can be solved by separation of variables with the initial condition n = 0, assuming a constant hydrogen concentration on the palladium surface at all times, means Dirichlet boundary condition c = 1 [8]:
with mole ratio n = H/Pd, diffusion coefficient 𝐷 = 𝐷𝑜 exp (−), following an Arrhenius law [9], location x in the palladium relative to the surface, sample thickness δ and time t. By using 2.9 × 10⁻⁷ m2/s for D0 and 22.2 J/mol for Ea [10] it can be estimated that at 90 °C the hydrogen is fully diffused into the center of the 100 μm thick palladium foil in less than 30 s. This means that hydrogen diffusion trough the palladium is not the major factor in the response time of these sensors. The hydrogen absorption rate, means adsorption on the palladium surface and dissociation into its atoms can be calculated for small n - where Sieverts’s law is applicable - according to [10]:
with VPd being the molar volume and ϑ the reaction rate given by :
with K Sieverts’s constant and k and k’ rate constants for absorption and desorption of hydrogen on the palladium surface. The solution of Equation (2) is [8]:
with pH2 being the hydrogen partial pressure and Ic an integration constant. Equation (4) can be numerical solved for n and the corresponding wavelength shift of the FBG can be calculated via Δλ=0.063 n 1.21 pm/µε [8]. The resulting curve is also shown in Figure 3 (left plot, red line). The general shape of the curve is similar to the measured curves; both can be approximated well with an exponential decay curve. The response time of ~0.3 h has the right order of magnitude for sensors in gas but is still a factor of around five lower. This difference could be due to surface impurities as well as a different shape and overall foil thickness of 100 µm. The absorption and desorption rate constants k and k’ in [10] were determined for 5 µm thick palladium foils, which were cleaned in a complex multi-step cleaning process.
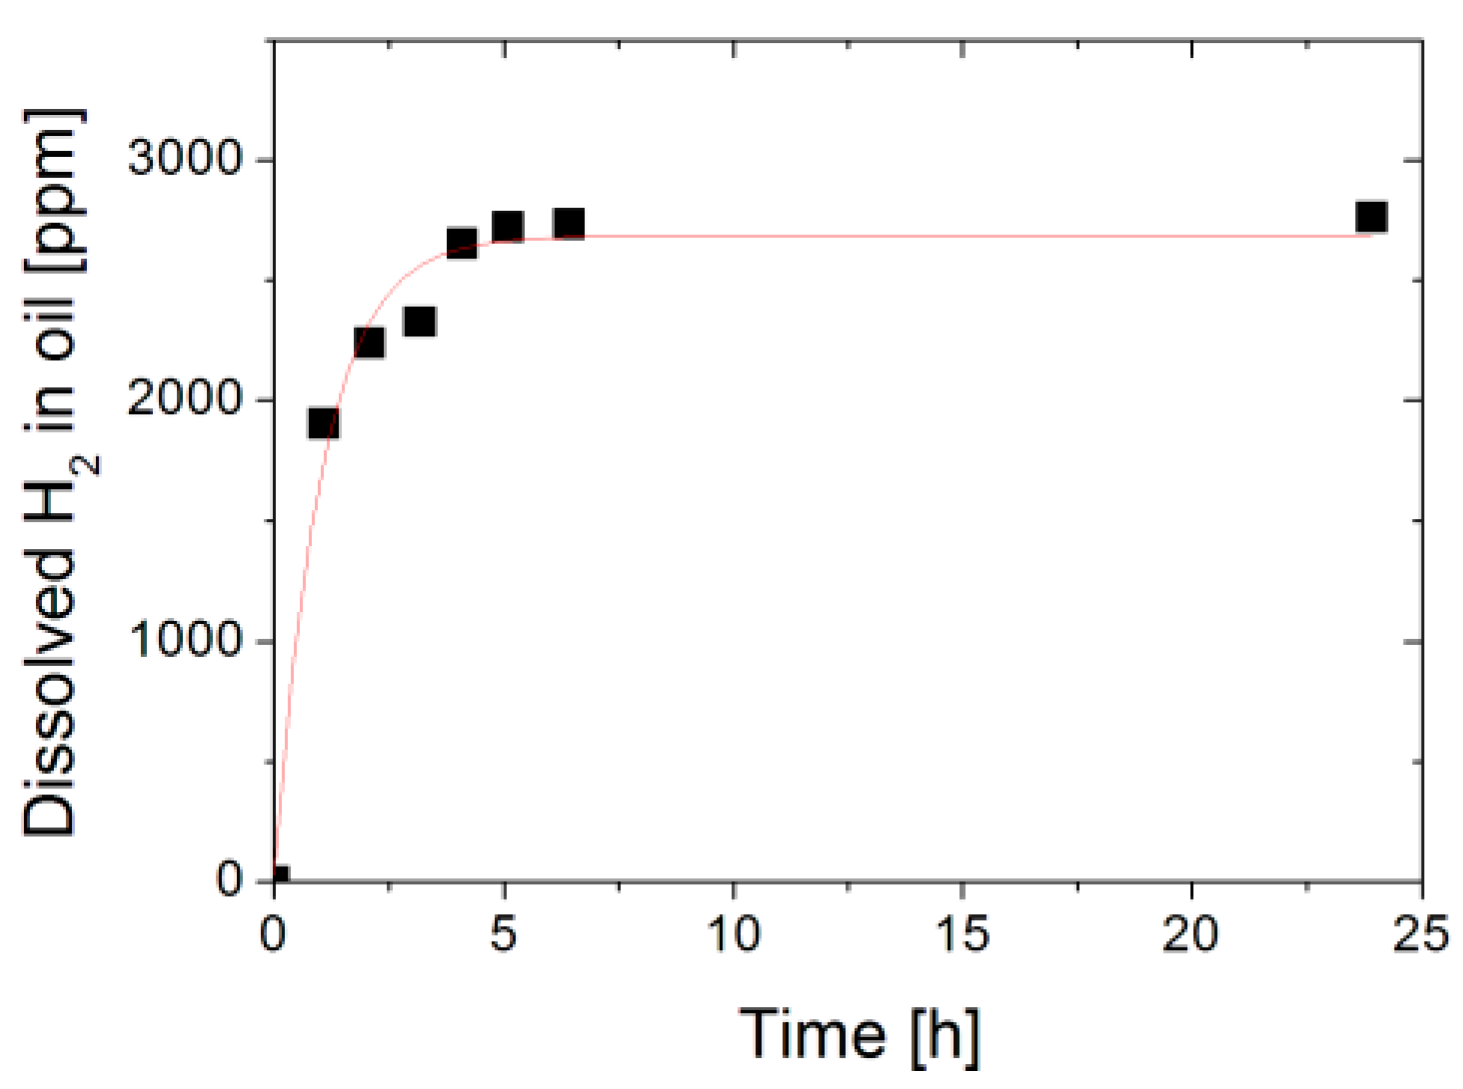
A possible factor increasing the response time of the sensor in oil is the uptake and diffusion of hydrogen gas in the oil during the bubbling process. Therefore the hydrogen uptake over time was measured with a commercial DGA system located close to the sensor (~1 cm), see Figure 4. The uptake and diffusion trough the oil is slowing down the sensor response in oil considerably, but the final value is reached after around 4.5 h, still more than an order of magnitude faster than the measured sensor response.
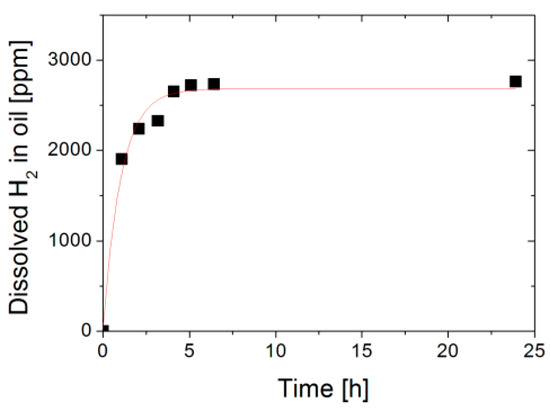
Figure 4.
Uptake of hydrogen in oil by bubbling 5% H2 in N2 gas mixture through oil.
Therefore also the diffusion trough oil and uptake of hydrogen seems to be not the major factor influencing the sensor response time in oil. It is more likely that the long response time is due to a slowed down absorption process of hydrogen at the palladiums surface in the oil environment similar to the well know CO poisoning of palladium [11].
Acknowledgments
This work was supported by the New Zealand Ministry of Business, Innovation and Employment under the program RTVU1304 “Electromagnetic Devices”. The authors like to thank Sebastiampillai Raymond and Stefaan Janssens (Callaghan Innovation, NZ) for advice with optical fiber sensors and Sarah Spencer for the SEM analysis (Robinson Research Institute, NZ). Financial support from ETEL Limited (Auckland) is gratefully acknowledged and we like to thank Bhaba Das (ETEL) for valuable discussions.
Conflicts of Interest
The authors declare no conflict of interest.
References
- AIEEEC57.104-2008; IEEE Guide for the Interpretation of Gases Generated in Oil-Immersed Transformers. Institute of Electrical and Electronics Engineers: New York, NY, USA, 2015.
- Butler, M.A. Optical fiber hydrogen sensor. Appl. Phys. Lett. 1984, 10, 1007–1009. [Google Scholar] [CrossRef]
- Silva, S.F.; Coelho, L.; Frazao, O.; Santos, J.; Malcata, F. A review of palladium-based fiber-optic sensors for molecular hydrogen detection. IEEE Sens. J. 2012, 1, 93–102. [Google Scholar] [CrossRef]
- Dai, J.; Zhu, L.; Wang, G.; Xiang, F.; Wang, Y.Q.M.; Yang, M.M. Optical fiber grating hydrogen sensors: A review. Sensors 2017, 3, 577. [Google Scholar] [CrossRef] [PubMed]
- Fisser, M.; Badcock, R.; Teal, P.; Janssens, S.; Hunze, A. Palladium based hydrogen sensors using fiber Bragg gratings. J. Lightw. Technol. 2017, 36, 850–856. [Google Scholar] [CrossRef]
- Fisser, M.; Badcock, R.; Teal, P.; Hunze, A. Improving the Sensitivity of Palladium Based Fiber Optic Hydrogen Sensors. J. Lightw. Technol. 2018, 36, 2166–2174. [Google Scholar] [CrossRef]
- Fisser, M.; Badcock, R.A.; Teal, P.D.; Swanson, A.; Hunze, A. Development of hydrogen sensors based on fiber Bragg grating with a palladium foil for online dissolved gas analysis in transformers. SPIE Opt. Metrol. 2017, 10329, 103292P–103292P-9. [Google Scholar]
- Fisser, M. Development of a Fiber Optic Sensor for Hydrogen Monitoring in Transformers. Ph.D. Thesis, Victoria University of Wellington, Kelburn, New Zealand, 2018. [Google Scholar]
- Alefeld, G.; Volkl, J. Hydrogen in Metals I—Basic Properties; Springer: Berlin, Germany, 1978; Volume 28. [Google Scholar]
- Auer, W.; Grabke, H. The kinetics of hydrogen absorption in palladium (α-and β-phase) and palladium-silver-alloys. Berichte der Bunsengesellschaft fur Physikalische Chemie 1974, 78, 58–67. [Google Scholar]
- Prakash, J.R.; McDaniel, A.H.; Horn, M.; Pilion, L.; Sunal, P.; Messier, R.; McGrath, R.T.; Schweighardt, F.K. Hydrogen sensors: Role of palladium thin film morphology. Sens. Actuators B 2007, 12, 439–446. [Google Scholar]

Publisher’s Note: MDPI stays neutral with regard to jurisdictional claims in published maps and institutional affiliations. |
© 2018 by the authors. Licensee MDPI, Basel, Switzerland. This article is an open access article distributed under the terms and conditions of the Creative Commons Attribution (CC BY) license (https://creativecommons.org/licenses/by/4.0/).