Proceeding Paper

Ultrasound Measurement Technique for Validation of Cryogenic Flows †

Institute of Sensor and Actuator Technology (ISAT), Coburg University of Applied Sciences and Arts, 96450 Coburg, Germany
*
Author to whom correspondence should be addressed.
Presented at the Eurosensors 2018 Conference, Graz, Austria, 9–12 September 2018.
Proceedings 2018, 2(13), 1090; https://doi.org/10.3390/proceedings2131090
Published: 11 December 2018
(This article belongs to the Proceedings of EUROSENSORS 2018)

Abstract

:
An ultrasound sensor system based on the transmission-mode approach is developed to enable the monitoring and sensing of cryogenic liquids and gases—especially gaseous bubbles and gas-liquid interfaces in liquid nitrogen (LN2). Common sensors do not meet requirements of cryogenic and microgravity-environments. Therefore, a special encapsulation design for the optimization of the electrical connection and the mechanical coupling of the ultrasound sensors is needed. The ultrasound system is qualified in LN2 and is able to measure bubbles (size and location) and fill levels with a high spatial resolution in a submillimetre range and a sampling rate of more than 500 Hz.

1. Introduction

On earth, the effects of gravity dominate the dynamics of fluids. In a microgravity environment, such as in orbit, phenomena like sloshing, free surface movement, boiling or formation of bubbles are observed in cryogenic liquids and make a difference to terrestrial situations. Sensors for various fluid physical quantities of fluids are essential for the understanding of the fluid behaviour, for their validation and optimization by computational fluid dynamics (CFD) simulations and for the management of cryogenic liquid propellants in heavy-lift launchers such as the European Ariane rockets [1]. Ultrasound tomography as a non-invasive and non-intrusive system is gaining in importance for the real-time process monitoring in industry [2,3,4] and in research [5,6,7,8]. The novel sensor system is developed for imaging the gas-liquid two-phase flow (such as gaseous nitrogen (N2) and liquid nitrogen (LN2)) inside a pipe by using the ultrasound transmission measurement.

2. Materials and Methods

2.1. Measurement Concept

Ultrasound transmission measurement is based on the interaction of acoustic waves at the interface of different media with different acoustic properties, if sound absorption is neglected. An ultrasound pressure wave is generated in liquid by excitation of a piezoelectric transducer. The amount of transmitted ultrasound energy T is determined by the difference in the acoustic impedance between two components of the media, e.g., liquid (Z1) and gas (Z2) [2,3,9,10,11,12,13]:
T = 4   Z 1 Z 2 ( Z 1 + Z 2 ) 2 , T = Z L N 2 Z N 2 ( Z L N 2 + Z N 2 ) 2 = 4 0.708 10 6 406   k g m 2 s ( 0.708 10 6 + 406 ) 2 k g m 2 s   0.2 %  
In case of an ultrasound wave that is passing through LN2 with an enclosed gaseous boundary of N2, nearly 99% of the acoustic signal is reflected [13]. This significant change of the transmitted acoustic signal amplitude caused by the acoustic impedance mismatch of a gas-liquid interface provides the basis for gas-liquid level sensing and the detection of gaseous bubbles. A simplified ultrasound transmission model is presented in Figure 1.

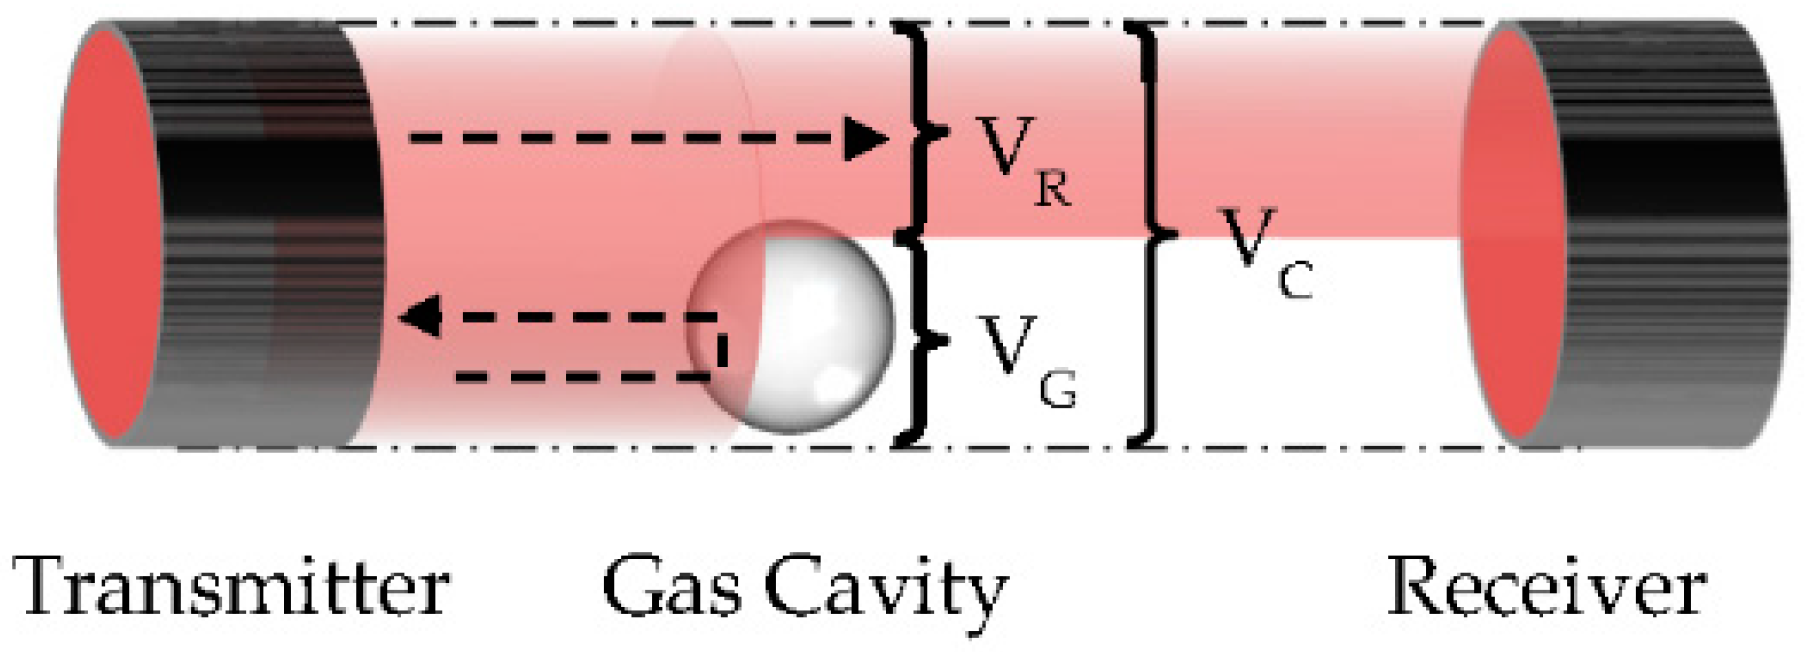
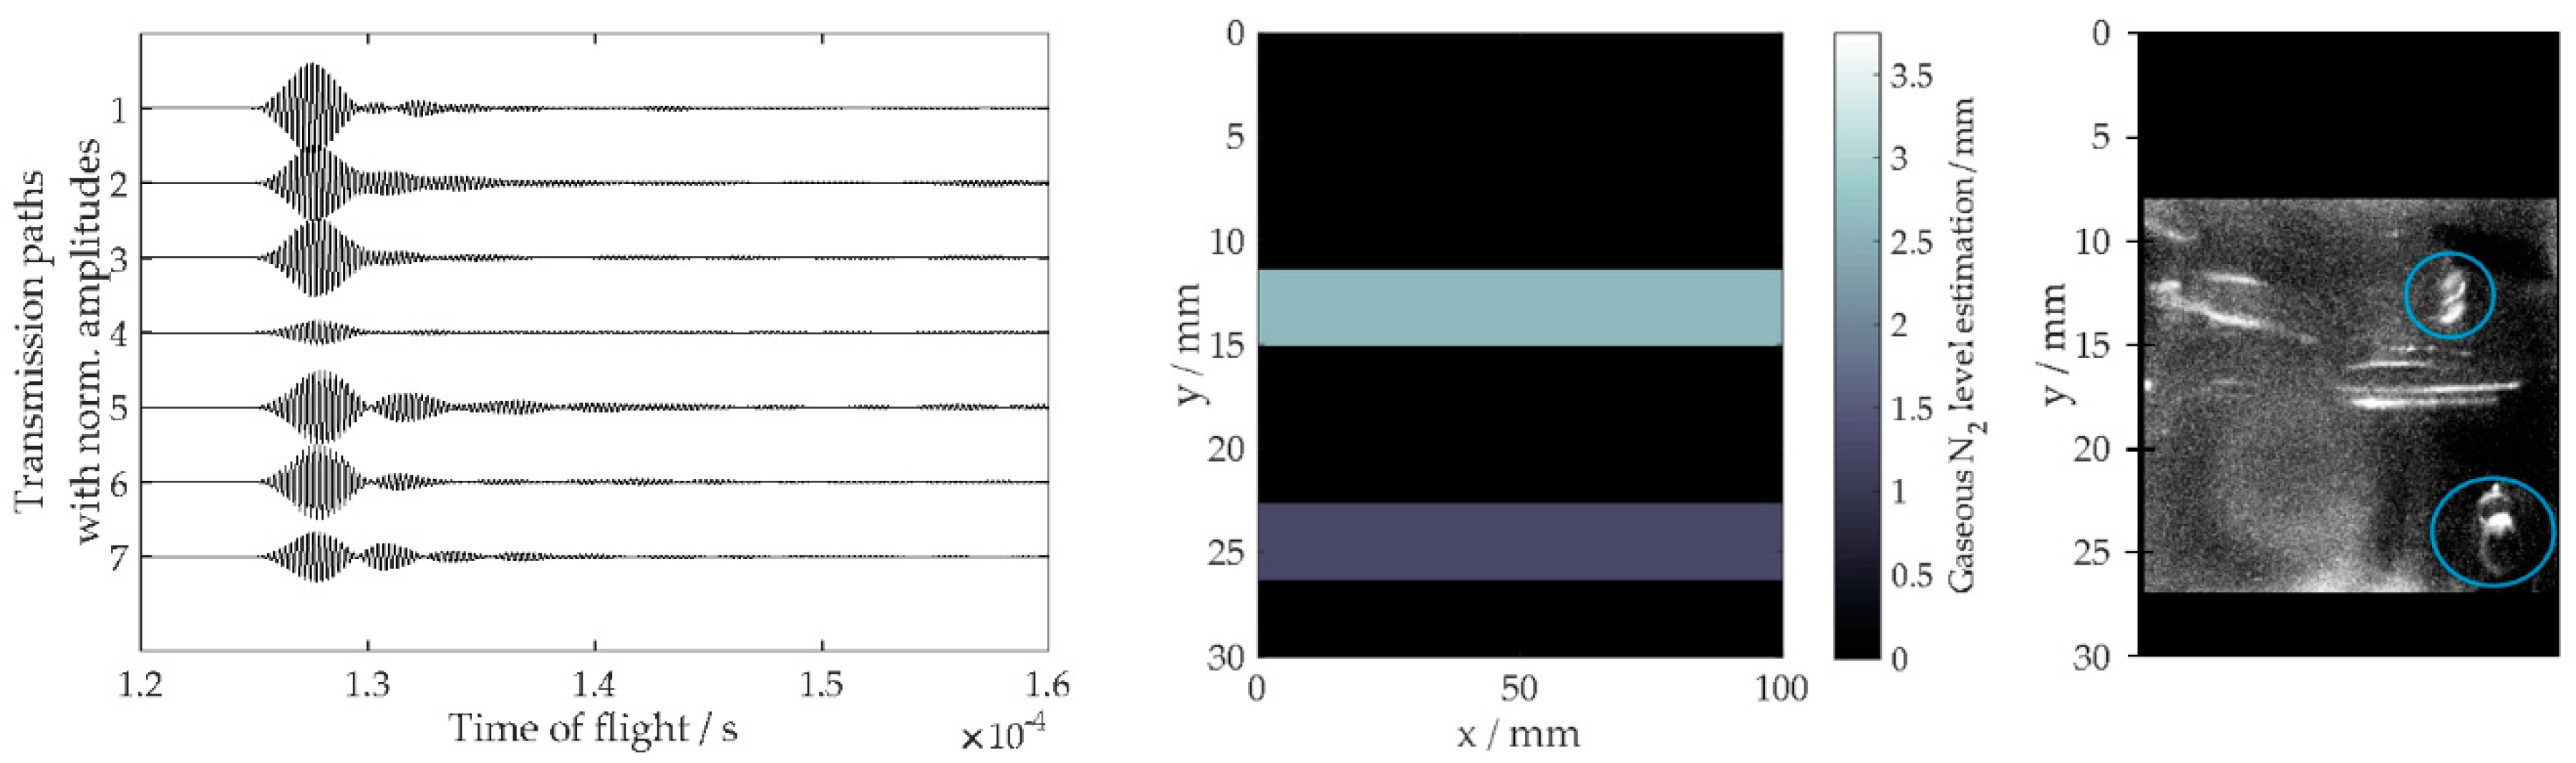
2.1.1. Gas-Liquid Level Sensing

When the transmission path is partially or totally blocked by a gaseous bubble in LN2, the transmitted acoustic signal amplitude decreases (see Figure 1: the gas cavity blocks an increasing part of the sound path). Therefore, the gaseous N2 level can be determined indirectly from the amplitude (e.g., Voltage peak-to-peak value (Vpp)) of the transmitted acoustic signal. The calculation of ultrasound loss voltage VG due to the gas boundary via subtraction of the receiving voltage VR from the calibration voltage VC is the basis for the gas-liquid level sensing. The initial amplitude VC is determined for each transmission path and corresponds to a maximum measurable liquid level of 3.75 mm (vertical level distance to next transmission path). Hence, the equation for the measured gas level Lg is:
L g = 3.75   m m ( 1 V R V C )

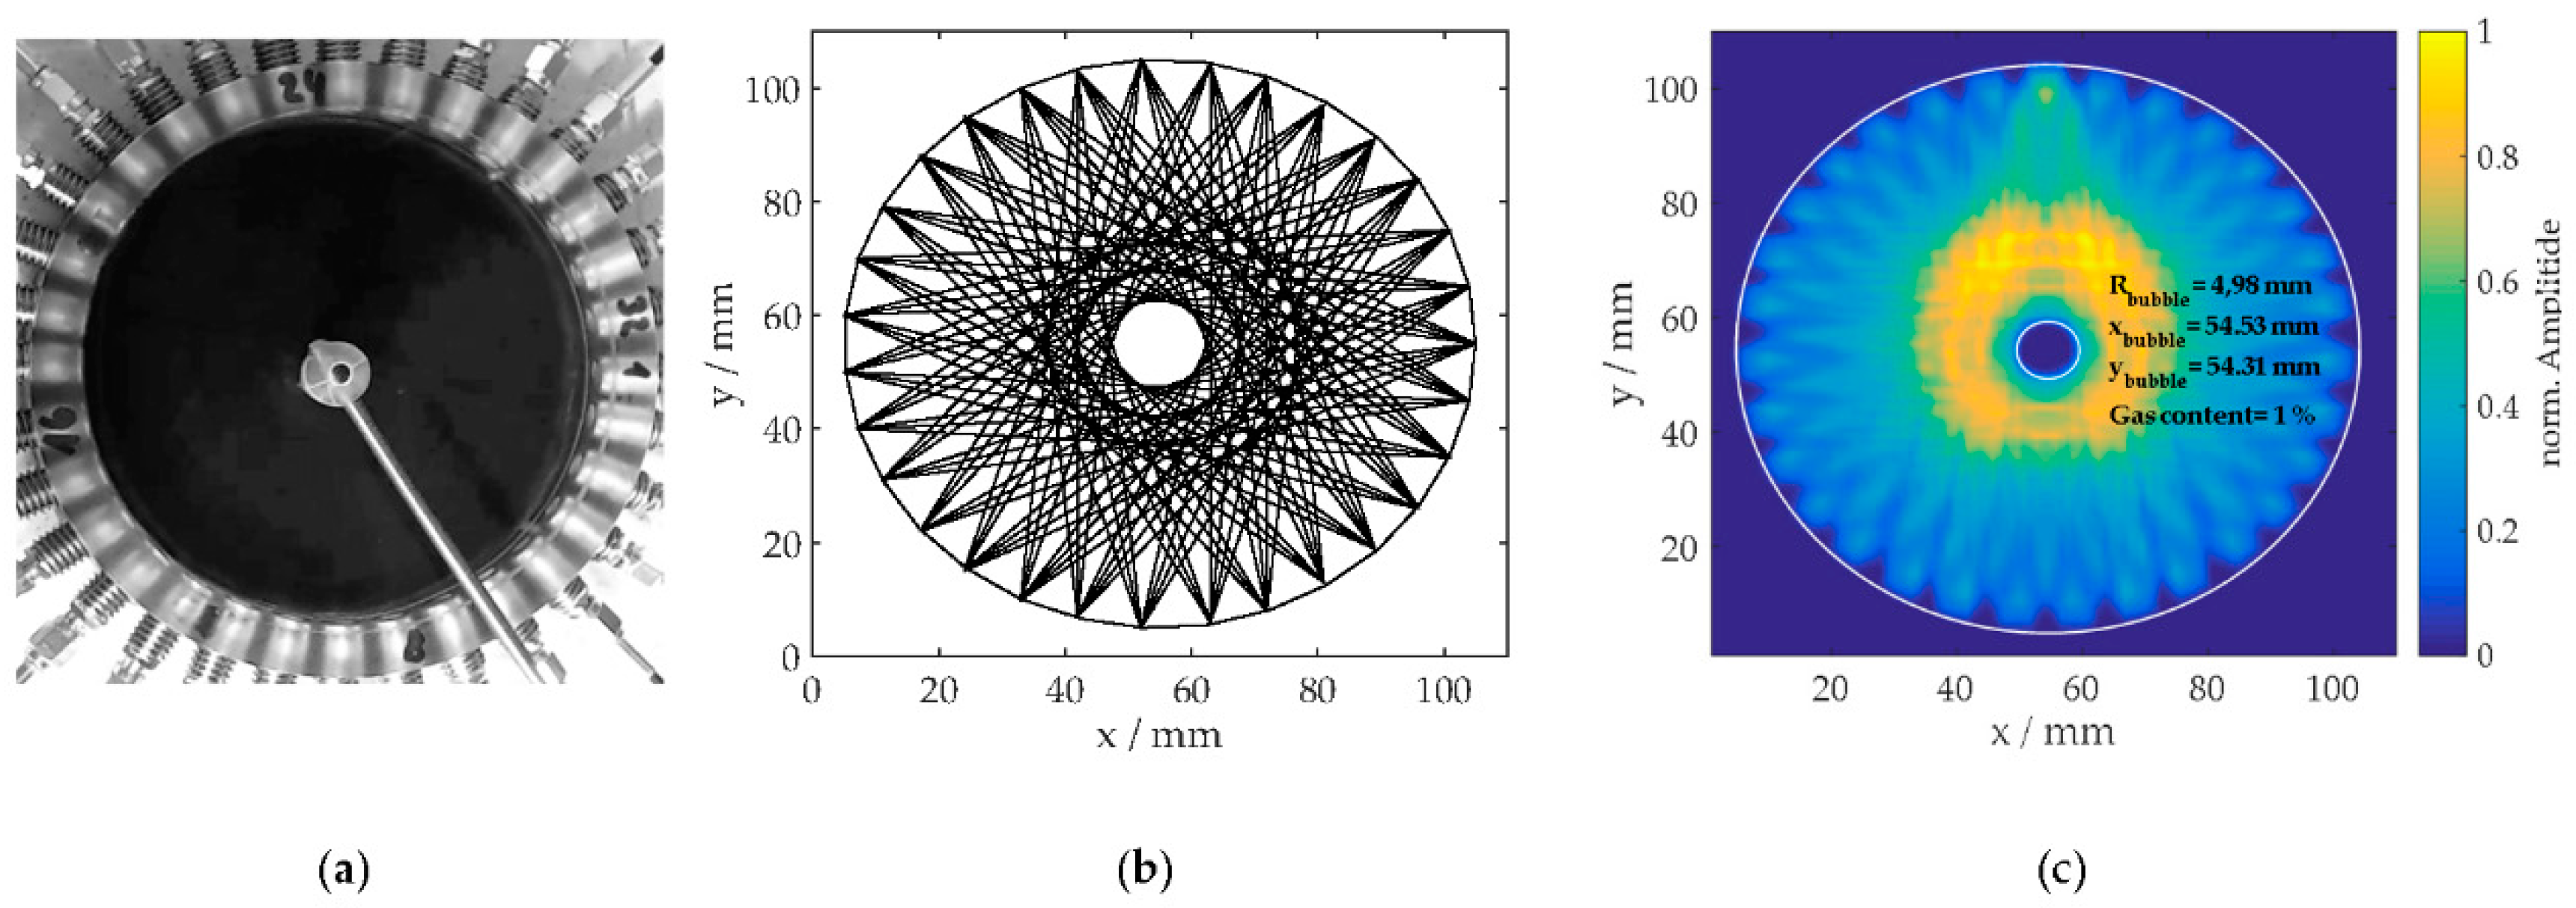
2.1.2. Tomographic Bubble Sensing

A binary amplitude analysis is used for significantly simplifying and accelerating the required back projection algorithms for tomographic bubble sensing [14,15]. Thus a line connecting transmitter and receiver position is drawn into the image if the transmitted signal amplitude is greater than a predefined thresholding voltage value VC.

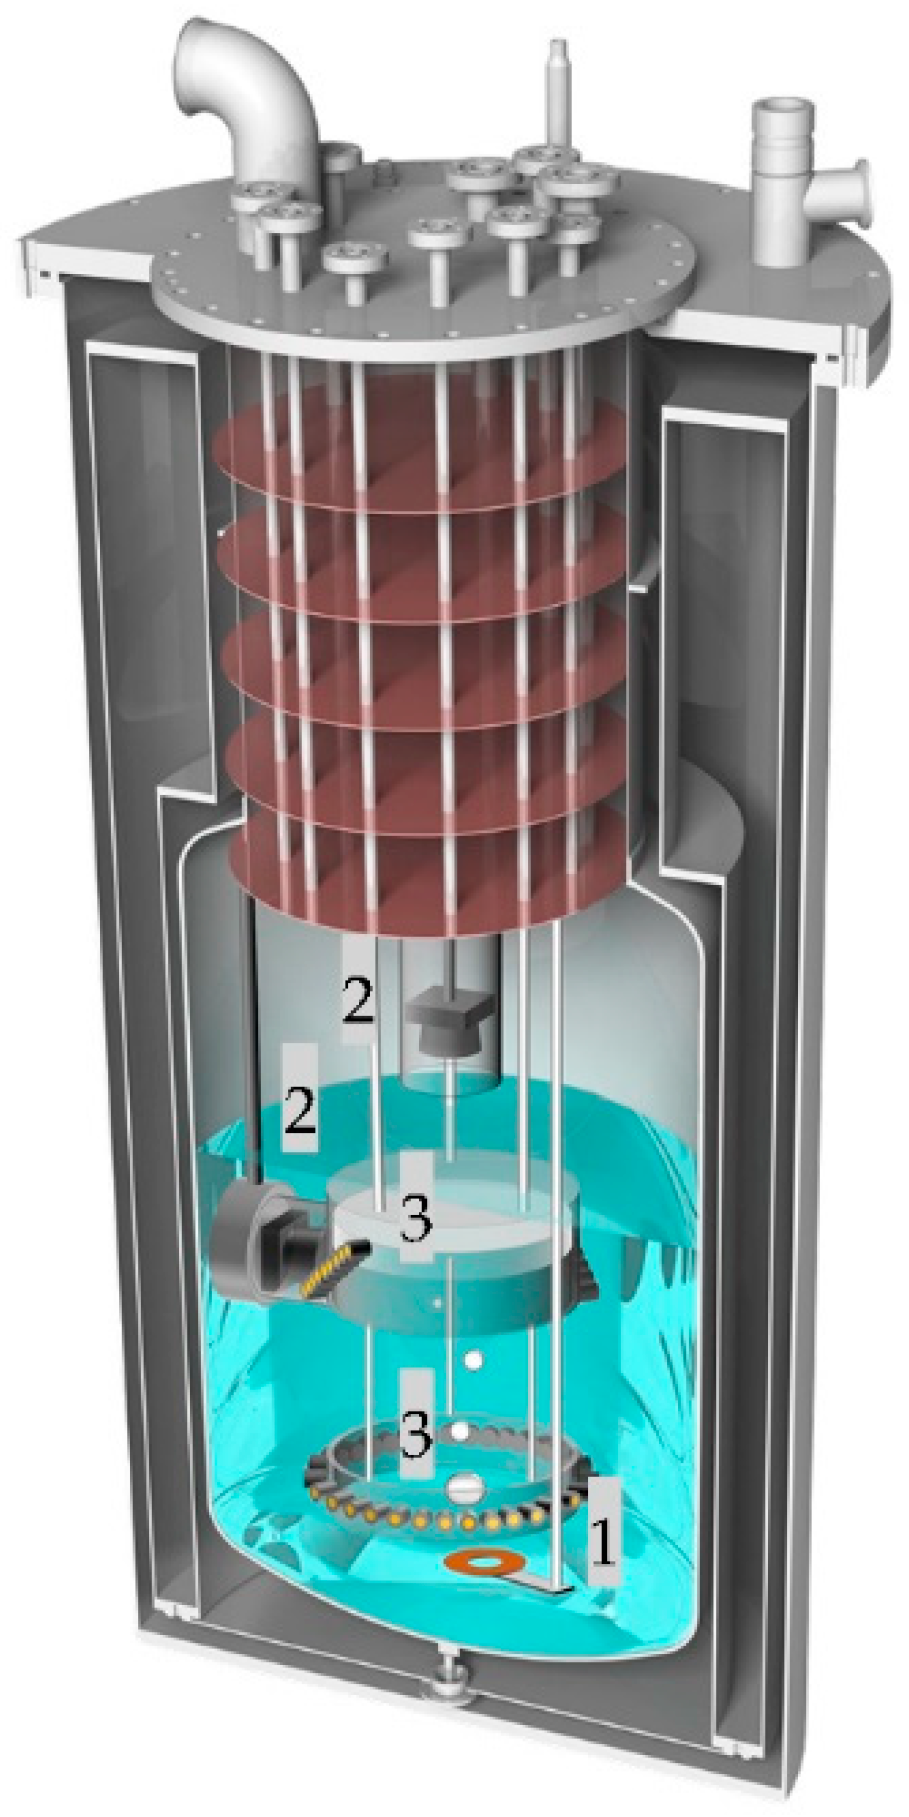
2.2. Measurement Setup

For observations of a cryogenic gas-liquid interface, a bath immersion cryostat (Figure 2) holding up to 60 L of LN2 is equipped with a heater foil for bubble generation (1), top- and sideview cameras (2) and the ultrasound sensor setup (3). Two types of sensor arrangements are chosen: A bubble trap and a sensor ring are manufactured utilizing PC material with cylindrical geometry. The bubble trap is equipped with several ultrasound sensor pairs (transmitter and receiver), vertically positioned at different levels for sensing of gas-liquid interface levels. The sensor ring is used in a fan shaped beam geometry for a tomographic bubble sensing (size and location). In total, 32 ultrasound transducers are equidistantly positioned on the surface of an experimental pipe segment at the same level. A multiplexing unit controlled the excitation and detection of ultrasound waves. This unit enables the generation of multiple projection data by switching individual transducers from receiving mode into sending mode. The excitation and the detection of ultrasound waves are realized by a PXI-system consisting of a wave generator (12 Vpp tone burst of 8 cycles at 1 MHz) and a FPGA module combined with a multichannel oscilloscope. The combination of both systems provides a fast data acquisition and analysis.

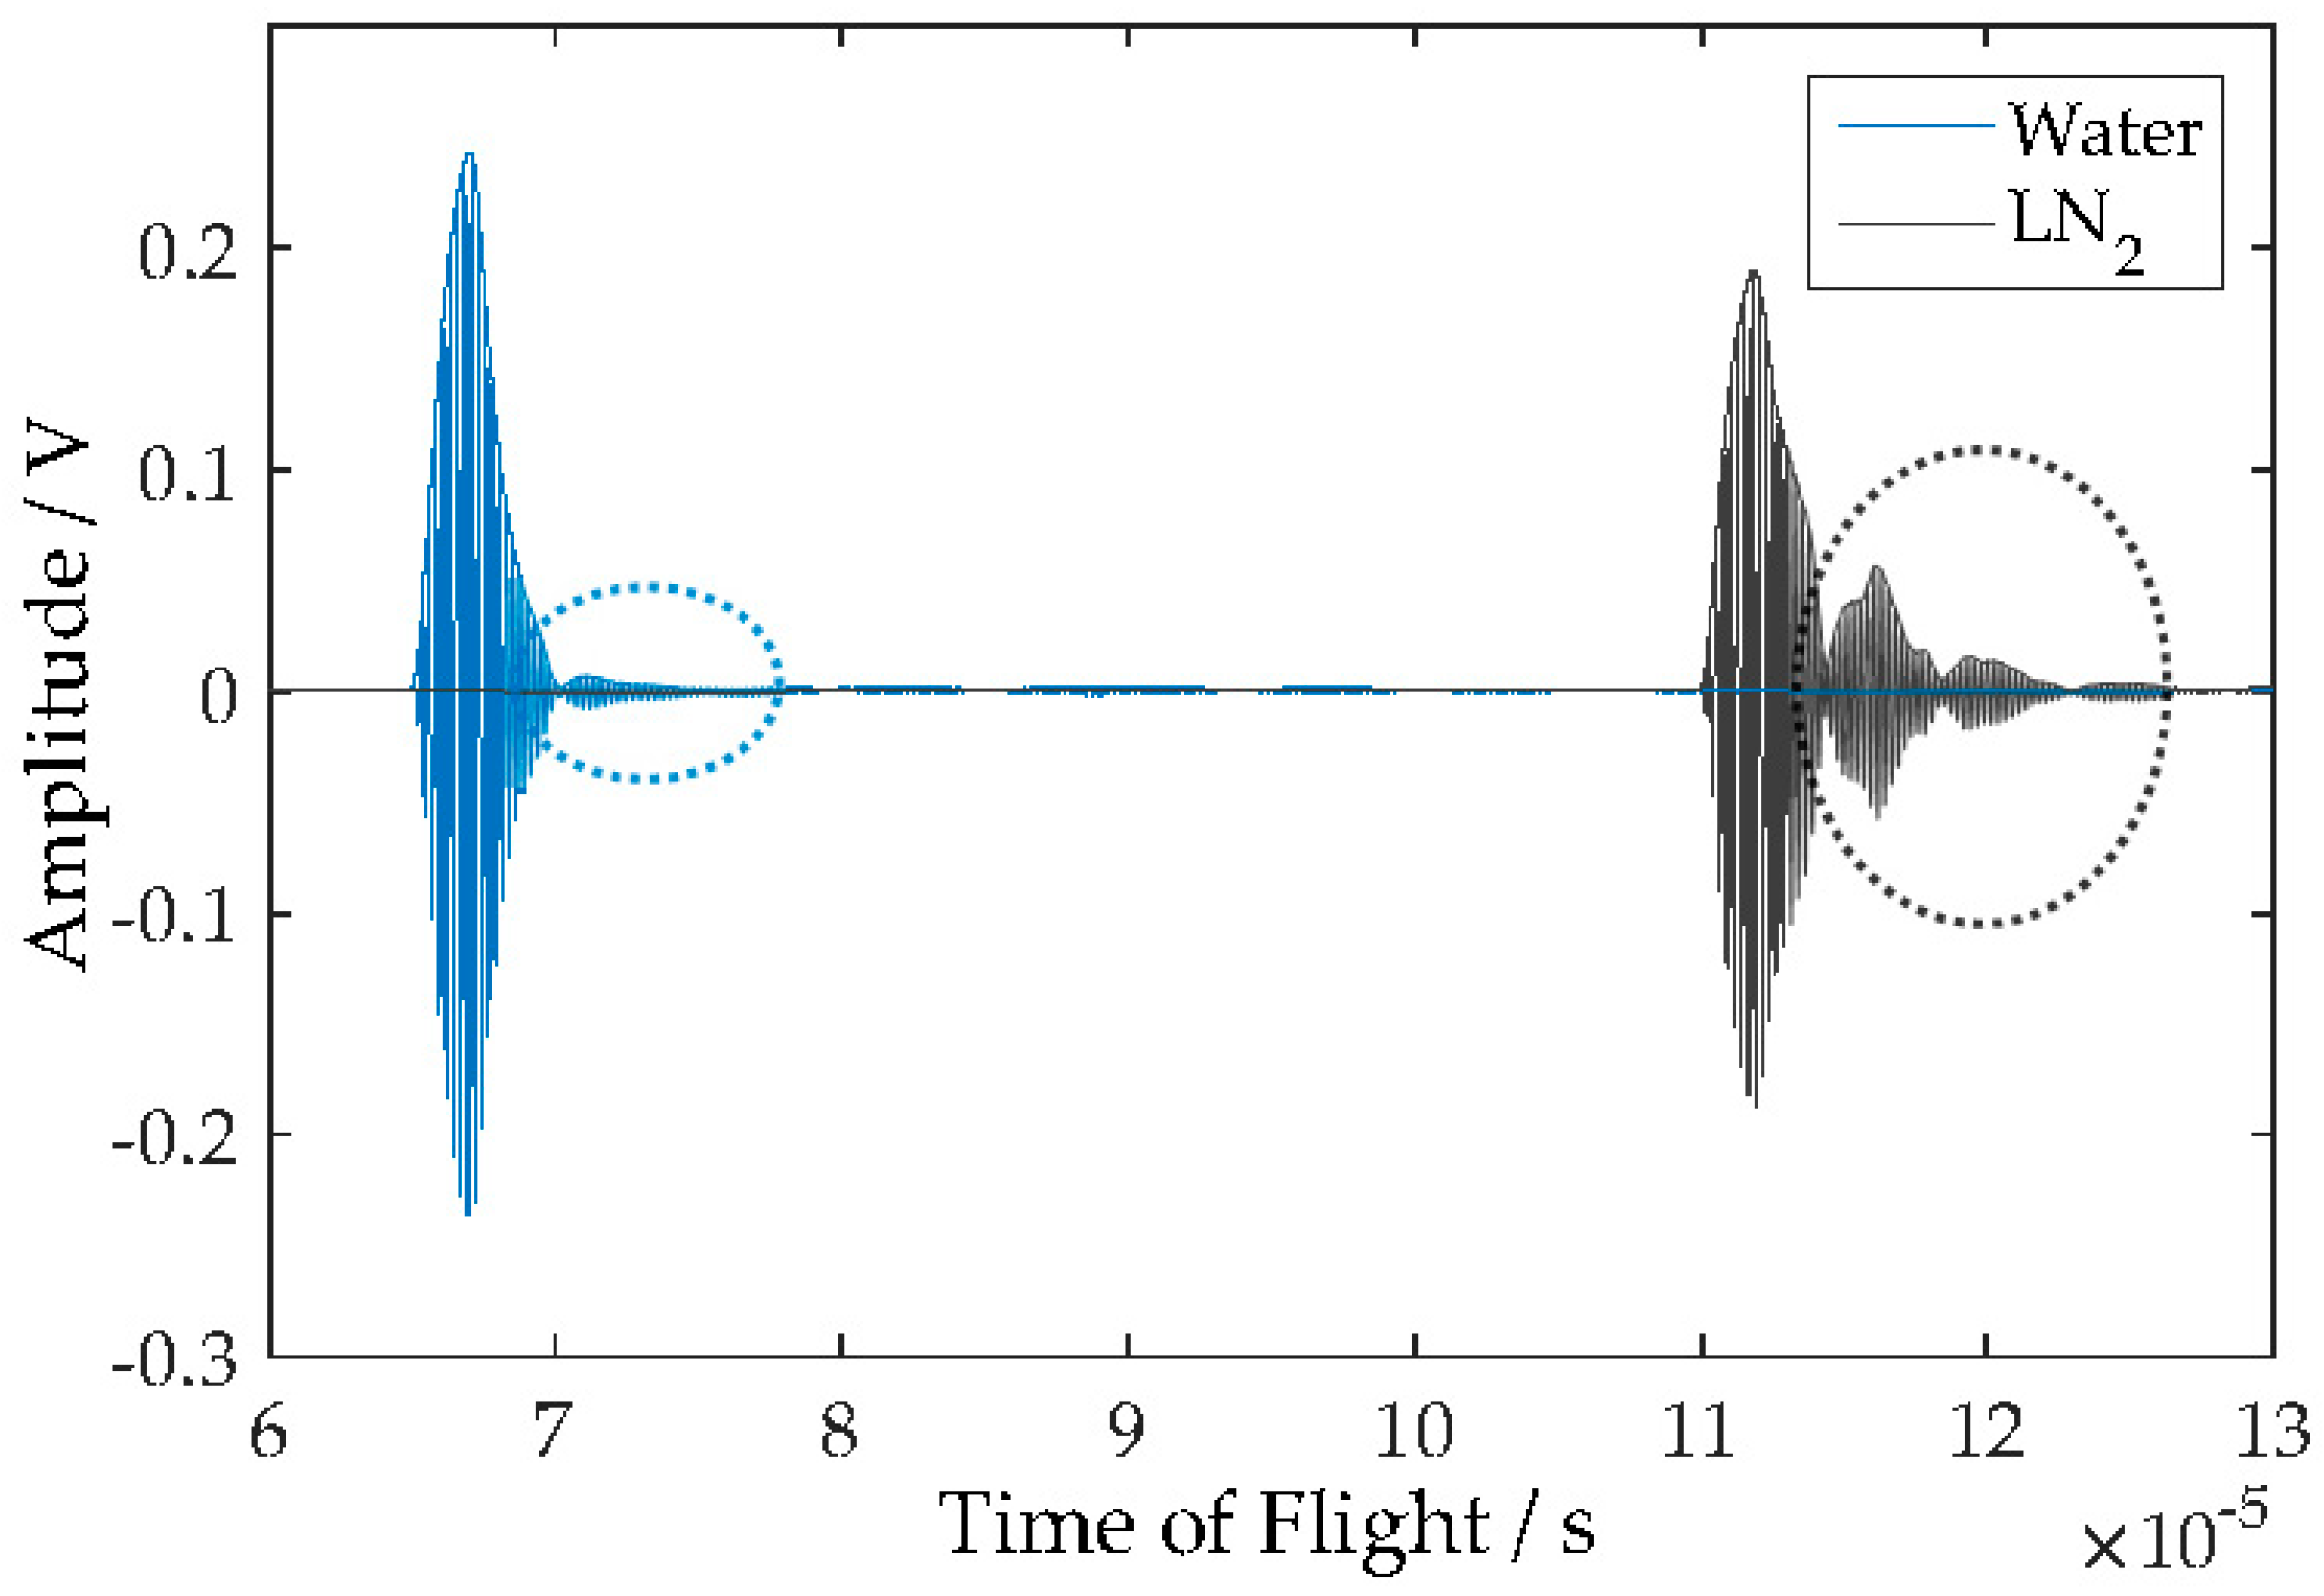
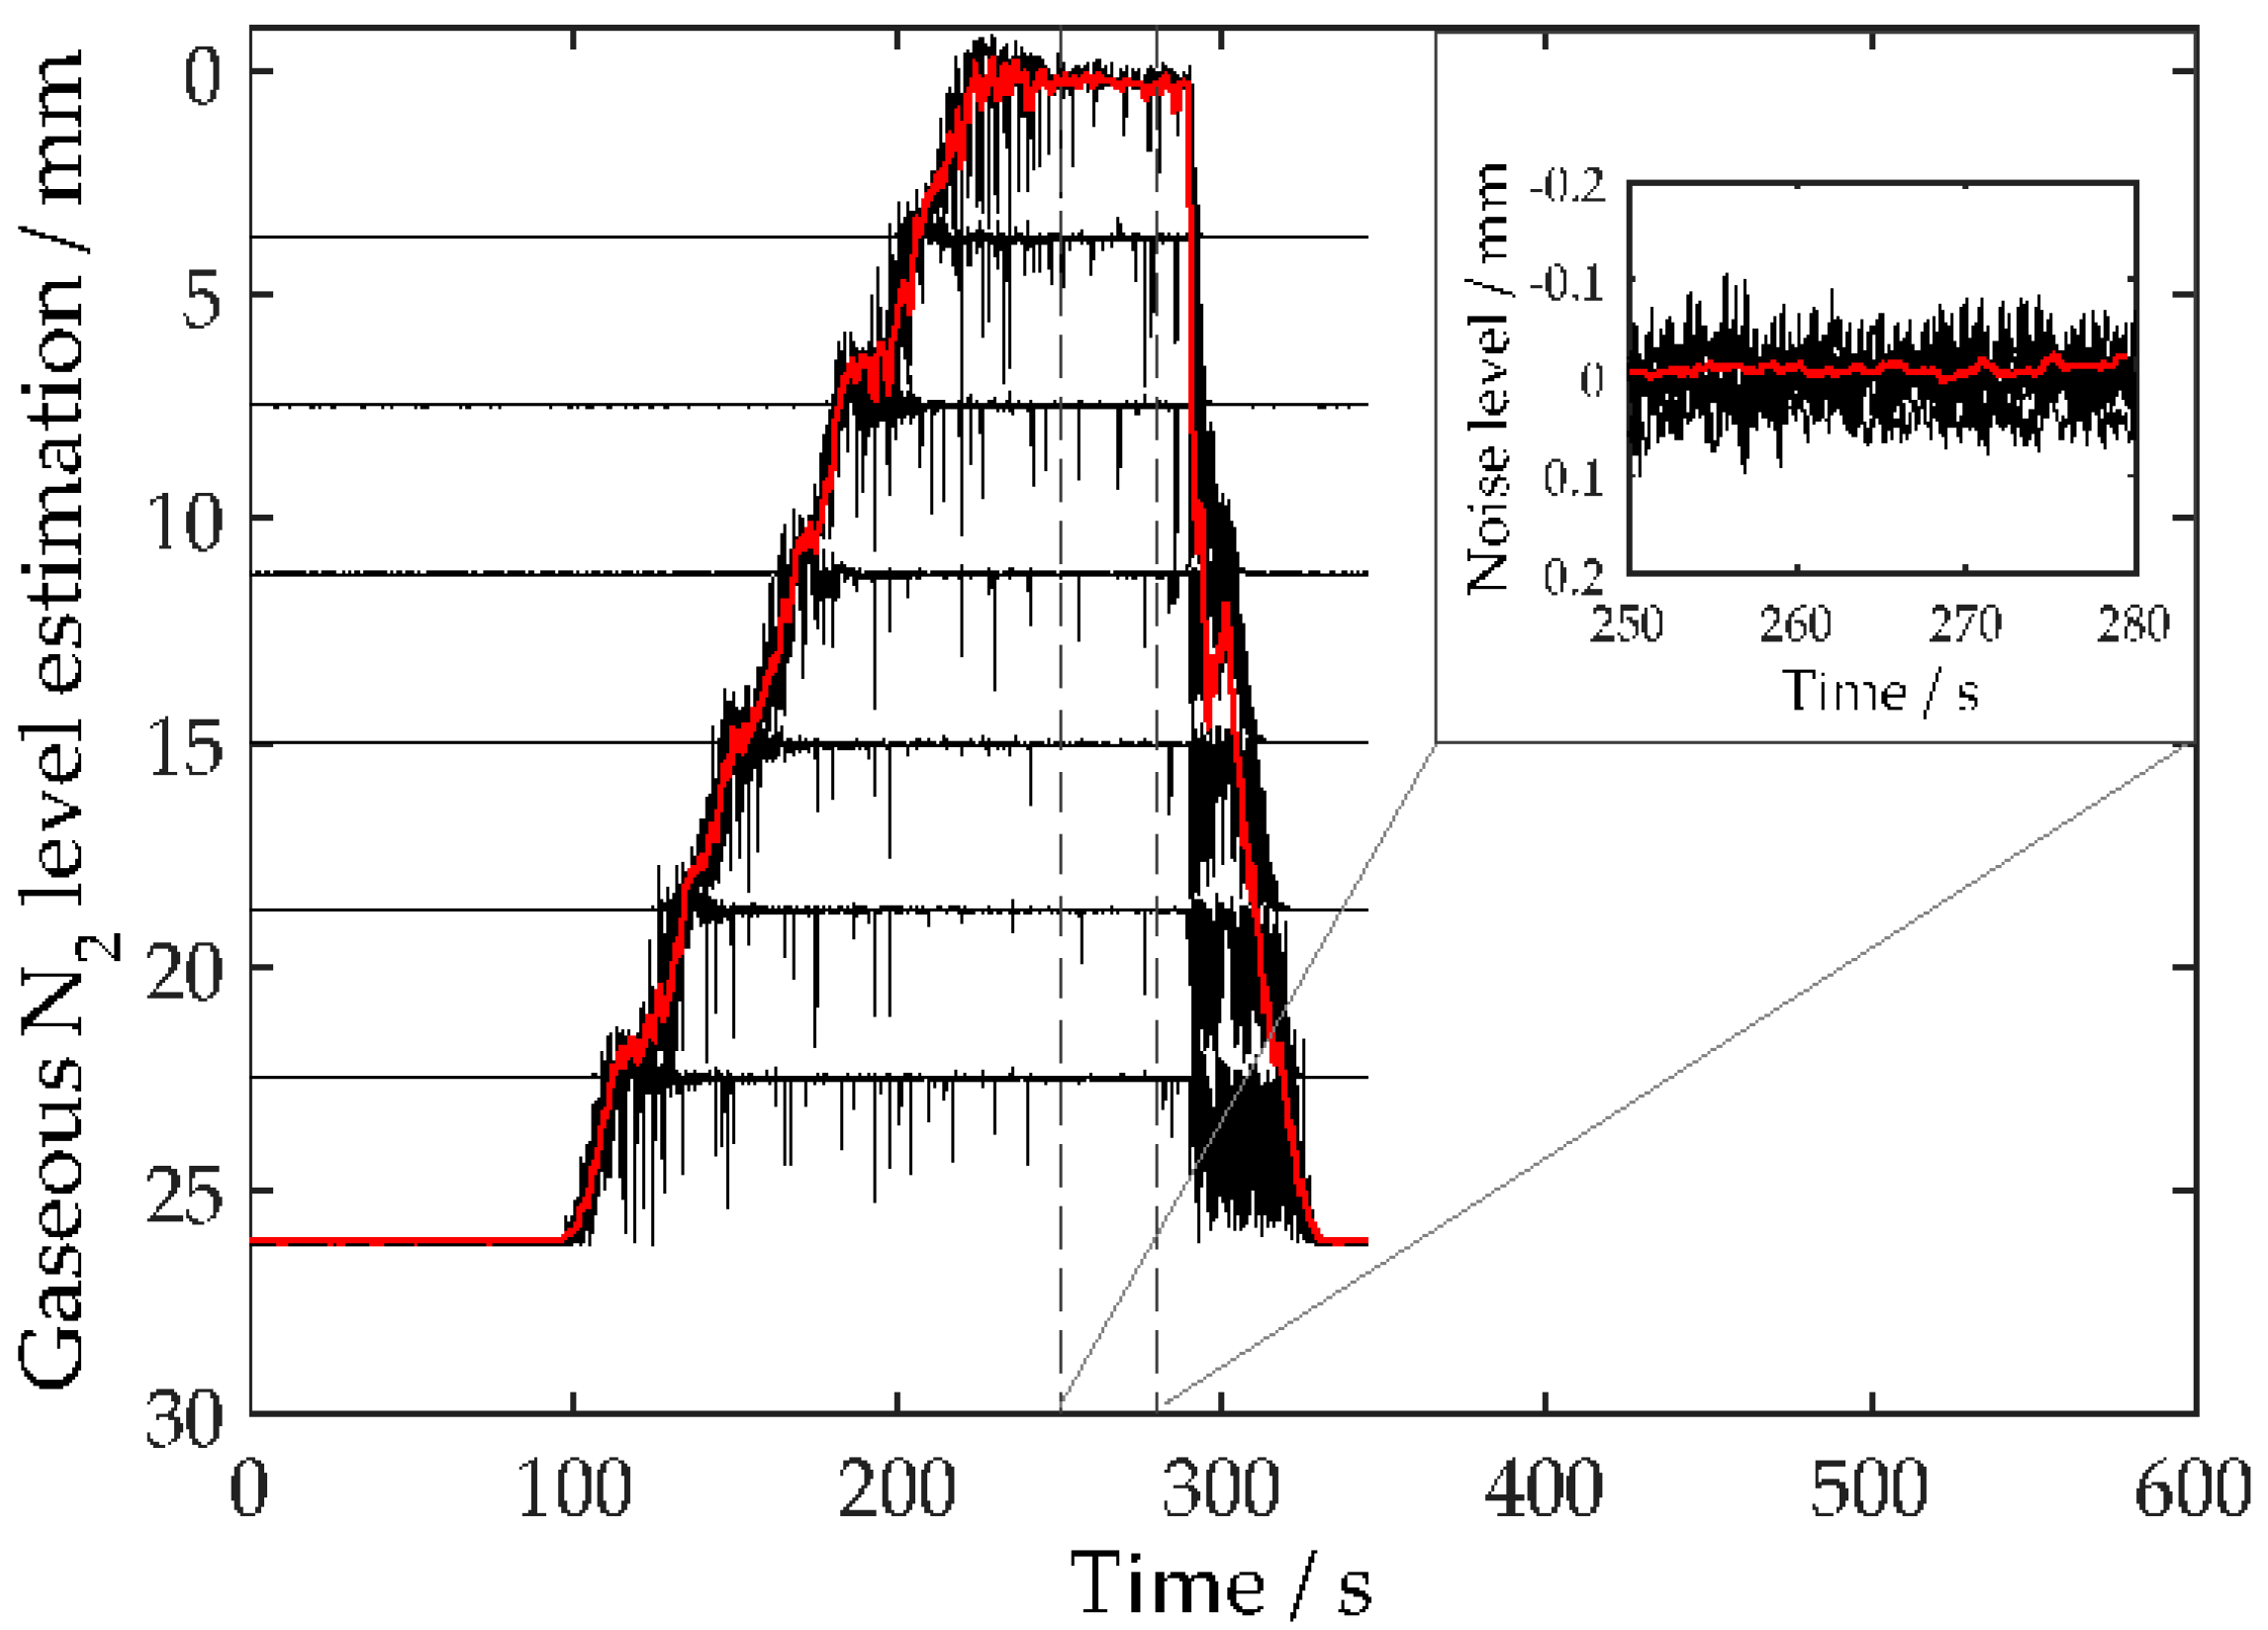
3. Results and Discussion

The special encapsulation design for the piezoelectric transducers enables efficient ultrasound coupling into the media. Figure 3 shows typical acoustic signals received from a single ultrasound transmission measurement (blue curve: water, black curve: LN2). The transmitted signals have an amplitude of typically 400 mVpp in water and almost 300 mVpp in LN2—a signal strength sufficient for accurate evaluation. The amplitude decrease in LN2 at 77 K is caused by a decrease of the vibration amplitude of the piezoelectric transducers [16]. The tail of the wave packets (Figure 3, circle marked) is caused by internal reflections in the PC wall. In LN2, the amplitude-damped tail of the time signal is longer than in water, because the elastic properties of the PC ring change due to temperature effects. Under cold conditions, the material shrinks and becomes stiffer. Consequently, the reflection coefficient between PC and the liquid changes (cp. Equation (1)) and the amplitude of the sound wave reflections at the inner wall in PC are greater [13]. A comparison between the time signals of the transmission measurement in water and LN2 shows that the time of flight of the main amplitude peak is increased from 67 µs to 113 µs. The time delays are caused by different sound velocities of the liquids and are in good agreement with literature values [13]. They are calculated according to Equation (2) from amplitude values recorded during transmission measurements in LN2. In the course of this measurement, the bubble trap is emptied and filled linearly with N2. Figure 4 is composed of several transmission paths at different levels. The precision and spatial resolution of the estimated gas-liquid level is ± 0.01 mm with data filtering (Figure 4, right). The signal fluctuations in the black curves demonstrate the feasibility for the detection of rising gaseous bubbles (gas-liquid interfaces). Figure 5 indicates the bubble detection as an image plot with scaled colors for the estimated N2 level amplitude.
The results show a high correlation between the gaseous N2 level estimated from ultrasound transmission measurements and the visual observation by camera. Based on these measuring phenomena, the tomographic transmission measurement in the sensor ring is used for sensing of gaseous bubble sizes and locations. Figure 6 represents a selection of results from a tomographic transmission measurement. The reconstructed image is shown together with top-view picture recorded with a camera for one bubble (radius: 5 mm) inside the sensor ring.
The results show that the system can measure the size, the position of gas bubbles and the gas-liquid content by using image filtering and circle fitting algorithms. The actual spatial resolution of the tomographic bubble detection is approximately 1.4 mm (smallest scattering object) and is determined by the size of objects that can be detected related to the acoustic properties (acoustic long-wavelength limit) [17]. The resolution can be increased further by increasing the beam spread (e.g., smaller diameter, lower frequency and the number of transducers). Hereby, it is possible to analyze additional transmission paths and thus a multiple number of projections. The temporal resolution of the system is about 500 Hz which enables a real-time capability.

4. Conclusions and Outlook

For the first time an ultrasound sensor system demonstrates the functional capability for gas to liquid interface and tomographic bubble sensing in cryogenic liquids. This novel ultrasound measurement system especially designed for the monitoring and sensing of cryogenic liquids and gases allows the measurement of static and dynamic processes. In future work, the ultrasound system will be improved further for the bubble and flow measurement in cryogenic liquids. A combination of two different types of transducer setups for ultrasound transmission or reflection should be used for the generation of ultrasound pressure waves in gas phase (low frequency transducers) and for their generation in liquid phase (high frequency transducers). Additionally, the performance of data acquisition, analysis and imaging will be improved by using more efficient algorithms. This ultrasound technique can enable the understanding and the validation of fluid dynamics under reduced gravity and cryogenic temperature conditions.

Author Contributions

Sensor conceptualization, D.B.; Methodology, D.B. and R.S.; Hardware and Software, D.B.; Electronic Hardware and Software, R.S.; Experimental validation, D.B. and R.S., Data Analysis, D.B.; Visualization, D.B.; Writing—Review & Editing, D.B.; Supervision, G.L. und K.S.D.

Acknowledgments

Parts of the presented work were carried out under contract from the European Space Agency (ESA), the support of which is gratefully acknowledged (Project: CryoSense). We also gratefully acknowledge Deutsches Zentrum für Luft- und Raumfahrt e.V. (DLR) for the possibility of using their cryogenic facilities and their support and cooperation in performing cryogenic experiments. In the CryoSense project, the cooperating partners AIRBUS (Bremen), DLR (Bremen), ISAT (Coburg) and ZET (Bayreuth) examine several measurement techniques (fiber-optics, ultrasound sensors, capacity sensors) with respect to their cryogenic and high vacuum applicability and performance as well as their engineering challenges in order to validate cryogenic two-phase flows (gas-liquid interfaces).

Conflicts of Interest

The funding sponsors had no role in the design of the study; in the collection, analyses, or interpretation of data; in the writing of the manuscript, and in the decision to publish the results.

References

  1. Siegl, M.; Gerstmann, J.; Fischer, A.; Becker, D.; Schmidt, K.; Lindner, G.; Fischerauer, A.; Kandlbinder, C.; Fischerauer, G. Advanced sensor technologies for cryogenic liquid propellant flow phenomena. In Proceedings of the 66th International Astronautical Congress (IAC2015), Jerusalem, Israel, 12–16 October 2015; pp. 1–7. [Google Scholar]
  2. Hoyle, B.S.; Xu, L.A. Ultrasonic Sensors. In Process Tomography: Principles, Techniques and Applications; Beck, M.S., Ed.; Elsevier Science: Burlington, MA, USA, 1995; pp. 119–149. [Google Scholar]
  3. Hoyle, B.S. Process tomography using ultrasonic sensors. Meas. Sci. Technol. 1996, 7, 272–280. [Google Scholar] [CrossRef]
  4. Wang, M. (Ed.) Industrial Tomography. Systems and Applications; Woodhead Publishing: Cambridge, UK, 2015. [Google Scholar]
  5. Rahiman, M.H.F.; Rahim, R.A.; Rahim, H.A.; Green, R.G.; Zakaria, Z.; Mohamad, E.J.; Muji, S.Z.M. An evaluation of single plane ultrasonic tomography sensor to reconstruct three-dimensional profiles in chemical bubble column. Sens. Actuators A Phys. 2016, 246, 18–27. [Google Scholar] [CrossRef]
  6. Pusppanathan, J.; Abdul Rahim, R.; Phang, F.A.; Mohamad, E.J.; Nor Ayob, N.M.; Fazalul Rahiman, M.H.; Kok Seong, C. Single-Plane Dual-Modality Tomography for Multiphase Flow Imaging by Integrating Electrical Capacitance and Ultrasonic Sensors. IEEE Sens. J. 2017, 17, 6368–6377. [Google Scholar] [CrossRef]
  7. Shaib, M.F.A.; Rahim, R.A.; Muji, S.Z.M. Development of Non-Invasive Ultrasonic Measuring System for Monitoring Multiphase Flow in Liquid Media within Composite Pipeline. IJECE 2017, 7, 3076–3087. [Google Scholar] [CrossRef]
  8. Rahim, H.A.; Barghoshadi, J.A.; Rahim, R.A. Image Reconstruction Technique for the Ultrasonic Tomography System VIA Metal Pipe. Adv. Sci. Lett. 2018, 24, 1406–1410. [Google Scholar] [CrossRef]
  9. Fazalul Rahiman, M.H.; Abdul, R.; Abdul, H.; Nor Ayob, N.M. Design and Development of Ultrasonic Process Tomography. In Ultrasonic Waves; Santos Junior, A.A.D., Ed.; InTech: London, UK, 2012; pp. 211–226. [Google Scholar]
  10. Li, W.; Hoyle, B.S. Ultrasonic process tomography using multiple active sensors for maximum real-time performance. Chem. Eng. Sci. 1997, 52, 2161–2170. [Google Scholar] [CrossRef]
  11. Rahim, R.A.; Rahiman, M.F.; Chan, K.S.; Nawawi, S.W. Non-invasive imaging of liquid/gas flow using ultrasonic transmission-mode tomography. Sens. Actuators A Phys. 2007, 135, 337–345. [Google Scholar] [CrossRef]
  12. Rahim, R.A.; Rahiman, M.F.; Taib, M.M. Non-invasive ultrasonic tomography: Liquid/gas flow visualization. In Proceedings of the 1st International Conference on Computers, Communications, & Signal Processing with Special Track on Biomedical Engineering, Kuala Lumpur, Malaysia, 14–16 November 2005; pp. 243–247. [Google Scholar]
  13. NDT Education: Acoustic Properties. Available online: https://www.nde-ed.org/GeneralResources/MaterialProperties/UT/ut_matlprop_index.htm (accessed on 18 July 2018).
  14. Fazalul Rahiman, M.H.; Abdul Rahim, R.; Fazalul Rahiman, M.H.; Tajjudin, M. Ultrasonic Transmission-Mode Tomography Imaging for Liquid/Gas Two-Phase Flow. IEEE Sens. J. 2006, 6, 1706–1715. [Google Scholar] [CrossRef]
  15. Ayob, N.M.N.; Yaacob, S.; Zakaria, Z.; Rahiman, M.H.F.; Rahim, R.A.; Manan, M.R. Improving gas component detection of an ultrasonic tomography system for monitoring liquid/gas flow. In Proceedings of the 2010 6th International Colloquium on Signal Processing and Its Applications (CSPA), Mallaca City, Malaysia, 21–23 May 2010; pp. 1–5. [Google Scholar]
  16. PI Ceramic: Temperature-Dependent Behavior. Available online: http://piceramic.com/piezo-technology/properties-piezo-actuators/temperaturedependence.html (accessed on 18 July 2018).
  17. Povey, M.J.W. Scattering of Sound. In Ultrasonic Techniques for Fluids Characterization; Elsevier: Amsterdam, The Netherlands, 1997; pp. 91–140. [Google Scholar]
Figure 1. Simplified ultrasound trans-mission model with blocked transmission by gas cavity.
Proceedings 02 01090 g001
Figure 2. Cryogenic measurement setup.
Proceedings 02 01090 g002
Figure 3. Received acoustic signals from a single transmission path measurement in water at 293 K (blue curve) and LN2 at 77 K (black curve).
Proceedings 02 01090 g003
Figure 4. Gas level from the transmission measurement in LN2 (black curve: unfiltered data, red curve: filtered data) during linear emptying and filling procedure of the trap with N2.
Proceedings 02 01090 g004
Figure 5. Detection of rising gaseous bubbles by ultrasound transmission measurement (received acoustic signals (left) and image plot (centre)) and recorded picture from side-view observation with bubbles (right).
Proceedings 02 01090 g005
Figure 6. Detection of bubble position and size, (a) top-view picture recorded with a camera, (b) reconstructed images from full transmission measurement scans with 224 projections, (c) image post processing (filtering) and circle fitting.
Proceedings 02 01090 g006
Publisher’s Note: MDPI stays neutral with regard to jurisdictional claims in published maps and institutional affiliations.

