1. Introduction
To increase the spatial resolution of air pollution measurements, internet of things (IoT) sensor nodes are equipped with low-cost air quality sensors. To date, low-cost sensors for NO2 applied in these approaches are electrochemical sensors, which lack accuracy and long-term stability and suffer from cross-sensitivity to other gases.
A QEPAS sensor for NO
2 can overcome these shortcomings. The physical principle of photoacoustic spectroscopy is based on periodic light absorption of the analyte and vibrational-translational relaxation, which produces an acoustic wave. The acoustic wave is detected by the quartz tuning fork (QTF), which produces a weak current (pA) [
1,
2]. For such a low amplitude, proper amplification is necessary.
Due to the high Q-factor of a QTF, a significant improvement in sensitivity compared to conventional photoacoustic spectroscopy is achieved. However, resulting from the high Q-factor, the setup is extremely sensitive to changes in the resonance frequency of the QTF and a precise frequency generation is necessary.
The developed solution consists of a low-noise amplification combined with a lock-in amplification stage, which is a common technique to pick up weak periodic signals [
3]. Additionally, only the frequency component of the laser modulation is amplified by the lock-in amplifier and noisy background signals are suppressed.
To also obtain the phase shift of the measurement signal a second lock-in amplifier is added to the system and driven with the 90-degree phase shifted reference signal in respect to the laser output (quadrature signal) [
3]. After smoothing the lock-in signal by a low-pass filter, the DC voltage is digitized by a 24-bit ADC.
To control the frequency of the laser driver and generate the quadrature signal two Direct Digital Synthesizer (DDS) chips were chosen. They can be synchronized by the microcontroller and have a frequency resolution of 30 mHz. For the current output a precision NMOS current sink is applied with the DDS control signal.
2. Materials and Methods
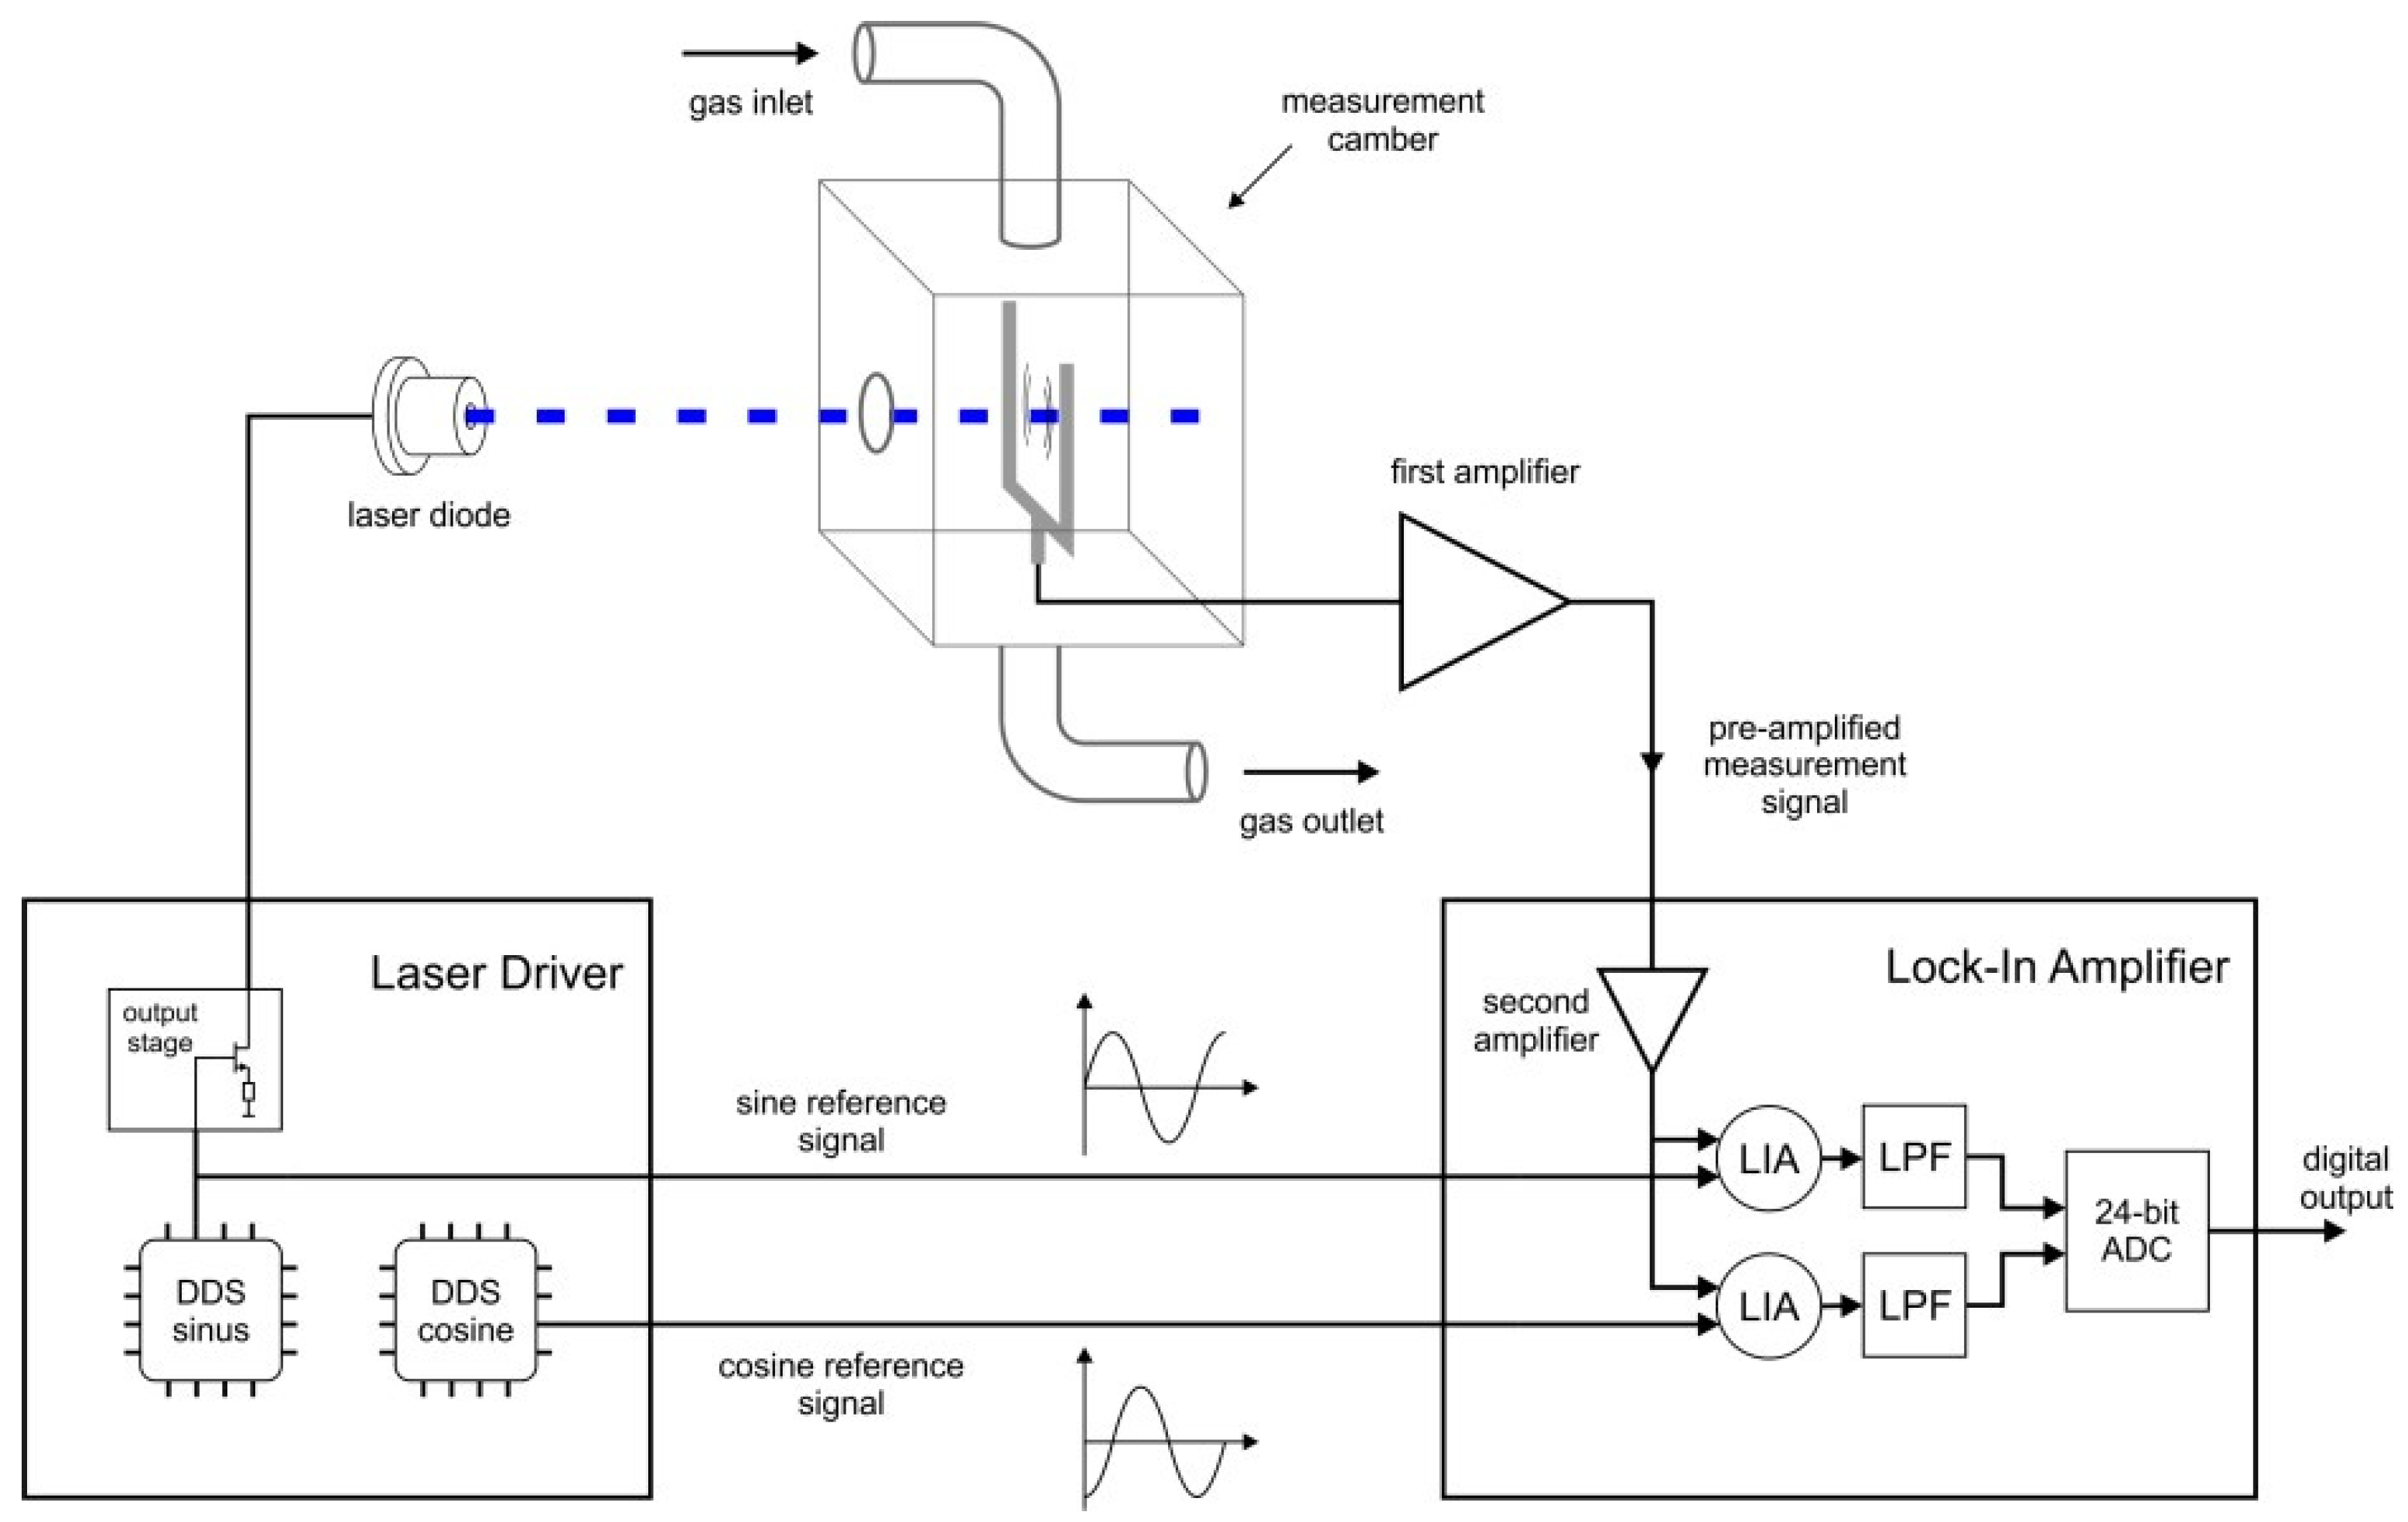
The setup is illustrated in
Figure 1. Periodical excitation of the gas by a blue 450 nm laser diode produces an acoustic wave which is measured by a quartz tuning fork (QTF). The measurement chamber encapsulates the measurement from the ambient air and makes it possible to control the NO
2 concentration through a gas in- and outlet.
The required, self-built electronics (Laser Driver, Lock-In Amplifier) will be further discussed in following sub chapters.
2.1. Laser Driver
The circuit of the Laser Driver is designed to meet the specification of the applied laser diode. It is operating at currents between 50 to 100 mA at a voltage of 5.8 V. For our purpose the laser diode must be driven in pulsed mode at the QTF’s resonance frequency that can change due to environmental influences. For that reason, it is important to have a high frequency resolution in the range of 32.76 kHz. To generate the controllable frequency signal with appropriate resolution a Direct Digital Synthesizer (DDS) was chosen.
Since the measurement is phase sensitive, the amplitude as well as the phase of the QTF signal can be measured by using two Lock-In Amplifiers. The first operates with the in-phase (sine) and the other with the quadrature (cosine) signal as reference (cf.
Section 2.2. Lock-In Amplifier). Hence, a second frequency signal with 90 degree of phase shift is generated by an additional DDS.
The AD9834 (Analog Devices) is a suitable DDS for high performance sine waveform generation in the kHz range and its on-board comparator allows to produce a square wave for the output current sink of the Laser Driver. Using an 8 MHz quartz oscillator as the clock rate generator for the synthesizer, the AD9834 can be tuned to a resolution of 0.032 Hz at a maximum quantization error of 0.0025 V. The synchronization of both DDS, to get the sine and cosine reference signals with the same phase, is not directly supported by the IC, but can be realized when a synchronous soft-reset is applied. The communication for programming is a standard 3-wire SPI interface and is compatible with the Arduino microcontroller that is used in this project.
For the adjustment of the laser current the square wave output is connected to a voltage divider which includes the digital potentiometer MCP4652. This device is an 8-bit programmable resistor with I2C interface and enables a controllable voltage level for the output stage.
The output stage is a precision current sink based on a power NMOS transistor and an 88 MHz operation amplifier for the feedback loop. It is constructed to produce the current output from 0 to 100 mA out of the 5 V square wave with a resolution of less than 0.5 mA. This makes it possible to set the optical laser output power precisely.
2.2. Lock-In Amplifier
Lock-in amplification is a technique to extract a signal with a known carrier frequency from noisy background signals. In our case the measurement signal from the QTF is very small (pA) and has to be highly amplified before it can electrically be detected. This produces the unwanted noise level which should be suppressed.
Two implementations of lock-in amplifiers (LIA) exist. The analog LIA uses an analog frequency mixer followed by low-pass filters for the demodulation, whereas the digital version implements this by fast digital signal processing and is available in modern, expensive instruments.
The chosen analog method exists as single and dual phase LIA. A basic single phase LIA detects signals of the same frequency and phase, but is not able to give information about the phase as its output is proportional to the signal amplitude and phase. At its worst, the output is zero if the detection signal is in quadrature (90-degree phase shifted) to its reference. Dual phase LIA incorporates a pair of phase sensitive detectors. Basically, it combines two identical lock-in amplifiers where the reference input of the second has a phase shift of 90°. This enables to measure the in-phase and quadrature components simultaneously [
3].
The AD630 is a high precision balanced modulator/demodulator and supports synchronous demodulation. This enables to operate the AD630 in lock-in amplifier configuration with a promising accuracy up to several hundred kHz, although it is optimized for lower frequencies. With this device the required specifications for the phase sensitive detection are fulfilled.
A combination of passive and active low-pass filters (cutoff frequencies at 16 Hz and 8 Hz) smoothens the locked-in signals to a bipolar DC value from −2.5 to 2.5 V that can then be digitalized by an Analog-to-Digital Converter (ADC). The ADS122C04 was used for that purpose, as it supports an I2C interface and a 5 V voltage level to be compatible to the other components. This ADC further features 24-bit conversion with two differential or four single-ended inputs and separated digital and analog voltage supply.
2.3. Microcontroller
To communicate with the used IC devices, it is necessary to connect to a microcontroller. The Arduino Uno is a simple, cheap microcontroller that meets the requirements and the open source development platform delivers a lot of basic libraries that ease the programming effort.
The program that controls the whole circuitry was written from scratch and includes the configuration of the DDS devices, the adjustment of the output current by the digital potentiometers and the readout of the ADC data. The hardware block is abstracted in a library to provide easy usage. Basic measurement modes are implemented in a timer routine and automatic measurements can be triggered over COM port communication with the PC. On the PC side a MATLAB script sends out a simplified command sequence with the parameters, receives the results for each time step and computes the results or creates a plot.
3. Results
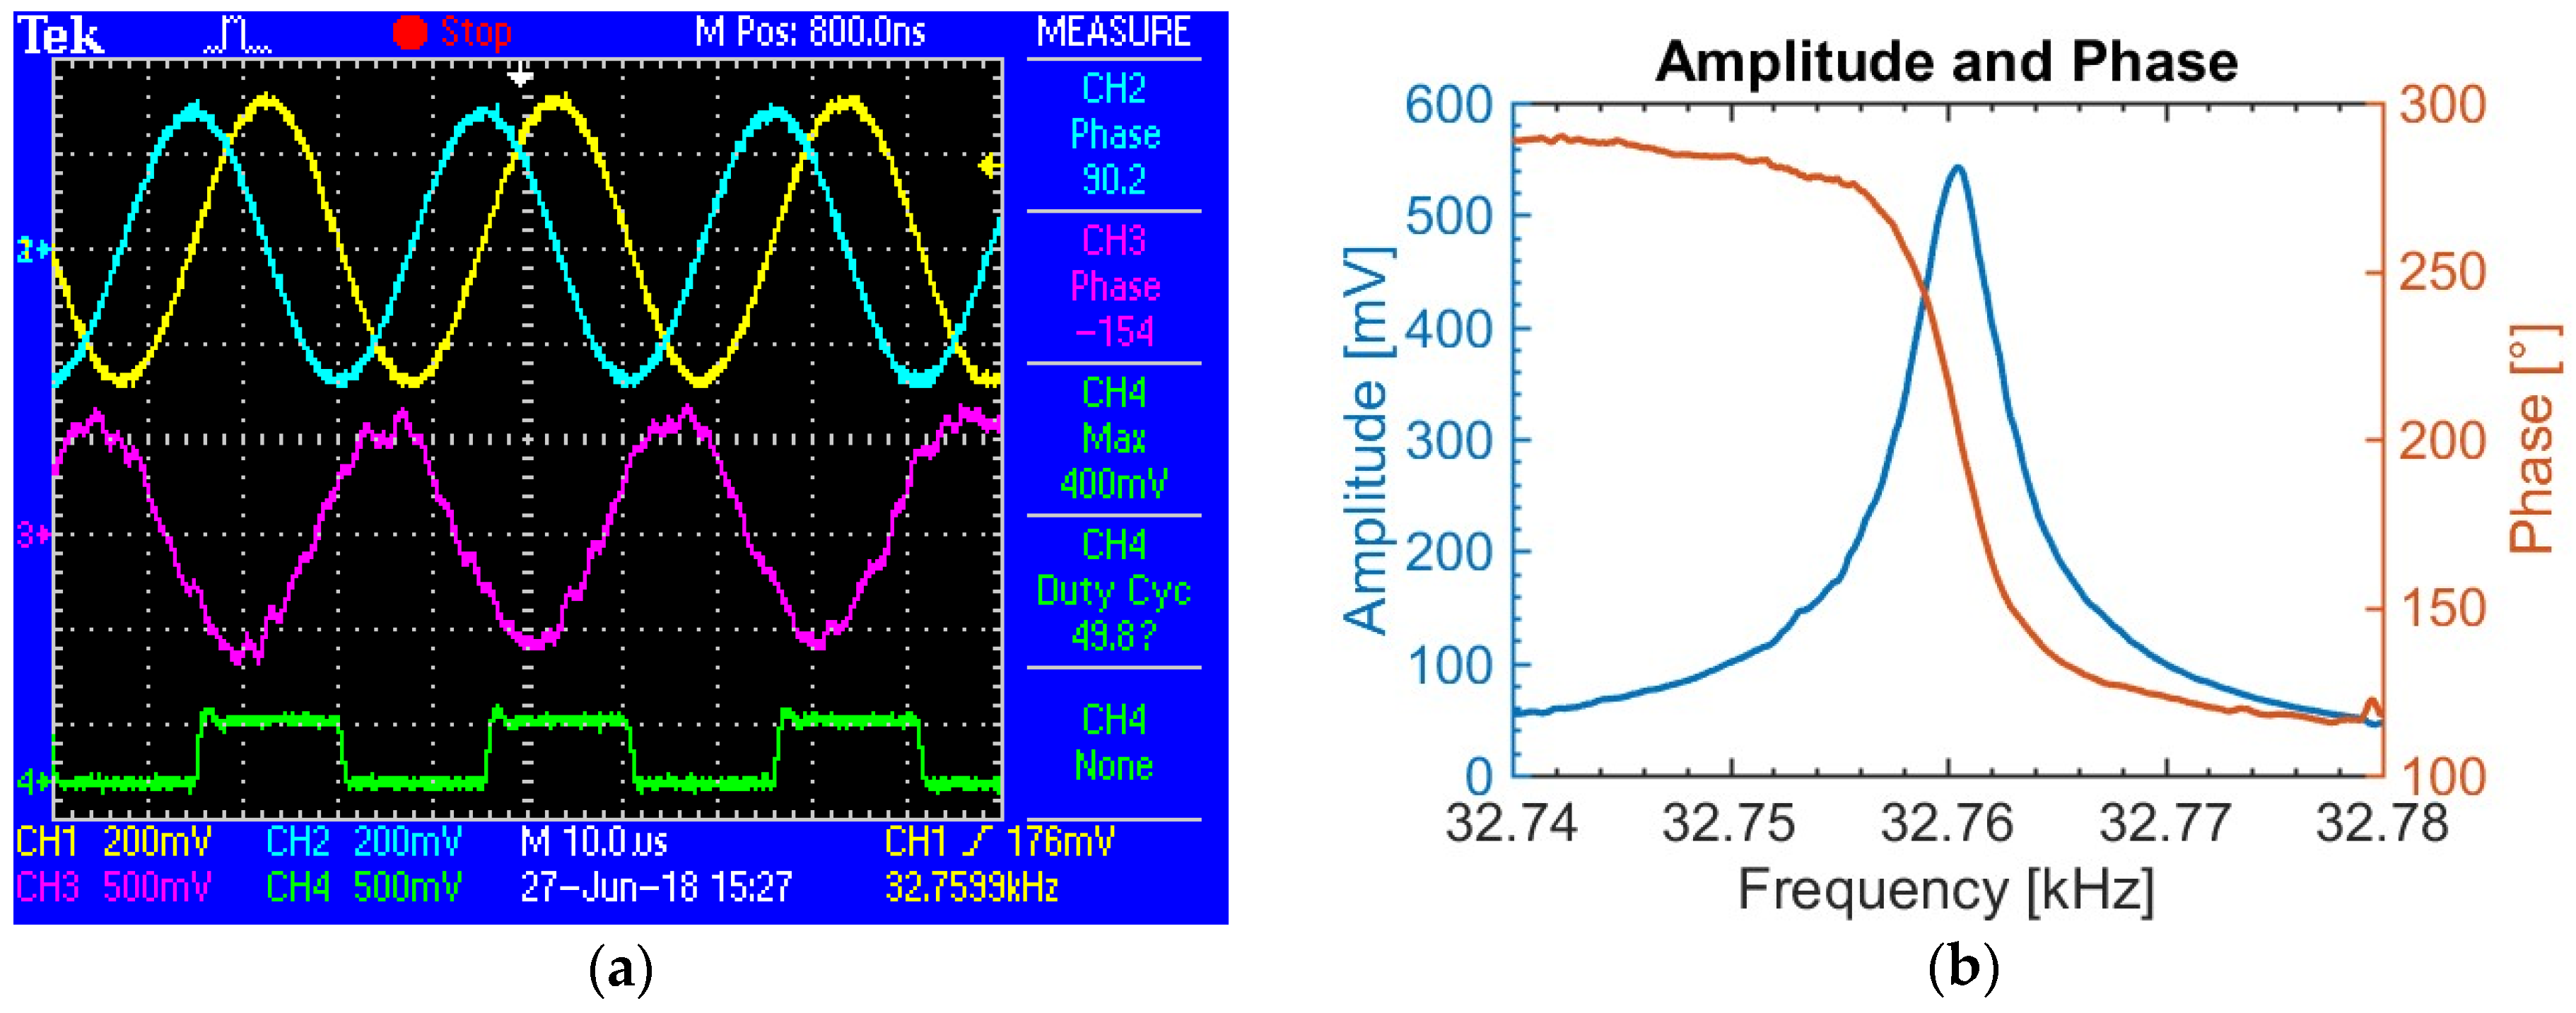
Figure 2a shows an oscilloscope capture of the most important signals. The sine (yellow) and cosine (turquoise) signals generated by the two synthesizers are very smooth and match the set frequency of 32.760 kHz (measured value bottom right differs 0.1 Hz). In green the pulsed laser current at the shunt resistor is shown which is in phase with the sine wave. The small overshoot is a reasonable compromise for the faster rise time. The purple signal belongs to the pre-amplified measurement signal from the QTF. This is phase-shifted with respect to sine wave of the laser pulses.
With the same setup a frequency sweep was performed to determine the QTF’s resonance frequency. Therefore, the synthesizer frequency was increased in steps of 0.1 Hz and 10 ADC measurements at each frequency were done (sampling rate 100 SPS). After averaging the data for each step, the amplitude and phase was calculated in the MATLAB program and plotted as in
Figure 2b. The amplitude peak is at a frequency of 32.7604 kHz with 542 mV and a phase of 205.5°.
For the calculations of the amplitude A and phase φ out of the measured in-phase Vin and quadrature signals V
quad from the two lock-in-amplifiers following equations were applied:
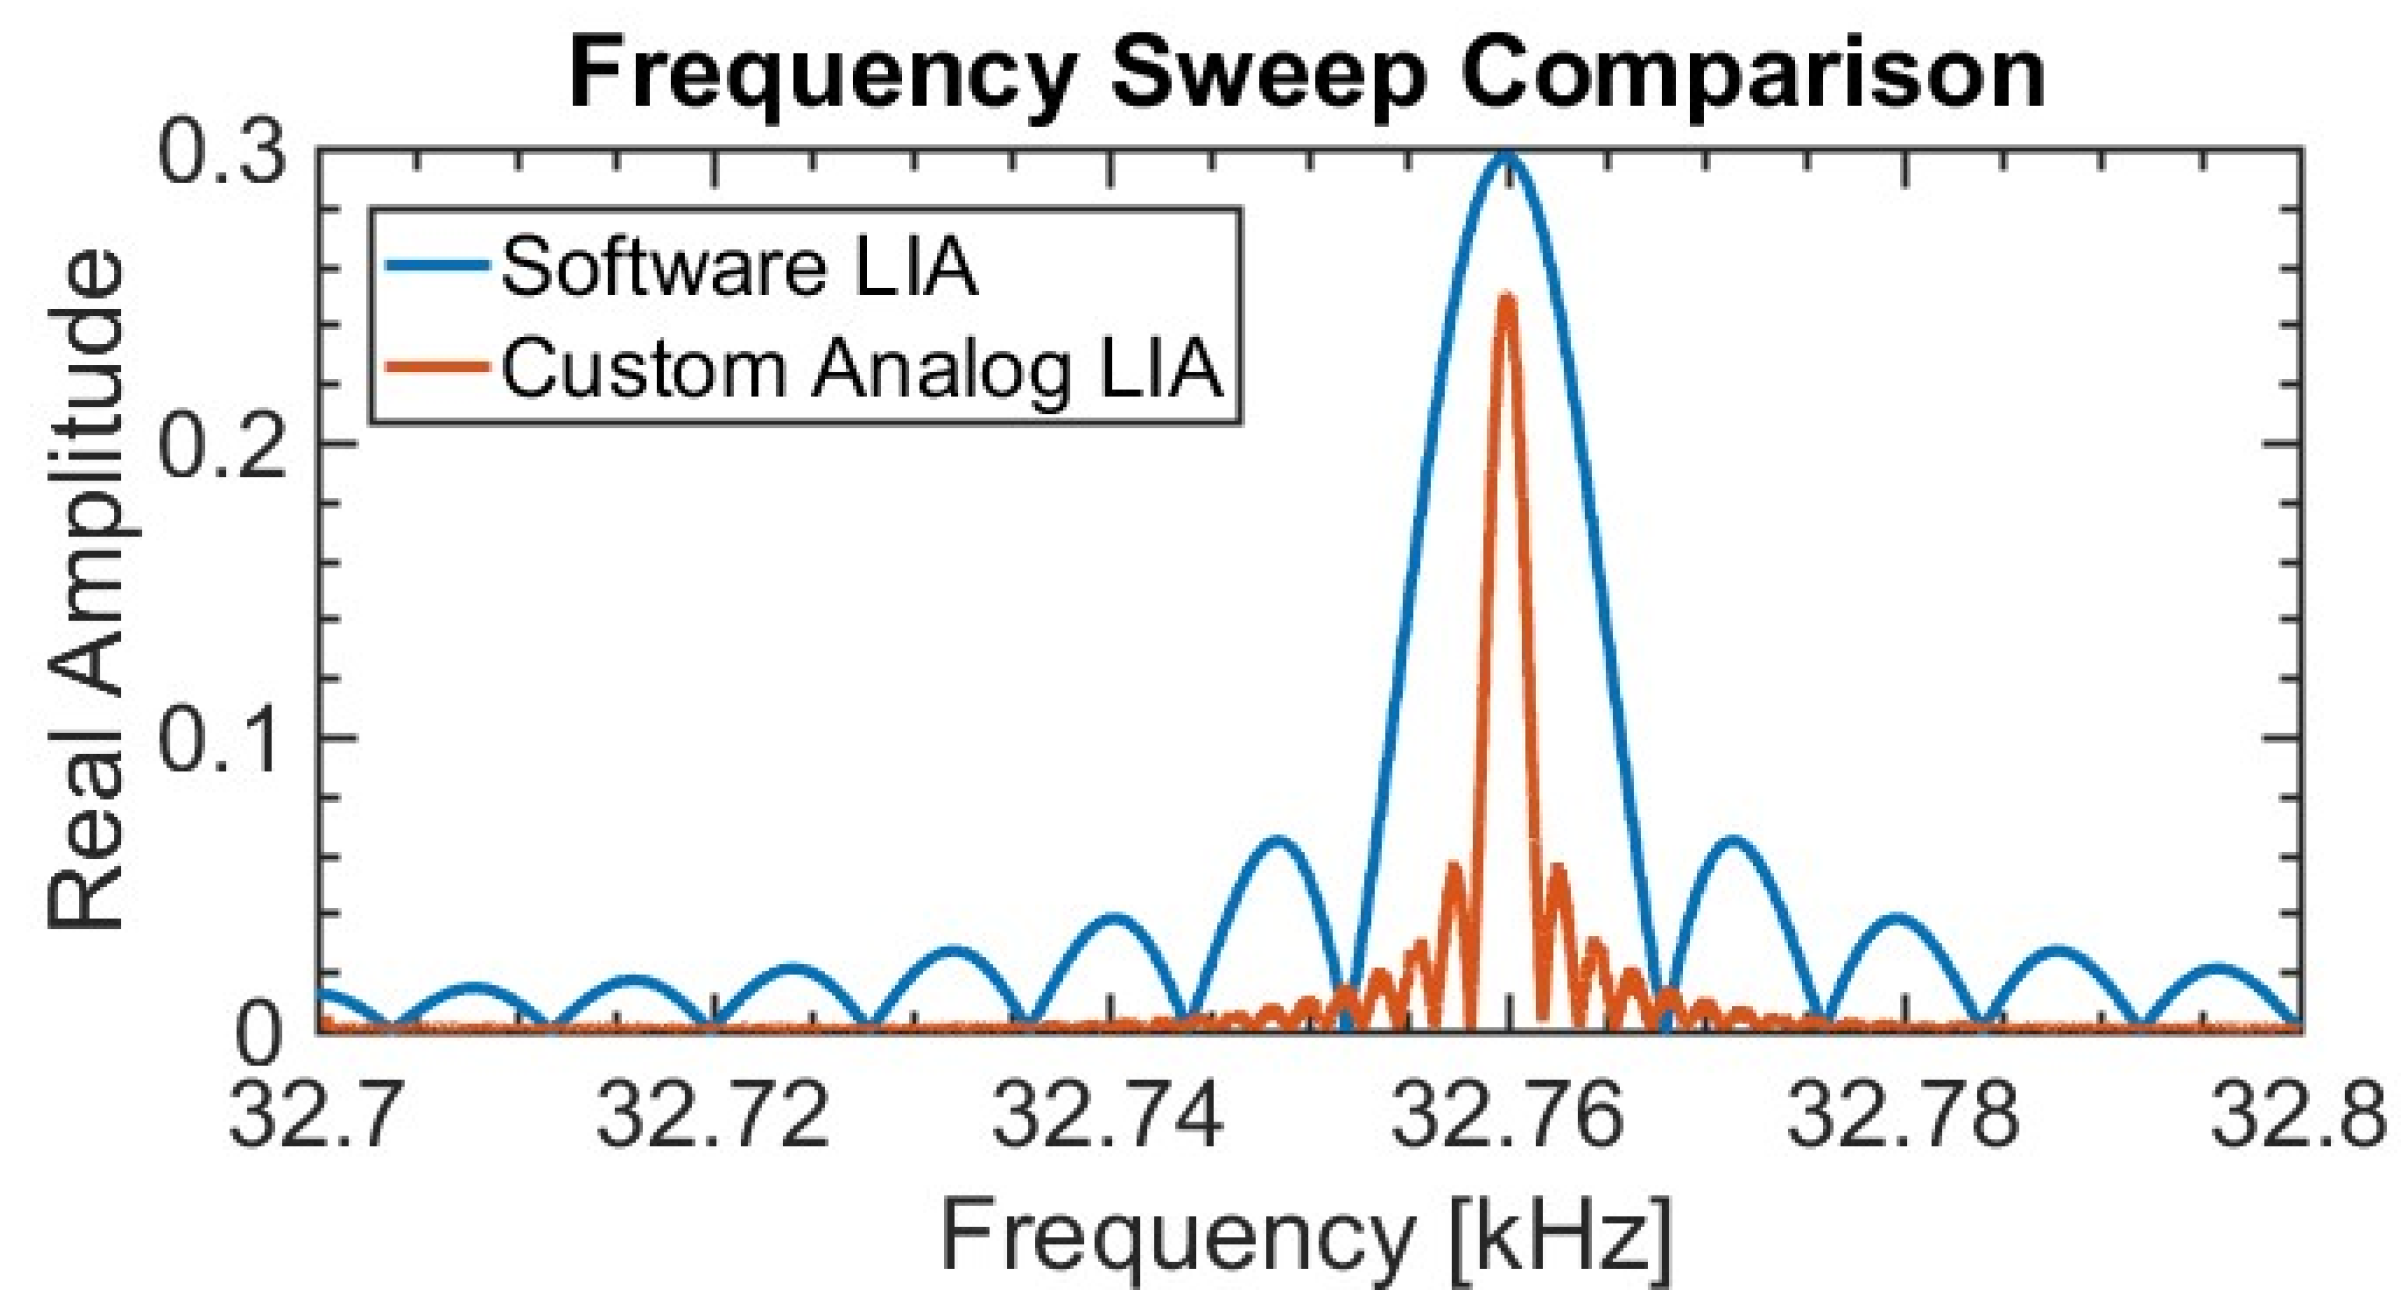
The comparison between the discussed analog LIA and a software LIA, implemented in LabVIEW (integration time of 125 ms), in
Figure 3 demonstrates the well-working circuit. The experiment was performed by use of the same waveform generator, performing a CHIRP from 32.7 to 32.8 kHz in 500 s at a locked frequency of 32.76 kHz. An improvement in sharpness of the lock-in amplification could be achieved.
4. Discussion
This custom solution results in massive cost saving as compared to off-the-shelf equipment. Preliminary results (cf.
Figure 3) proof the functionality of the circuitry to measure both in- and out of phase component of the QTF precisely. Determination of the limit of detection, the accuracy verification and automated NO
2 concentration measurements will be presented. The principal future goal is to build a fully-characterized, automated and sealed prototype with IoT connectivity.
Author Contributions
Preparatory work, initial experiments and supervision in ongoing work were performed by P.B.; circuit development and testing as well as microcontroller programming and data processing was the work of A.K.; this project was supervised and supported by A.B. and the Institute of Electronic Sensor Systems, Graz University of Technology.
Acknowledgments
All sources of funding of the study should be disclosed. Please clearly indicate grants that you have received in support of your research work. Clearly state if you received funds for covering the costs to publish in open access.
Conflicts of Interest
The authors declare no conflict of interest.
Abbreviations
The following abbreviations are used in this manuscript:
| ADC | Analog-to-Digital Converter |
| DDS | Direct Digital Synthesizer |
| LIA | Lock-In Amplifier |
| LPF | Low Pass Filter |
| QEPAS | Quartz Enhanced Photoacoustic Spectroscopy |
| QTF | Quartz Tuning Fork |
| SPS | Samples per Second |
References
- Kosterev, A.A.; Bakhirkin, Y.A.; Curl, R.F.; Tittel, F.K. Quartzenhanced photoacoustic spectroscopy. Opt. Lett. 2002, 27, 1902. [Google Scholar] [CrossRef]
- Kosterev, A.; Bakhirkin, Y.; Tittel, F. Ultrasensitive gas detection by quartz-enhanced photoacoustic spectroscopy in the fundamental molecular absorption bands region. Appl. Phys. B. 2005, 80, 133. [Google Scholar] [CrossRef]
- Liu, Y.; Zhang, R. AD630 Lock-in Amplifier for Weak Signal. Adv. Mater. Res. 2012, 482–484, 975–980. [Google Scholar] [CrossRef]
| Publisher’s Note: MDPI stays neutral with regard to jurisdictional claims in published maps and institutional affiliations. |
© 2018 by the authors. Licensee MDPI, Basel, Switzerland. This article is an open access article distributed under the terms and conditions of the Creative Commons Attribution (CC BY) license (https://creativecommons.org/licenses/by/4.0/).

