Proceeding Paper

Optimal Sensor Placement in a Partitioned Water Distribution Network for the Water Protection from Contamination †

by
Carlo Ciaponi
1,
Enrico Creaco
1,
Armando Di Nardo
2,
Michele Di Natale
2,
Carlo Giudicianni
2,*,
Dino Musmarra
2 and
Giovanni Francesco Santonastaso
2
1
Dipartimento di Ingegneria Civile e Architettura, Università degli Studi di Pavia, via Ferrata, 3, 27100 Pavia, Italy
2
Dipartimento di Ingegneria, Università degli Studi della Campania “L. Vanvitelli”, via Roma, 29, 81031 Aversa, Italy
*
Author to whom correspondence should be addressed.
Presented at the 3rd EWaS International Conference on “Insights on the Water-Energy-Food Nexus”, Lefkada Island, Greece, 27–30 June 2018.
Proceedings 2018, 2(11), 670; https://doi.org/10.3390/proceedings2110670
Published: 31 July 2018
(This article belongs to the Proceedings of EWaS3 2018)

Abstract

:
Water network protection from accidental and intentional contamination is one of the most critical issues for preserving the citizen health. Recently, some techniques have been proposed in the literature to define the optimal sensor placement. On the other hand, through the definition of permanent DMAs (District Meter Areas), water network partitioning allows significant reduction in the number of exposed users through the full isolation of DMA. In this paper, the optimal sensor placement is coupled with water network partitioning in order to define the best location of isolation valves and control stations, to be closed and installed respectively. The proposed procedure is based on different procedures, and it was tested on a real water network, showing that it is possible both to mitigate the impact of a water contamination and simplify the sensor placement through the water network partitioning.

1. Introduction

The “divide and conquer” concept has recently been gaining attention in the management of water distribution networks (WDNs), since dividing large-scale networks into smaller and manageable subsystems (District Metered Areas, DMAs), offers advantages for the monitoring and control of consumption and leakage. In the scientific literature, numerous works were dedicated to the design of DMAs, based on the application of graph and spectral theory algorithm [1,2,3,4,5], or based on the concept of modularity function [6,7,8,9].
In this framework, one of the main research issues lies in determining the optimal location of sensors, able to detect the most common water parameters and, as a result, to monitor the WDN by identifying possible contaminations [10,11,12,13]. This paper explores the benefits of network partitioning for the optimal placement of quality sensors for water distribution network (WDN) protection from contaminations. The global aim is to show how the water network partitioning improves the protection of the WDNs against a possible contamination, both accidental and intentional. The proposed methodology was tested on a real WDN, showing that the partitioning successfully mitigates the impact of contaminations in terms of affected population, thanks to the reduction in the total number of water paths in the WDN.

2. Materials and Methods

The methodology is based on the combination of two main procedures: the former procedure enables WDN partitioning by clustering network nodes for district metered area (DMA) identification, and by separating the DMAs through gate valve closure or flow meter installation at each boundary pipe; the latter procedure is for the optimal placement of quality sensors in undivided or partitioned WDNs.

2.1. Network Partitioning

WDN partitioning is carried out in two main phases:
  • clustering, in which the optimal shape and size of the clusters are defined by minimizing the number of edge-cuts (boundary pipes) and by simultaneously balancing the number of nodes of each cluster, and
  • dividing, in which clusters are separated from each other by closing isolation valves at some boundary pipes and installing flow meters at the remaining boundary pipes.
In this work, the clustering layout is obtained exploiting the properties of the normalized Laplacian matrix L = D − A, in which D is the diagonal matrix containing the node degree ki of each node, and A is the adjacency matrix, which elements aij = aji = 1 if nodes ni and nj are connected by a pipe, aij = aji = 0 otherwise. On the Laplacian matrix the spectral clustering algorithm was applied, for which the main steps in the case of a WDN are described in [14]. The graph of the WDN was considered un-weighted (every connection between the nodes has the same importance). The clustering phase provides the optimal cluster layout and the edge-cut set Nec.
Regarding the dividing phase, the choice must be made whether either a gate valve must be closed, or a flow meter must be installed in the generic boundary pipe, in a way that, the sum of closed gate valves Ngv and installed flow meters Nfm must be equal to Nec. Closing gate valves could reduce the service pressure, so it is important to guarantee that the service pressure in each point was higher than the desired threshold value hdes. In this work, the trade-off between leakage and WDN reliability was explored through the bi-objective optimization, performed through the NSGAII genetic algorithm [15]. The first objective function f1 to minimize was the daily leakage:
f1 = Vl,
The second objective function f2 relates to the global resilience failure index GRF index proposed by [16], which is the sum of the resilience (Ir) and failure (If) indices evaluated at the generic instant of WDN operation:
G R F = I r + I f = m a x ( q u s e r T H d T H d e s , 0 ) Q 0 T H 0 + d T H d e s + min ( q u s e r T H d T H d e s , 0 ) d T H d e s
where d and quser are the vectors of nodal demands and water discharges delivered to users, respectively, at WDN demanding nodes. In this work, quser was evaluated as a function of d and pressure head h at each node through the pressure driven formula of [17]. H and H0 are the vectors of nodal heads at demanding nodes and sources, respectively. Hdes is the vector of desired nodal heads, which are the sum of nodal elevations and desired pressure heads hdes. Finally, Q0 is the vector of the water discharges leaving the sources. The GRF index has the advantage of being always within range [−1, 1]. Higher values of GRF indicate higher power delivered to WDN users and, therefore, higher service pressure. The objective function f2 was calculated with the relationship suggested by [16], f2 = median(GRF).
The Pareto front of optimal solutions will be re-evaluated also in terms of Nfm (as a surrogate for the partitioning cost) and demand satisfaction rate Ids (that represents the effectiveness of the service to WDN users); in particular, it can be calculated as the ratio between delivered water volume wd (m3) and WDN demand wtot (m3).

2.2. Optimal Sensor Placement

Let a set S of significant contamination events, each of which featuring a certain location, starting time, duration and total mass, be defined. In this context, sensor placement can be formulated as a bi-objective optimization problem [13], in which the first objective function f3 is the number Nsens of installed sensors (as a surrogate for the installation cost for the WDN protection)
f3 = Nsens,
and the second objective function f4 is related to the contaminated population popr before the first detection of the generic r-th contamination event. This corresponds to the sum of the inhabitants served by the contaminated nodes and can be evaluated using the EPANET quality solver [18], considering an unreactive contaminant as assumption of the first attempt.
The time interval ∆treact (the time for a warning to interrupt network service) is set to 0 hereinafter for simplifying purposes but can be set to other values without loss of validity of the whole methodology. The function f4 is calculated as the weighted average value pop of popr, that is:
f 4 = p o p = r = 1 S w r p o p r r = 1 S w r ,
where wr is a weight coefficient associated with the generic contamination event.
Functions f3 and f4 are minimized simultaneously through the NSGAII genetic algorithm [15]. In the population individuals of NSGAII, the number of genes is equal to the number of network nodes where sensors can be installed. Each gene can take on the two possible values 0 and 1, which stand for absence and presence of the sensor in the node associated with the gene, respectively.

3. Case Study

The methodology described above was tested on the WDN of Parete [19], which is a small town located in a densely populated area to the south of Caserta (Italy), with population of 11,150 inhabitants. This WDN has 182 demanding nodes (with ground elevations ranging from 53 m a.s.l. to 79 m a.s.l.), 282 pipes and 2 sources with fixed head of 110 m a.s.l. (Figure 1).
A uniform desired pressure head hdes = 9 + 10 = 19 m was assumed for the demanding nodes (9 m is the height of the average building in Parete while 10 m is the surplus of head as prescribed by the Italian guidelines).
Reference was made to the day of maximum consumption in the year with an average value of the node water demand of 36.3 L/s. The leakage volume of the networks in the day of maximum consumption adds up to 930 m3 (about 23% of the total outflow from the sources).
The water quantity simulations were run for one day of WDN operation. For the construction of the set S of contamination events, all the 182 demanding nodes were considered as potential locations for contaminant injection, 24 possible contamination times in the day (hour 0, 1, 2, …, 22, 23), a single value of the mass injection rate equal to 350 gr/min, and a single value of the injection duration equal to 60 min were assumed.
The values for mass injection and duration were sampled from those proposed by [11]. According to the procedure of [13], and considering the previous assumptions, the total number S of contamination events was 182 × 24 × 1 × 1 = 4368. The weight of the generic event wr was set to 1 to give identical relevance to all of them. The water quality simulations were run for 3 days of WDN operation to make sure that even contaminants injected close to the sources at the last instant of the first day had enough time to leave the network.
After the definition of the optimal partitioning, two cases were analysed, in particular, Case 1, with Optimal sensor placement on the original un-partitioned WDN, and Case 2, with Optimal sensor placement on partitioned WDN. In all the applications, the NSGAII was applied with a population of 300 individuals and a total number of 300 generations.

4. Results and Discussion

Following, the results were presented for both Cases, comparing them in terms of exposed population. The water network partitioning leads to produce 5 DMAs; in Table 1, the number of nodes obtained in each DMA is reported, as well as the number Nec of boundary pipes.
For the dividing phase, the optimization through NSGAII yielded the Pareto front reported in Figure 1a, showing, as expected, growing values of median (GRF) with Vl growing, since both variables are growing functions of the service pressure in the WDN.
Graphs (b) and (c) report the number Nfm of installed flow meters and the demand satisfaction rate Ids, respectively, re-evaluated from the Pareto front and plotted against Vl. Globally, graph (b) highlights that the higher values of Nfm tend to be associated with the lower values of Vl. This is because Vl tends to grow when fewer gate valves are closed (and then more numerous flow meters are installed) in the boundary pipes. Finally, graph c) shows that Ids tend to grow with Vl increasing, since both variables are increasing functions of the service pressure. From the graphs in Figure 1, the solution with the lower value of Nfm (=8), higher number of closed valves Ngv (=13), which ensures Ids = 100%, was finally chosen, which enables also reducing leakage around 3,7% (from 930 m3 for the un-partitioned layout to 895 m3). The corresponding median (GRF) is equal to 0.32, very close to the value of 0.36 for the un-partitioned network.
After the definition of the optimal partitioning, the optimal sensor placement was carried out on the original un-partitioned network and on the partitioned one. The Pareto fronts for the optimal sensor placement are shown in Figure 2; the results for the original un-partitioned WDN are represented as solid black lines, while for the partitioned network they are reported as dotted black line. As expected, for both Cases, the fronts show decreasing values of pop as Nsens increases up to 20. However, for higher values of Nsens, the additional benefit of a further sensor installed in the network tends to decrease, as already pointed out by [13].
The comparison points out better solutions for Case 2 (partitioned network), above all for low values of Nsens, as shown by the values of pop in Figure 2 and by the values of the percentage difference calculated as (value of pop for Case 1 − value of pop for Case 2)/value of pop for Case 1, in Table 2. In particular, for Nsens = 6, the contaminated population for the un-partitioned network is pop = 514 (a reduction by 81.7% compared to pop=2806 for Nsens = 0 in the un-partitioned network), while for the partitioned network pop = 457 (a reduction by 83.7% compared to pop=2806 for Nsens = 0 in the un-partitioned network). This is because the partitioning per se causes a reduction in the total number of water paths in the WDN and, therefore, in the contaminated population (highlighted for a number of sensors Nsens = 0, where the difference of the contaminated population is around 11.7%). Therefore, the optimal combination of Nsens sensors in a partitioned WDN always outperforms the corresponding one in the original WDN.
In this regard, for the partitioned network, installing the same number of sensors in the WDN of Parete leads to a reduction of the contaminated population, with respect to the un-partitioned network, ranging from 7.3% (corresponding to Nsens = 2) to 17.9% (corresponding to Nsens = 4). In particular, the partitioning does not only reduce per se the contaminated population but also improves the efficiency of the sensor station systems. This means that, the water network partitioning is a valid strategy to better manage the WDNs and simultaneously to guarantee the water network protection from contamination (both accidental and intentional), confirming its dual-use.
The layouts in Figure 3 show the optimal location of 6 sensors obtained in the original un-partitioned WDN, and in the partitioned WDN. It is clear that, for the two layout of the Parete WDN (un-partitioned and partitioned), 5 of the 6 sensors are located about in the same areas. It suggests that, it is possible to define “most influential” nodes in a WDN regardless the operational conditions, the monitoring of which, ensures an efficient monitoring of the system. This crucial aspect will be further investigated in order to establish topological criteria able to individuate a priori these points.

5. Conclusions

In this work, a methodology based on WDN partitioning and on optimal placement of quality sensors was set up to investigate the benefits of “divide and conquer” technique for the protection of WDNs from contamination events. The applications concerned a real Italian WDN, which was first partitioned in 5 DMAs separated each other by either closing gate valves or installing flow meters at boundary pipes. Optimal sensor placement solutions were searched for on the original undivided WDN and on the partitioned layout, in the trade-off between number of installed sensors and affected population for an assigned set of contamination events. The results showed that, for a given number of installed sensors, the monitoring stations installed in the partitioned layouts offer better protection from contamination. Future work will be dedicated to the issues of DMA restoration after the generic contamination. This will be done with reference to specific real contaminants, while abandoning the simplifying assumption of un-reactive and conservative contaminant adopted so far, in an attempt to make the results more realistic.

Acknowledgments

The authors have no funding to report.

Conflicts of Interest

The authors declare no conflict of interest.

References

  1. Deuerlein, J. Decomposition model of a general water supply network graph. J. Hydraul. Eng. 2008, 134, 822–832. [Google Scholar] [CrossRef]
  2. Perelman, L.; Ostfeld, A. Topological clustering for water distribution systems analysis. Environ. Modell. Softw. 2011, 26, 969–972. [Google Scholar] [CrossRef]
  3. Di Nardo, A.; Di Natale, M.; Giudicianni, C.; Santonastaso, G.F.; Tzatchkov, V.G.; Varela, J.M.R. Economic and Energy Criteria for District Meter Areas Design of Water Distribution Networks. Water 2017, 9, 463. [Google Scholar] [CrossRef]
  4. Herrera, M.; Abraham, E.; Stoianov, I. A graph-theoretic framework for assessing the resilience of sectorised water distribution networks. Water Resour. Manag. 2016, 30, 1685–1699. [Google Scholar] [CrossRef]
  5. Di Nardo, A.; Di Natale, M.; Giudicianni, C.; Greco, R.; Santonastaso, G.F. Water supply network partitioning based on weighted spectral clustering. Stud. Comput. Intell. 2017, 693, 797–807. [Google Scholar]
  6. Girvan, M.; Newman, M.E.J. Community structure in social and biological networks. Proc. Natl. Acad. Sci. USA 2002, 99, 7821–7826. [Google Scholar] [CrossRef] [PubMed]
  7. Diao, K.G.; Zhou, Y.W.; Rauch, W. Automated creation of district metered areas boundaries in water distribution systems. J. Water Resour. Plan. Manag. 2013, 139, 184–190. [Google Scholar] [CrossRef]
  8. Giustolisi, O.; Ridolfi, L. New modularity-based approach to segmentation of water distribution networks. J. Hydraul. Eng. 2014, 140, 04014049. [Google Scholar] [CrossRef]
  9. Ciaponi, C.; Murari, E.; Todeschini, S. Modularity-based procedure for partitioning water distribution systems into independent districts. Water Resour. Manag. 2016, 30, 2021–2036. [Google Scholar] [CrossRef]
  10. Propato, M.; Piller, O. Battle of the water sensor networks. In Proceedings of the 8th Annual Water Distribution System Analysis Symposium, Cincinnati, OH, USA, 27–30 August 2006. [Google Scholar]
  11. Preis, A.; Ostfeld, A. Multiobjective contaminant sensor network design for water distribution systems. J. Water Resour. Plan. Manag. 2008, 134, 366–377. [Google Scholar] [CrossRef]
  12. Cheifetz, N.; Sandraza, A.C.; Feliers, C.; Gilbert, D.; Piller, O.; Lang, A. An incremental sensor placement optimization in a large real-world water system. Procedia Eng. 2015, 119, 947–952. [Google Scholar] [CrossRef]
  13. Tinelli, S.; Creaco, E.; Ciaponi, C. Sampling significant contamination events for optimal sensor placement in water distribution systems. J. Water Resour. Plan. Manag. 2017, 143. [Google Scholar] [CrossRef]
  14. Di Nardo, A.; Giudicianni, C.; Greco, R.; Herrera, M.; Santonastaso, G.F. Applications of Graph Spectral Techniques to Water Distribution Network Management. Water 2018, 10, 45. [Google Scholar] [CrossRef]
  15. Deb, K.; Agrawal, S.; Pratapm, A.; Meyarivan, T. A fast and elitist multi-objective genetic algorithm: NSGA-II. IEEE Trans. Evol. Comput. 2002, 6, 182–197. [Google Scholar] [CrossRef]
  16. Creaco, E.; Franchini, M.; Todini, E. Generalized resilience and failure indices for use with pressure driven modeling and leakage. J. Water Resour. Plan. Manag. 2016, 142, 04016019. [Google Scholar] [CrossRef]
  17. Ciaponi, C.; Franchioli, L.; Murari, E.; Papiri, S. Procedure for Defining a Pressure-Outflow Relationship Regarding Indoor Demands in Pressure-Driven Analysis of Water Distribution Networks. Water Resour. Plan. Manag. 2014, 29, 817–832. [Google Scholar] [CrossRef]
  18. Rossman, L.A. EPANET2 Users Manual; US EPA: Cincinnati, OH, USA, 2000. [Google Scholar]
  19. Di Nardo, A.; Di Natale, M.; Giudicianni, C.; Savic, D. Simplified Approach to Water Distribution System Management Via Identification of a Primary Network. J. Water Resour. Plan. Manag. 2017, 144, 1–9. [Google Scholar] [CrossRef]
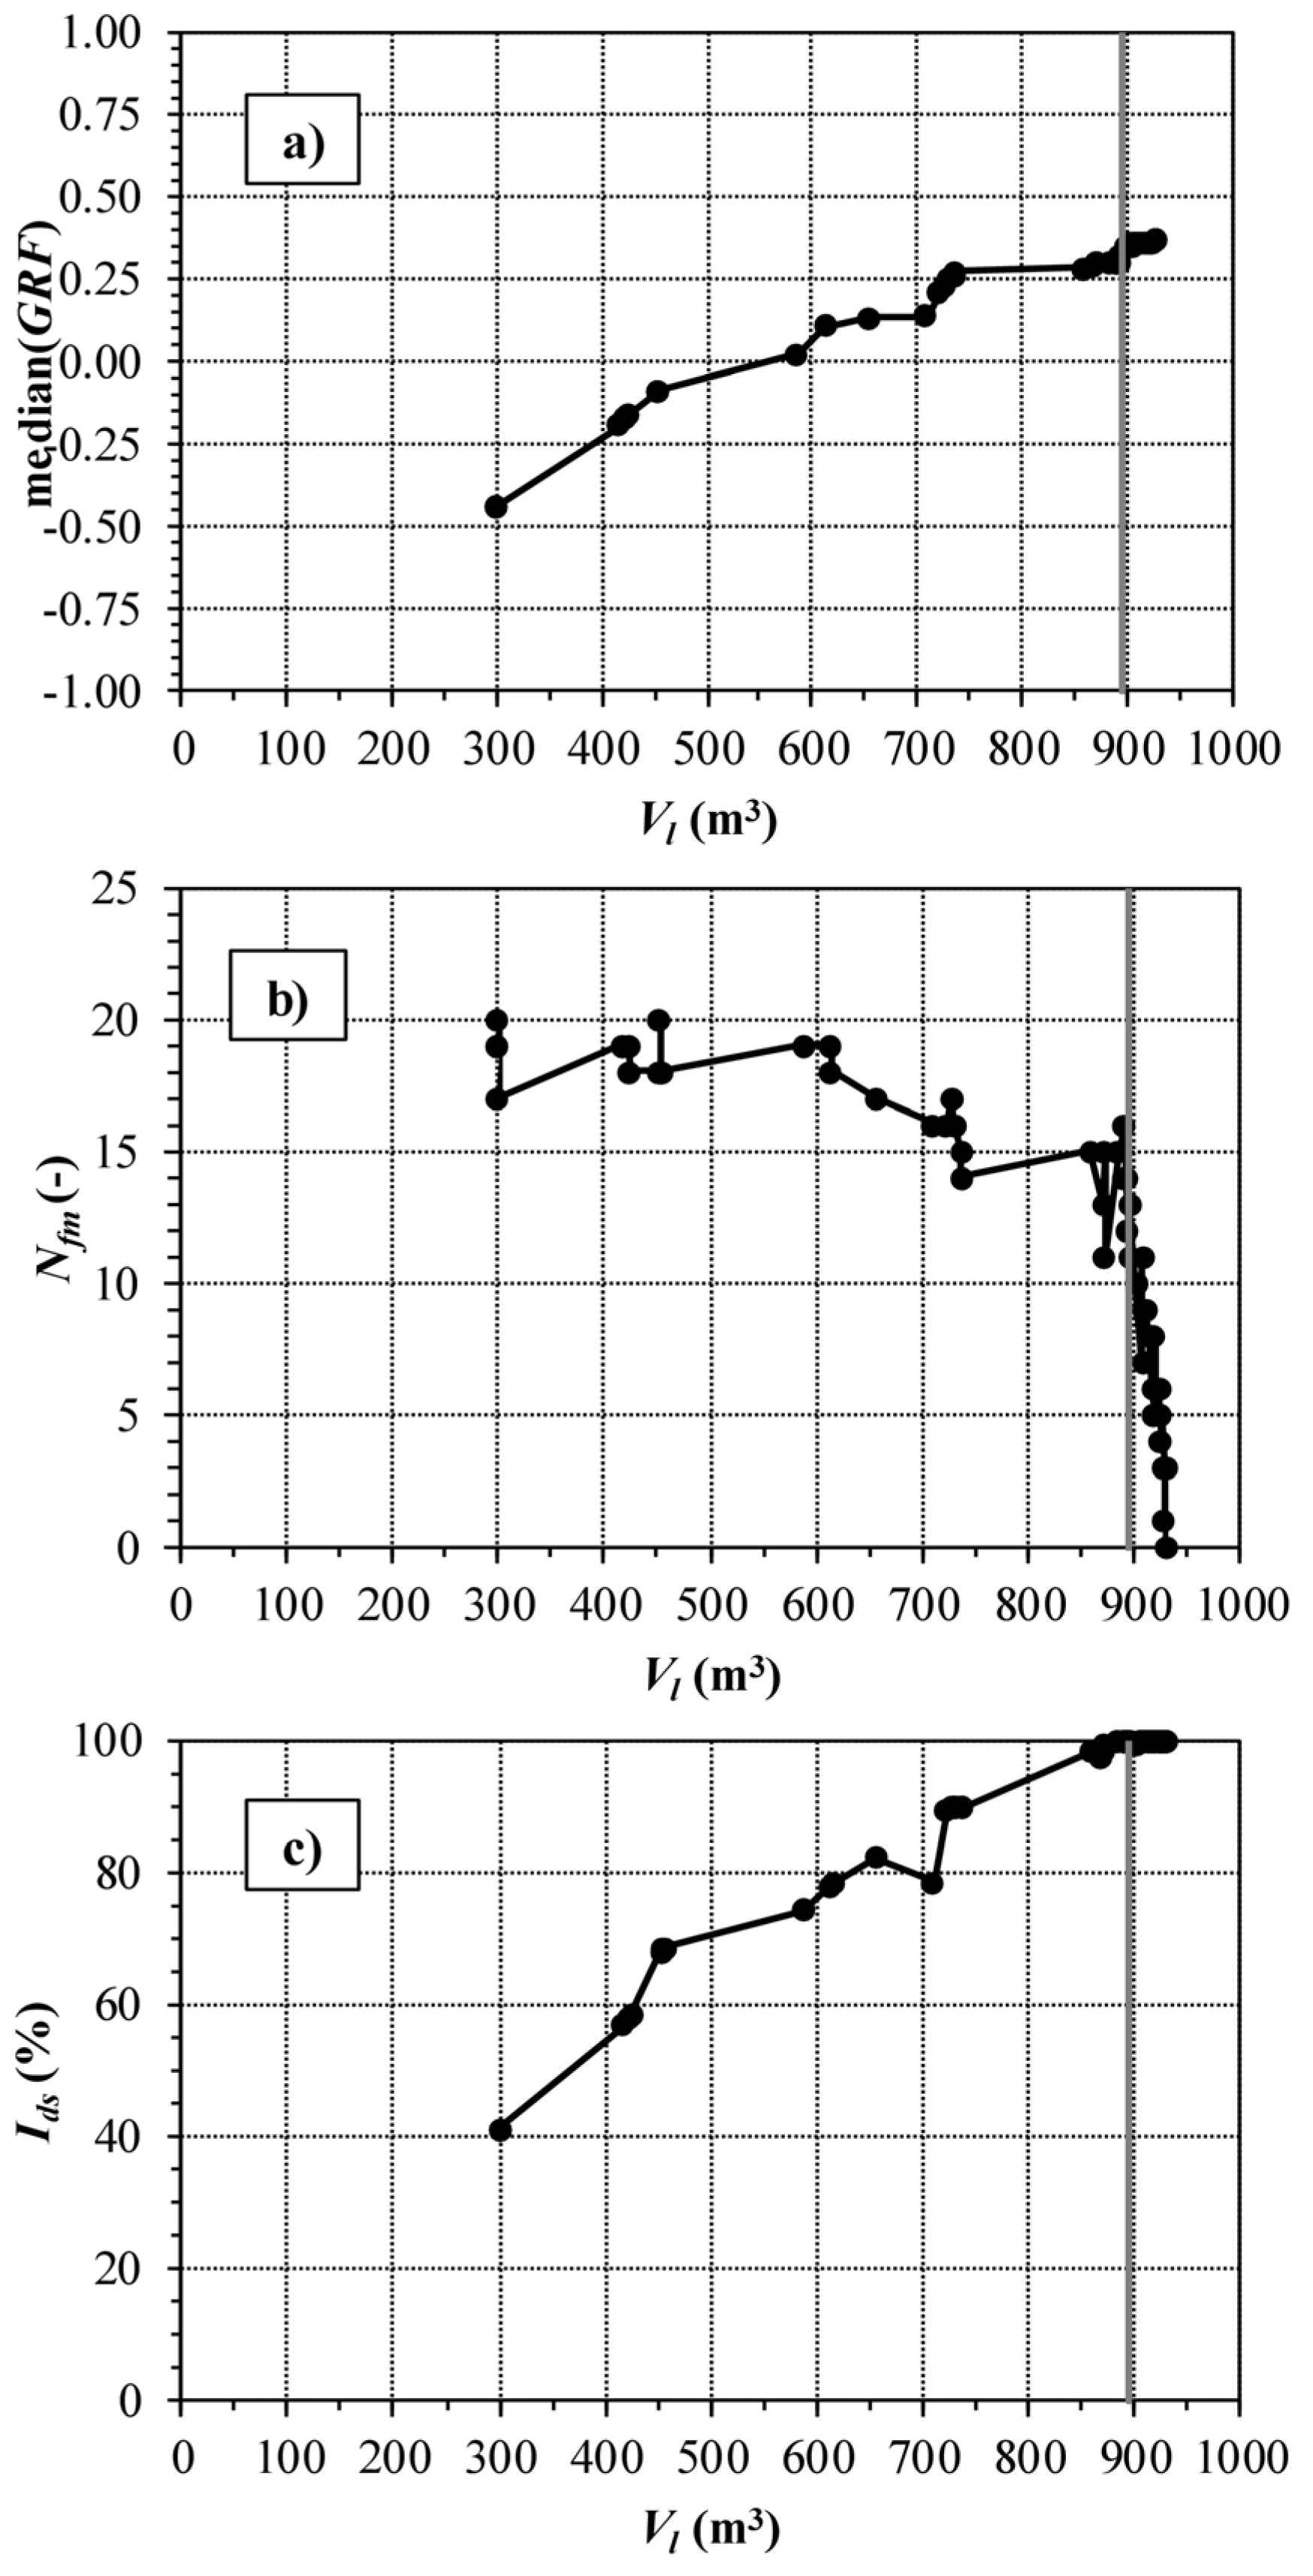
Figure 1. Dividing phase for the Parete WDN. Pareto front of optimal solutions in the trade-off between daily median GRF index and leakage volume Vl (a), re-evaluated solutions in terms of number of installed flow meters Nfm (b) and of demand satisfaction rate Ids (c). In all graphs, the selected solution is highlighted with a grey vertical line.
Proceedings 02 00670 g001
Figure 2. Pareto fronts of optimal sensor placement solutions in the trade-off between Nsens and pop, obtained for the original un-partitioned WDN (Case 1), and for the partitioned WDN (Case 2).
Proceedings 02 00670 g002
Figure 3. Optimal location of 6 sensors in (a) original un-partitioned WDN; (b) partitioned WDN.
Proceedings 02 00670 g003
Table 1. Number of nodes in the various DMAs and Nec of boundary pipes for the partitioning of the Parete WDN in 5 DMAs.
DMA1DMA2DMA3DMA4DMA5Nec
203539414921
Table 2. Simulation results in terms of exposed population for the two Cases for the Parete WDN considering the installation of Nsens up to 6.
Nsens (−)(Case 1)(Case 2)Difference (%)
PopReduction (%)PopReduction (%)Case 1-Case 2
028060.0247911.711.7
1143848.8126554.912.1
298265.191167.57.3
378971.964876.917.9
466776.255480.316.9
558979.050482.114.4
651481.745783.711.1
Publisher’s Note: MDPI stays neutral with regard to jurisdictional claims in published maps and institutional affiliations.