Management of Water Distribution Systems in PDA Condition with Isolation Valves †


Abstract
:1. Introduction
2. Materials and Methods
- Pms is the minimum pressure necessary for the most disadvantaged user;
- Pp are the head losses along the riser column;
- PD are the head losses starting from the network node and ending at the base of each building.
- nseg is the number of segments of the network;
- nCVi is the number of operating shut-off valves isolating the segment;
- nV is the total number of shut-off valves in the network;
- QPDAi is the deliverable demand at each segment before the closure of the valves;
- Qi is the undeliverable demand at each segment after the closure of the valves;
- QRDi is the deliverable demand at each segment after the closure of the valves;
- wi is the weight for each segment calculated as the ratio between the segment base demand in DDA condition and the total base demand in the network.
3. Results
4. Conclusions
Author Contributions
Conflicts of Interest
References
- Giustolisi, O.; Savic, D. Identification of segments and optimal isolation valve system design in water distribution networks. Urban Water J. 2010, 7, 1–15. [Google Scholar] [CrossRef]
- Creaco, E.; Franchini, M.; Alvisi, S. Optimal placement of isolation valves in water distribution systems based on valve cost and weighted average demand shortfall. Water Resour. Manag. 2010, 24, 4317–4338. [Google Scholar] [CrossRef]
- Alvisi, S.; Creaco, E.; Franchini, M. Segment identification in water distribution systems. Urban Water J. 2011, 8, 203–217. [Google Scholar] [CrossRef]
- Giustolisi, O.; Ridolfi, L. New Modularity-Based Approach to Segmentation of Water Distribution Networks. J. Hydraul. Eng. 2014, 140. [Google Scholar] [CrossRef]
- Perelman, L.; Ostfeld, A. Topological clustering for water distribution systems analysis. Environ. Modell. Softw. 2011, 26, 969–972. [Google Scholar] [CrossRef]
- Giustolisi, O.; Berardi, L.; Laucelli, D. Optimal Water Distribution Network Design Accounting for Valve Shutdowns. J. Water Resour. Plan. Manag. 2014, 140. [Google Scholar] [CrossRef]
- FioriniMorosini, A.; Caruso, O.; Costanzo, F.; Savic, D. Emergency Management of Water Distribution Systems: The Nodal Demand Control. Procedia Eng. 2017, 186, 428–435. [Google Scholar]
- Veltri, P.; Fiorini Morosini, A.; Orlando, F. La calibrazione delle scabrezze delle reti idriche: Un approccio di tipo probabilistico basato su un modello PDA di risoluzione della rete. L’Acqua 2010, 2. [Google Scholar]
- Caruso, O. Un Modello di Gestione Delle Reti Idriche in Condizioni di Emergenza. Ph.D.Thesis, University of Calabria, Calabria, Italy, 2017. [Google Scholar]
- Fiorini Morosini, A.; Caruso, O.; Veltri, P.; Costanzo, F. La gestione in emergenza delle reti idriche in condizioni PDA attraverso l’utilizzo di valvole. In Proceedings of the H2O—XIII Mostra Internazionale Dell’acqua Tecnologie, Trattamenti, Distribuzione, Sostenibilità, Bologna, Italy, 19–21 October2016. [Google Scholar]


| Scenarios | Segments | N° Valves |
|---|---|---|
| 1 | 1 | 3 |
| 2 | 2 | 6 |
| 3 | 3 | 8 |
| 4 | 4 | 9 |
| 5 | 5 | 12 |
| 6 | 6 | 14 |
| 7 | 7 | 16 |
| 8 | 7 | 17 |
| 9 | 9 | 22 |
| 10 | 12 | 26 |
| 11 | 14 | 30 |
| 12 | 21 | 38 |
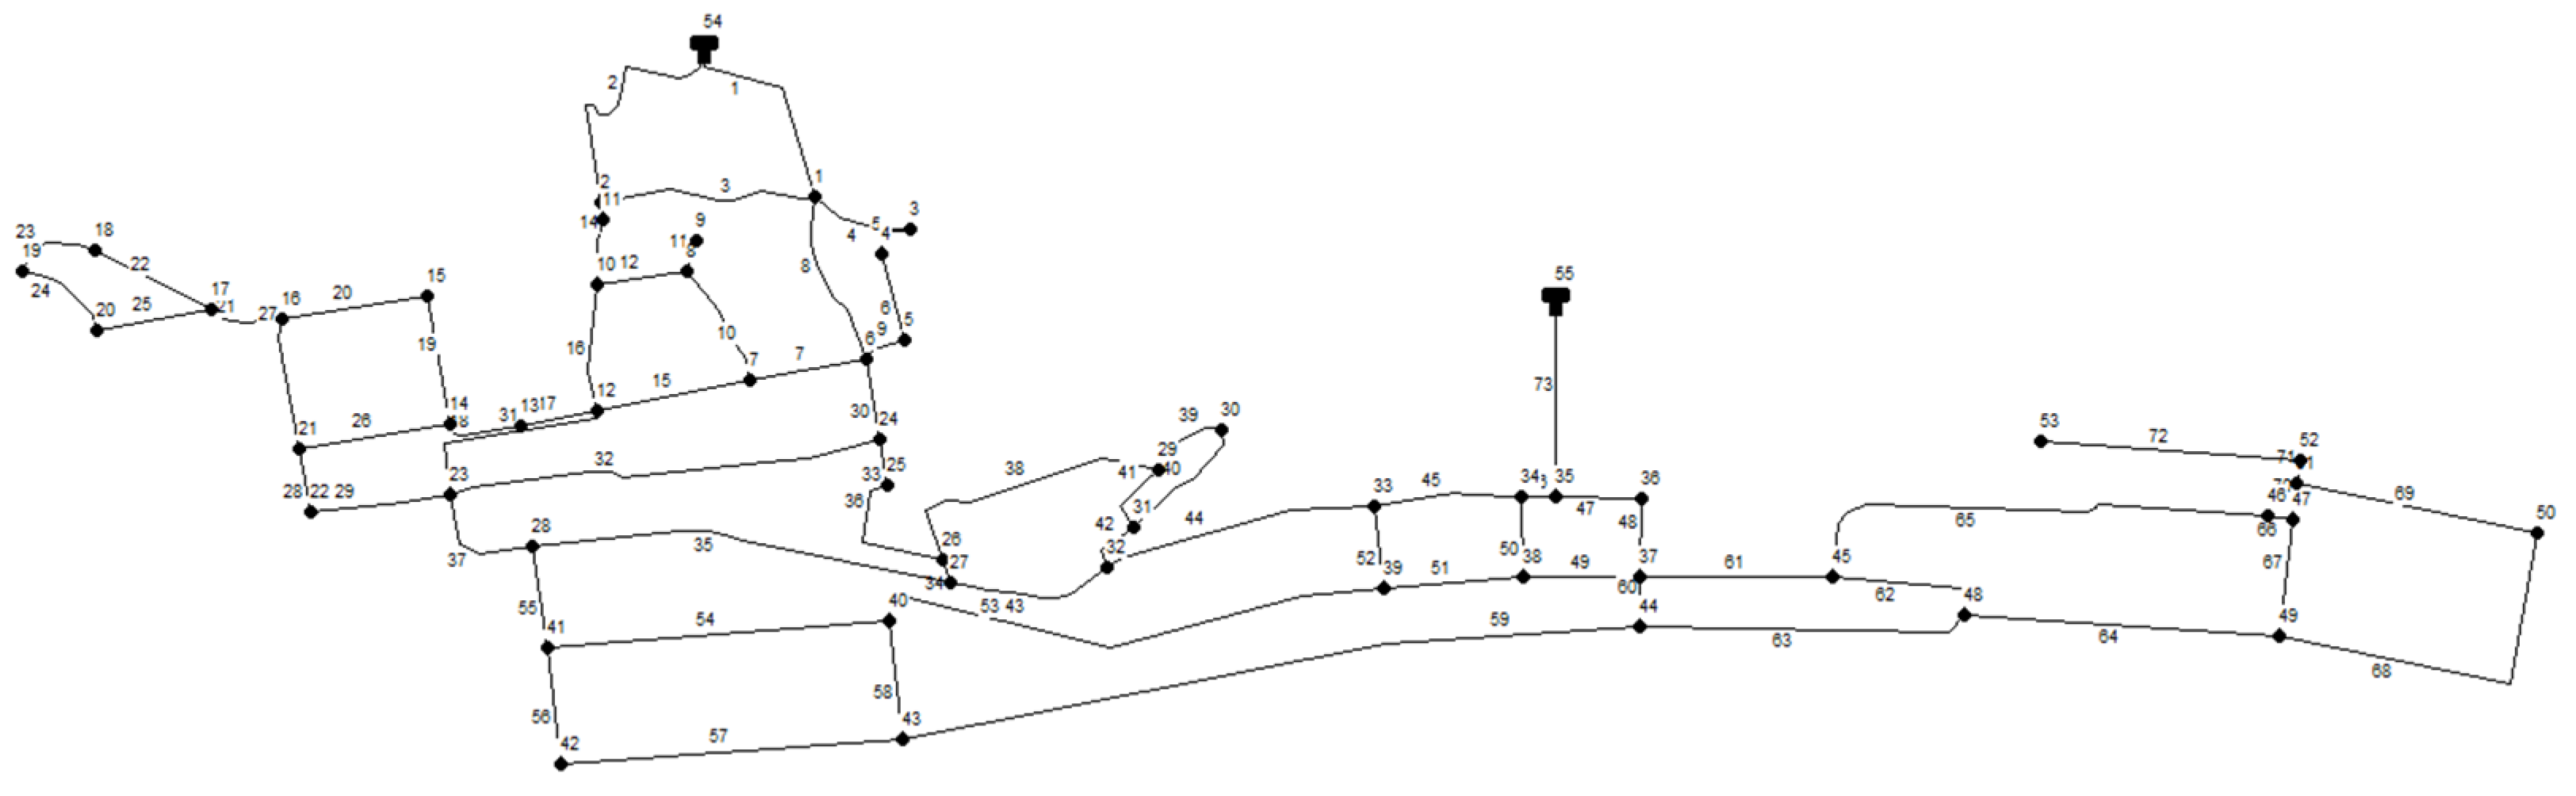
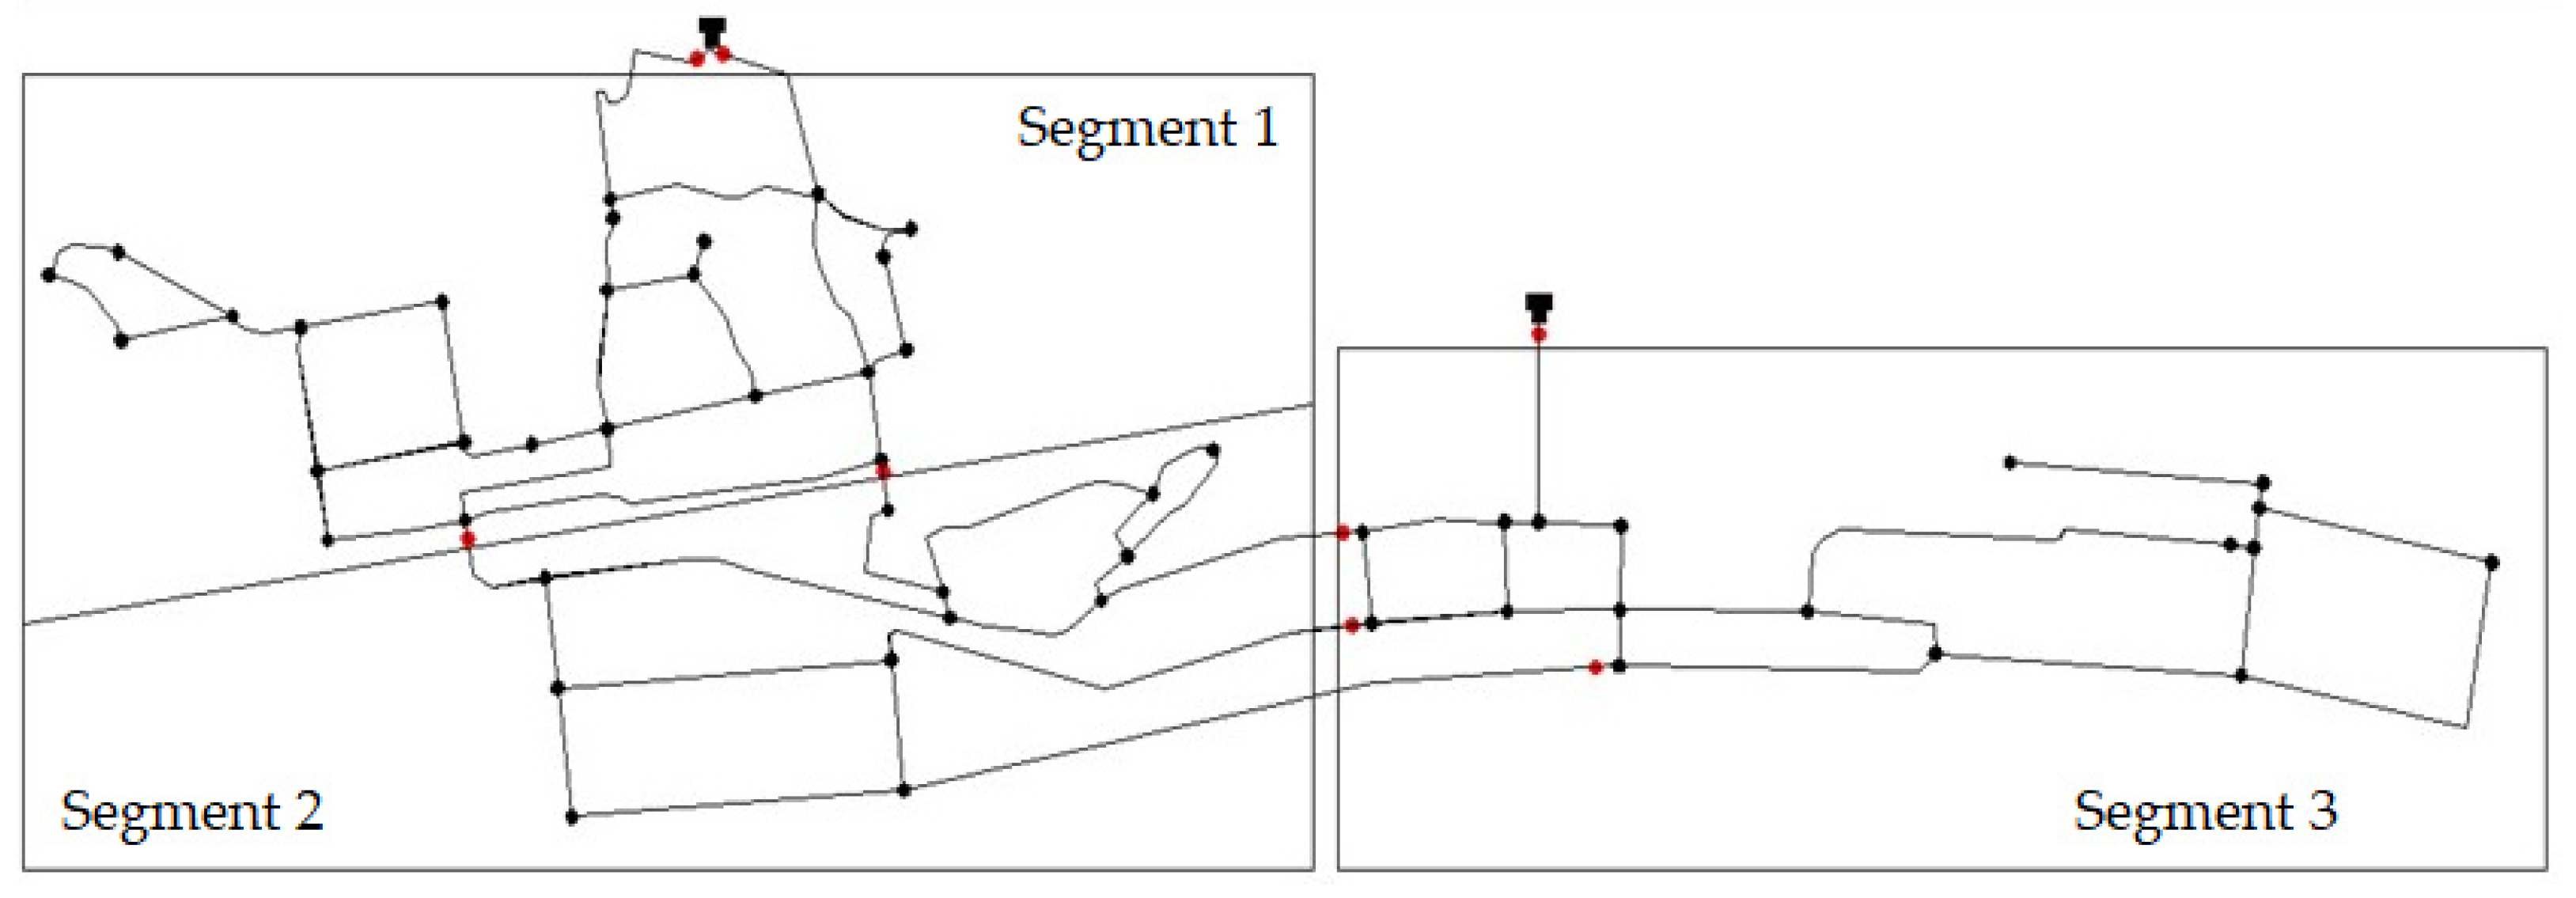
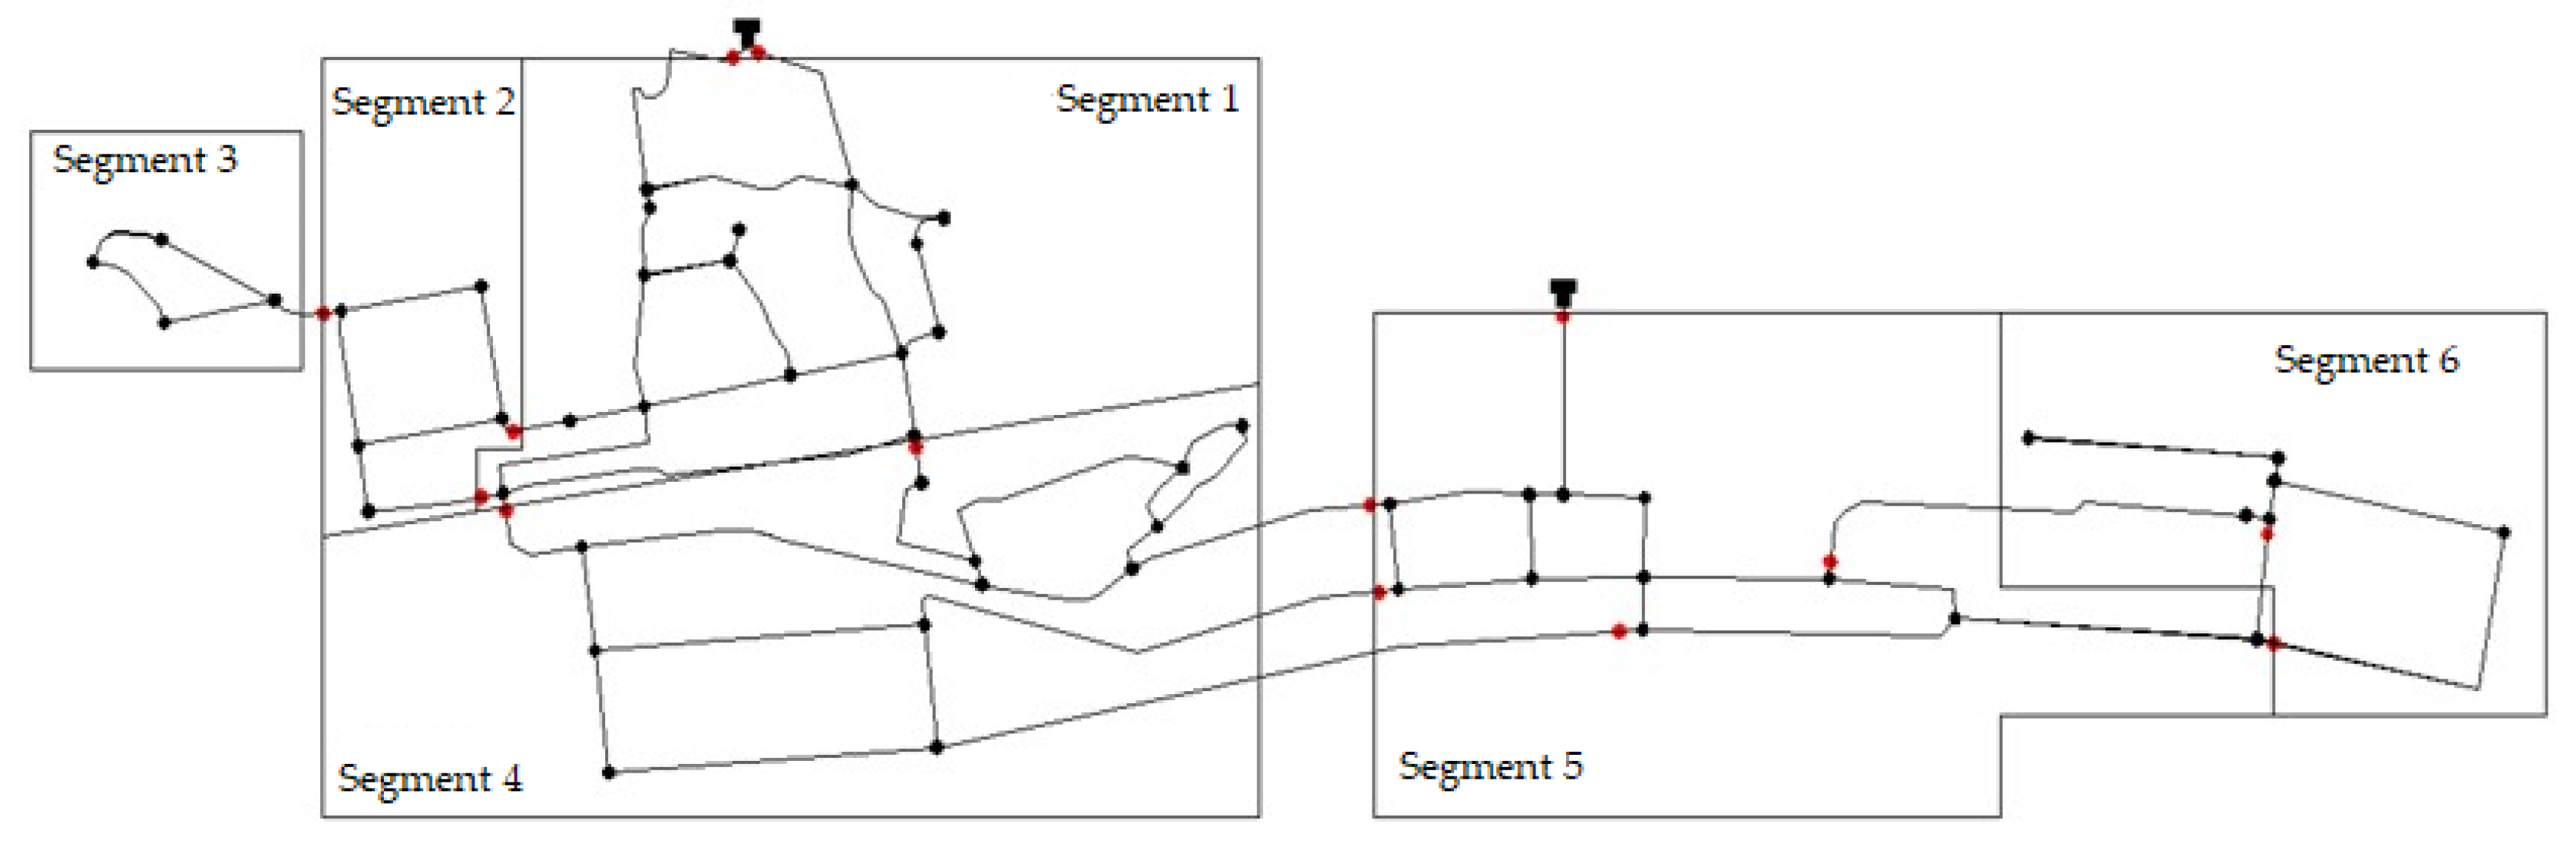
| Scenario N°6 | Segment | Broken Pipes | Subset of Valves | Operating Valves ncv |
|---|---|---|---|---|
| nv = 14 valves | 1 | 3-4-5-6-7-8-9-10-11-12-13-14-15-16-17-30-31-32 | 1-2-33-37 | 4 |
| 2 | 19-20-26-27-28 | 18-29 | 2 | |
| 3 | 22-23-24-25 | 21 | 1 | |
| 4 | 34-35-36-38-39-40-41-42-43-54-55-56-57-58 | 37-33-44-53-59 | 5 | |
| 5 | 5-46-47-48-49-50-51-52-60-61-62-63-64 | 73-44-53-59 | 4 | |
| 6 | 66-69-70-71-72 | 68-67 | 2 |
| Segment | ncvi/nv | Qi/QPDA | (QPDAi-QRDi)/QPDA | wi | OFi |
|---|---|---|---|---|---|
| 1 | 0.43 | 0.37 | 0.38 | 0.26 | 0.307 |
| 2 | 0.21 | 0.11 | 0.11 | 0.07 | 0.031 |
| 3 | 0.07 | 0.04 | 0.04 | 0.04 | 0.007 |
| 4 | 0.36 | 0.27 | 0.27 | 0.27 | 0.248 |
| 5 | 0.43 | 0.35 | 0.41 | 0.26 | 0.311 |
| 6 | 0.21 | 0.09 | 0.09 | 0.09 | 0.036 |
| OF | 0.940 |
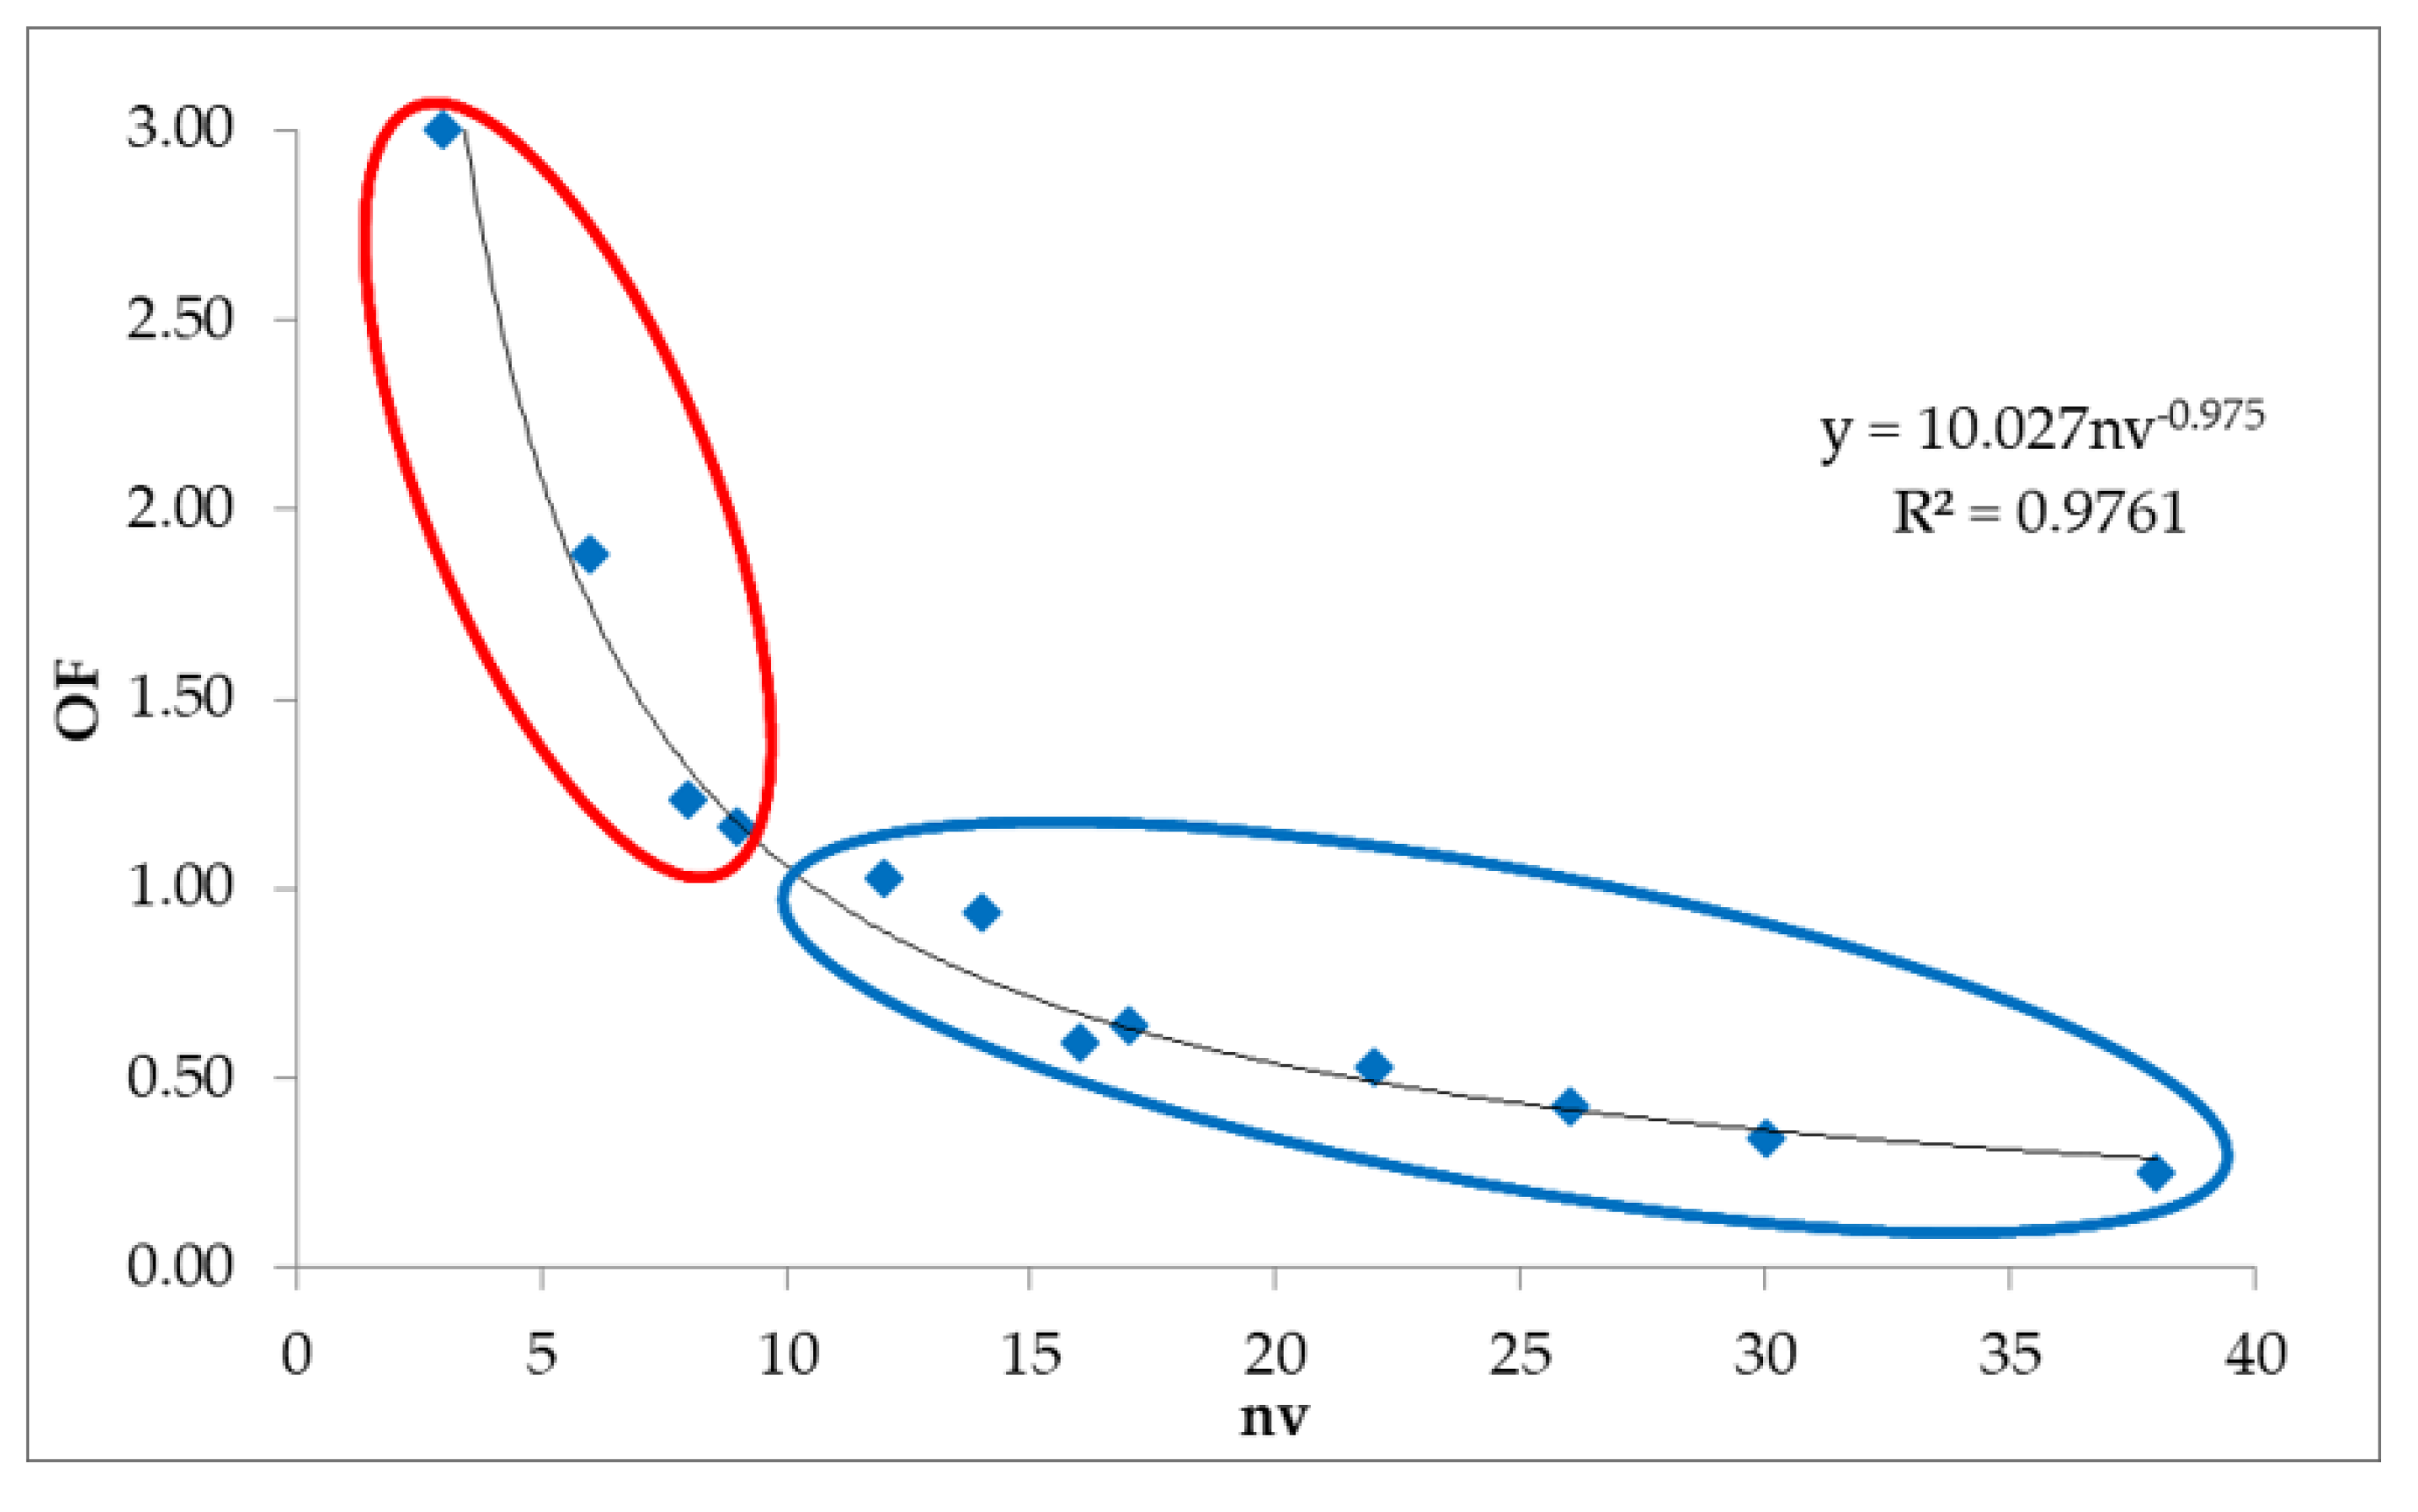
| Scenario | N° Valves | OF |
|---|---|---|
| 1 | 3 | 3.000 |
| 2 | 6 | 1.885 |
| 3 | 8 | 1.234 |
| 4 | 9 | 1.167 |
| 5 | 12 | 1.025 |
| 6 | 14 | 0.940 |
| 7 | 16 | 0.598 |
| 8 | 17 | 0.643 |
| 9 | 22 | 0.528 |
| 10 | 26 | 0.425 |
| 11 | 30 | 0.342 |
| 12 | 38 | 0.249 |
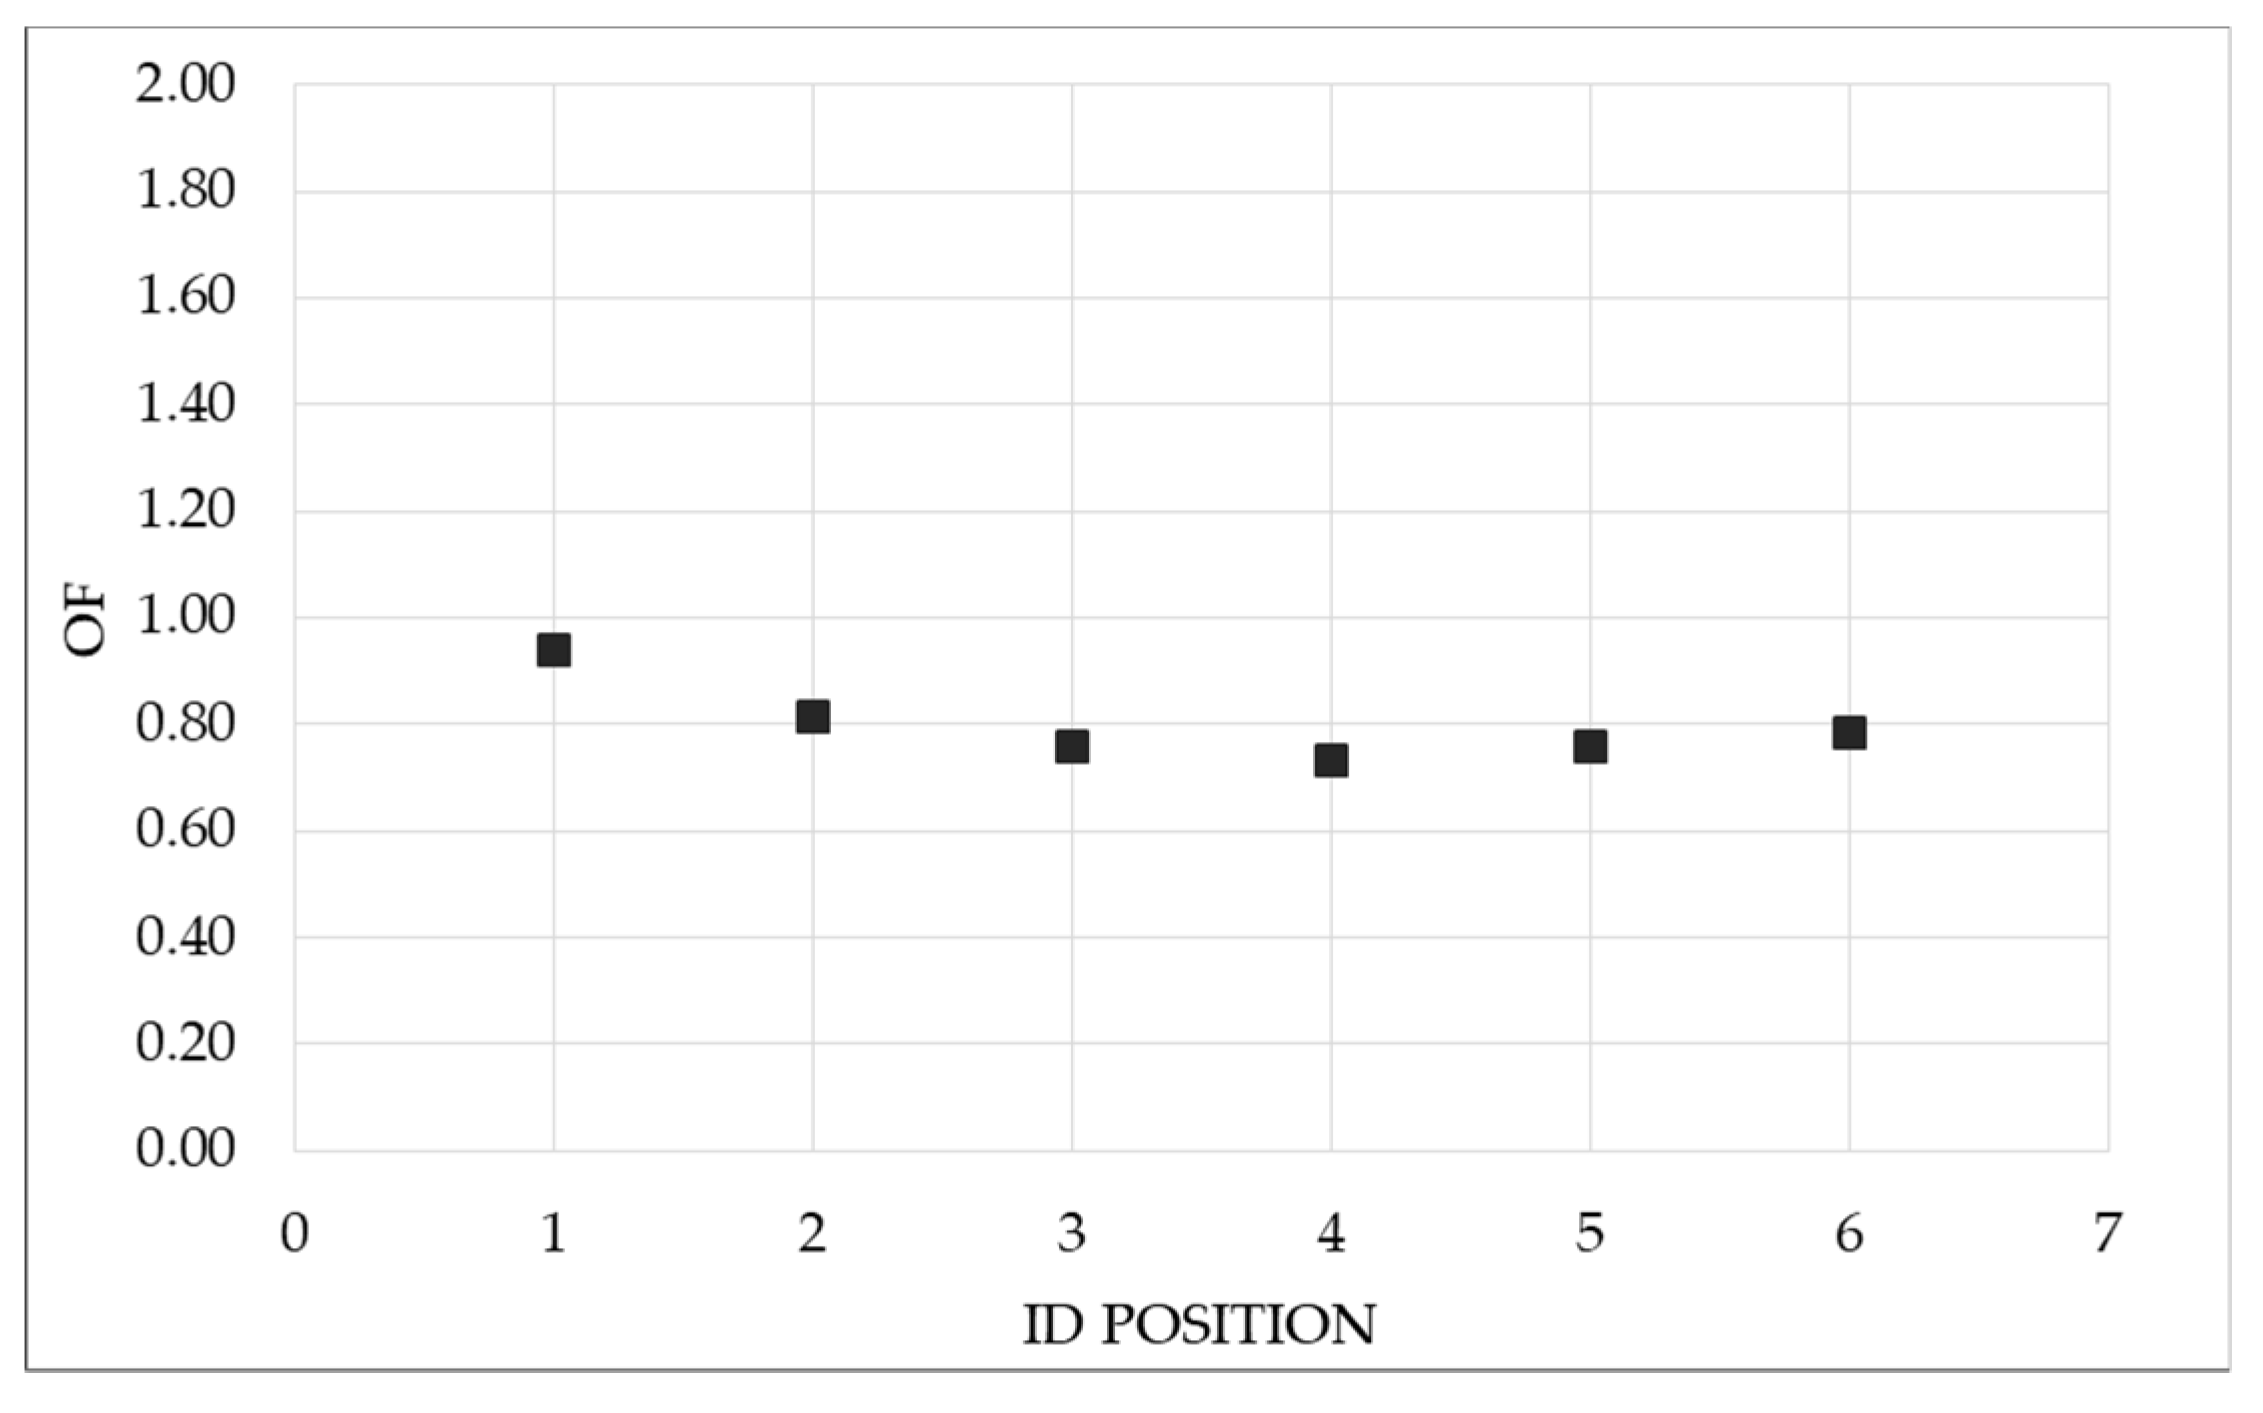
| ID Position | OF |
|---|---|
| 1 | 0.940 |
| 2 | 0.817 |
| 3 | 0.760 |
| 4 | 0.733 |
| 5 | 0.759 |
| 6 | 0.785 |
Publisher’s Note: MDPI stays neutral with regard to jurisdictional claims in published maps and institutional affiliations. |
© 2018 by the authors. Licensee MDPI, Basel, Switzerland. This article is an open access article distributed under the terms and conditions of the Creative Commons Attribution (CC BY) license (https://creativecommons.org/licenses/by/4.0/).
Share and Cite
Morosini, A.F.; Caruso, O.; Veltri, P. Management of Water Distribution Systems in PDA Condition with Isolation Valves. Proceedings 2018, 2, 672. https://doi.org/10.3390/proceedings2110672
Morosini AF, Caruso O, Veltri P. Management of Water Distribution Systems in PDA Condition with Isolation Valves. Proceedings. 2018; 2(11):672. https://doi.org/10.3390/proceedings2110672
Chicago/Turabian StyleMorosini, Attilio Fiorini, Olga Caruso, and Paolo Veltri. 2018. "Management of Water Distribution Systems in PDA Condition with Isolation Valves" Proceedings 2, no. 11: 672. https://doi.org/10.3390/proceedings2110672
APA StyleMorosini, A. F., Caruso, O., & Veltri, P. (2018). Management of Water Distribution Systems in PDA Condition with Isolation Valves. Proceedings, 2(11), 672. https://doi.org/10.3390/proceedings2110672