1. Introduction
Fish farming has a long tradition in the Czech Republic, it has been an important part in the food production system since the 12th century [
1]. Furthermore, the fishponds play an important role in a culture life, tourism and landscape water management, mainly in areas with very complex fishponds systems. The fishponds and their earth-filled dams are often very old, in some cases as much as thousand years. The dams, even if properly managed, are endangered by slow or sudden degradation processes due to several reasons (e.g., overtopping during extreme floods, uneven settlement, piping, rodents, etc.) [
2,
3,
4,
5]. Due to its historical, culture and environmental importance, many fishponds and dams are protected through various laws, standards or cultural and environmental agreements. Therefore, it is problematic to perform any invasive engineering interventions if the stability or seepage problems arise.
Internal erosion of the earth-filled dams resulting in an increased seepage is one of the most often dam and embankment failure world widely [
6,
7]. Internal erosion is caused by constantly migrating fine particles through preferential pathways towards the coarse dam regions and free exits, which may result in the so-called piping events. The piping may occur at the dam foundation, along the technical inner structures, such as spillways or outlets, or anywhere else within the dam body due to poorly compacted soil during the construction. Mainly erodibility of the soils, percolating water velocity within the earth dam, geometry and homogeneity of the dam material affect the seepage regime [
8], especially during rapid changes of the water level in the reservoir [
9].
Historical earth-dams have certain specifics that one needs to take into account. They were built in a time when the today’s demands on material quality, dam design, soil consolidation and compaction, outlet and spillway design were not applied. The outlet was usually made of wood and after several centuries has degraded or had clogged. We lack the documentation on the foundation details, used materials and the initial dam design. Many of the dams were during the centuries repaired, elevated or reinforced. To eliminate the risk of the dam failures, beside the routine visual inspection also the active monitoring of the dam body and seepage needs to be applied.
The monitoring procedures of the internal dam structure and material composition can be divided into invasive and non-invasive techniques. The invasive methods, such as boreholes, new sensors installations or extensive sampling are usually disqualified in the case of the historical dams. Therefore, the non-invasive geophysical techniques have been widely used recently. The modern geophysical surveys, especially combination of different methods, are becoming fast and cheap option for the subsurface inspection [
10,
11]. The suggested techniques are electrical resistivity tomography (ERT) [
12,
13,
14,
15], ground penetrating radar (GPR) [
16], electromagnetic methods [
17] or rarely also seismic surveys [
18]. Most methods were originally designed for prospecting of deep soil horizons or even geological formations. GPR is an appropriate device for the shallow soil profile monitoring, the ERT can be also used for the shallow surveys if the electrodes spacing is relatively fine [
19,
20].
In our study, we utilize combination of three geophysical techniques: ERT, GPR and dipole electromagnetic conductivity meter (CMD) to observe internal structure of a recently reconstructed historical earth-dam.
The main research objectives are:
observe the earth-dam foundation position and assess its uniformity
distinguish the zones with original material of the dam and newly added material during reconstruction
observe the cone of water depression
check, whether the survey will identify the position of the outlet
compare the outcomes of the three geophysical methods, to find its limitations and to propose a synergic evaluation procedure
2. Materials and Methods
The study to observe the inner structure and the homogeneity of the earth dam was done by means of combination of the electrical resistivity tomography, electromagnetic conductivity measurement and ground penetrating radar.
2.1. Study Site
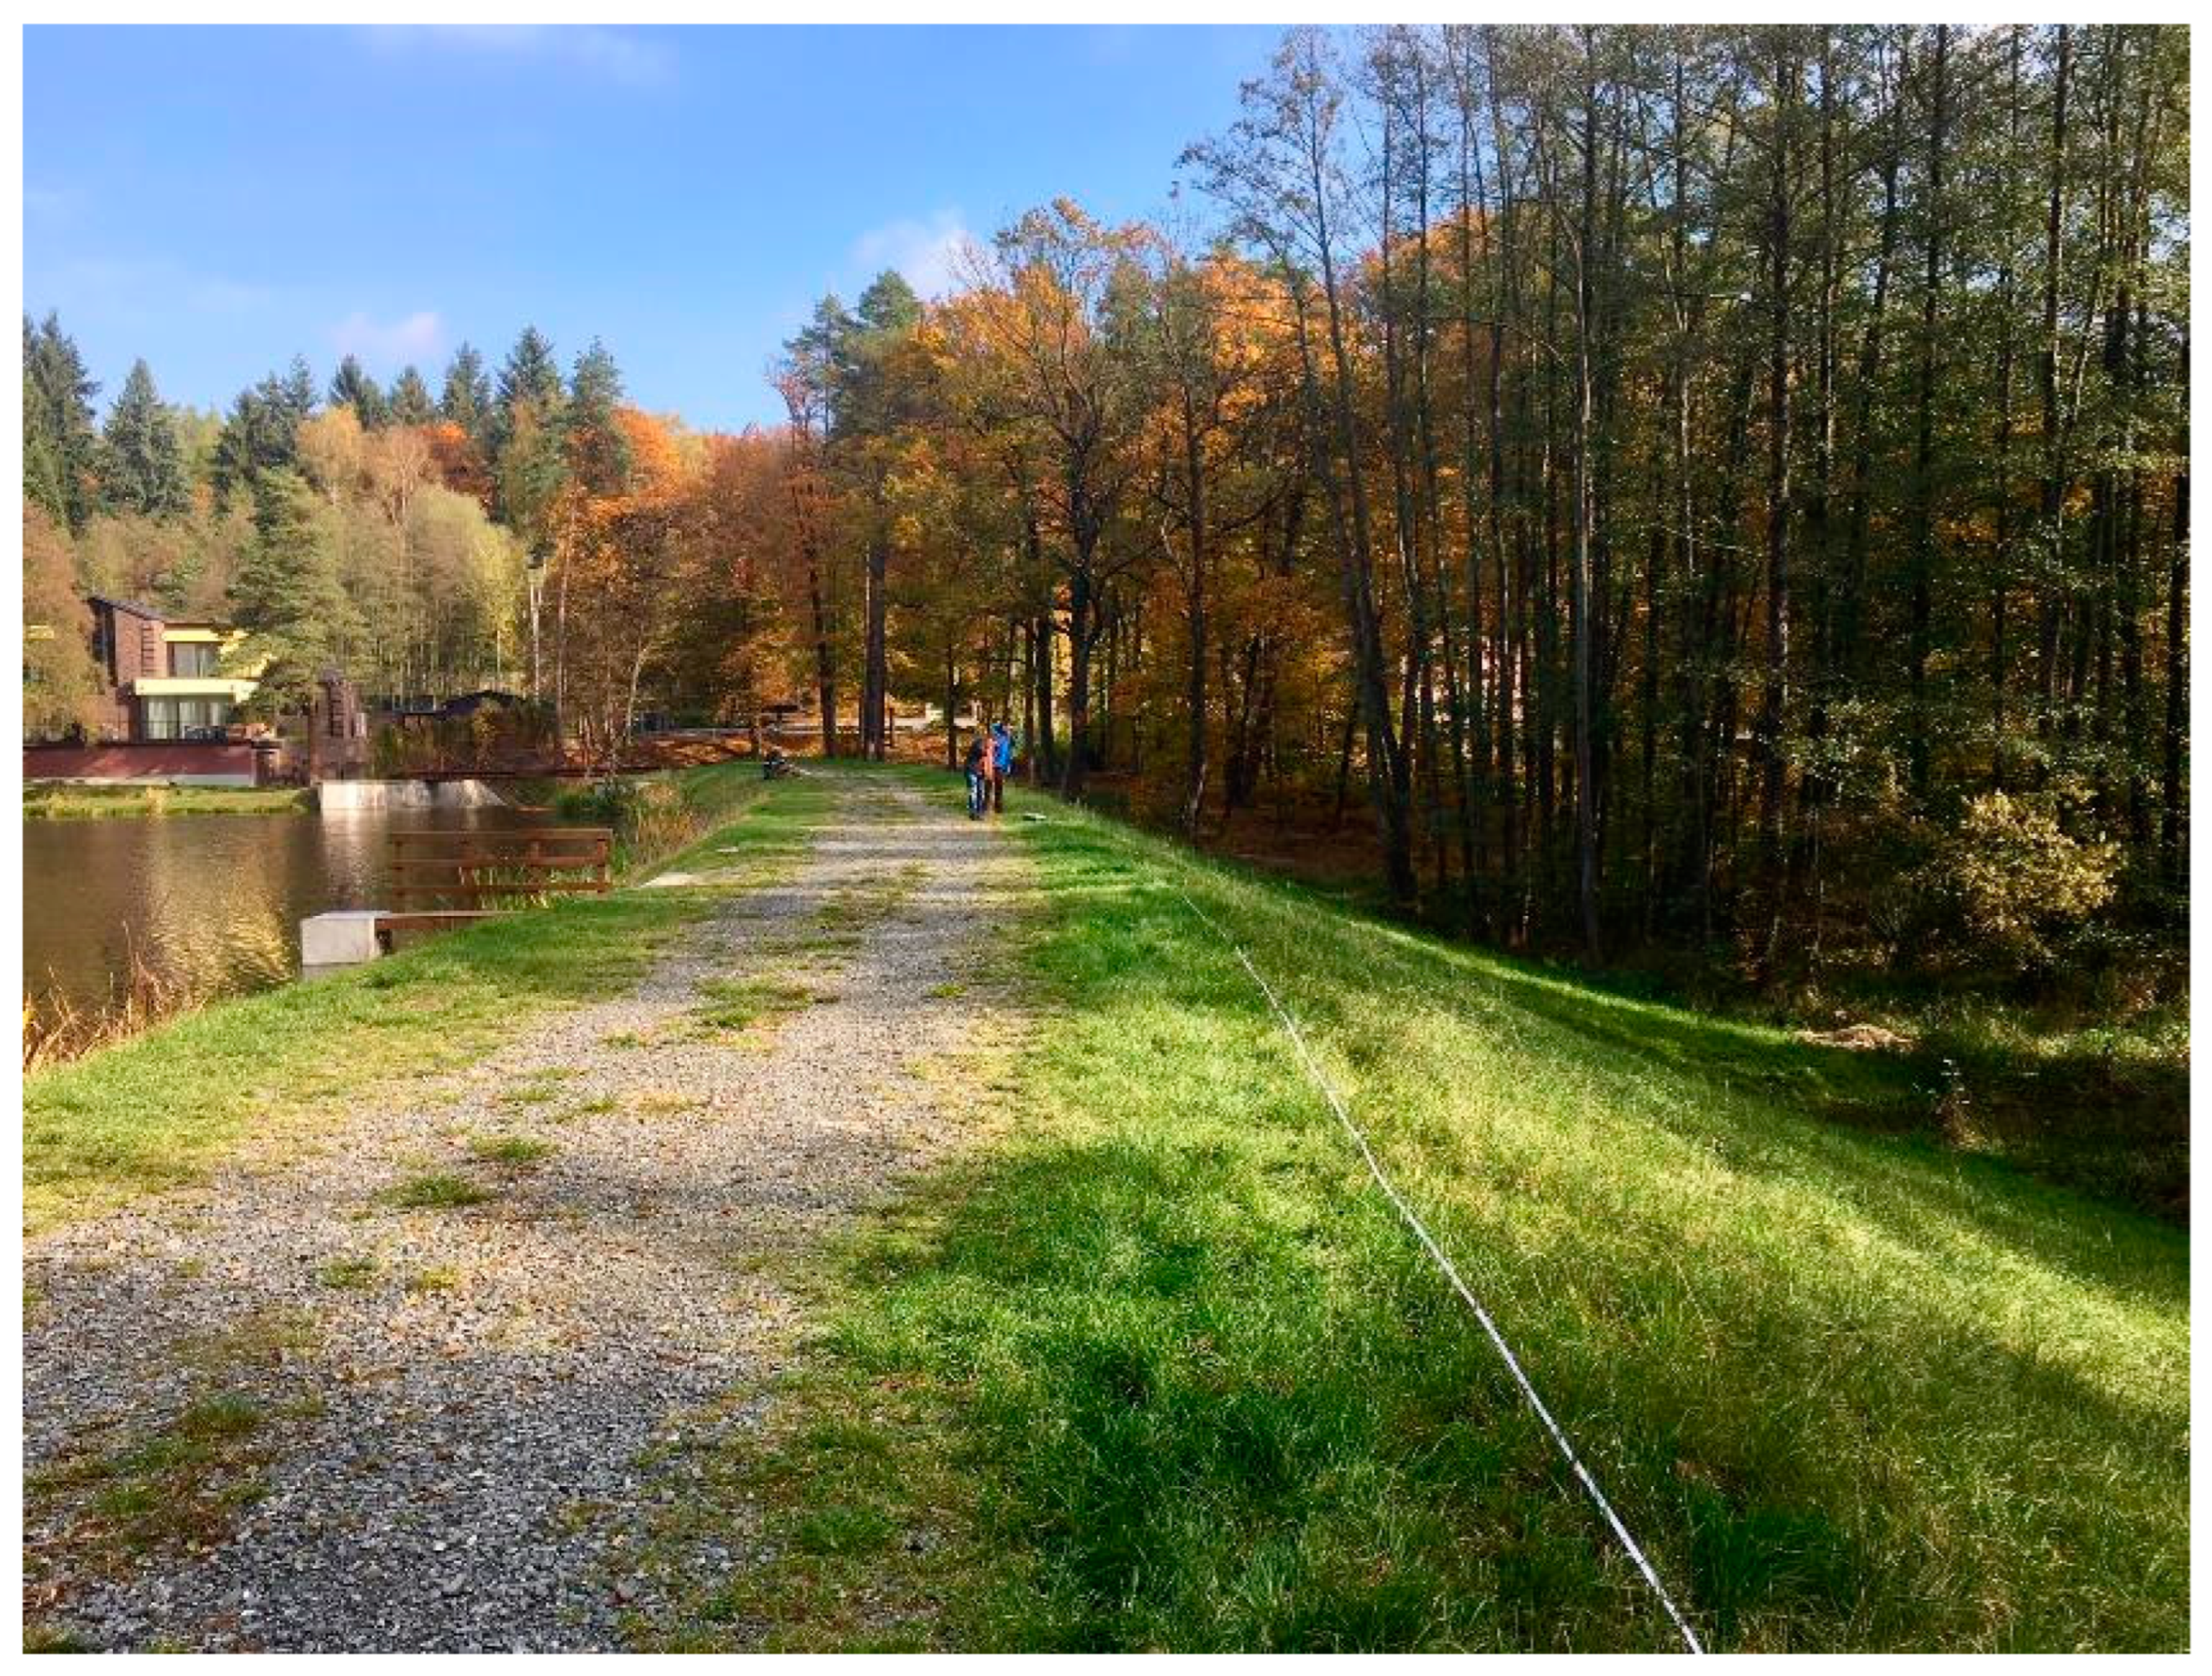
Geophysical monitoring took place on a homogeneous earth-filled dam of a historical fishpond Jan (constructed in the 15th century), located 27 km western of Prague in central Bohemia, Czech Republic. The length of the dam is 155 m, the highest depth at the outlet is 3.57 m. Trapezoidal cross-section is 4 m wide at the top; the upstream side inclination is 1:2.5, downstream side 1:3.
The fishpond was excessively silted during floods in 2012, the owner was also concerned about the dam safety and initiated reservoir desiltation and a dam reconstruction project. The dam went through reconstruction in 2013. Prior to the reconstruction the crest width was 1.5 to 2.0 m. In 2013 the crest was widened to 4.0 m, the downstream slope was enlarged and the inclination reduced to 1:3. Soil sediment, deposited in the reservoir during previous years, was used for the dam enlargement. The sediment was dumped over a 0.5 m thick layer of gravel (fraction 0–32 mm) which functions as the binding and draining material between old and new materials to prevent shallow topsoil sliding. At the same time the reservoir outlet with diameter of 0.5 m and the spillway were completely renovated. The technical objects were newly made of the reinforced concrete, steel and granite stone. The actual state of the earth-dam is on
Figure 1.
The monitoring was done within few days in autumn 2016 under very wet conditions, when the reservoir was full. No rainfall nor significant temperature changes were recorded in between different surveys. High soil water content allowed to install the electrodes for the ERT survey easily, the device established very good electrical contact with the soil. On the other hand, the potential seepage could be hardly detected due to the nearly saturated dam.
2.2. Geophysical Techniques
Electrical resistivity tomography survey was done with an ARES device (GF Instruments, Czech Republic). Multi-electrode cables were used to measure the apparent electrical resistivity pattern. For all the measurements the passive multi-electrode cables connected to the multiplexor were used. We surveyed the subsurface with Wenner-Schlumberger array, which is appropriate for the observation of the shallow structures. To obtain electrical resistivity, the apparent values need to be inverted. RES2DInv software (Geotomo), with the option of standard Gauss-Newton optimization method, was used for the numerical inversion. Before inversion the data with abnormal resistivity values were filtered out. The inversion result was always reached within 3 to 5 iterations; the RMS error was below 2%.
Two perpendicular profiles were measured:
- (i)
Longitudinal profile was placed on the dam’s crest, closer to the downstream side. We had to omit the center of the crest as it was complicated to install the steel electrodes into the gravel road. The length of the profile was 118 m. The passive multi-electrode cable with 96 electrodes was used, the span between the electrodes was 1 m. We surveyed the longitudinal profile in three steps, each 55 m long. Second and third sections overlaid the previous one and was shifted by 23 m. The pathway of the ERT profile is visible on
Figure 1.
- (ii)
Transverse profile originated on the upstream side just above the water level in the reservoir. The profile was perpendicular to the dam orientation, led over the dam’s crest and finished 1 m behind the foot of the downstream slope. The total length was 18 m, the survey was made with the passive multi-electrode cable with the electrodes span of 0.2 m.
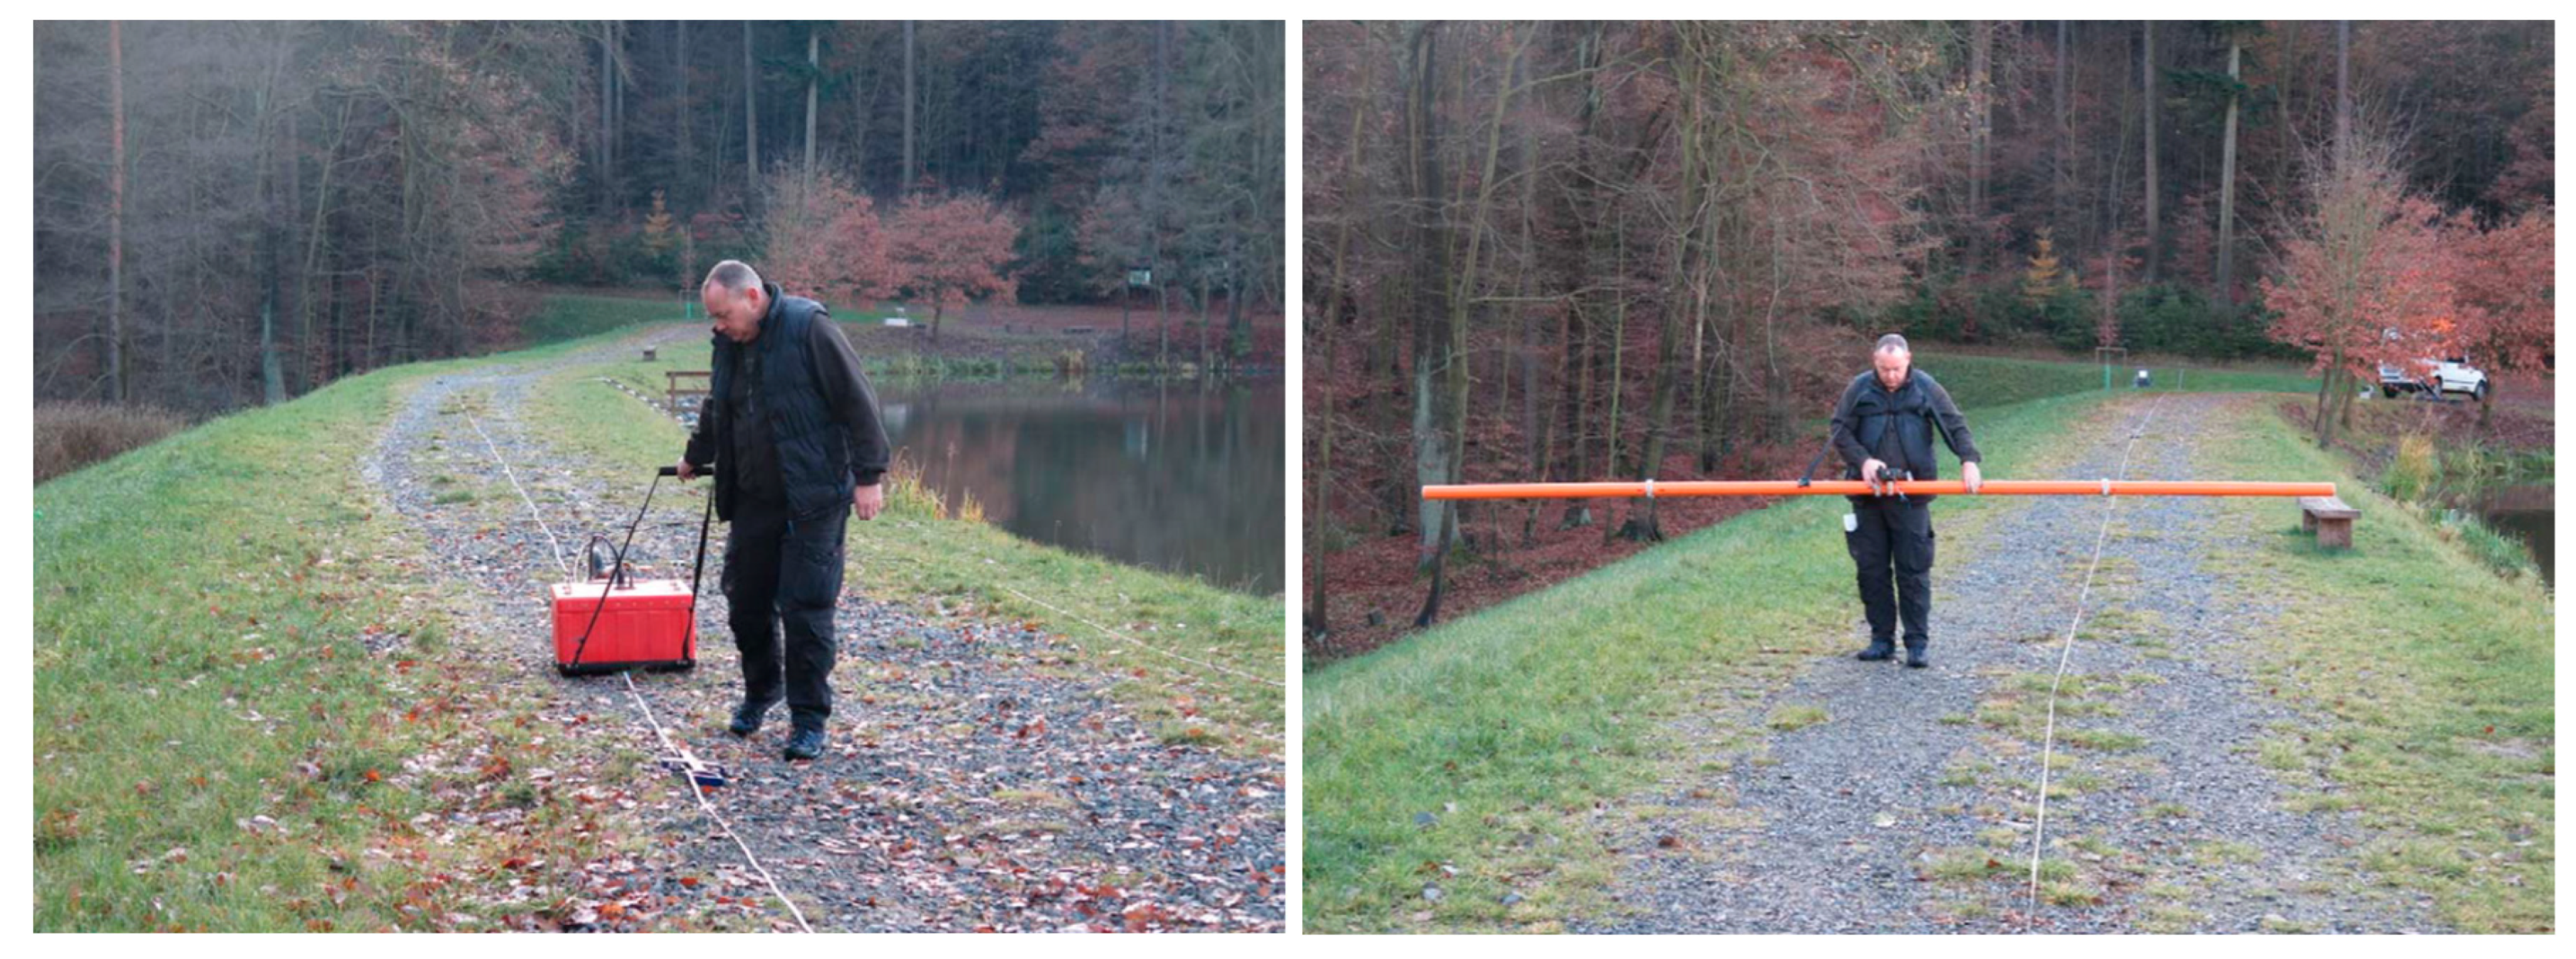
The GPR and CMD surveys were done in the identical line as the longitudinal ERT profile (
Figure 2). The GPR measurement was performed with use of the SIR-20 radar (GSSI, USA) with 200 MHz antenna system. The dipole electromagnetic profiling (CMD) was done with CMD–Explorer (GF Instruments, Czech Republic). The measurement along the profile were done in 1 cm (GPR) and 1 m (CMD) longitudinal steps. The procedure was repeated with different dipoles distance, which were set to 1.48, 2.28 and 4.49 m, and coil orientation to reach observation depths of 1.1 to 6.7 m.
3. Results
The results of all the geophysical surveys were plotted as the 2D transects representing spatial distribution of the electrical resistivity and electromagnetic reflectivity (
Figure 3,
Figure 4 and
Figure 5).
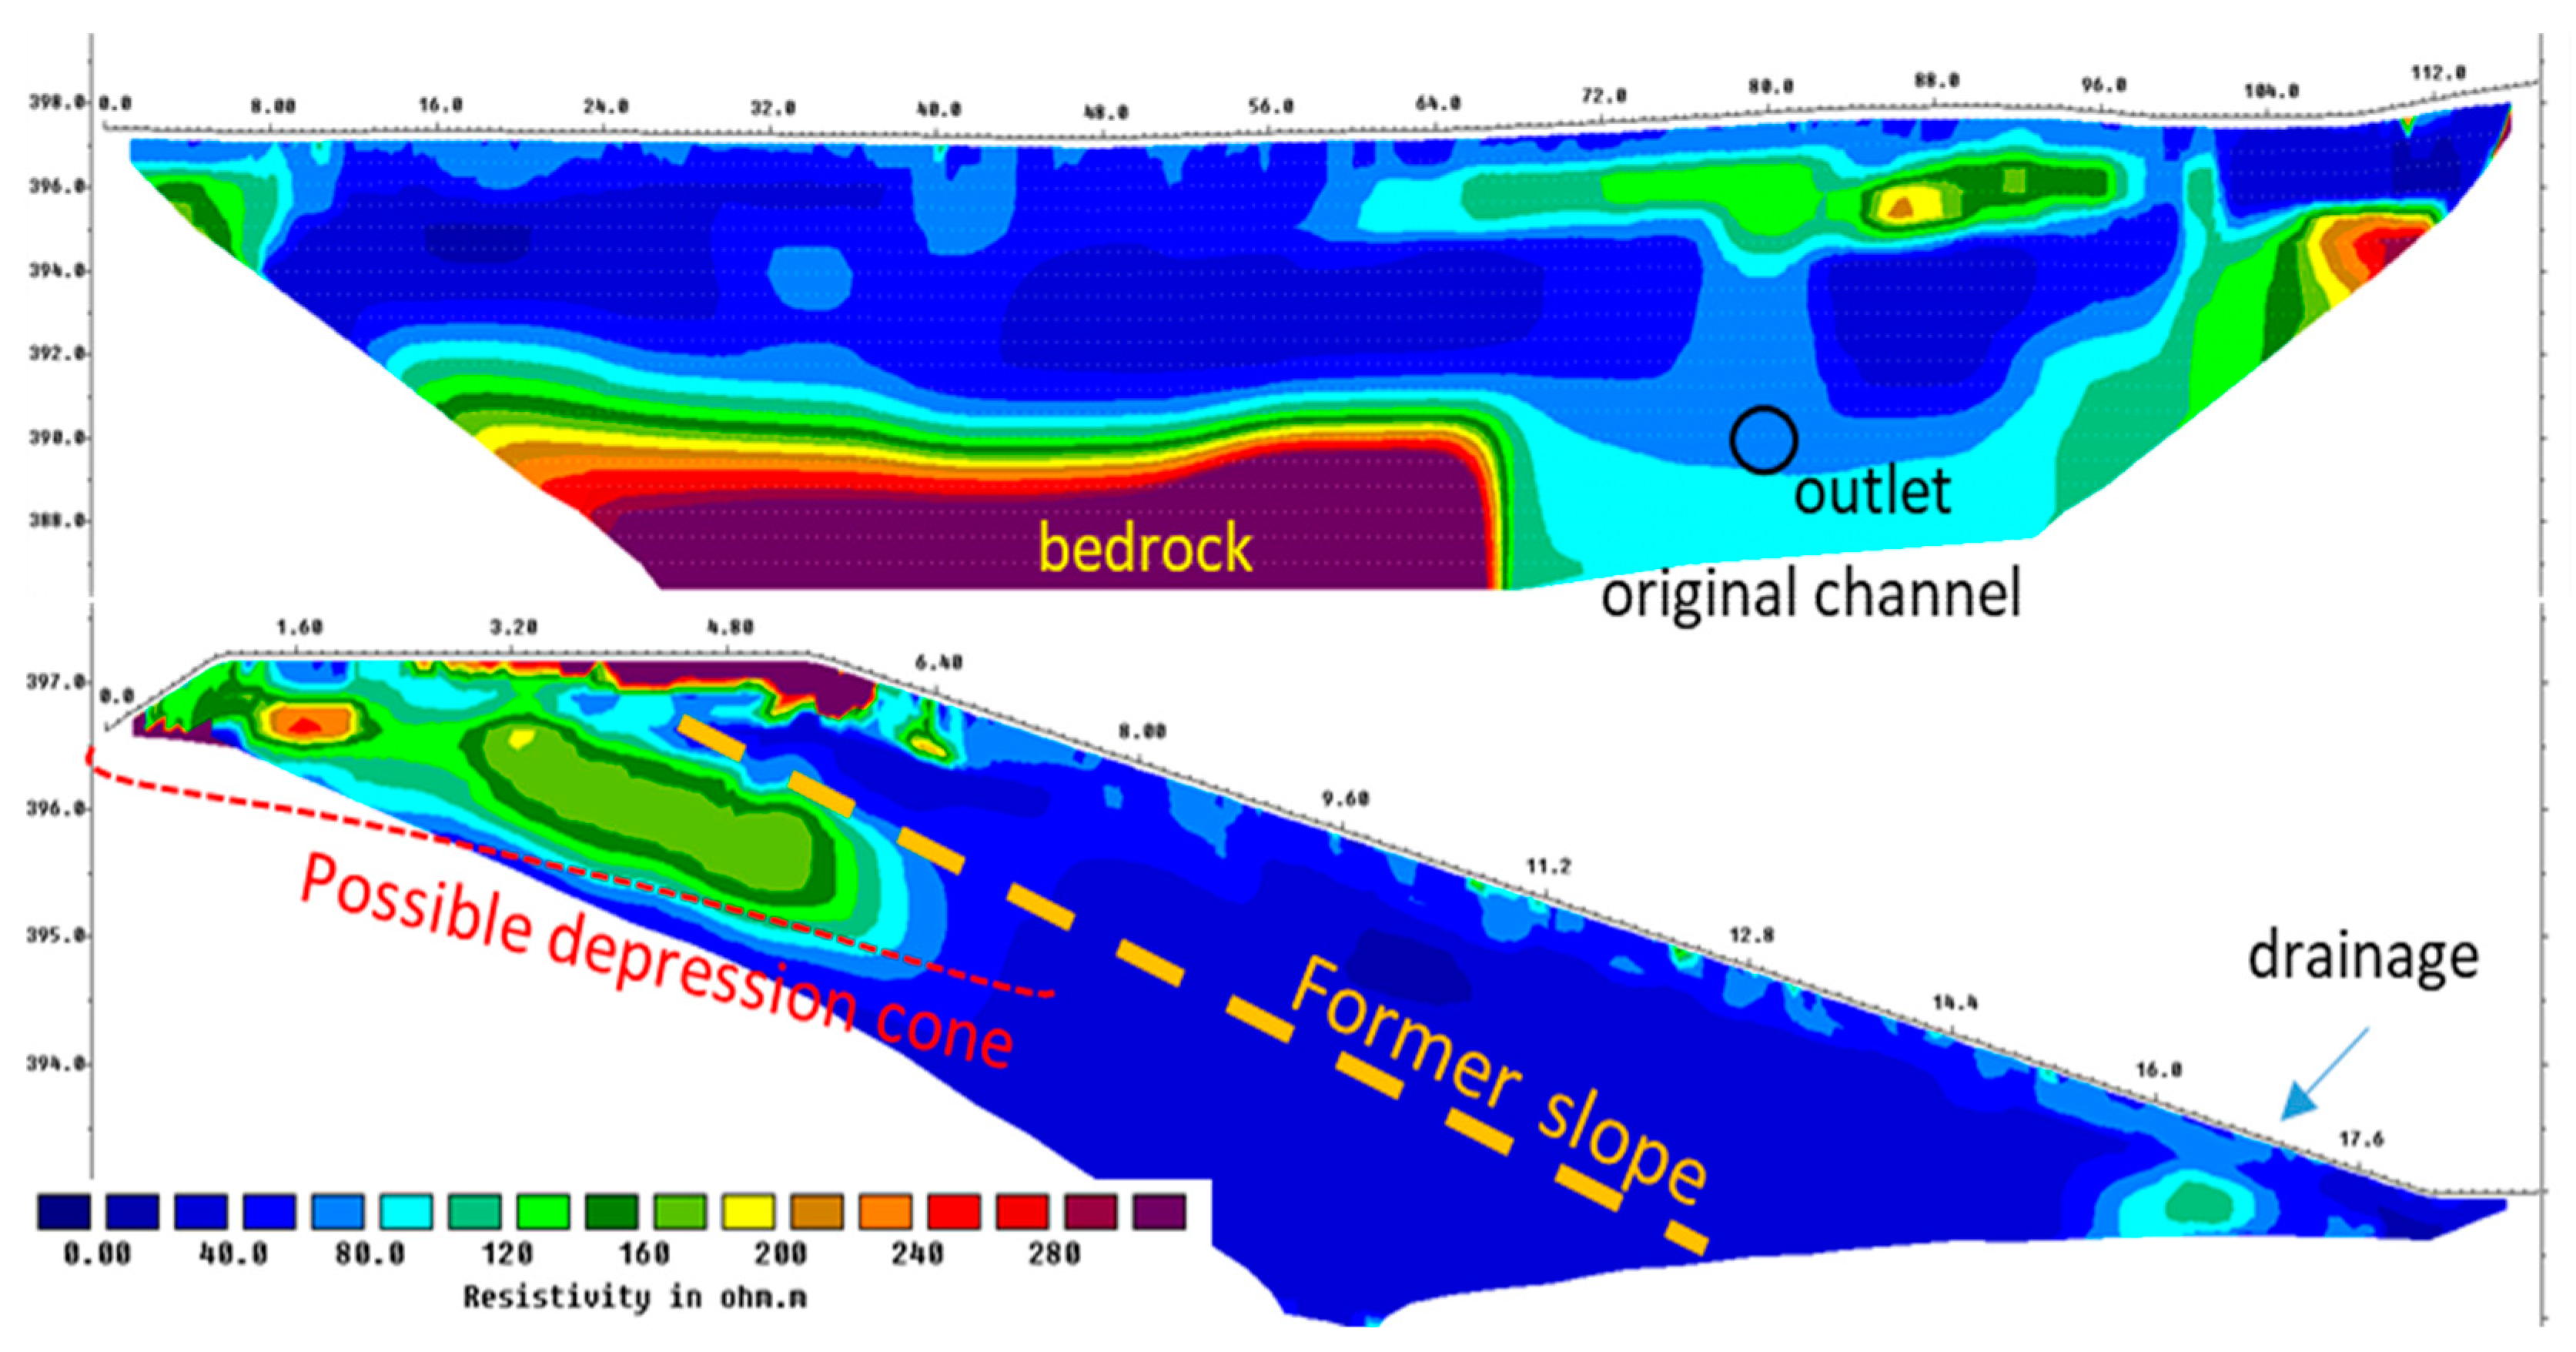
Transversal ERT profile (
Figure 3b) shows high electrical resistivity below the dam’s crest. The reason is twofold. The soil texture at the dam’s top is very different from the remaining material. The surface is covered with less conductive gravel; the gravel can be found also under the surface. Second reason is lower saturation, as the crest is above the water depression cone and is not protected by vegetation. Close to the dam’s crest there is a hint of the historical dam boundary (outlined with the dashed orange line). In the depth of roughly 2 m the newly added sediment and old material are nearly saturated, which results in very similar values of the electrical resistivity.
Longitudinal ERT profile, which reaches a depth of 6 m bellow the dam’s top, shows a clear divide between the dam’s body and the bedrock with high electrical resistivity. The foundation position 4 m below the surface is very regular for the first 70 m. Then is the bedrock replaced by very compacted soil material, possibly in combination with the newly added concrete structures. This area is very probably the location of the original stream channel pathway. The outlet is positioned exactly at this point. The less conductive material above the outlet (green color) is newly added unsaturated soil during to the recent reconstruction of the reservoir outlet.
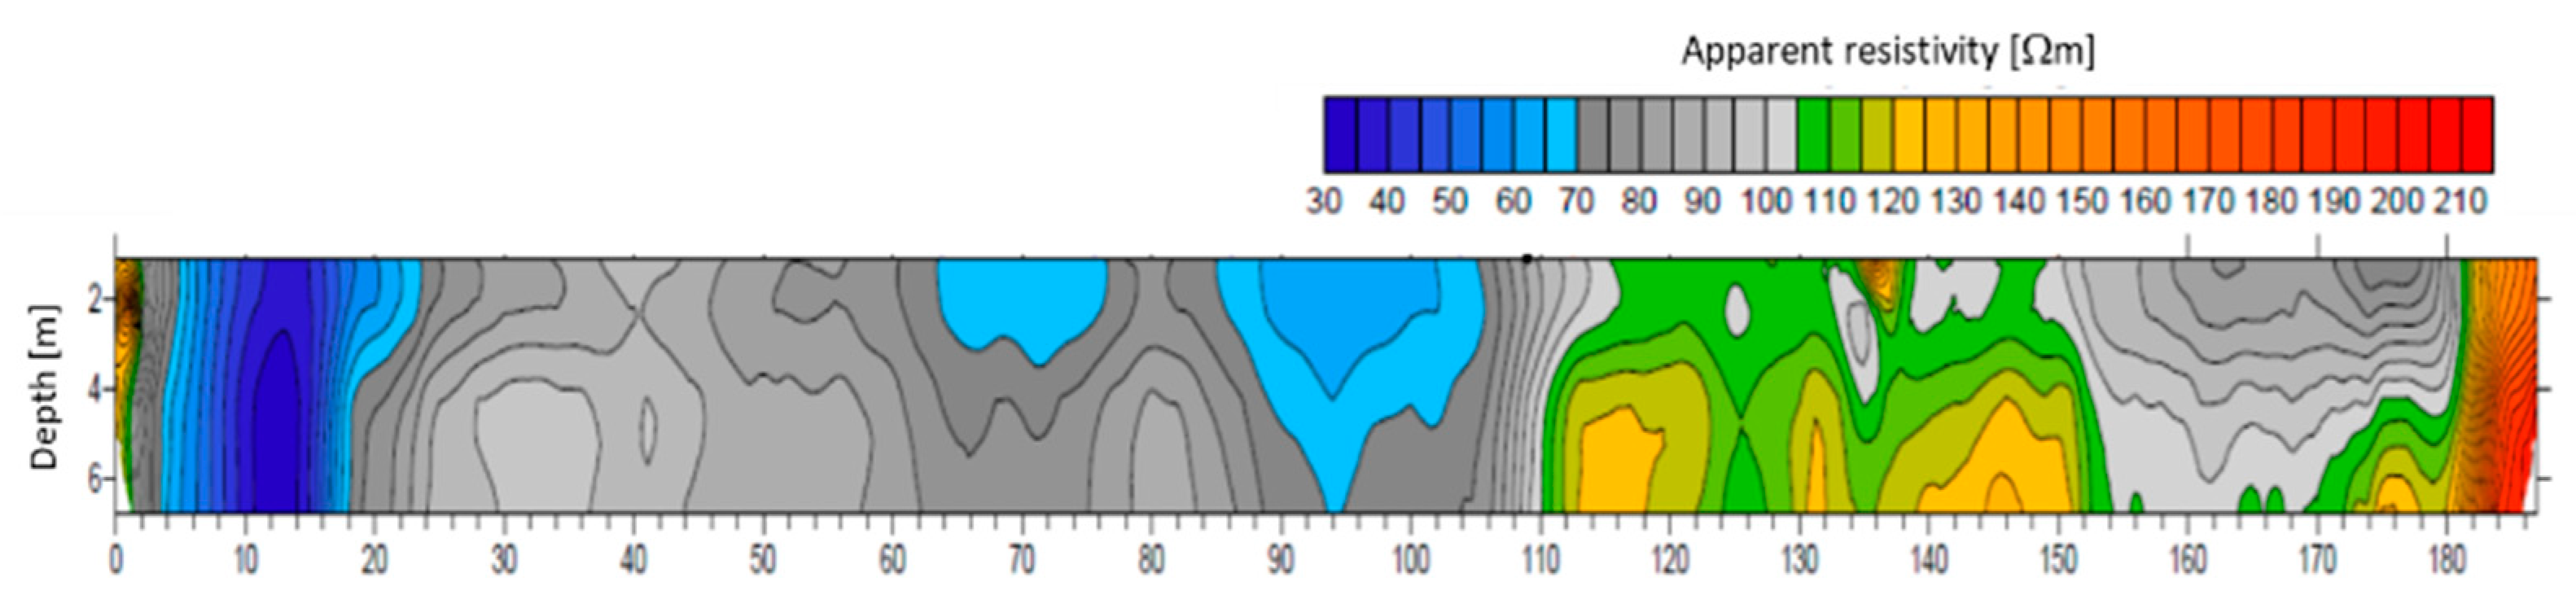
The area of higher resistivity is also visible on the CMD result (
Figure 4), even though the CMD could not observe the saturated zone bellow the unsaturated material. It is important to note that the
Figure 4 represents apparent electrical resistivity and not the spatial distribution of the inverted values, as is the case of the ERT (
Figure 3). The CMD does not provide sufficient resolution in the vertical direction and does not show the bedrock. The shallow profile up to approximately 2 m corresponds well to the ERT results.
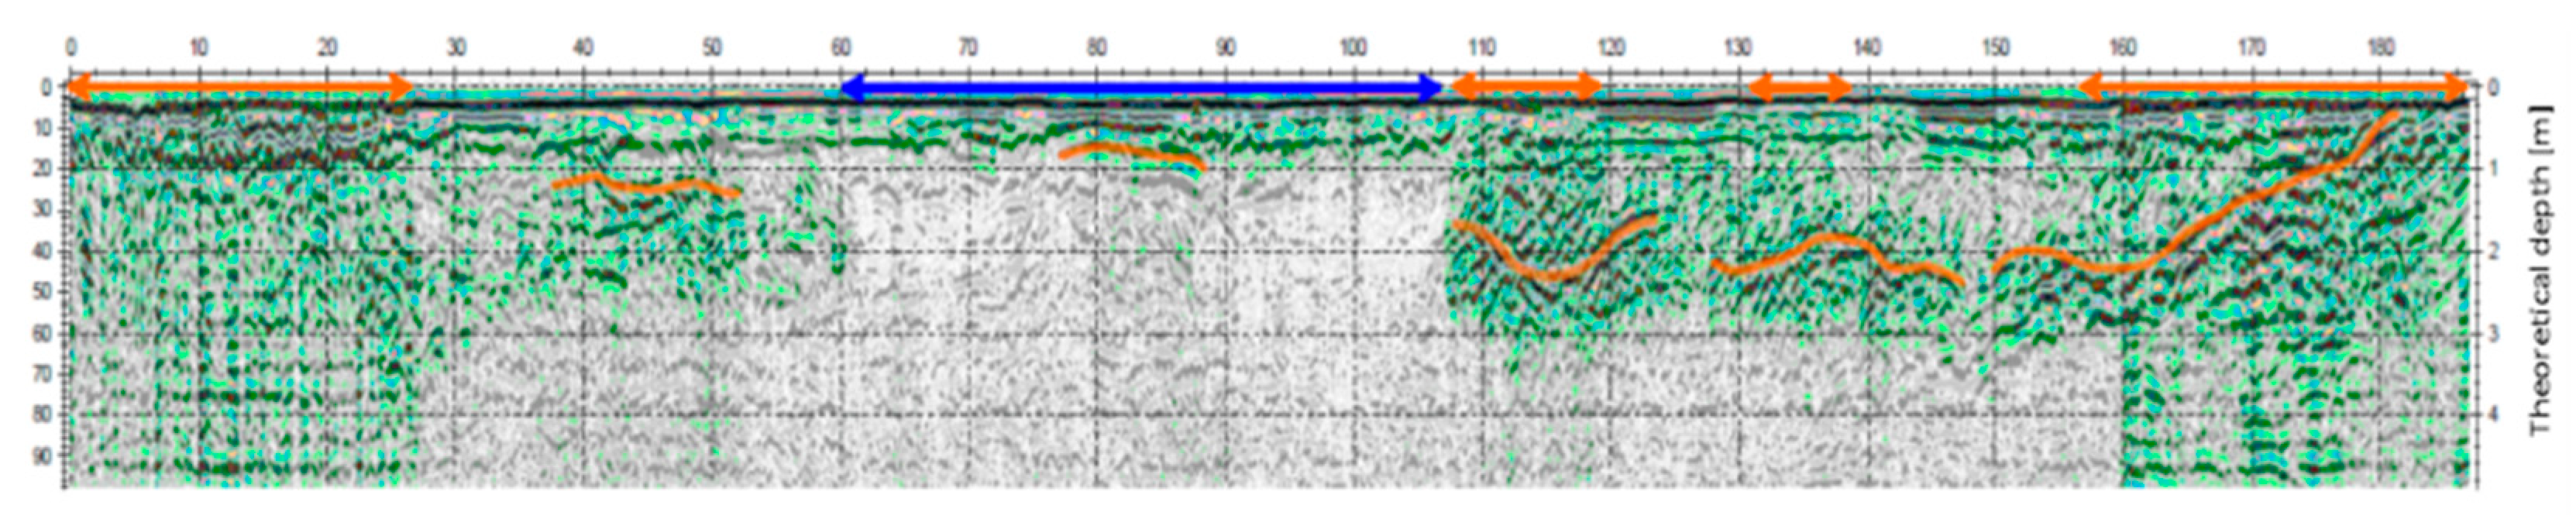
The GPR filtered data (
Figure 5) complement the information from the ERT and CMD techniques. The radar reached theoretical depth of 3 m. Based on the measured reflectivity, the dam body can be divided into several quasi-homogeneous zones with similar characteristics (orange and blue arrows on
Figure 5). The orange lines inside the dam represent areas with a sharp change of the material or water content. These anomalies are attributed to the reconstruction works, the deepest position of the boundary was found above the newly installed outlet.
4. Discussion and Conclusions
The use of simultaneously applied geophysical techniques was tested on the old reconstructed earth dam to evaluate the potential of the methods to observe heterogeneities or seepage within the dam’s inner structure.
Based on the results it is clear, that the general permanent features, such as bedrock or new soil from the reconstruction works, are mostly visible. It would be very problematic to interpret the results, no matter what survey technique, without a prior idea of the dam internal composition. The combination of the different geophysical methods helps to localize especially shallow anomalies. For deep investigation only the ERT, out from the tested methods, is suitable. GPR is valuable for the detection of the near surface anomalies.
As the surveyed dam went through the general reconstruction, one can hardly expect to detect any significant preferential seepage or piping. The geophysical survey did not detect any. Recent studies suggest, that recurrent monitoring of the dams during different soil moisture and water level conditions is needed to observe potential failures [
12,
13,
14,
21], even though such an approach is more demanding.
Not all of the proposed objectives were positively answered. The earth dam foundation was observed well with the ERT, other methods did not penetrate to the sufficient depth. All the methods, and especially the combination of the methods, showed areas with new soil material or boundaries between the historical and new dam section. The ERT reflects also the construction impacts made in vicinity of the reservoir outlet. The exact position of the outlet itself is hard to state. The ERT resolution significantly decreases with the depth. Nevertheless, the local variability of the electrical resistivity was detected and the outlet could be approximately positioned.
Cone of water depression could be seen only on the ERT transversal profile, other techniques were not tested. The saturated zone is not clearly visible on the longitudinal transects.
Comparison of the tested survey methods favors ERT, as the other techniques do not reach down to the dam foundation. But the ERT itself without any complementary information provides only qualitative insight on the dam structure. Use of supplementary techniques reduce the uncertainty in the results interpretation considerably.
Author Contributions
D.Z., V.D. and J.K. performed the ERT measurements and the data analysis. J.N. measured the earthdam internal structure with GPR and CMD. D.Z. wrote the paper.
Acknowledgments
The research was funded within a project no. DG16P02M036, Conservation, reparations and monitoring of historical pond dams as our cultural heritage granted by Ministry of Culture of the Czech Republic.
Conflicts of Interest
The authors declare no conflict of interest. The founding sponsors had no role in the design of the study; in the collection, analyses, or interpretation of data; in the writing of the manuscript, and in the decision to publish the results.
References
- Pokorná, A.; Houfková, P.; Novák, J.; Bešta, T.; Kovačiková, L.; Nováková, K.; Zavřel, J.; Starec, P. The oldest Czech fishpond discovered? An interdisciplinary approach to reconstruction of local vegetation in mediaeval Prague suburbs. Hydrobiologia 2014, 730, 191–213. [Google Scholar] [CrossRef]
- Richards, S.; Reddy, K.R. Critical appraisal of piping phenomena in earth dams. Bull. Eng. Geol. Environ. 2007, 66, 381–402. [Google Scholar] [CrossRef]
- Morales-Nápoles, O.; Delgado-Hernández, D.J.; De-León-Escobedo, D.; Arteaga-Arcos, J.C. A continuous Bayesian network for earth dams’ risk assessment: Methodology and quantification. Struct. Infrastruct. Eng. 2014, 10, 589–603. [Google Scholar] [CrossRef]
- Panthulu, V.T.; Krishnaiah, C.; Shirke, J.M. Detection of seepage paths in earth dams using self-potential and electrical resistivity methods. Eng. Geol. 2001, 59, 281–295. [Google Scholar] [CrossRef]
- Singh, V.P.; Scarlatos, P.D. Analysis of Gradual Earth-Dam Failure. J. Hydraul. Eng. 1988, 114, 21–42. [Google Scholar] [CrossRef]
- Lawton, E.C.; Fragaszy, R.J.; Hetherington, M.D. Review of Wetting-Induced Collapse in Compacted Soil. J. Geotech. Eng. 1992, 118, 1376–1394. [Google Scholar] [CrossRef]
- Zhang, L.M.; Xu, Y.; Jia, J.S. Analysis of earth dam failures: A. database approach. Georisk Assess. Manag. Risk Eng. Syst. Geohazards 2009, 3, 184–189. [Google Scholar] [CrossRef]
- Omofunmi, O.E.; Kolo, J.G.; Oladipo, A.S.; Diabana, P.D.; Ojo, A.S.; Li, D.; de Pilli, T. A Review on Effects and Control of Seepage through Earth-fill Dam. Curr. J. Appl. Sci. Technol. Br. J. Appl. Sci. Technol. China 2017, 22, 1–11. [Google Scholar] [CrossRef]
- Zumr, D.; Císlerová, M. Soil moisture dynamics in levees during flood events-variably saturated approach. J. Hydrol. Hydromech. 2010, 58, 64–72. [Google Scholar] [CrossRef]
- Beneš, V.; Tesař, M.; Boukalová, Z. Repeated geophysical measurement—The basic principle of the GMS methodology used to inspect the condition of flood control dikes. Trans. Ecol. Environ. 2011, 146, 105–115. [Google Scholar]
- Perri, M.T.; Boaga, J.; Bersan, S.; Cassiani, G.; Cola, S.; Deiana, R.; Simonini, P.; Patti, S. River embankment characterization: The joint use of geophysical and geotechnical techniques. J. Appl. Geophys. 2014, 110, 5–22. [Google Scholar] [CrossRef]
- Sentenac, P.; Benes, V.; Budinsky, V.; Keenan, H.; Baron, R. Post flooding damage assessment of earth dams and historical reservoirs using non-invasive geophysical techniques. J. Appl. Geophys. 2017, 146, 138–148. [Google Scholar] [CrossRef]
- Lin, C.-P.; Hung, Y.-C.; Wu, P.-L.; Yu, Z.-H. Performance of 2-D ERT in Investigation of Abnormal Seepage: A Case Study at the Hsin-Shan Earth Dam in Taiwan. J. Environ. Eng. Geophys. 2014, 19, 101–112. [Google Scholar] [CrossRef]
- Arosio, D.; Munda, S.; Tresoldi, G.; Papini, M.; Longoni, L.; Zanzi, L. A customized resistivity system for monitoring saturation and seepage in earthen levees: Installation and validation. Open Geosci. 2017, 9, 457–467. [Google Scholar] [CrossRef]
- Cho, I.-K.; Ha, I.-S.; Kim, K.-S.; Ahn, H.-Y.; Lee, S.; Kang, H.-J. 3D effects on 2D resistivity monitoring in earth-fill dams. Near Surf. Geophys. 2014, 12, 73–81. [Google Scholar] [CrossRef]
- Kim, J.-H.; Yi, M.-J.; Song, Y.; Seol, S.J.; Kim, K.-S. Application of Geophysical Methods to the Safety Analysis of an Earth Dam. J. Environ. Eng. Geophys. 2007, 12, 221–235. [Google Scholar] [CrossRef]
- Sungkono, A.; Husein, H.; Prasetyo, A.S.; Bahri, F.A.; Santos, M.; Santosa, B.J. The VLF-EM imaging of potential collapse on the LUSI embankment. J. Appl. Geophys. 2014, 109, 218–232. [Google Scholar] [CrossRef]
- Karl, L.; Fechner, T.; Schevenels, M.; François, S.; Degrande, G. Geotechnical characterization of a river dyke by surface waves surface waves. Near Surf. Geophys. 2011, 9, 515–527. [Google Scholar] [CrossRef]
- Jeřábek, J.; Zumr, D.; Dostál, T. Identifying the plough pan position on cultivated soils by measurements of electrical resistivity and penetration resistance. Soil Till. Res. 2017, 174, 231–240. [Google Scholar] [CrossRef]
- Zumr, D.; Snehota, M.; Cislerova, M. Numerical simulation of tension infiltration experiment monitored by 3D ERT. In Proceedings of the 5th Asia-Pacific Conference on Unsaturated Soils, Pattaya, Thailand, 14 November 2011; pp. 1–6. [Google Scholar]
- Song, S.-H.; Song, Y.; Kwon, B.-D. Application of hydrogeological and geophysical methods to delineate leakage pathways in an earth fill dam. Explor. Geophys. 2005, 36, 92–96. [Google Scholar] [CrossRef]
| Publisher’s Note: MDPI stays neutral with regard to jurisdictional claims in published maps and institutional affiliations. |
© 2018 by the authors. Licensee MDPI, Basel, Switzerland. This article is an open access article distributed under the terms and conditions of the Creative Commons Attribution (CC BY) license (https://creativecommons.org/licenses/by/4.0/).


