Proceeding Paper

Stochastic Generation of Low Stream Flow Data of Iokastis Stream, Kavala City, NE Greece †

by
Thomas Papalaskaris
1,* and
Theologos Panagiotidis
2
1
Department of Civil Engineering, Democritus University of Thrace, Kimmeria Campus, 67100 Xanthi, Greece
2
Department of Mechanical Engineering, Eastern Macedonia & Thrace Institute of Technology, 65404 Kavala, Greece
*
Author to whom correspondence should be addressed.
Presented at the 3rd EWaS International Conference on “Insights on the Water-Energy-Food Nexus”, Lefkada Island, Greece, 27–30 June 2018.
Proceedings 2018, 2(11), 579; https://doi.org/10.3390/proceedings2110579
Published: 29 August 2018
(This article belongs to the Proceedings of EWaS3 2018)

Abstract

:
Only a few scientific research studies, especially dealing with extremely low flow conditions, have been compiled so far, in Greece. The present study, aiming to contribute in this specific area of hydrologic investigation, generates synthetic low stream flow time series of an entire calendar year considering the stream flow data recorded during a center interval period of the year 2015. We examined the goodness of fit tests of eleven theoretical probability distributions to daily low stream flow data acquired at a certain location of the absolutely channelized urban stream which crosses the roads junction formed by Iokastis road an Chrisostomou Smirnis road, Agios Loukas residential area, Kavala city, NE Greece, using a 3-inches conventional portable Parshall flume and calculated the corresponding probability distributions parameters. The Kolmogorov-Smirnov, Anderson-Darling and Chi-Squared, GOF tests were employed to show how well the probability distributions fitted the recorded data and the results were demonstrated through interactive tables providing us the ability to effectively decide which model best fits the observed data. Finally, the observed against the calculated low flow data are plotted, compiling a log-log scale chart and calculate statistics featuring the comparison between the recorded and the forecasted low flow data.

1. Introduction

Artificial stream flow time series generation is a means of paramount importance in hydrology and water resources management in order to handle efficiently precarious or doubtful situations, pertinent to a natural watercourse’s flow regime, associated particularly to a short period of stream flow rate data acquisition. The increasing water demands worldwide, caused primarily by the global population increase and exacerbated by the water scarcity due to the climate change, especially in North-Eastern Europe, gives significant prominence to the wise use of the available water resources, showcasing stream flow rate monitoring as a factor of paramount importance with the view to design water storage reservoirs and other water resources management infrastructure works.
Therefore, the necessity to minimize dubiety and ambivalence in estimating the flow regime of a natural watercourse constitutes a challenging task in the sector of hydrology and water resources management. This difficulty can only be adequately worked out employing artificial stream flow time series generation procedures and techniques.
The daily low stream flow rate data was acquired during part of July, August and part of September 2015, until the 12th of September 2015, when unfortunately an extreme flash flood event destroyed the apparatus used,
The eleven specific probability distributions used in this study were the following: (1) Gumbel min (Minimum Extreme Value Type 1) distribution, (2) 3-Parameter Log-Normal distribution, (3) Pearson Type 5 distribution, (4) Pearson Type 6 distribution, (5) Two-Parameter Weibull distribution, (6) Kumaraswamy (4P), (7) Gen. Logistic (2P), (8) Burr (4P), (9) Burr (3P), (10) Wakeby (5P) and (11) Dagum (4P) distributions.

2. Literature Review

Numerous studies and reviews have been carried out in the field of low flows, handling different subjects such as the fit of theoretical probability distribution functions on observed low stream flow rate data, surface runoff and groundwater exchange relationships, watershed drought management, hydrological low-flow and drought indices estimation, watershed water budget and balance compilation, evapo-transpiration estimation, daily stream flow variation computations, in-stream environmental stream flows calculation etc. [1,2,3,4,5,6,7,8,9,10,11,12,13,14,15,16].

3. Materials and Methods
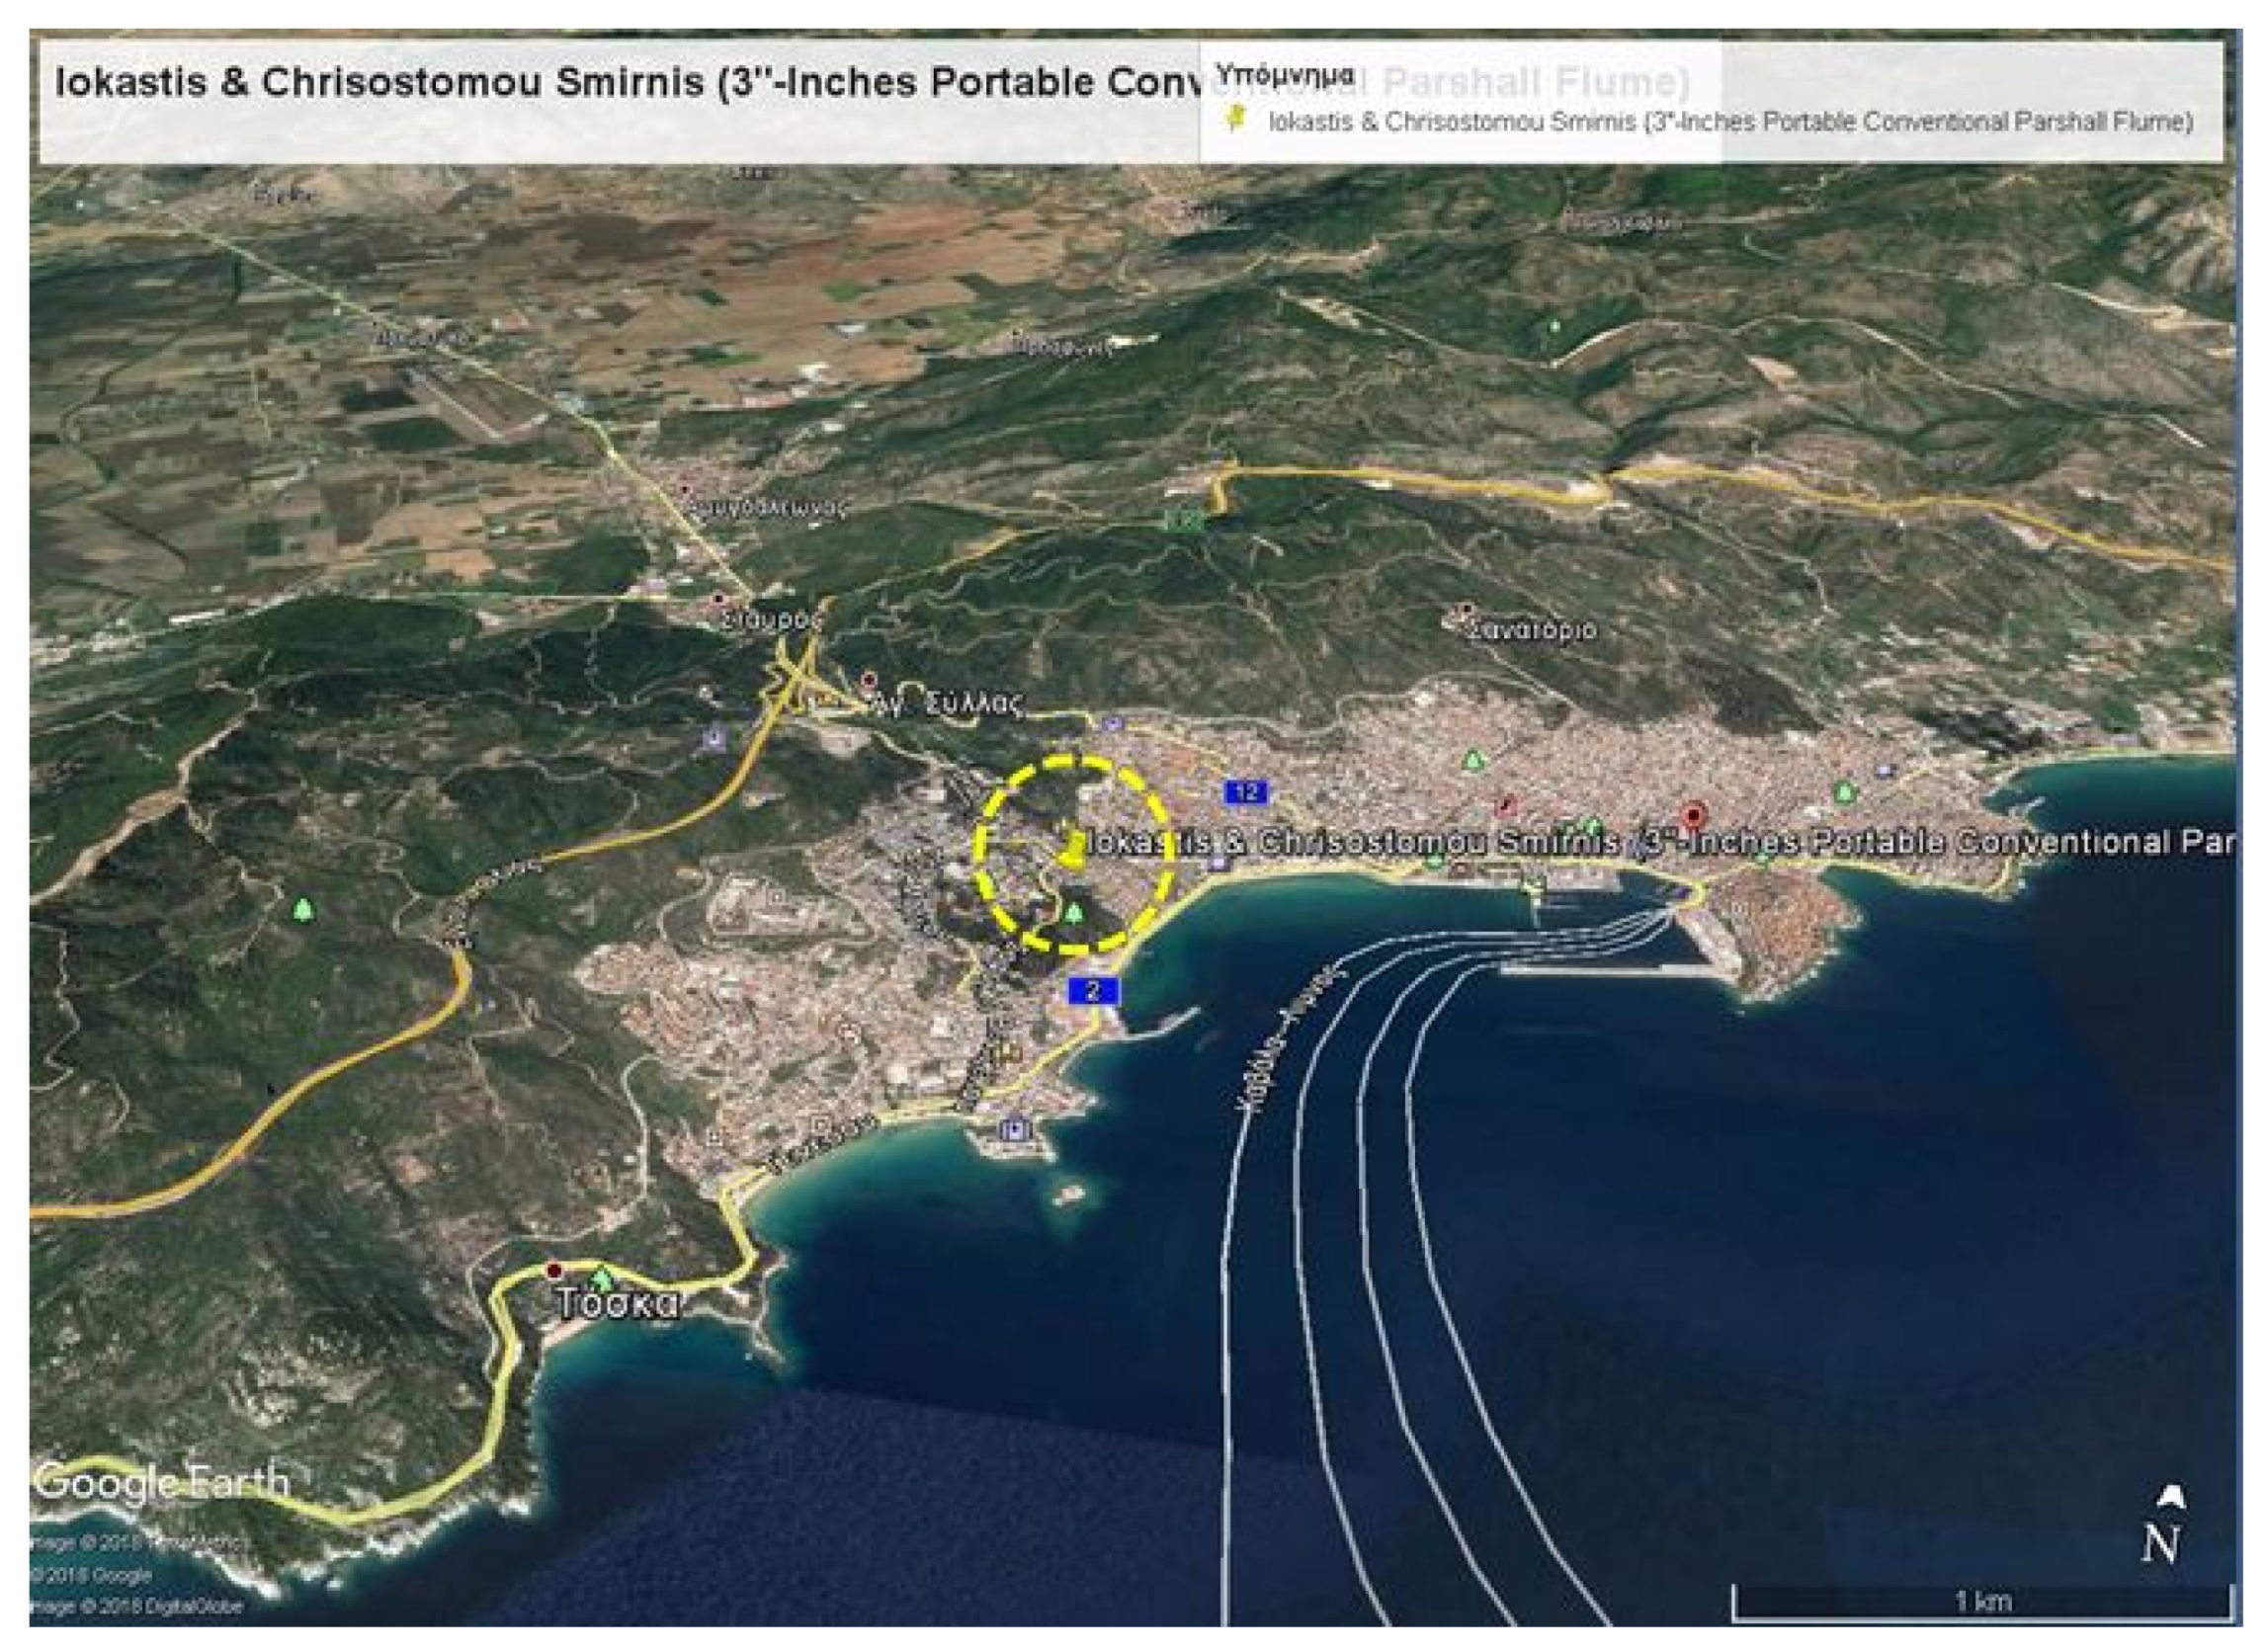
3.1. Study Area

The stream flow rate gauging station, which was established nearby the junction formed by Iokastis and Chrisostomou Smirnis roads, Kavala city, Greece, a coastal city, located at the north of the Aegean Sea, across the Thassos Island. It is surrounded by the Lekani mountain series branches to the North and East and the Paggaion Mountain ramifications to the West, (established in the proximity of the city urban web center and at the north exit of the city as well). More precisely, it is located at the specific co-ordinates 40°55′57.70″ N and 24°23′19.74″ E, Kavala city area, and operated continuously, spanning a time period from 25 July 2015 to 11 September 2015, as illustrated in Figure 1.

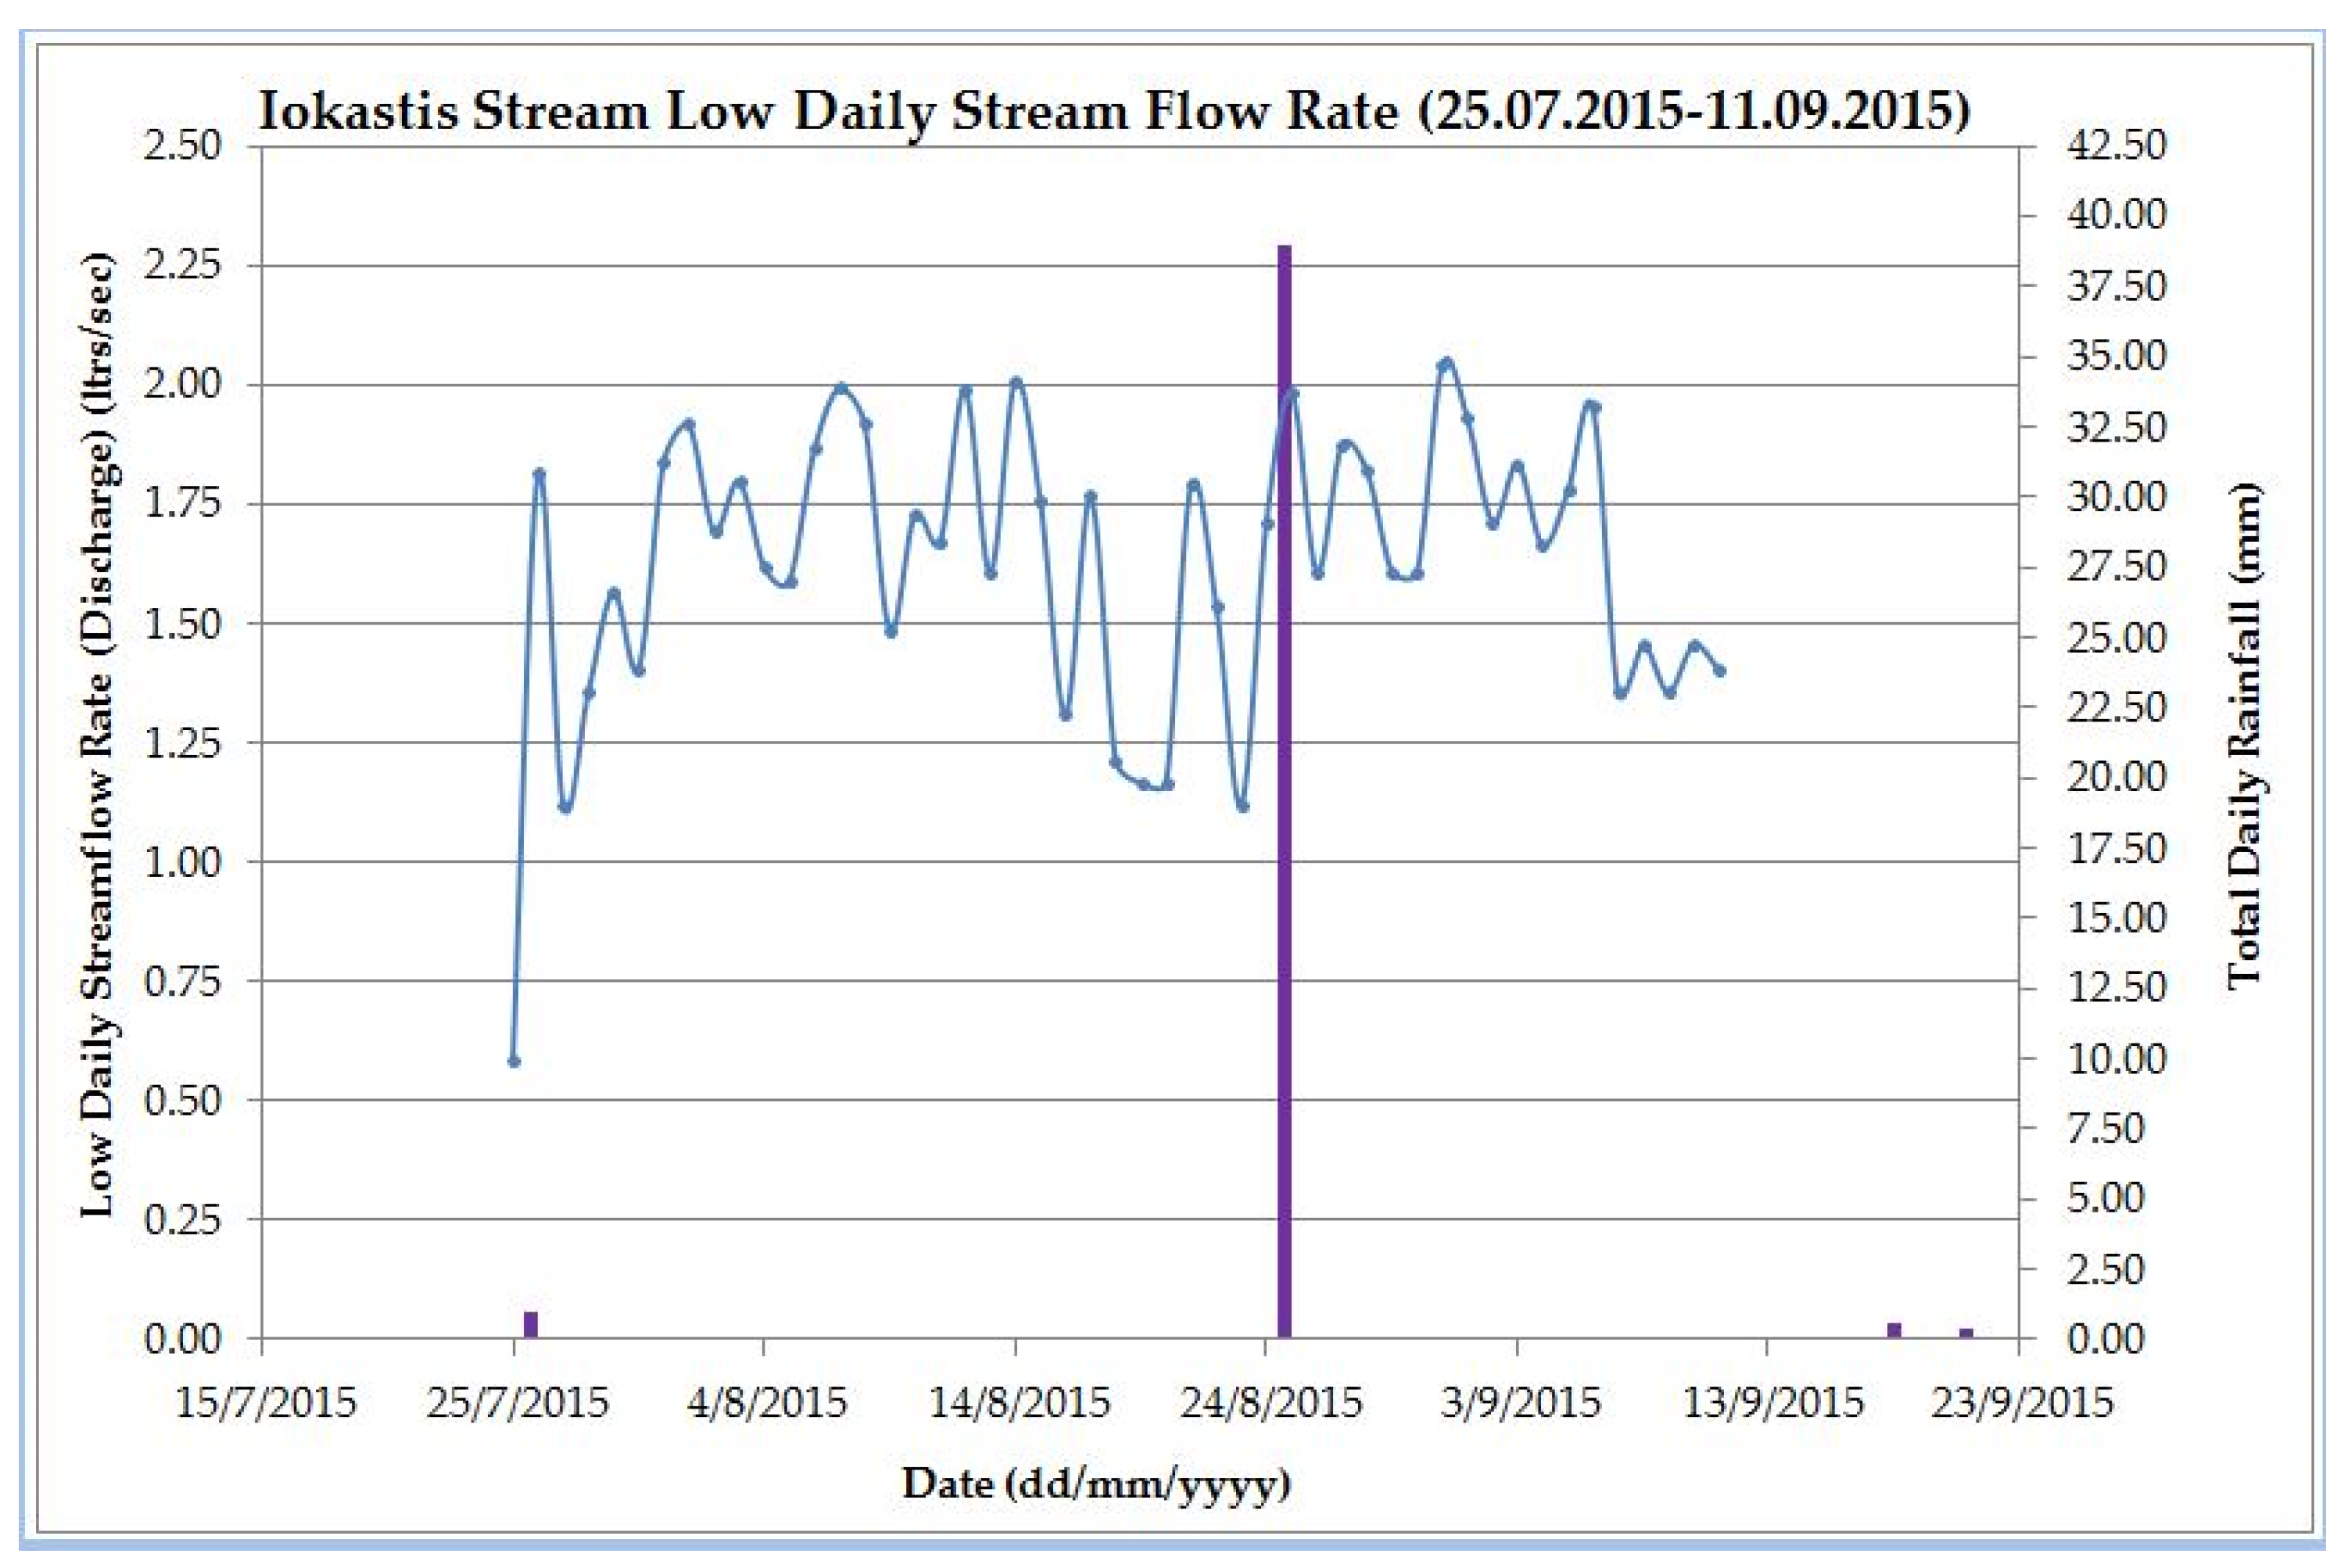
3.2. Sample Collection and Data Used in This Study

A total number of 49 individual stream flow rate (discharge) measurements were performed within 49 consecutive days, between 25 July 2015 to 11 September 2015, during which a thorough presentation of the methodology and procedure followed up was analytically supplied, whereas, all of them were recorded and uploaded on the first author’s personal Youtube platform web-site, namely, “Thomas Papalaskaris”. The first stream flow rate (discharge) measurement (25 July 2015) lasted 50′:13″, and the last one (11 September 2015), respectively, 20′:48″ sharp.
In accordance with the recorded observations of the only available private meteorological station located at Dexameni area, Kavala city, Greece, Kavala city received total monthly rainfalls as following: 61.40 mm during July 2015, 40.00 mm during August 2015, 96.80 mm and during September 2015 (198.20 mm in total respecting the three months) respectively. The recorded stream flow rate (discharge) (denoted by the thin light blue-colored continuous line) and the observed rainfall (denoted by the dark blue-colored vertical bars) during the time period 25 July 2015 and 11 September 2015 are simultaneously illustrated within Figure 2.

3.3. Sample Analysis and Checking the Goodness of Fit

Mathwave EasyFit and StatAssist software (version 5.4) packages were employed to estimate the best probability distribution (based on the Anderson-Darling, Chi-Squared and Kolmogorov-Smirnov goodness-of-fit criteria tests), together with the associated parameters, fitting the daily lowest stream flow data, as well as the goodness-of-fit of all the other candidate probability distributions.
Moreover, after having calculated the parameters of the examined probability distributions, we generated, (employing Mersenne Twister random number generator), a sequence of high quality random numbers for each individual candidate probability distribution with the same parameter values to the original calculated ones. The Kolmogorov-Smirnov test (KS-test) tries to determine if two datasets differ significantly, whilst, it has the advantage of making no assumption about the distribution of the data (technically speaking it is non-parametric and distribution free). MS Excel software is employed in order to plot the real observed (recorded) against the artificial (generated, forecasted) low stream flow rate (discharge) data. The calculation of eleven examined candidate probability distribution estimates are of paramount importance as they enable us, by assigning different specified scores, according to their goodness of fit performance, to evaluate which is the most appropriate one simulating the recorded stream flow rate values. The goodness of fit tests are performed in order to evaluate which distribution fits to the low stream flow rate (discharge) data series in the best possible way. The values of Anderson-Darling statistics, Chi-square (χ2), Kolmogorov-Smirnov (D) respectively are computed and illustrated within Τable 1, for the entire low stream flow rate (discharge) time series data. It should be underlined that, employing an improvised scoring system, the superscript number makes reference to the order ranking of the probability distribution which best fits the low-flow time series data, ranging from 1 (the best one) to 3 (the worst one). Further, the ranking score values of numbers 3, 2, and 1, are, inversely assigned to the already given, (as above mentioned followed procedure), ranking scores 1, 2, and 3 correspondingly, in order to assess the highest final goodness of fit score obtained for each candidate individual probability distribution, determining, as an outcome, the best one which best fits the observed low stream flow rate (discharge) time series data.
It can be identified from Table 1, that only Dagum (4P), Gen. Logistic (2P) and Burr (4P) among of all the examined probability distribution functions can be accepted to fit to the low stream flow rate (discharge) time series data at the significant level α of 0.05, based on the Anderson-Darling goodness of fit test whilst, simoultaneously, only Burr (3P) serves the same purpose based on the Chi-squared goodness of fit test, still, at the same time, based cumulatively on all three individual goodness of fit tests, Dagum (4P) obtained the highest score of five and, therefore, the probability density function of Dagum (4P) (which, additionally, obtained the highest score based on the Kolmogorov-Smirnov goodness of fit test) is finally chosen in order to produce artificial low flow time series data.
Visually inspecting Figure 3, where the real observed (recorded) low stream flow rate (discharge) time series data are plotted against the artificial ones, for the same time period (25 July 2015–11 September 2015) we can identify that, by first sight, do not coincide (for the most of the paired values) remarkably well, suggesting that the random numbers generator should be employed further until the simulated time series data which best fits the obderved one is produced.

3.4. Hydrodynamic Methods and Equipment for Sample Data Collection and Analysis

Due to the extremely shallow waters, in conjunction with the extremely low water stream flow velocity prevailing at the gauging station, it is impossible to implement the area-velocity method in order to assess the stream flow rate (discharge), using a current meter mounted on a wading rod; This happens owing to the fact that there isn’t available depth to submerge the current meter as well as the extremely low water stream flow velocity is not sufficient enough to trigger the operation of a current meter. Under those particular circumstances the only alternatives are the use of either a small-sized flume or a small-sized portable weir plate, and the first one, eventually, was our final selected option. More specifically, a “3″-Inches Portable Conventional Parshall Flume”, constructed by means of fibre reinforced polyester sheet, with incorporated extended vertical wings at both sides, permanently attached to the main assembly was selected. This selection enhanced the secure, both lengthwise and crosswise, flume’s vertical stabilization by means of the adjacent sand berms into the stream bed at the stream flow rate gauging point [17,18,19], (see Supplementary Materials).

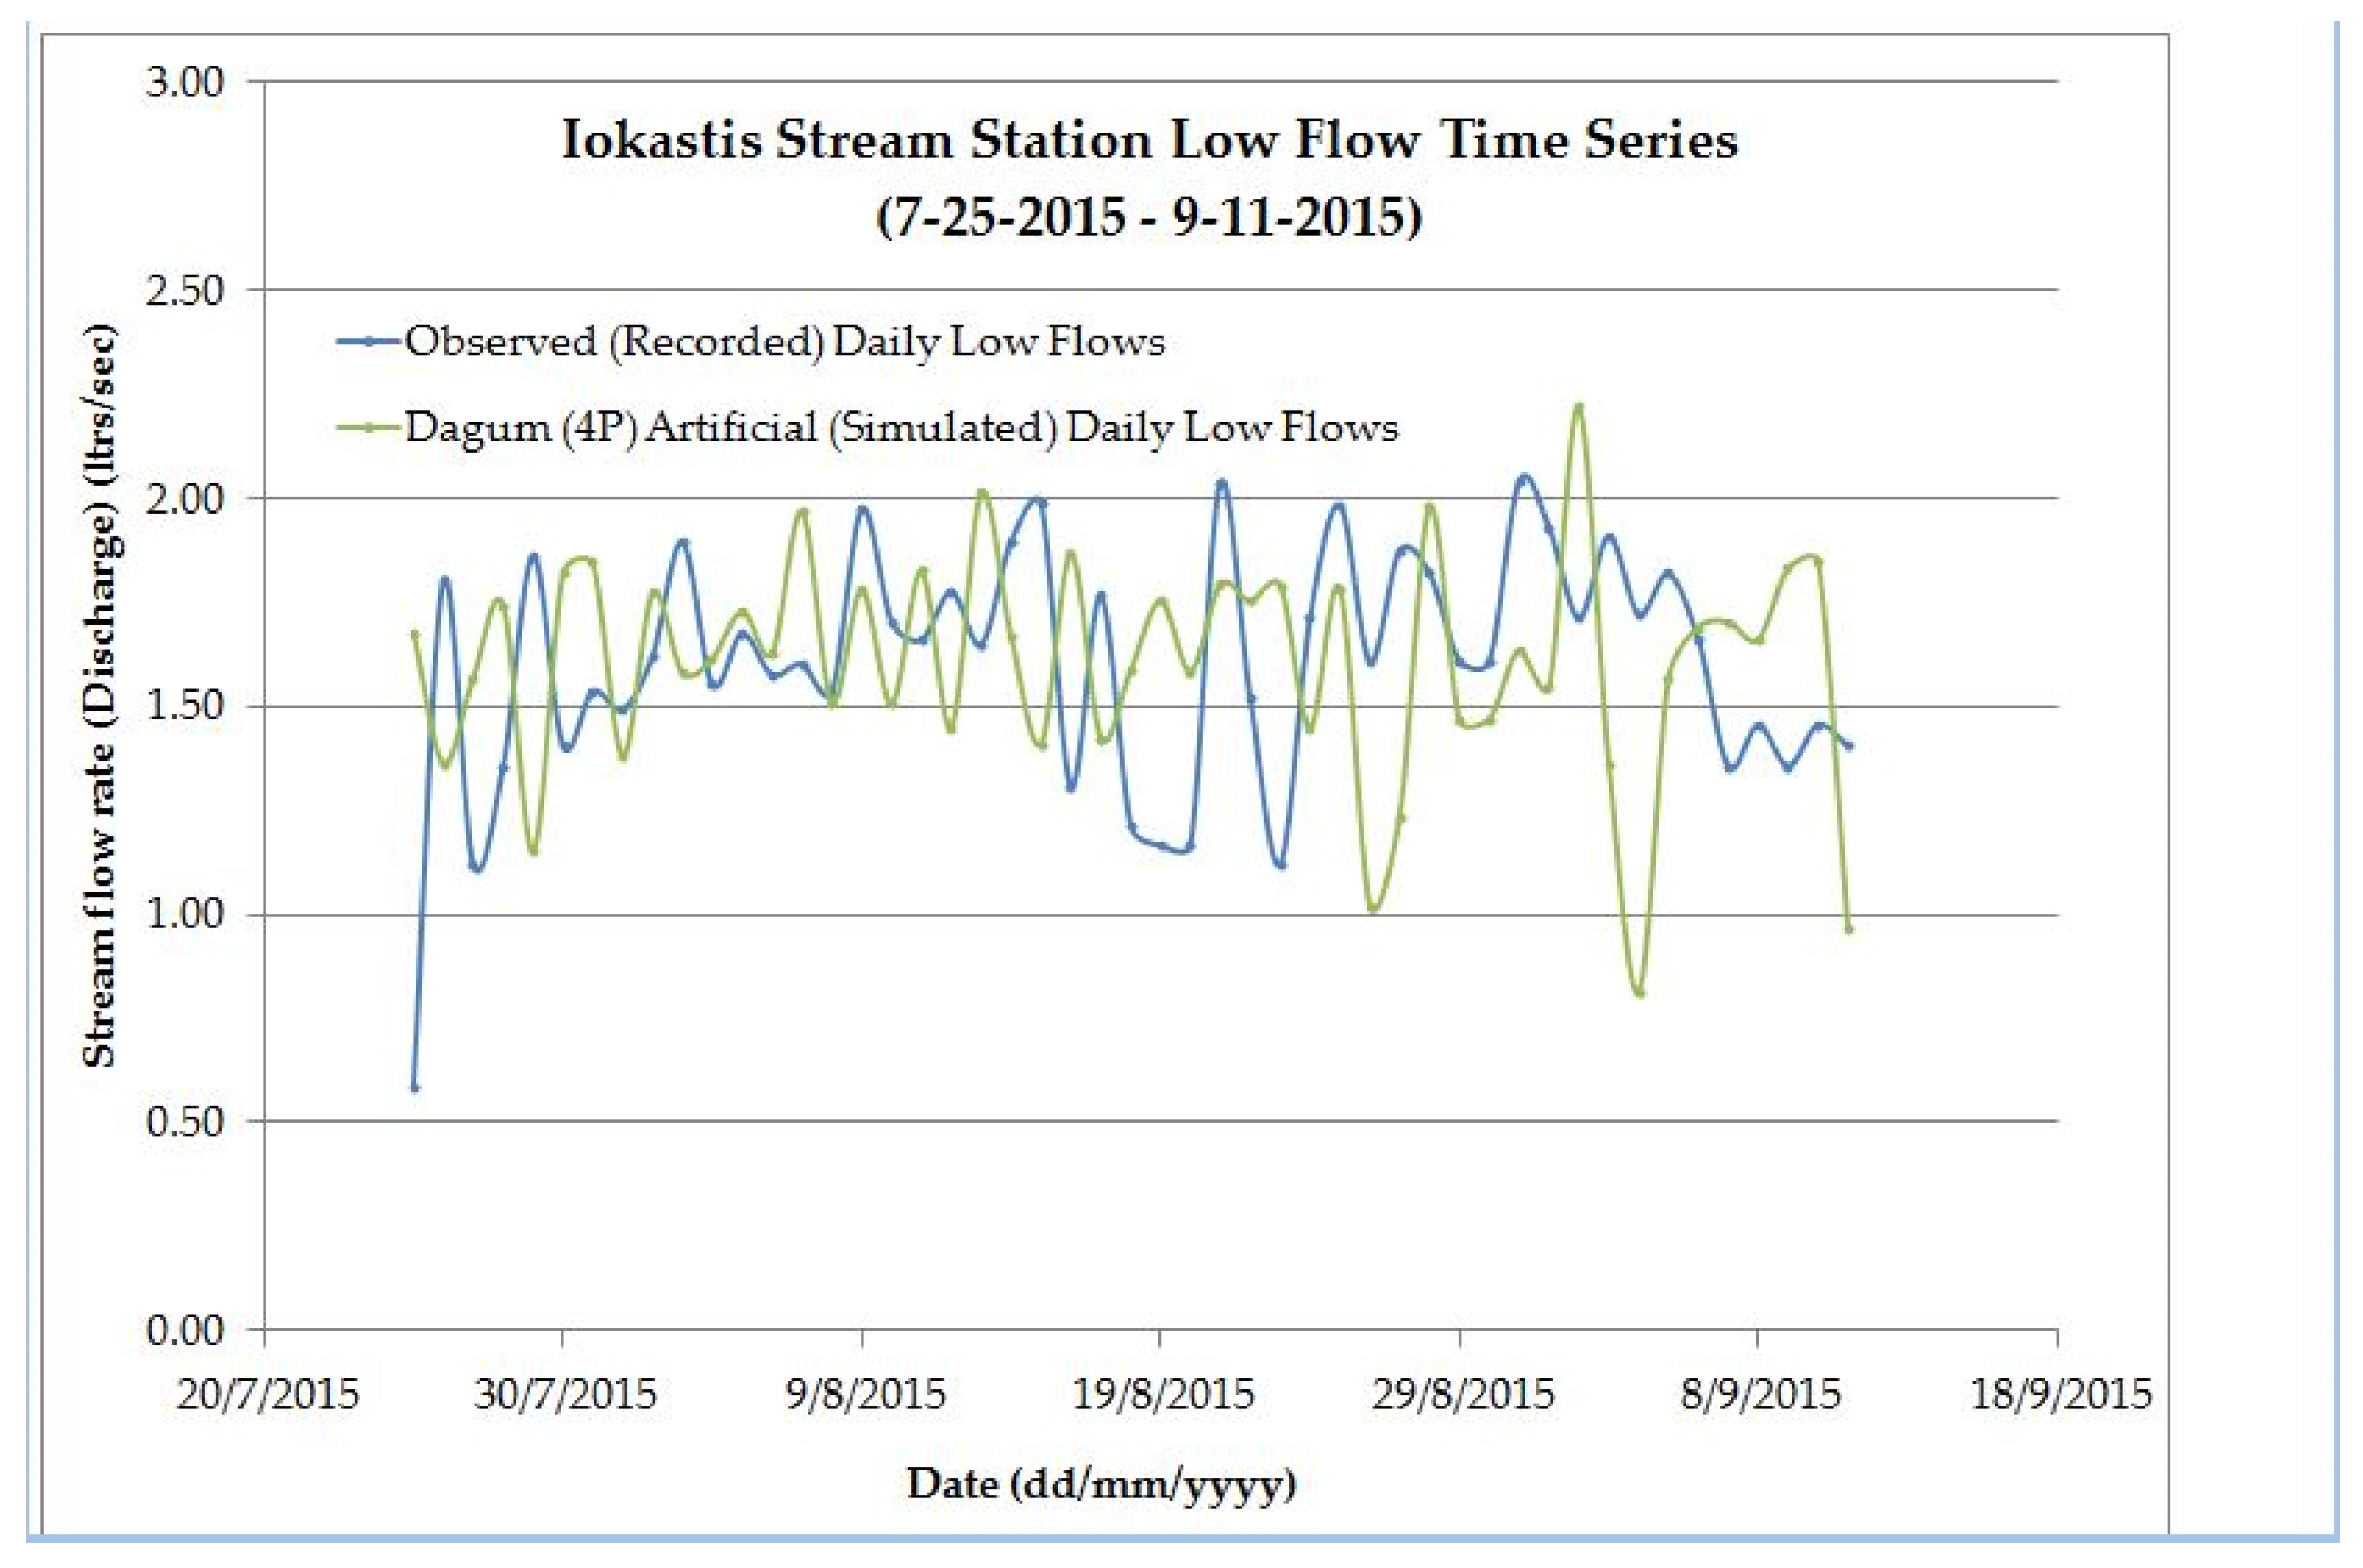
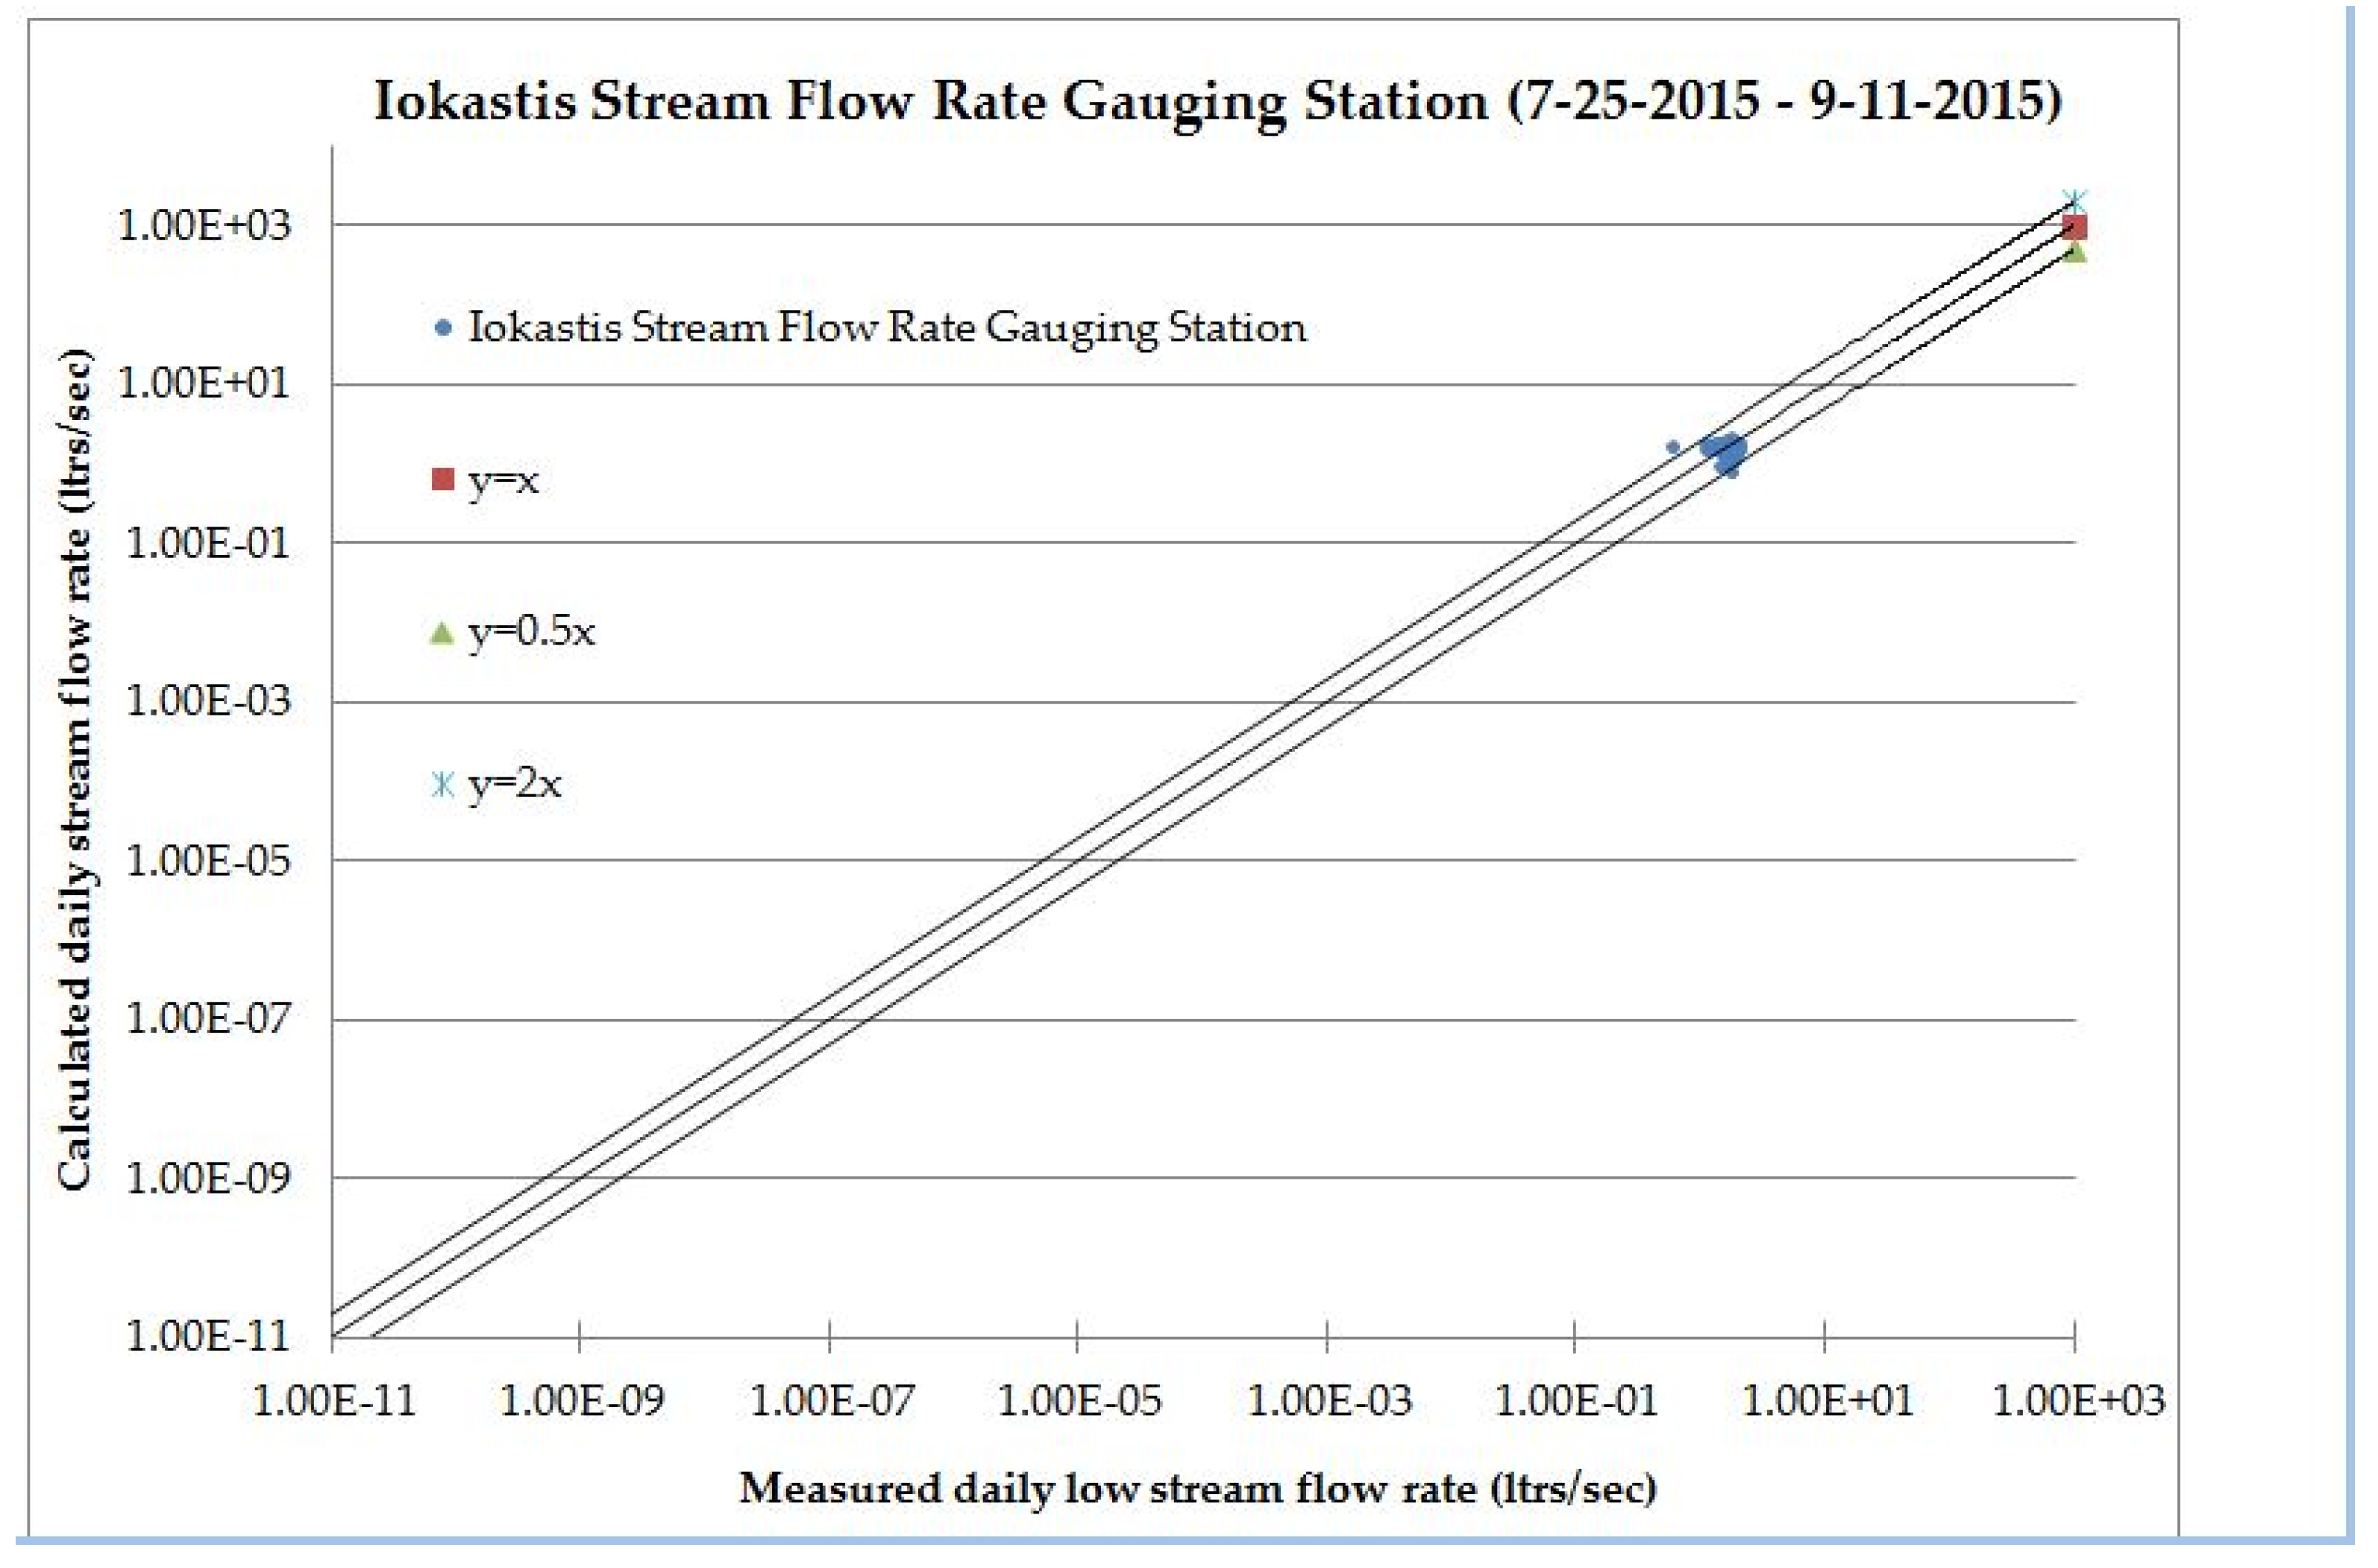
4. Comparison between Calculated and Site-Measured Low Stream Flow Rate (Discharge) Values

The comparison between calculated and site-measured values of low stream flow rates (discharges) is made on the basis of several statistical criteria such as, root mean squared error (R.M.S.E.), relative error (R.E.), efficiency coefficient (E.C.), linear correlation coefficient (r), determination coefficient (r2) and discrepancy ratio (D.C.) [20,21], as depicted within Table 2. The plot depicted within Figure 4 represents the discrepancy ratio concerning Iokastis Stream, Kavala city, North-Eastern Greece, during the time period between the specific dates 25 July 2015 and 11.September.2015. At this point, it should be noted that both coordinate axes are in logarithmic scale; therefore, the equations y = x, y = 0.5x and y = 2.0x are represented graphically by parallel straight lines.
In general, the obtained values of the statistical criteria R.M.S.E., R.E., E.C. for Iokastis Stream “3″-Inches Portable Conventional Parshall Flume” gauging station can be considered fairly satisfactory considering the low stream flow rate numerical values. Additionally, the degree of linear dependence between calculated and measured bed load transport rate is very weak, implying that more iterations should be carried out until an artificial low stream flow rate time series data which best fits (by the perspective of the overall achieved statistical efficiency criteria) the observed low stream flow rate time series data, is generated. The above mentioned statistical criteria values concerning Iokastis Stream, Kavala city, North-Eastern Greece, are listed within Table 2. It is noted that the relative error value depicted within Table 2 represents the average value of the relative errors calculated for each pair of calculated and measured daily low stream flow rate values.

5. Results and Discussion

A total number of 49 individual daily low stream flow rate (discharge) measurements were performed within 49 consecutive days, between 25 July 2015 and 11 September 2015, at the Iokastis Stream gauging station, Kavala city, north eastern Greece, at the particular section of the homonymous watershed and main stream channel by means of a “3″-Inches Portable Conventional Parshall Flume”. The daily lowest flows were undergone a probability distribution analysis and eleven candidate probability distribution functions were fitted to the low stream flow rate time series data proving that the Dagum (4P) probability distribution function best fitted the data based on three different goodness of fit tests. Still, it didn’t eventually prove adequately suitable to simulate the recorded data. As normally anticipated the stream flow rate observed early in the morning, late in the evening and during the night patrols were (due to decreased evapotranspiration rate, prevailing throughout the entire Kavala city area urbanized watershed) relatively higher that those performed around mid-day hours and early in the evening.

6. Conclusions and Further Research

In future, an artificial neural network could be designed in order to simulate daily low stream flow rate observed values employing various meteorological parameters (temperature, air pressure, humidity, wind velocity, rainfall etc.) of the particular climate established over Kavala city watershed [22]. Kavala city watershed and particularly main stream channel can sustain extremely low flow conditions which worth to be further monitored in order to compile an as much consistent watershed and drought management plan. Nonetheless, further research would contribute to better knowledge pertinent to the south eastern part of Europe were, as generally admitted, only a few stream flow rate (discharge) measurement gauging stations exist and transfer the acquired knowledge to ungauged watersheds as well, in accordance to the suggestions of the Braunschweig Declaration. Furthermore, applicability of other stochastic models should be investigated and their comparison should be performed and evaluated, finally selecting the most appropriate fitting the observed data in order to forecast future values of simulated low daily stream flow rate data [23].

Supplementary Materials

The following are available online at https://www.youtube.com/watch?v=OAmrRo13y0I, (Urban Stream Flow Measurement—25.July.2015—Kavala City-Greece), https://www.youtube.com/watch?v=tf3bUVLxaRY (Urban Stream Flow Measurement—11.September.2015—Kavala City-Greece).

Conflicts of Interest

“The authors declare no conflict of interest.”

Appendix A

The dates of all measurements as well as both the site measured as well as the calculated stream flow rates of Perigiali Stream are presented in Table A1.
Table A1. Stream flow rate measurements of Perigiali Stream.
No.DateStream flow Rate (m3/s) Site-MeasuredStream flow rate (m3/s) Calculated (Dagum 4P)
125-7-20150.58661.6780
226-7-20151.80301.3625
327-7-20151.12121.5697
428-7-20151.35741.7443
529-7-20151.86401.1514
630-7-20151.40661.8220
731-7-20151.53801.8466
81-8-20151.49301.3808
92-8-20151.62301.7739
103-8-20151.89701.5824
114-8-20151.55301.6168
125-8-20151.67501.7292
136-8-20151.57701.6290
147-8-20151.60301.9709
158-8-20151.53701.5107
169-8-20151.97601.7829
1710-8-20151.70401.5061
1811-8-20151.66001.8266
1912-8-20151.77701.4494
2013-8-20151.65002.0152
2114-8-20151.89901.6676
2215-8-20151.98701.4113
2316-8-20151.30891.8694
2417-8-20151.76751.4249
2518-8-20151.21381.5888
2619-8-20151.16711.7548
2720-8-20151.16711.5853
2821-8-20152.0391.7942
2922-8-20151.52001.7543
3023-8-20151.12121.7927
3124-8-20151.71421.4491
3225-8-20151.98651.7850
3326-8-20151.60931.0212
3427-8-20151.87591.2364
3528-8-20151.82141.9815
3629-8-20151.60931.4679
3730-8-20151.60931.4700
3831-8-20152.04261.6379
391-9-20151.93091.5498
402-9-20151.71422.2219
413-9-20151.91101.3595
424-9-20151.72300.8125
435-9-20151.82001.5694
446-9-20151.66001.6919
457-9-20151.35741.7036
468-9-20151.45631.6623
479-9-20151.35741.8348
4810-9-20151.45631.8508
4911-9-20151.40660.9648

References

  1. Matalas, N. Probability Distribution of Low Flows (Statistical Studies in Hydrology), 1st ed.; United States Government Printing Office: Washington, DC, USA, 1963; pp. 1–27. [Google Scholar]
  2. Beard, L. Simulation of Daily Streamflow, 1st ed.; U.S. Army Corps of Engineers (Institute for Water Resources—Hydrologic Engineering Center): Davis, CA, USA, 1968; pp. 1–13. [Google Scholar]
  3. Singh, K.P.; Stall, J.B. The 7-Day 10-Year Low Flows of Illinois Streams, 1st ed.; State of Illinois-Ch.: Urbana, IL, USA, 1973; pp. 1–24. [Google Scholar]
  4. Vogel, R.M.; Kroll, C.N. Generalized Low-Flow Frequency Relationships for Ungaged Sites in Massachusetts. Water Resour. Bull. (Am. Water Resour. Assoc.) 1990, 26, 241–253. [Google Scholar] [CrossRef]
  5. Smakhtin, V.Y.; Toulouse, M. Relationships between low-flow characteristics of South African streams. Water SA 1998, 24, 107–112. Available online: https://www.researchgate.net/publication/264957822_Relationships_between_low-flow_characteristics_of_South_African_streams (accessed on 3 May 2018).
  6. Young, A.R.; Round, C.E.; Gustard, A. Spatial and temporal variations in the occurrence of low flow events in the UK. Hydrol. Earth Syst. Sci. 2000, 4, 35–45, hal-00304501, version 1. Available online: https://www.hydrol-earth-syst-sci.net/4/35/2000/hess-4-35-2000.pdf (accessed on 3 May 2018). [CrossRef]
  7. Smakhtin, V.U. Low flow hydrology: A review. J Hydrol. 2001, 240, 147–186. [Google Scholar] [CrossRef]
  8. Zaidman, M.D.; Keller, V.; Young, A.R. Low Flow Frequency Analysis (Guidelines for Best Practice) (R & D Technical Report W6-064/TR1, Centre for Ecology and Hydrology), 1st ed.; Environment Agency, Rio House (Waterside Drive, Aztec West): Bristol (BS32 4UD), UK, 2002; pp. 1–33. [Google Scholar]
  9. Laaha, A.K.; Blöschl, G. Low flow estimates from short stream flow records—A comparison of methods. J. Hydrol. 2005, 306, 264–286. [Google Scholar] [CrossRef]
  10. Tallaksen, L.; Hewa, G. Manual on Low Flow Estimation and Prediction (WMO-No. 1029, Operational Hydrology Report No. 50), 1st ed.; Chairperson Publications Board—World Meteorological Organization (WMO): Geneva, Switzerland, 2008; pp. 1–138. [Google Scholar]
  11. Wittenberg, H. Groundwater abstraction for irrigation and its impacts on low flows in a watershed in Norhwest Germany. Resources 2015, 4, 566–576. [Google Scholar] [CrossRef]
  12. Yürekli, K.; Kurunç, A.; Gül, S. Frequency analysis of low flow series from Çekerek stream basin. J. Agric. Sci. 2005, 11, 72–77. [Google Scholar] [CrossRef]
  13. Papalaskaris, T.; Panagiotidis, T. Artificial low stream flow time series generation of Perigiali stream, Kavala city, NE Greece. In Proceedings of the 6th International Symposium on Environmental & Material Flow Management (6th E.M.F.M.), Bor, Serbia, 2–4 October 2016; Živković, Ž., Mihailović, I., Dordević, P., Eds.; University of Belgrade, Technical Faculty in Bor: Bor, Serbia, 2016; pp. 20–38. [Google Scholar]
  14. Papalaskaris, T.; Panagiotidis, T. Stochastic generation of low stream flow data of Perigiali Stream, Kavala city, NE Greece. In Proceedings of the 10th World Congress of European Water Resources Association (“E.W.R.A.”) on Water Resources and Environment “Panta Rhei” (10th “E.W.R.A.” “Panta Rhei”), Athens, Greece, 5–9 July 2017; Tsakiris, G., Tsihrintzis, V., Vangelis, H., Tigkas, D., Eds.; European Water Resources Association (E.W.R.A.): Athens, Greece, 2017; pp. 953–960. [Google Scholar]
  15. Papalaskaris, T.; Panagiotidis, T. Stochastic generation of low stream flow data of Perigiali Stream, Kavala city, NE Greece. Eur. Water 2017, 60, 299–306. [Google Scholar] [CrossRef]
  16. Papalaskaris, T.; Panagiotidis, T. Artificial low stream flow time series generation of Palaia Kavala Stream, Kavala City, NE Greece. In Proceedings of the 15th International Conference on Environmental Science & Technology (15th C.E.S.T.), Rhodes Island, Greece, 31 August–2 September 2017; Lekkas, D.F., Ed.; Global Network for Environmental Science & Technology (Global-NEST), University of the Aegean: Athens, Greece, 2017. cest2017_00842. [Google Scholar]
  17. Survey, G.; Rantz, S.E. Measurement of Discharge by Miscellaneous Methods (Chapter 8). In Measurement & Computation of Streamflow: (Volume 1.) (Measurement of Stage & Discharge), 1st ed.; United States Government Printing Office: Washington, DC, USA, 1982; Volume 1, pp. 260–272. [Google Scholar]
  18. Turnipseed, D.P.; Sauer, V.B. Portable Parshall-Flume Measurements. In Discharge Measurements at Gaging Stations (Chapter 8 of Book 3, Section A) (Techniques & Methods 3-A8), 1st ed.; (U.S. Department of the Interior) U.S. Geological Survey: Reston, VA, USA, 2010; pp. 83–84. [Google Scholar]
  19. Buchanan, T.J.; Somers, W.P. Discharge Measurements at Gaging Stations (Chapter A8) (Techniques of Water-Resources Investigations of the United States Geological Survey), 1st ed.; United States Government Printing Office: Washington, DC, USA, 1969; pp. 1–65. [Google Scholar]
  20. Nash, J.E.; Sutcliffe, J.V. River flow forecasting through conceptual models, Part I—A discussion of principles. J. Hydrol. 1970, 10, 282–290. [Google Scholar] [CrossRef]
  21. Krause, P.; Boyle, D.P.; Bäse, F. Comparison of different efficiency criteria for hydrological model assessment. Adv. Geosci. 2005, 5, 89–97, SRef-ID: 1680-7359/adgeo/2005-5-89. Available online: https://www.adv-geosci.net/5/89/2005/adgeo-5-89-2005.pdf (accessed on 3 May 2018). [CrossRef]
  22. Papalaskaris, T.; Dimitriadou, P. Artificial Neural Network for Bed Load Transport Rate in Nestos River, Greece. Spec. Top. Rev. Porous Media Int. J. 2017, 8, 145–157. [Google Scholar] [CrossRef]
  23. Sentas, A.; Psilovikos, A.; Psilovikos, T.; Matzafleri, N. Comparison of the performance of stochastic modes in forecasting daily dissolved oxygen data in dam-Lake Thesaurus. Desalination Water Treat. 2016, 57, 11660–11674. [Google Scholar] [CrossRef]
Figure 1. 3″-Inches Portable Conventional Parshall Flume gauging station, Iiokastis & Chrisostomou Smirnis roads junction, Kavala city, Kavala city, Greece.
Proceedings 02 00579 g001
Figure 2. Recorded stream flow rate at Iokastis Stream, Kavala city area, 3″-Inches Portable Conventional Parshall Flume, gauging station vs. observed rainfall at Dexameni area station, Kavala city, Greece.
Proceedings 02 00579 g002
Figure 3. Plot of observed against artificial low stream flow rate time series data at Iokastis Stream, Kavala city area, 3″-Inches Portable Conventional Parshall Flume gauging station, Kavala city, Greece.
Proceedings 02 00579 g003
Figure 4. Discrepancy ratio plot of observed against artificial low stream flow rate time series data of 3″-Inches Portable Conventional Parshall Flume gauging station, Iokastis Stream, Kavala city, Greece, (25 July 2015 and 11 September 2015).
Proceedings 02 00579 g004
Table 1. Goodness of fit tests results for the 3″-Inches Portable Conventional Parshall Flume, Iokastis Stream, Kavala city, Greece, gauging station, data series.
Probability DistributionAnderson-DarlingChi-SquaredKolmogorov-SmirnovHighest Final Goodness of Fit Score Obtained
Gumbel min (2P)0.228052.08460.072730
Log-Normal (3P)0.858445.02680.141020
Pearson type 5 (3P)1.00854.53530.150810
Pearson type 6 (3P)1.42495.85270.16270
Weibull (2P)1.42356.99160.116360
Kumaraswamy (4P)0.238372.07560.075280
Gen. Logistic (2P)0.21294 12.56840.06652 34
Burr (4P)0.22641 32.57540.070151
Burr (3P)0.329090.44185 10.096333
Wakeby (5P)4.0874Ν/A0.06576 22
Dagum (4P)0.22273 22.62450.05767 15
Table 2. Statistical criteria values of 3″-Inches Portable Conventional Parshall Flume gauging station, Iokastis Stream, Kavala city, Greece, (25 July 2015–11 September 2015).
Number of Paired ValuesRMSE [kg/(m s)]RE (%)ECrr2Discrepancy Ratio
490.4193−0.0563−1.1331−0.14200.02020.9592
Publisher’s Note: MDPI stays neutral with regard to jurisdictional claims in published maps and institutional affiliations.

