Proceeding Paper

Impact of Channel Geometry on the Discrimination of Mechanically Impaired Red Blood Cells in Passive Microfluidics †

Institut des Nanotechnologies de Lyon INL-UMR5270 CNRS, Université Lyon 1, F-69622 Villeurbanne, France
*
Author to whom correspondence should be addressed.
Presented at the Eurosensors 2017 Conference, Paris, France, 3–6 September 2017.
Proceedings 2017, 1(4), 512; https://doi.org/10.3390/proceedings1040512
Published: 8 August 2017
(This article belongs to the Proceedings of Proceedings of Eurosensors 2017, Paris, France, 3–6 September 2017)

Abstract

:
In this work, we aimed at the discrimination of mechanically impaired red blood cells (RBCs) using passive microfluidic approaches. We investigated the impact of the channel geometry on the behavior of healthy RBCs (hRBCs) and thermally rigidified RBCs (T-rRBCs) flowing in (i) a Unique and Long Constriction (ULC) and (ii) a series of Oscillating Width Constrictions (OWC). To confront the two geometries, we evaluated potential biomarkers for cell discrimination such as their speed V, deformation index D and relaxation time τ.

1. Introduction

Over the last twenty years, cell mechanical properties have been pointed out as an interesting biomarker for several diseases. Various techniques have been reported in literature to evaluate RBC mechanical properties through the measurement of different parameters, i.e., the cortical tension [1], flowing speed through a network of constrictions [2], the time necessary to reach a steady state starting from rest [3], as well as their maximal deformability and their shape relaxation time (τ) [4]. Passive microfluidic techniques have emerged as powerful, label free, high throughput methods to assay those mechanical characteristics, using specific geometries [5]. In the present work, we used a passive microfluidic approach to differentiate mechanically impaired from healthy RBCs. We investigated the impact of the channel geometry on the flow of RBC samples through constricted channels. Several potential biomarkers were compared in order to choose the most suitable for a Point-Of-Care (POC) application.

2. Materials and Methods

Blood samples: for the preparation of blood samples, 30 µL of fresh whole blood was obtained from healthy volunteers by finger pricking and diluted in 970 µL of PBS 1× solution. The suspension was then centrifuged to pelt cells and the supernatant was discarded; this washing step is repeated three times in order to avoid coagulation. A higher dilution of hRBCs (20 × 106 RBCs/mL of PBS) was prepared to avoid the flow of several cells simultaneously in the microchannel. This diluted suspension was centrifuged and the cells were finally re-suspended in 1 mL of PBS/Dextran/BSA buffer, corresponding to a viscosity ηout of 31.5 mPa.s (9% w/v Dextran, Mw = 2 × 10⁶ g/mol and 2% w/v BSA). Thermal heating process: to prepare thermally rigidified samples (T-rRBCs) in PBS 1×, a dilute RBC suspension (20 × 106 RBCs/mL) was prepared in PBS/BSA solution as described previously. The suspension was then heated at 50 ± 2 °C for 15 min in a thermal bath. After incubation, the solution was left for 3–5 min to cool down to room temperature, the suspension was then centrifuged and the T-rRBCs were re-suspended in 1 mL of PBS/Dextran/BSA. PDMS microfluidic channels: microfluidic channels were prepared using standard soft lithography technique (replication molding). A mold was prepared using laser lithography and replicated in Polydimethylsiloxane (PDMS). Fluidic inlets and outlets were punched (diameter of 0.75 mm) and then the PDMS slab was sealed on glass substrates by O2 plasma treatment (Harrick Plasma®). We used a Fluigent® MFCSTM-EZ device with a precision of 0.3 mbar to generate the difference of pressure necessary to inject the RBCs in the microchannels. Image analysis: The video-microscopic recordings were processed using a Matlab® self-made routine to study cell dynamics and deformation. Briefly, the cells contour is detected and fitted using an elliptical fit. The position of the center of mass, as well as the lengths of both axes of the elliptical shape were measured, 2a being the axis along the flow direction (x-direction) while 2b is the axis perpendicular to the flow direction (y-direction). The values of 2a and 2b extracted from data analysis were used to calculate the deformation index defined as D = (a − b)/(a + b).

3. Results and Discussion

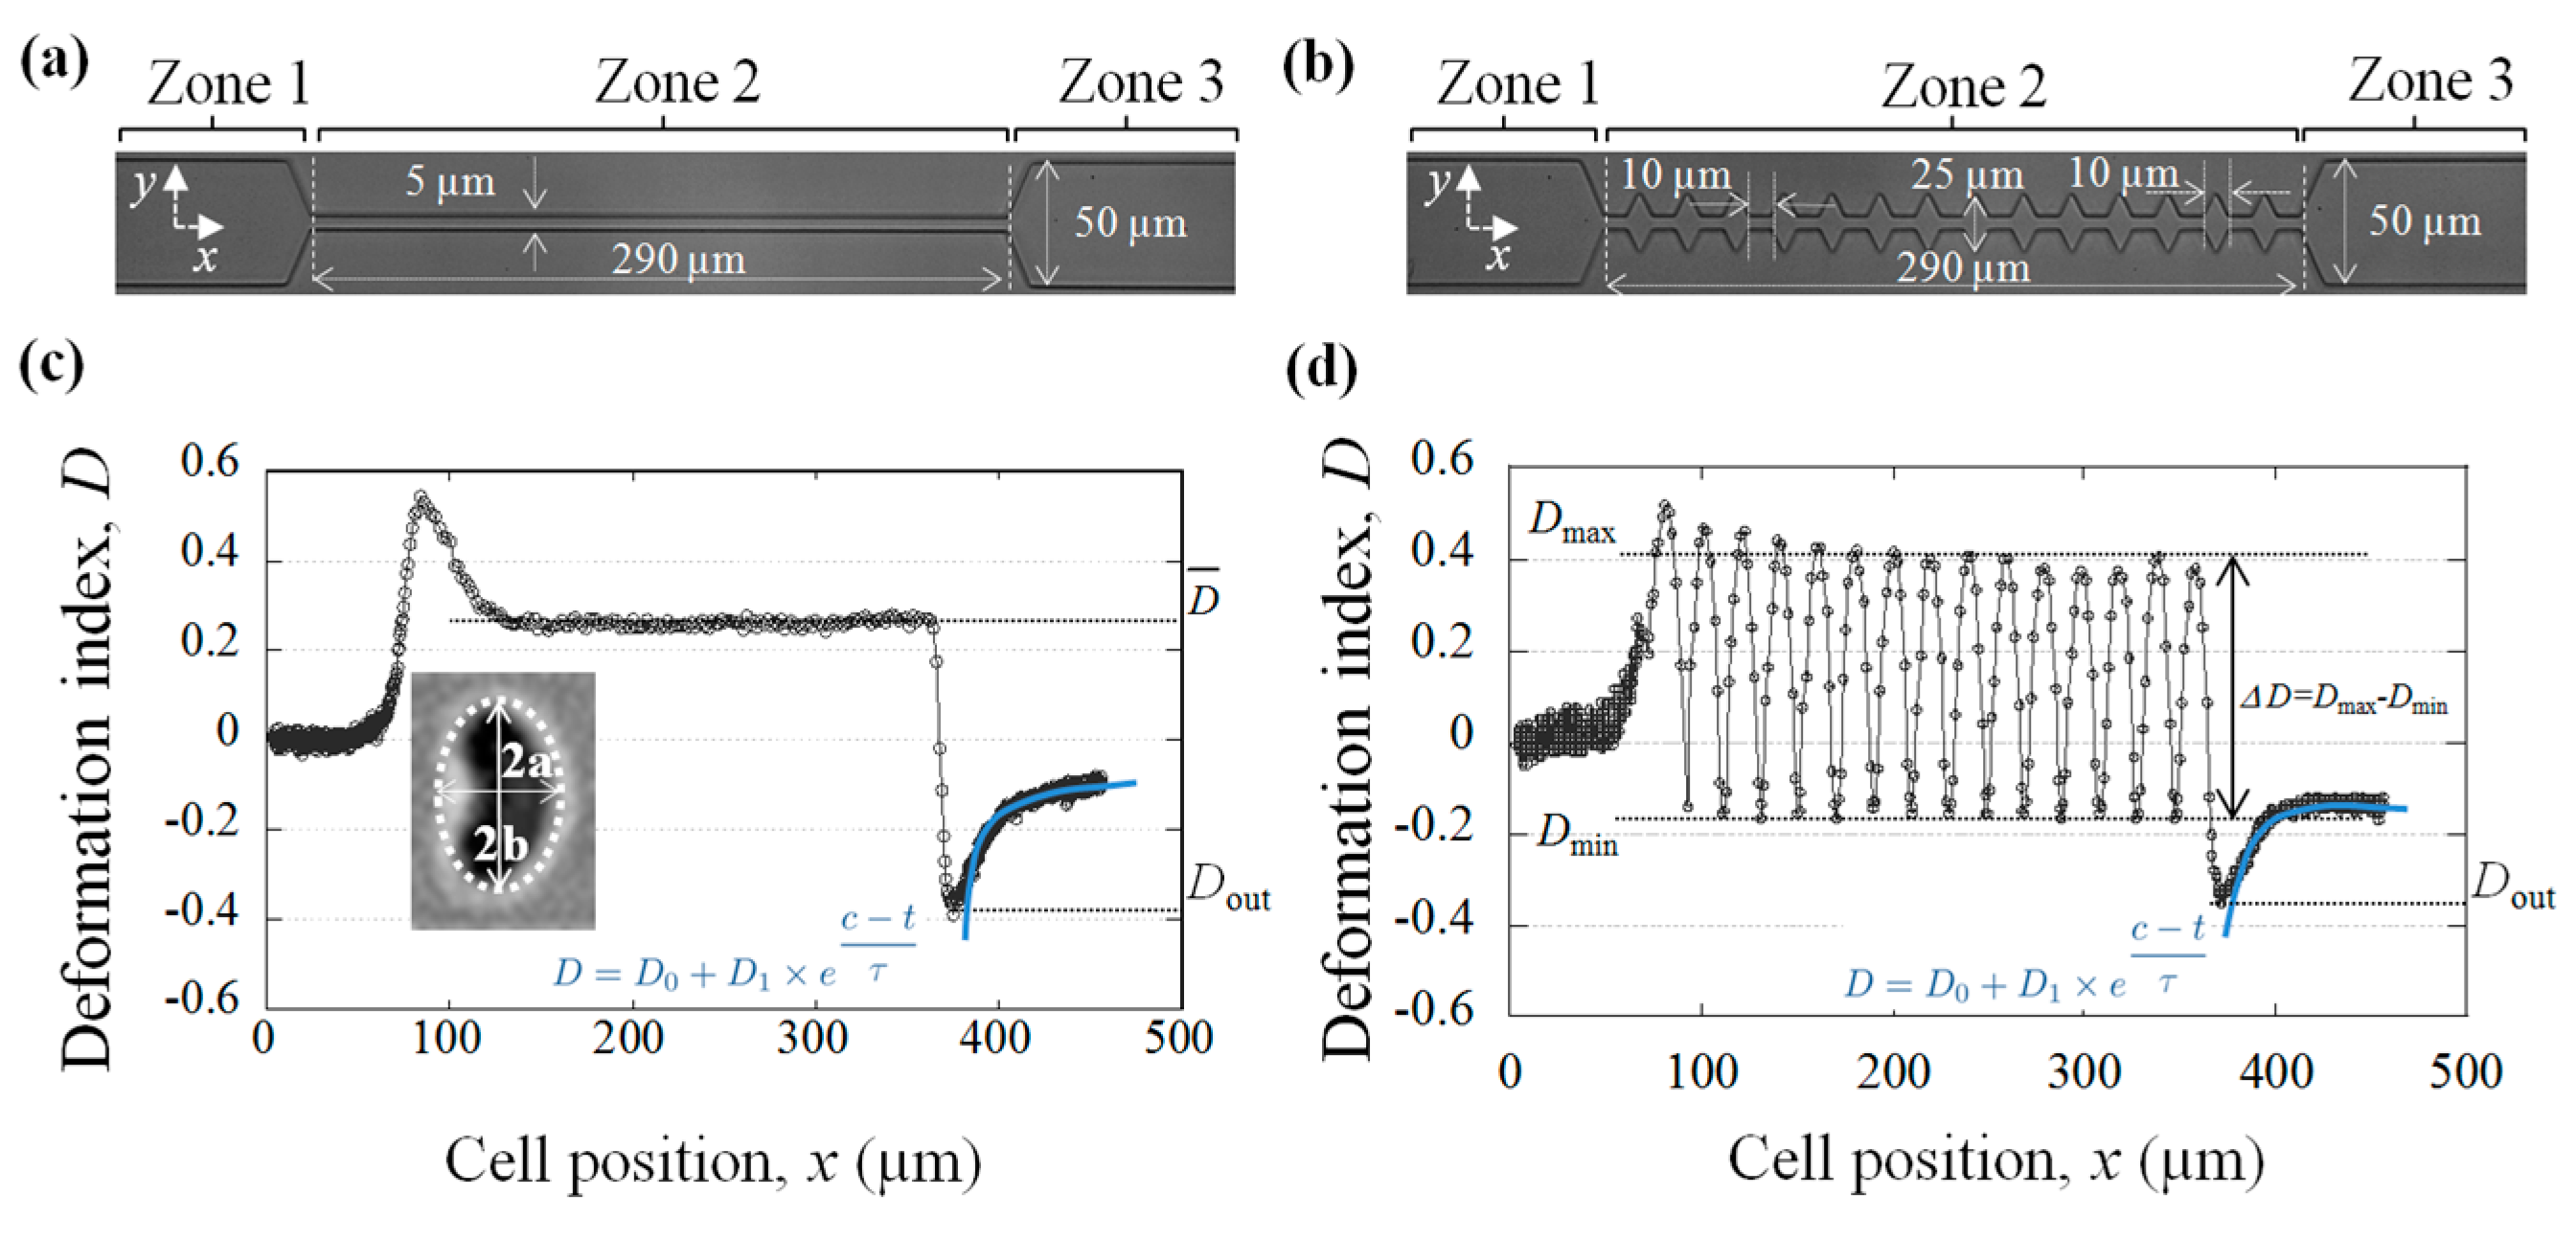
3.1. Presentation of the Microfluidic Geometries and the Corresponding Cell Deformation

The two tested microfluidic channels with their associated hRBCs mechanical response are presented in Figure 1. The ULC consists of a unique long constriction of 5 µm wide and 290 µm long (Figure 1a), whereas, the OWC (Figure 1b) is constituted of a succession of narrowings (5 µm) and widenings (25 µm). The length of each narrowing and widening is 10 µm each and the total length of the OWC was kept at 290 µm. The height of both channels was set to 5 µm.
We can notice that, for both geometries, D = 0 in zone 1 as the cells enter the 50 µm wide channel undergoing a parachute-like shape. This shape is typical from confined flow and corresponds to a projected area roughly circular (a = b). In zone 2, D increases before stabilizing at a constant value D ¯ for ULC (Figure 1c) and oscillates between Dmax (in the narrowings) and Dmin (in the widenings) for the OWC (Figure 1d), allowing to define the amplitude of deformation ∆D. Finally, the cells reach their maximal deformation in the y-direction Dout, at the exit before relaxing back to a stationary shape, in a typical time τ.

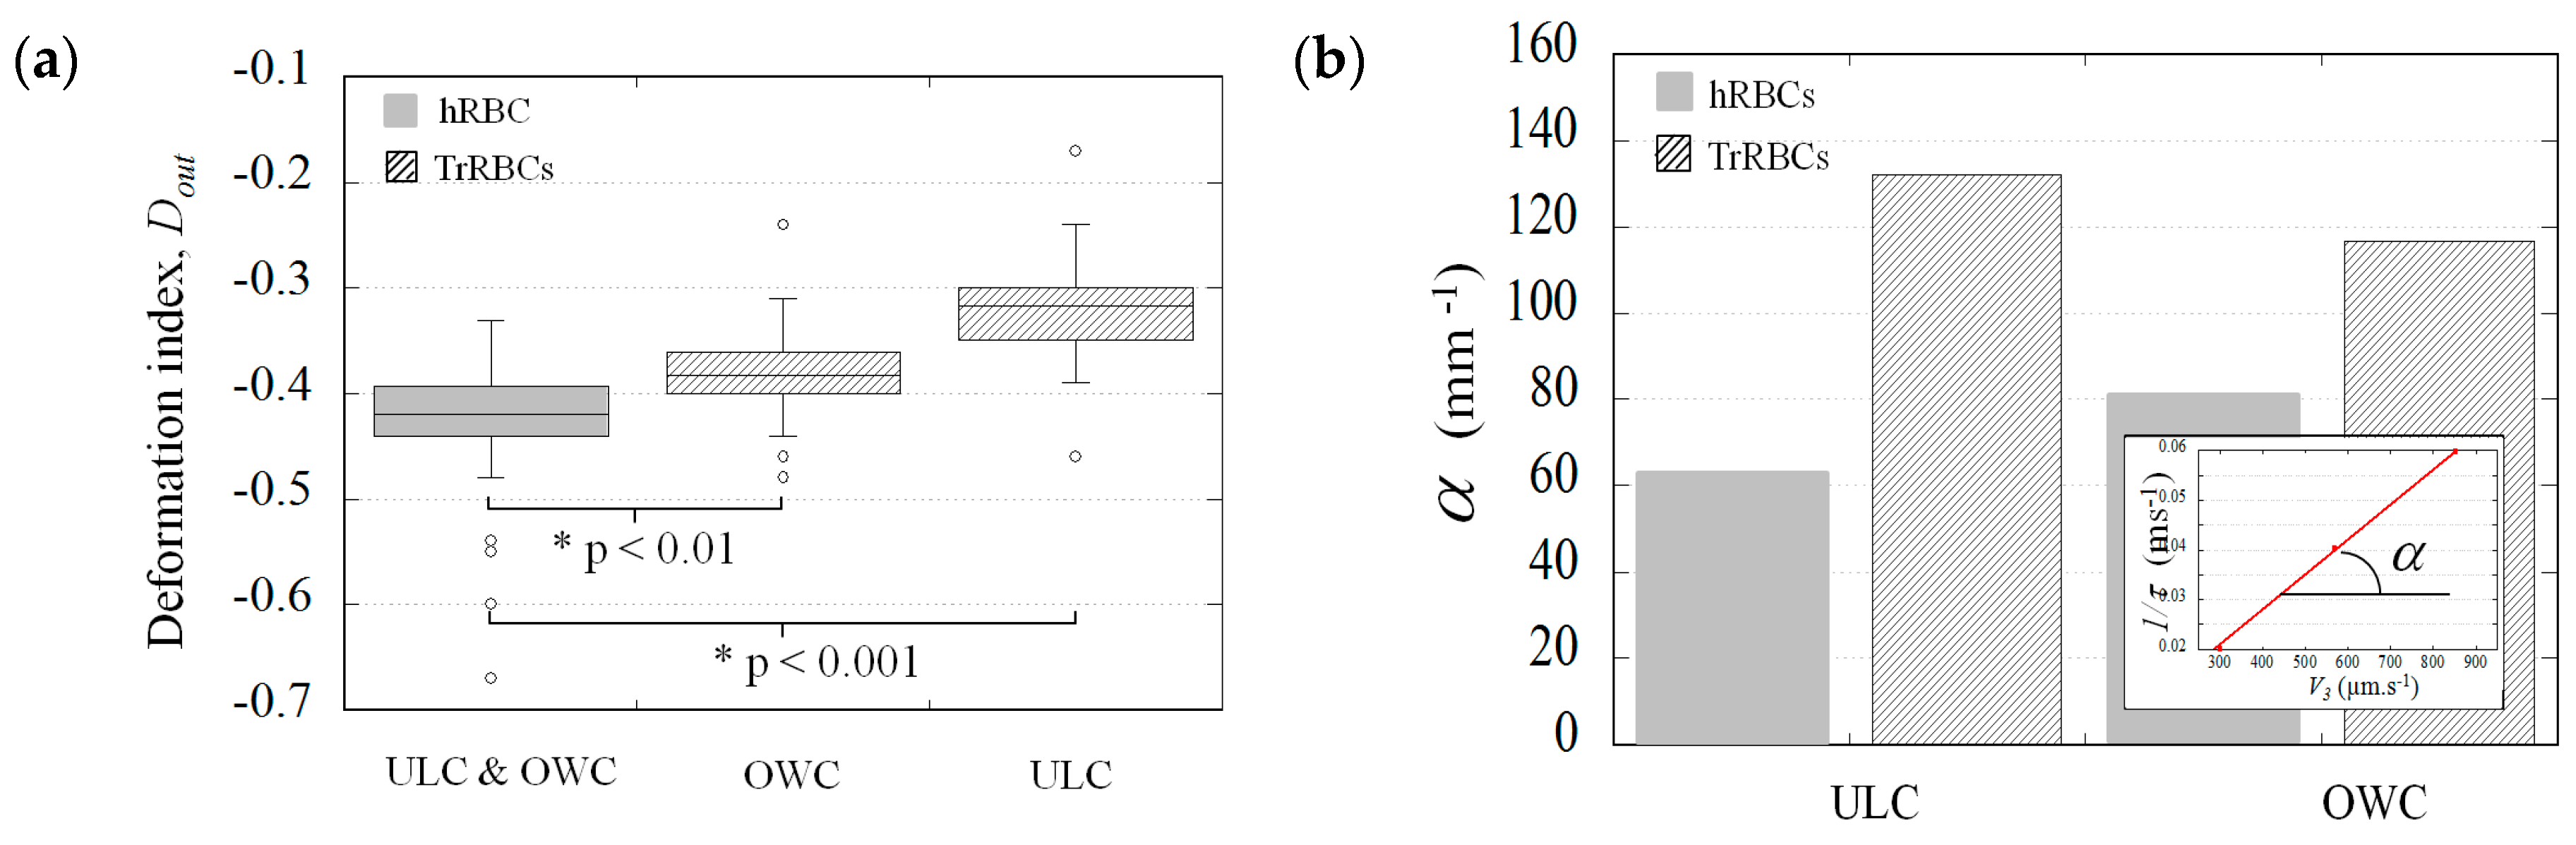
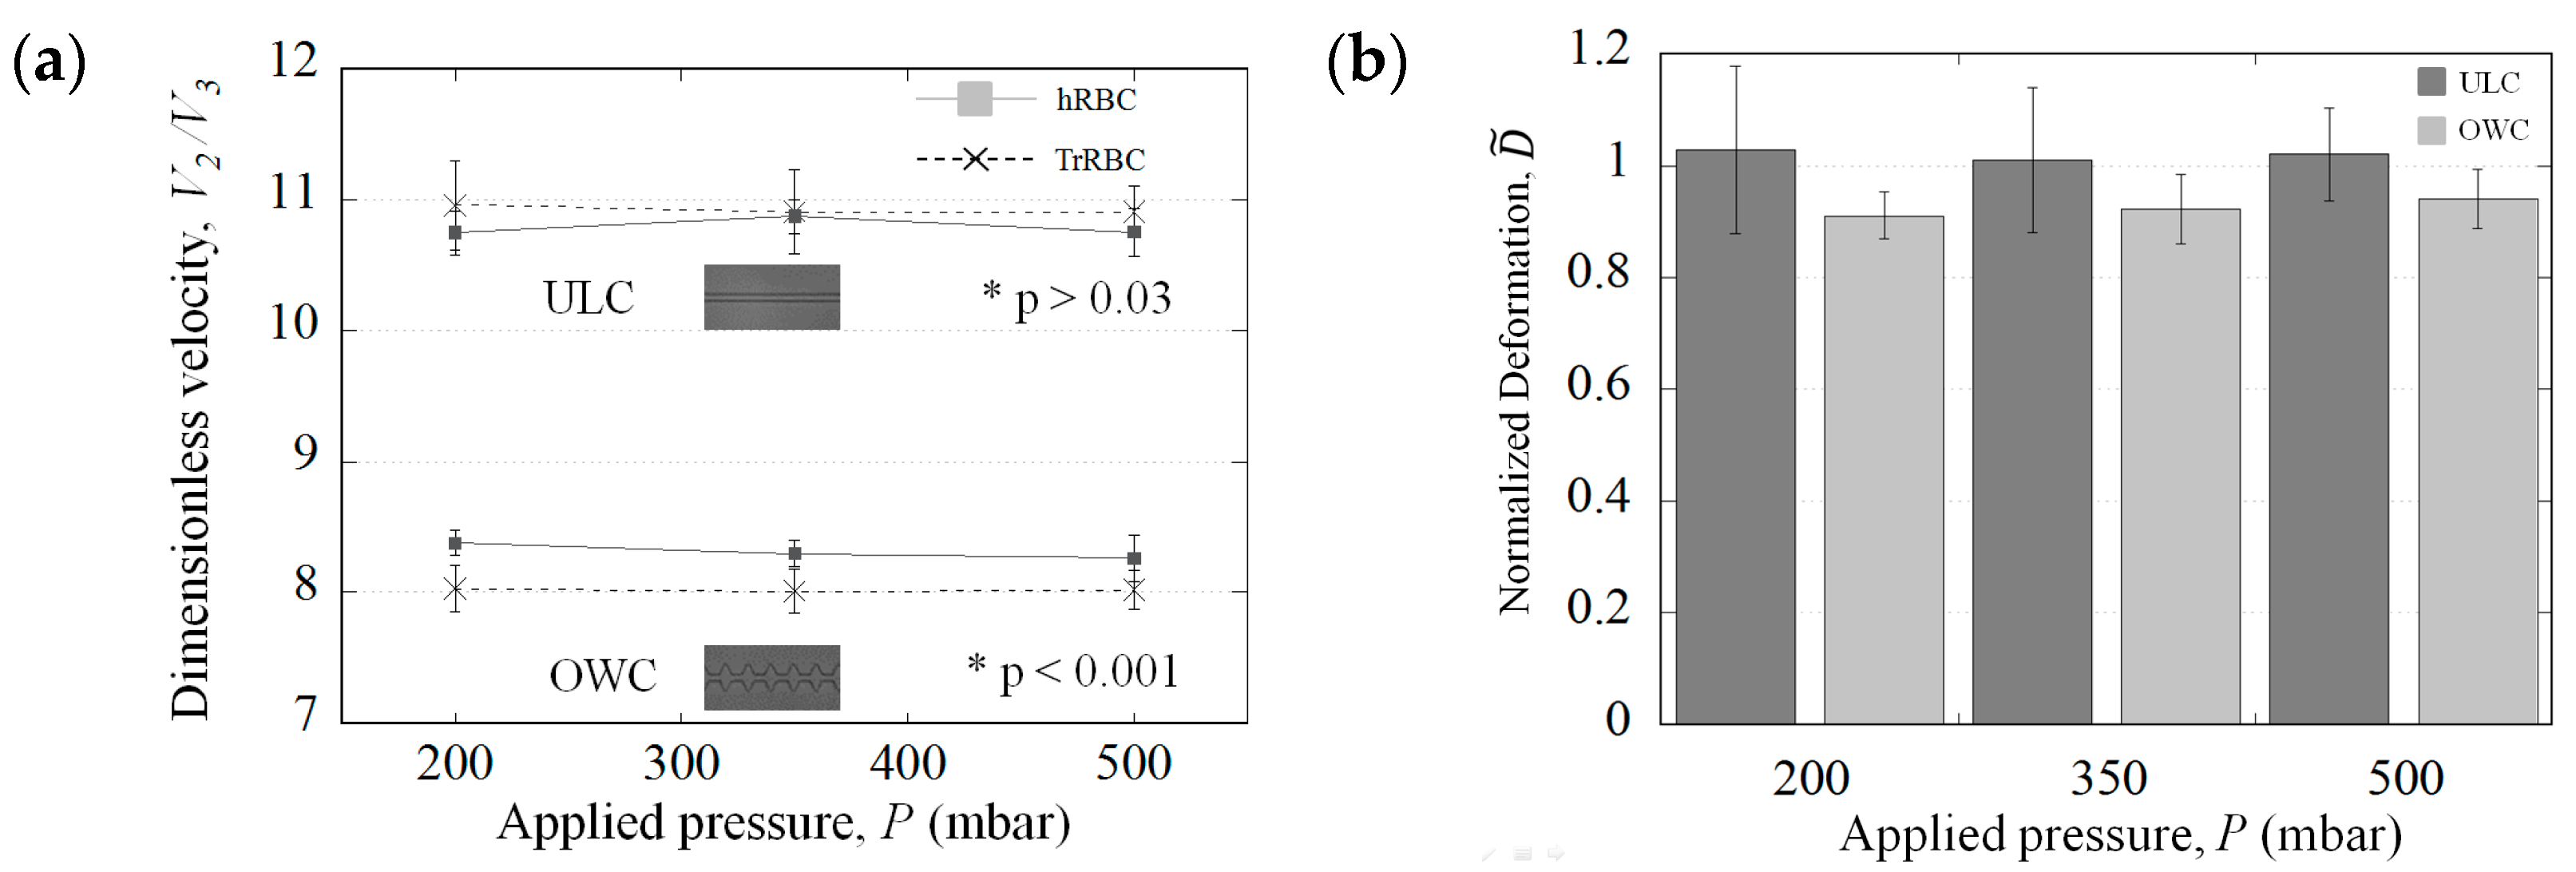
3.2. The Potential Distinction Parameters

For the discrimination of impaired-rRBCs, several potential parameters were tested. Some of these parameters are based on cell kinematics such as normalized transit velocity V2/V3, (cell speed in zone 2 and 3 respectively) while others are extracted from cells deformation such as D ¯ , ∆D and τ. Both types of parameters were investigated and compared. First, we studied the dimensionless velocity V2/V3 presented in Figure 2a. Results show that in ULC, the velocity difference is insufficient to discriminate between the two samples. However in OWC, T-rRBCS flow statistically slower than their healthy counterparts. We attribute this discrepancy to the accumulation of delays when flowing in each constriction.
Then, we analyzed the normalized deformation D ˜ defined as D ¯ T-rRBCs/ D ¯ hRBCs for ULC and ∆DT-rRBCs/∆DhRBCs for OWC. Figure 2b shows that for ULC, D ˜ remains around 1 traducing that cells in both samples experience the same deformation mainly imposed by the channel width. On the other hand, for OWC, D ˜ is measured slightly lower than 1, traducing a smaller amplitude of deformation for T-rRBCs than hRBCs. We attributed this difference to the fact that T-rRBCs deform less in the narrowing (results not shown here), which is consistent with our previous hypothesis concerning the explanation of cells flowing speeds. We also found that samples discrimination can be made at the exit, in zone 3. We highlighted that cells stretching perpendicular to the flow at the exit Dout, for hRBCs, is geometry-independent. Figure 3a reveals that T-rRBCs are less stretched than hRBCs at the exit. This difference of behavior is more important for ULC, where T-rRBCs conserve a steady shape, than OWC, where they undergo high frequency mechanical solicitations. Thus, we could attribute the higher Dout in OWC, to the disruption of spectrin aggregates or additional crosslinks within the cytoskeleton which are at the origin of the stiffening of thermally treated cells [6].
Finally, we investigated cells relaxation time τ as a biomarker. It has been shown in literature [5] that 1/τ increases linearly with the cell velocity. Figure 3b represents the slopes α of 1/τ = f(V3) curves (see insert) for both populations flowing in the two geometries. Surprisingly, we noticed that α is higher for T-rRBCs than for hRBCs, traducing a faster relaxation. This difference is larger for ULC.
In conclusion, for each targeted biomarker, there is one geometry which is more efficient to the discrimination of the two populations. In the context of POC applications, the integration of cell speed measurements being easier than deformation-based analysis, the OWC geometry would be privileged.

Acknowledgments

NanoLyon platform was used to prepare the microfluidic systems. A.A. is thankful to the French ministry of research and Ecole Doctorale EEA for his PhD fellowship. This work was supported by Labex iMUST.

Conflicts of Interest

The authors declare no conflict of interest. The funding sponsors had no role in the design of the study; in the collection, analyses, or interpretation of data; in the writing of the manuscript, and in the decision to publish the results.

References

  1. Guo, Q.; Duffy, S.P.; Matthews, K.; Santoso, A.T.; Scott, M.D.; Hongshen, M. Microfluidic analysis of red blood cell deformability. J. Biomech. 2014, 47, 1767–1776. [Google Scholar] [CrossRef] [PubMed]
  2. Bow, H.; Pivkin, I.V.; Diez-Silva, M.; Goldfless, S.J.; Dao, M.; Niles, J.C.; Suresh, S.; Han, J. A microfabricated deformability-based flow cytometer with application to malaria. Lab Chip 2011, 11, 1065–1073. [Google Scholar] [CrossRef] [PubMed]
  3. Prado, G.; Farutin, A.; Misbah, C.; Bureau, L. Viscoelastic transient of confined Red Blood Cells. Biophys. J. 2015, 108, 2126–2136. [Google Scholar] [CrossRef] [PubMed]
  4. Hochmuth, R.M.; Worthy, P.R.; Evans, E.A. Red cell extensional recovery and the determination of membrane viscosity. Biophys. J. 1979, 26, 101–114. [Google Scholar] [CrossRef]
  5. Nyberg, K.D.; Scott, M.B.; Bruce, S.L.; Gopinath, A.B.; Bikos, D.; Mason, T.G.; Kim, J.W.; Choig, H.S.; Rowat, A.C. The physical origins of transit time measurements for rapid, single cell mechanotyping. Lab Chip 2016, 16, 3330–3339. [Google Scholar] [CrossRef] [PubMed]
  6. Rakow, A.; Hochmuth, R. effect of heat treatment on the elasticity of human erythrocyte membrane. Biophys. J. 1975, 15, 1095–1100. [Google Scholar] [CrossRef]
Figure 1. Microscopic image of each microfluidic system with their corresponding cells deformation index D versus their position for a healthy RBC flowing in: (a,c) the ULC channel; (b,d) the OWC channel. The insert on (c) represents the elliptical fit from which we calculate the deformation index D = (a − b)/(a + b), with (2a) the axis in the x-direction and (2b) the axis in the y-direction. The different parameters extracted during the analysis are defined on the graphs.
Proceedings 01 00512 g001
Figure 2. Discrimination between hRBCs and T-rRBCs flowing in the two geometries using: (a) the dimensionless velocities (* p values represents the T-test for each two points at the same conditions), (b) the normalized deformation in zone 2: D ˜ = D ¯  T-rRBCs/ D ¯  hRBCs for ULC and D ˜ = ∆DT-rRBCs/∆DhRBCs for OWC. Each data value represents roughly 15 cells. Error bars represent standard deviation.
Proceedings 01 00512 g002
Figure 3. (a) Representation in boxplots of the deformation index at the exit Dout for hRBCs and T-rRBCs; (b) The slopes of the relaxation times curves 1/τ = f (V3).
Proceedings 01 00512 g003
Publisher’s Note: MDPI stays neutral with regard to jurisdictional claims in published maps and institutional affiliations.

