Review

Balance of Nitrate and Ammonium in Tropical Soil Conditions: Soil Factors Analyzed by Machine Learning

by
Risely Ferraz-Almeida
Departamento de Educação, Universidade do Estado da Bahia, Campus XIV, Conceição do Coité 41150-000, Bahia, Brazil
Nitrogen 2024, 5(3), 732-745; https://doi.org/10.3390/nitrogen5030048
Submission received: 26 June 2024 / Revised: 15 August 2024 / Accepted: 16 August 2024 / Published: 19 August 2024
(This article belongs to the Special Issue Soil Nitrogen Cycling—a Keystone in Ecological Sustainability)

Abstract

:
The nitrogen/N dynamic is complex and affected by soil management (i.e., residue accumulation and correction/fertilization). In soil, most of the N is combined with organic matter (organic forms), but the N forms absorbed by plants are ammonium/NH4+ and nitrate/NO3 (inorganic forms). The N recommendation for agriculture crops does not observe the N available in the soil (organic or inorganic), indicating a low efficiency in nitrogen management in soil. Based on the hypothesis that the stocks of NO3 and NH4 can be used as indicative of N status in soil but with high variation according to soil factors (soil uses and management), the objective of the study was to (i) analyze the balance of nitrate and ammonium in tropical soil with different uses and management and (ii) use machine learning to explain the nitrogen dynamic in soil and the balance of nitrate and ammonium. The results showed that soil N stocks and pH promoted the formation of three clusters with the similarity between Cluster 1 (clay texture) and Cluster 2 (loam texture), represented by higher contents of nitrate as a result of high nitrification rate and lower contents of ammonium in soil. Cluster 3 (sand texture) was isolated with different N dynamics in the soil. In agricultural soils, the content of NO3 tends to be higher than the content of NH4+. There is a high nitrification rate in clay soil explained by higher organic matter and clay content that promotes soil biology. Based on the results of machine learning, for clay and loam soil, the contents of NO3 can be used as indicative of N status as a final result of nitrification rate and higher variation in soil. However, in sandy soil, NO3 can not be used as indicative of N status due to N losses by leaching.

1. Introduction

Nitrogen (N) is a nutrient that plants need in the greatest quantities and most frequently limits plant growth and crop yields. Agricultural soils do not provide sufficient N to achieve higher crop production due to low organic matter stocks, mainly in tropical soils. An alternative to increase the level of N in the soil is human intervention with the application of N as fertilizers (organic or mineral). Positive effects of N fertilizers in sugarcane (Saccharum officinarum) [1], corn (Zea mays L.) [2,3], rice (Oryza sativa) [4], and other crops are demonstrated in the literature. In the last years, there has been a demand for nitrogen between 36,000 and 40,000 tons in agricultural lands, representing a constant increment [5]. Also, there is a tendency to increase N consumption in the next years with an increment of areas to produce food, fiber, and energy.
The main N mineral sources are found as amide, ammonium (NH4+), and nitrate (NO3). The amide is the base of N fertilizers more commonly used in the world, such as urea (CO(NH2)2), with 45% of N in the formulation. When applied in soil, the amide is converted to nitrate or ammonium by urease (enzyme), which hydrolyzes the urea to convert into NH4+ and NO3 releasing an OH and promoting an increase in soil pH and N loss by volatilization of ammonia (NH3) [6]. However, even with this N loss, urea is the N mineral fertilizer most used due to the smaller market nitrogen cost per kg.
Nitrate and ammonium sources are the second basic sources of N in agriculture, with a natural flux between ammonium and nitrate in the soil [7]. The source of nitrate usually applied in agricultural soil is calcium nitrate with a higher N use efficiency due to the absence of N losses by NH3. In general, the mineral N fertilizers present a low N use efficiency (i.e., an average of 50% in the production of grains [8,9] and an average of 17–41% in the production of sugarcane [10]). In soil, the N losses are associated with ammonia volatilization [6], nitrous oxide emission [11], and nitrate leaching [12]. Alternative N sources are requested to increase the N use efficiency with the adequate use of the 4R principles (right source, right rate, right time, and right place) to achieve efficient use of resources with harmony between the economy, environment, and society.
In soil, the N dynamic is complex and is affected by soil management (i.e., residue accumulation, soil correction, and fertilization). The main soil N reserves are mainly found as organic N, explaining the direct influence of organic matter on soil N dynamics [13]. For example, about 90% of N is organically combined on the soil surface [14]. Ferraz-Almeida et al. [15] showed that in agriculture and forested soil, the pools of labile and recalcitrant carbon and nitrogen are higher on the soil surface due to the accumulation of residues. On the soil surface, there is a high correlation between the pools of carbon and nitrogen [14,16,17]. Li et al. [18] classified the N in soil according to availability (labile pool and stable pool) and chemical components (i.e., hydrolyzable and non-hydrolyzable, ammonia, amino acid, and amino sugar). The labile pool and a recalcitrant pool are two important constituents of total organic carbon; (i) the labile pool is classified as the most sensitive C pool, (ii) while the recalcitrant fraction is characterized as the least sensitive and least altered by organic C gains or losses [14,15]. Wendling et al. [16] also classified the soil N in the labile pool and stable pool to explain the inputs and variations of N in agricultural soil. The main forms of organic N are the amino acid, followed by non-hydrolyzable, and amino sugar [18]. In contrast, the main forms of inorganic N in the soil are found as NO3 and NH4+. Even when applied as organic forms, the organic N is converted into NO3 and NH4+ for plant absorption. There is no clear evidence of the absorption of organic N by plants, which explains the need to convert organic forms into NO3 into NH4+.
Based on the hypothesis that the stocks of NO3 and NH4 can be used as indicative of N status in soil but with high variation according to soil factors (soil uses and management), the objective of the study was to (i) analyze the balance of nitrate and ammonium in tropical soil with different uses and management and (ii) use machine learning to explain the nitrogen dynamic in soil and the balance of nitrate and ammonium.

2. Material and Methods

2.1. Study Characterization

The design of the study was based on the contents of ammonium and nitrate in cultivated soil with soybean (Glycine max), wheat (Triticale sp.), corn (Zea mays), sugarcane (Saccharum officinarum L.), and forest (Cerrado) with different soil textures (clay, sandy, and loam) in tropical conditions. Soils were classified as sandy, loam, and clay textural classes according to the textural triangle. The FAO soil classification system was used to classify the soils as Arenosols (sandy), Ferralsols (clay and loam), and Cambisol (loam).
The soils were collected in the field and analyzed in the laboratory, monitoring the nitrogen (N-NO3 and N-NH4+) and soil pH. The soil pH was determined by extraction using CaCl2 solution (0.01 M) and determined by combining electrodes. The N-NO3 and N-NH4+ were determined by high-pressure liquid chromatography [19].
The dataset presented a total of 1278 observations distributed for sandy (342 observations), loam (342 observations), and loam soil (594 observations). Part of this dataset was obtained from the literature [20,21,22,23], and the other part from our laboratory archive. All data were selected based on the same soil management with alteration just on soil uses.
Data on N recommendations and expected productivity for sugarcane, corn, and wheat productions were monitored in the manual of fertilization recommendations in Brazil [24]. The expected and recommended N ratio (ERN) was calculated based on expected productivity and N recommendation using Equation (1).
E R N = E P R N
where ERN = expected and recommended N ratio, EP = expected productivity, and RN = recommended N.

2.2. Data Analysis

The quality of the dataset was tested using data normality (Shapiro–Wilk test; p < 0.05) and homogeneity of variance (Bartlett test; p < 0.05). The variability of the studied properties was previously evaluated using descriptive statistics calculating the average, variation (%), and minimum and maximum values.
The data on NO3, NH4+, and pH were analyzed through machine learning using the k-means clustering algorithm (unsupervised learning). The data were separated into 3 clusters by the Silhouette method, which is based on the comparison of tightness and separation. The distances between the observations and clusters were calculated with the Euclidean distance. A total of 1278 observations were tested in the k-means clustering algorithm. This algorithm groups points into clusters by minimizing the distances between each point and its cluster’s centroid. Previous studies have used this algorithm with excellent results to determine the influence of land management and use on soil nutrient supply [13].
Subsequently, the variables were also subjected to multivariate exploratory analysis by hierarchical clustering. A similarity matrix was constructed with the Euclidean distance and the connections of the clusters were conducted with the Ward method. In this method, the distance between two groups is defined as the sum of squares between the two groups through all variables. The Euclidean distance among access to the set of variables was calculated, distinguishing between soil textures and exposing the group structure contained within the data in a dendrogram.
The correlation between soil texture and the processes of nitrification was calculated based on the distribution of sand, silt, and clay using the Correlation of Pearson (p < 0.5). To explain the N dynamic in the soil, schemes were added focusing on (i) the distribution of water and air in the soil profile (aerobic and anaerobic conditions) and (ii) the process of nitrification divided into two steps (conversion from ammonium to nitrite, and conversion from nitrite to nitrate).
All statistical analysis was performed in R (version 4.0.0; R Foundation for Statistical Computing, Vienna, Austria) and Python (version 3.8.3; Python Software Foundation, Wilmington, DE, USA).

3. Results and Discussion

3.1. Cluster Formation

The dataset of soil textures, N stocks, and pH promoted the formation of a one-dimensional plane represented by dimension 1 (total of 28.8) and dimension 2 (39.4%) and a total of 68.2% of the variability. The dataset was separated into three clusters accounting for a total sum of squares of 68.2%, separated into Cluster 1 (sum of squares = 578.24), Cluster 2 (sum of squares = 232.21), and Cluster 3 (sum of squares = 237.77), with a total of observations respectively of 252 (Cluster 1); 126 (Cluster 2); 126 samples (Cluster 3) in each cluster (Figure 1 and Figure 2 and Table 1).
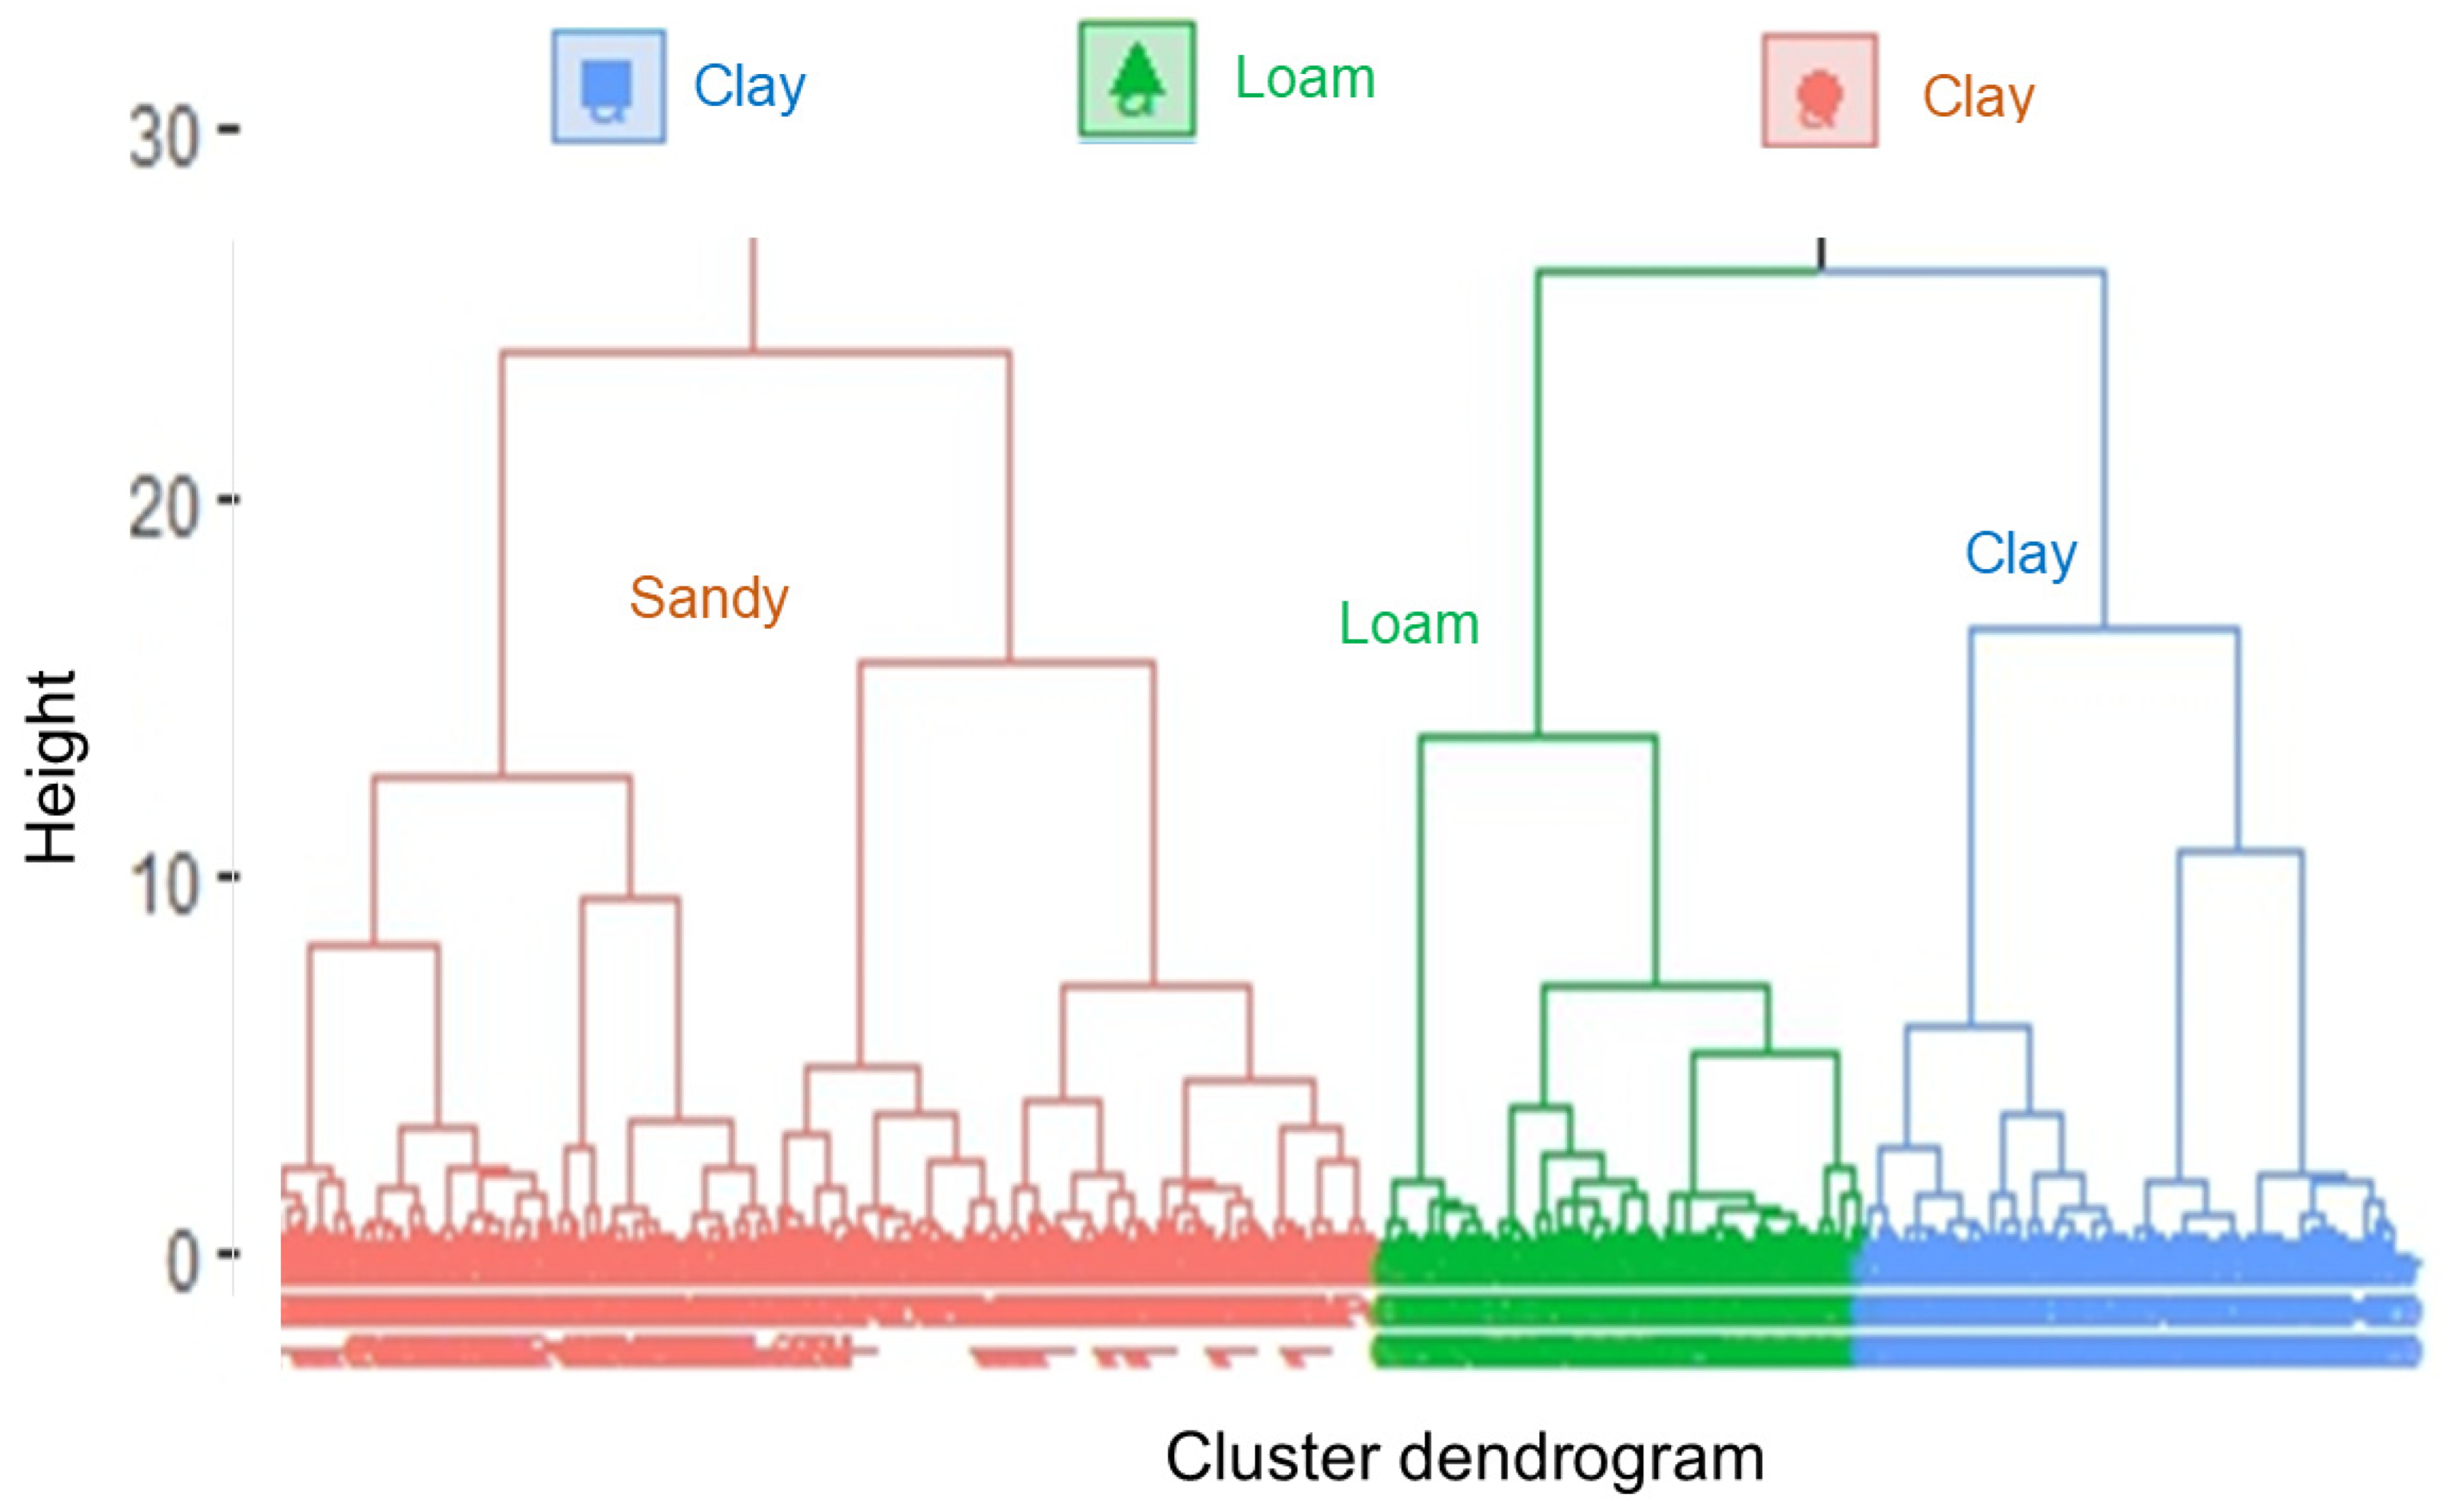
The sandy soil was isolated in Cluster 1 with higher values of NH4+ (57.0 mg kg−1) and lower values of NO3 (=36.4 mg kg−1) with pH ranging from 5.9 to 6.8 (Table 1). In the Cluster dendrogram, the sandy soil was also isolated from the other soil textures (clay and loam soil), Figure 2.
Clay and loam soils present similar characteristics and can be classified as soils with a high nitrification rate demonstrated by higher averages of NO3 (clay = 104.2 mg kg−1; loam = 94.5 mg kg−1), which was converted from the ammonium to nitrate (Table 1).
The high variation in the contents of ammonium and nitrate in sandy, loam, and clay soil also demonstrated the intensity of the nitrification rate. These results are explained by higher organic matter and clay contents that promote soil biological activities, mainly in clay soil (Table 1).

3.2. Expected and Recommended N

The N recommendations for main crop production are based on the expected productivity of crops without monitoring of N stocks in the soil. For sugarcane with an expected productivity of 100 Mg of stalk/ha−1, there is a recommendation of 120 kg N/ha−1, while for corn and wheat with the expected productivity of 3 and 3 Mg of stalk/ha−1, there is a recommendation of 60 and 40 kg N/ha−1, respectively (Figure 3).
The efficiency of N use in sugarcane is higher compared to corn and wheat, where to produce 0.8 Mg/ha−1 of stalks is requested 0.8 kg N/ha−1. For corn and wheat, the same N recommendation produces an average of 0.1 Mg/ha−1 of grains (Figure 1). These data indicate that there is a high N consumption for grain production with lower efficiency of use compared with sugarcane in Brazil. The high N consumption for grain production is also used for corn production in the United States of America, with an N consumption between 50 and 70 kg N ha−1 [7]. The N dynamic and stocks in the soil are challenges due to the high influence of organic matter and the variation of chemical forms of nitrogen [25,26].
The accumulation of crop residues on the soil surface can also act as a source of N to successive crops, mainly to crop residues with high N content (i.e., soybean, and bean). Ferraz-Almeida et al. [25] showed a mean increase in 90% of the total soil N with the accumulation of soybean residue in the soil. Infield, Risi et al. [27], and Torres et al. [28] also showed a positive impact of cover crops (soybean and sunn hemp) in corn production as a result of N content in soil from the legume residues. However, organic nitrogen is not usually countable in the N recommendation of nitrogen in agriculture. Based on this perspective, this study aims to review the latest advances in the balance of nitrate and ammonium in soil and see how far the soil characteristics help to understand that balance.

3.3. Routes of Nitrate and Ammonium in Soil

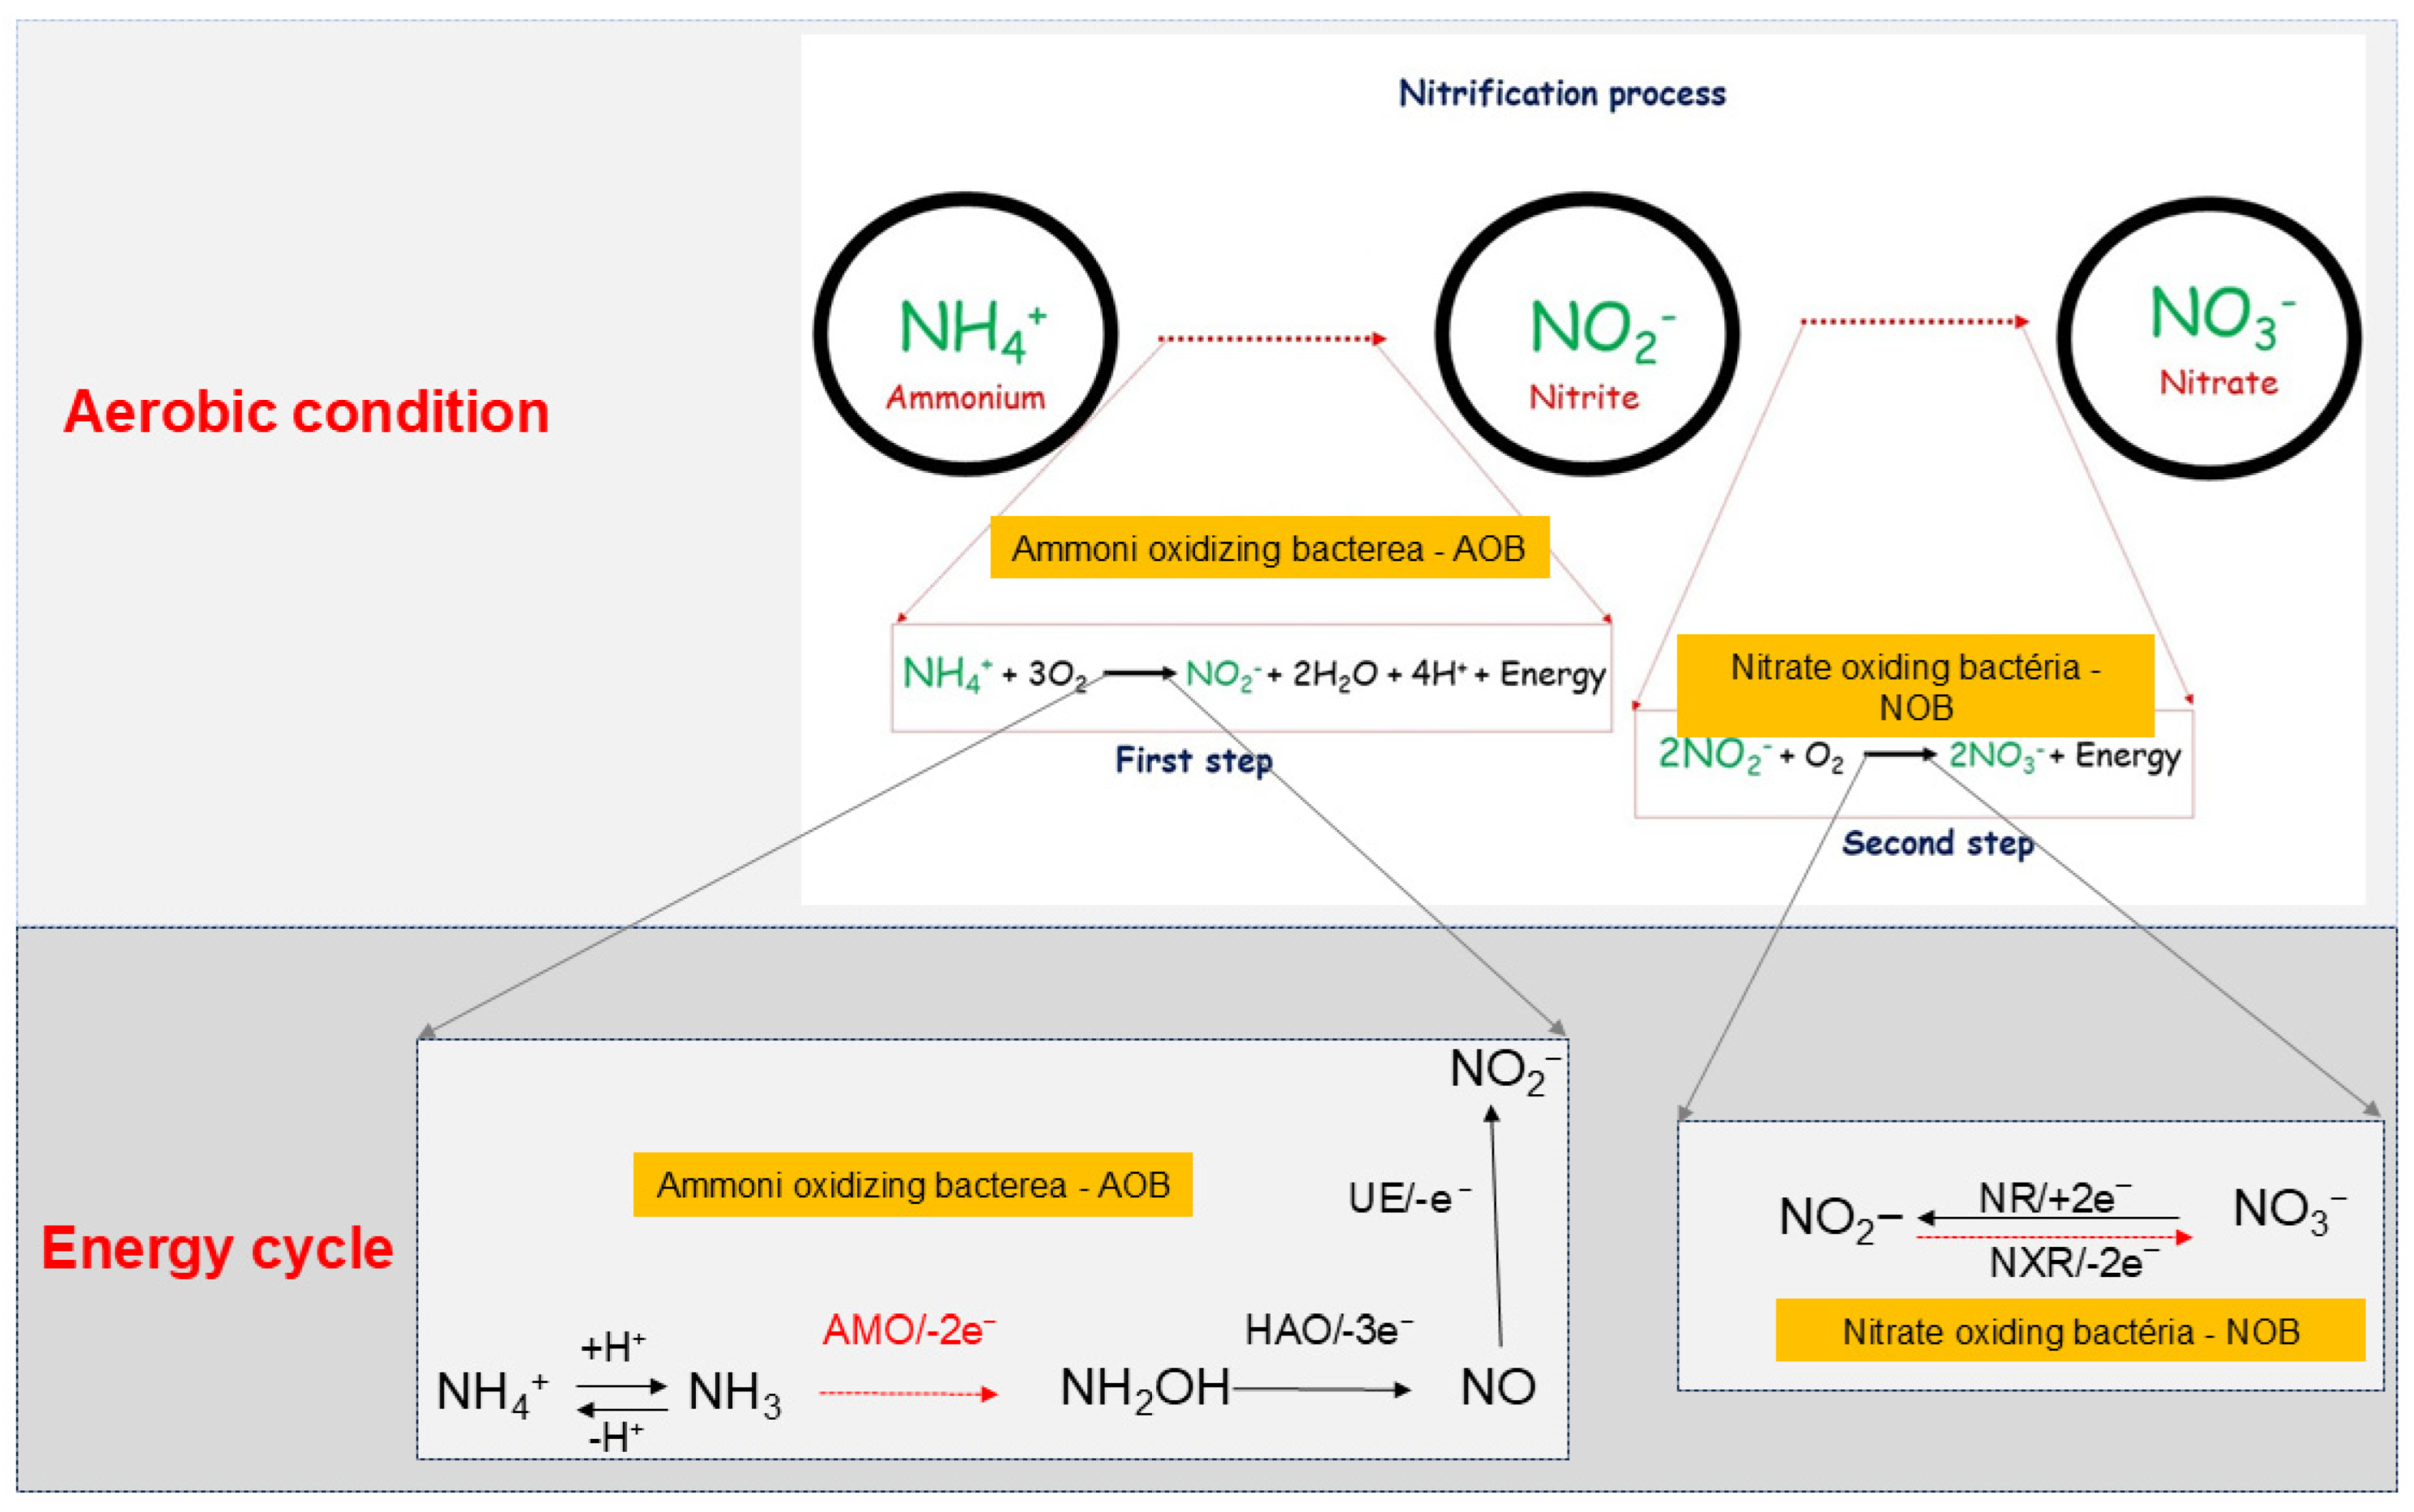
The nitrate (NO3) and ammonium (NH4+) balance in the soil is controlled by the nitrification process with the conversion of ammonium to nitrate by soil microorganisms (Figure 4).
The nitrification can be separated into two steps in soil: (i) the conversion of ammonium to nitrite and (ii) the conversion of nitrite to nitrate. The bacteria that carry out nitrification can be separated into two groups: ammonia-oxidizing bacteria (AOB, such as Nitrosomonas, Nitrosococcus, and Nitrosospira) typically oxidize NH3 to NO2, and nitrite-oxidizing bacteria (NOB; such as Nitrobacter, Nitrococcus, Nitrolancetus, Nitrospina, Nitrospira), with Nitrosomonas europaea being the most studied in ammonia oxidation (Figure 4).
Nitrification is classified as a common soil process with a rapid (days and weeks) conversion of NH4+ to NO3 [29]. In nitrification, both the first and second steps require aerobic conditions with adequate supplement of water in the soil (Figure 2). In the first step, there is the production of 4H+ that promotes acidification in soil. Qiu et al. [30] showed that soil acidification is derived from the conversion of ammonium to nitrite and the absorption of cation over anion uptake by plants during nitrification. Both soil reactions are considered the major processes that lead to soil acidification.
The NH4 + and NO3 are ions in soil solution and act on soil colloids (clay and organic matter). The NH4+ is a cation (positive charge) that can be fixed on negatively charged clay surfaces and functional groups of organic matter [31]. On the other hand, NO3 is an anion (negative charge) that, generally, can be leached in the soil causing environmental damage and decreasing the N efficiency use.
Tropical soils are characterized by the predominance of positive charge on the clay surface, promoting the immobilization of NO3. For example, de Oliveira Junior et al. [32] demonstrated a low NO3-leaching in sugarcane areas in Brazil due to the predominance of positive charges in a tropical oxisol with a high N’s extraction by the crop. Nyamangara et al. [33] measured the NO3-leaching in sandy soil from Africa’s tropical and subtropical regions and noticed a low N loss by leaching with mineral application mineral and organic fertilizers.
The decrease of N losses with adding organic matter is probably associated with the increase in soil charge; thus, the organic matter is an important organic colloid in soil with positive and negative charges. Commonly, there is a high NO3-leaching in humid temperate regions with the application of manure and inorganic fertilizers [34]. In tropical soil, phosphor can also be adsorbed on the surface of clay due to the predominance of positive charges on the clay surface and low organic contents [35,36].

3.4. Soil Water on Nitrate and Ammonium Balance

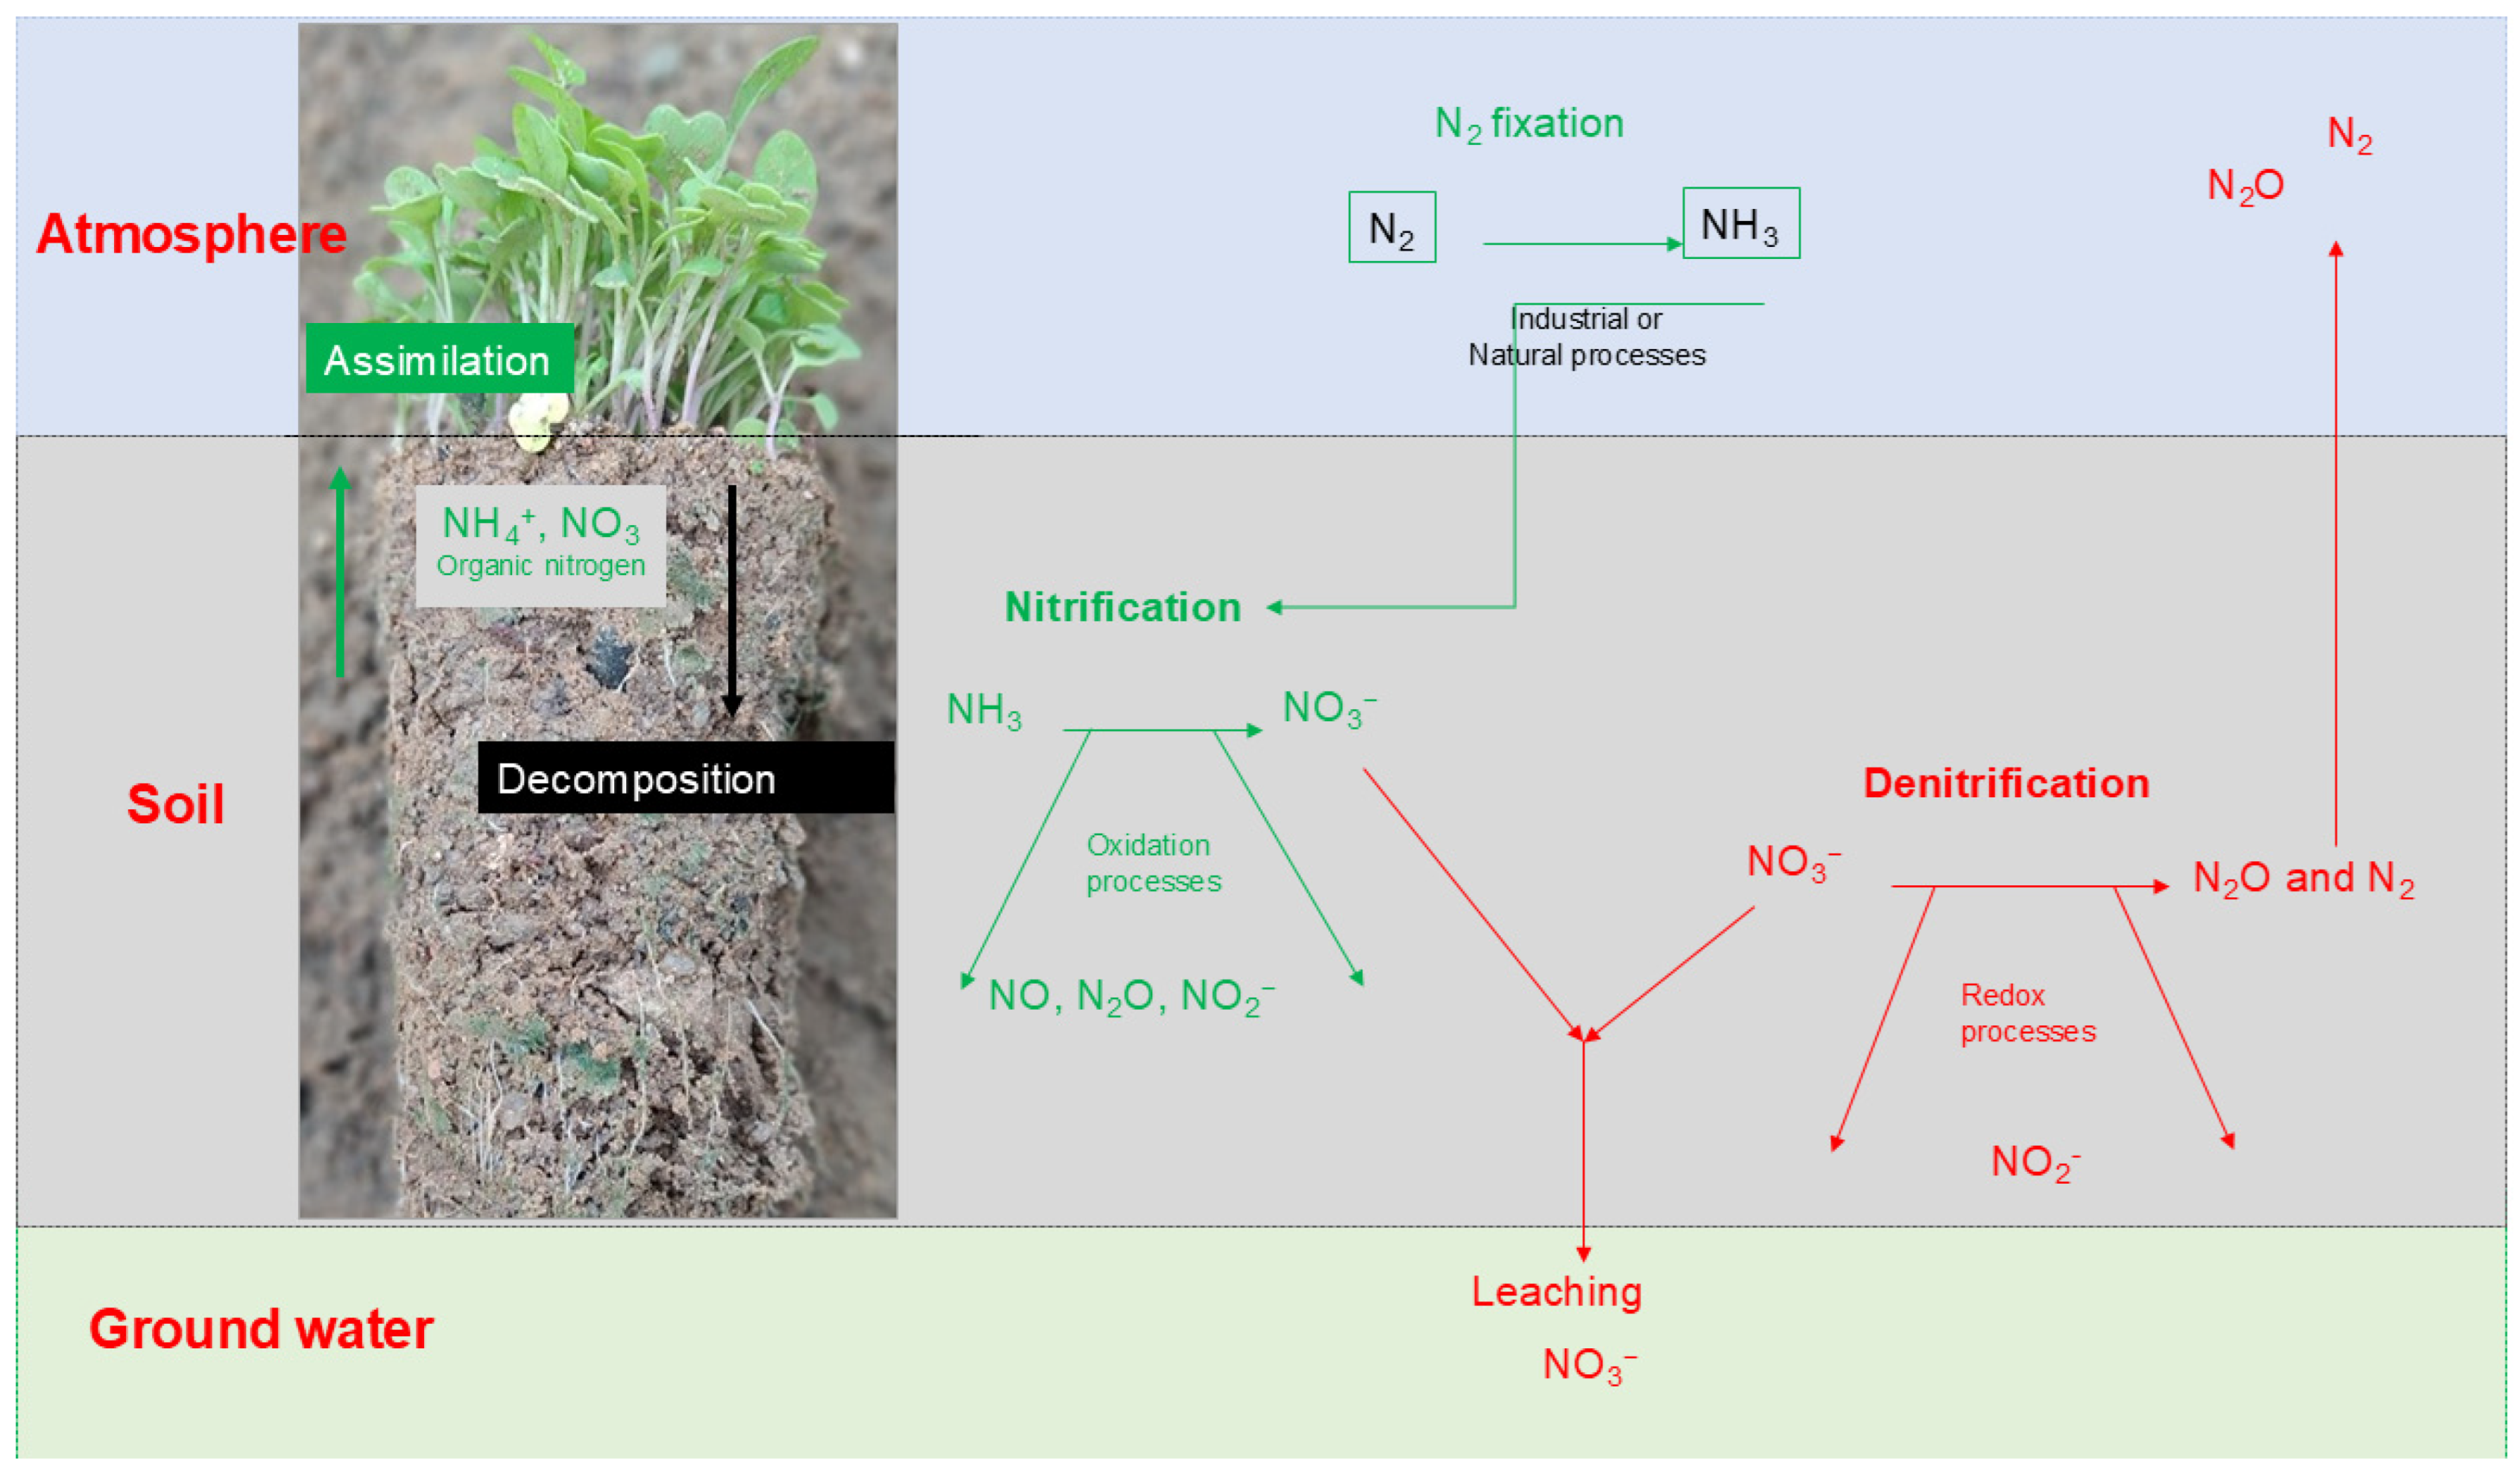
From a volume perspective, the pore volume is one of the soil factors that control the process of nitrification and denitrification in soil. When there is an aerobic condition with the adequate distribution of water and air in pores (up to 50% of the soil pore space filled with water), nitrification occurs caused by the proliferation of aerobic microorganisms that oxidize the NH4+ into NO3. In contrast, the anaerobic condition is caused by the increase of water in the soil, decreasing the oxygen in pores (>75% of the soil pore space filled with water) and promoting the proliferation of anaerobic microorganisms with the production of nitrous oxide (N2O), Figure 5.
In both routes, there are N losses by N oxides (N2O, NO), but during nitrification, the N lost as N2O rarely exceeds 2–4% of the total N nitrified [37]. Therefore, the major pathway to the emission of N2O is the anaerobic conditions with an N loss between 60 and 80% of the NO3 lost as N2O, NO, and N2 [11]. Denitrifying bacteria comprise about 0.1 to 5% of the total soil microorganism population, identified as denitrifying microorganisms (i.e., bacteria Thiobacillus denitrificans, Alcaligenes eutropha, and Paracoccus denitrificans), characterized as heterotrophic and belong to Proteobacteria and autotrophic. According to IPCC [38], there is a direct N2O emission with the application of mineral N fertilizer, with the emission of approximately 10 kg N2O for every ton of nitrogen fertilizer applied.
Agriculture also is responsible for global greenhouse gas emissions, with approximately 14–17% of global anthropogenic emissions [39]. In agriculture, the main source of N2O emission is from synthetic fertilizers, manure, and crop residues left on soil, with an average of 40% of total agricultural emissions [26].
In soil, the higher N2O peaks occur when there is an anaerobic condition caused by the water (H2O) and N in the soil, fulfilling two conditions: (i) low content of O2 (with approximately 70% of porous material filled by water) and (ii) a sufficiently high stock of NO3 [11]. Therefore, anaerobic conditions are requested for N2O emission, but it is controlled by organic matter mineralization rate and N mineral fertilizers [40]. Reay et al. [41] showed that the mitigation of anthropic N2O emission is requested to improve nitrogen-use efficiency in agricultural production, mainly in future scenarios with an increase in food demand and N consumption. Also, there is direct N2O emission from the soil; however, it is considered low when there is a low N content in the soil.
The high accumulation of crop residues on the soil surface also impacts the N use efficiency: (i) residues with a high C:N ratio (i.e., sugarcane and pasture residues) decrease the N use efficiency due to the N immobilization and losses; (ii) residues with low C:N ratio can be considered as N sources due to high N content and rapid mineralization [20]. Studies by Joris et al. [42] showed that in sugarcane areas with residue accumulation the N immobilized can be considered as slow N sources when there is a constant N input. The increase in net mineralization of high C:N residues by long-term synthetic N fertilization is well documented in the literature [43,44]. The input of N in the soil also tends to stimulate soil organic matter decomposition, which is called the soil priming effect, characterized as a strong short-term change of organic matter decomposition that can accelerate or retardate residue decomposition and release or immobilize a large amount of carbon and nitrogen [45].

3.5. Nitrate and Ammonium Contents in Agricultural Soil

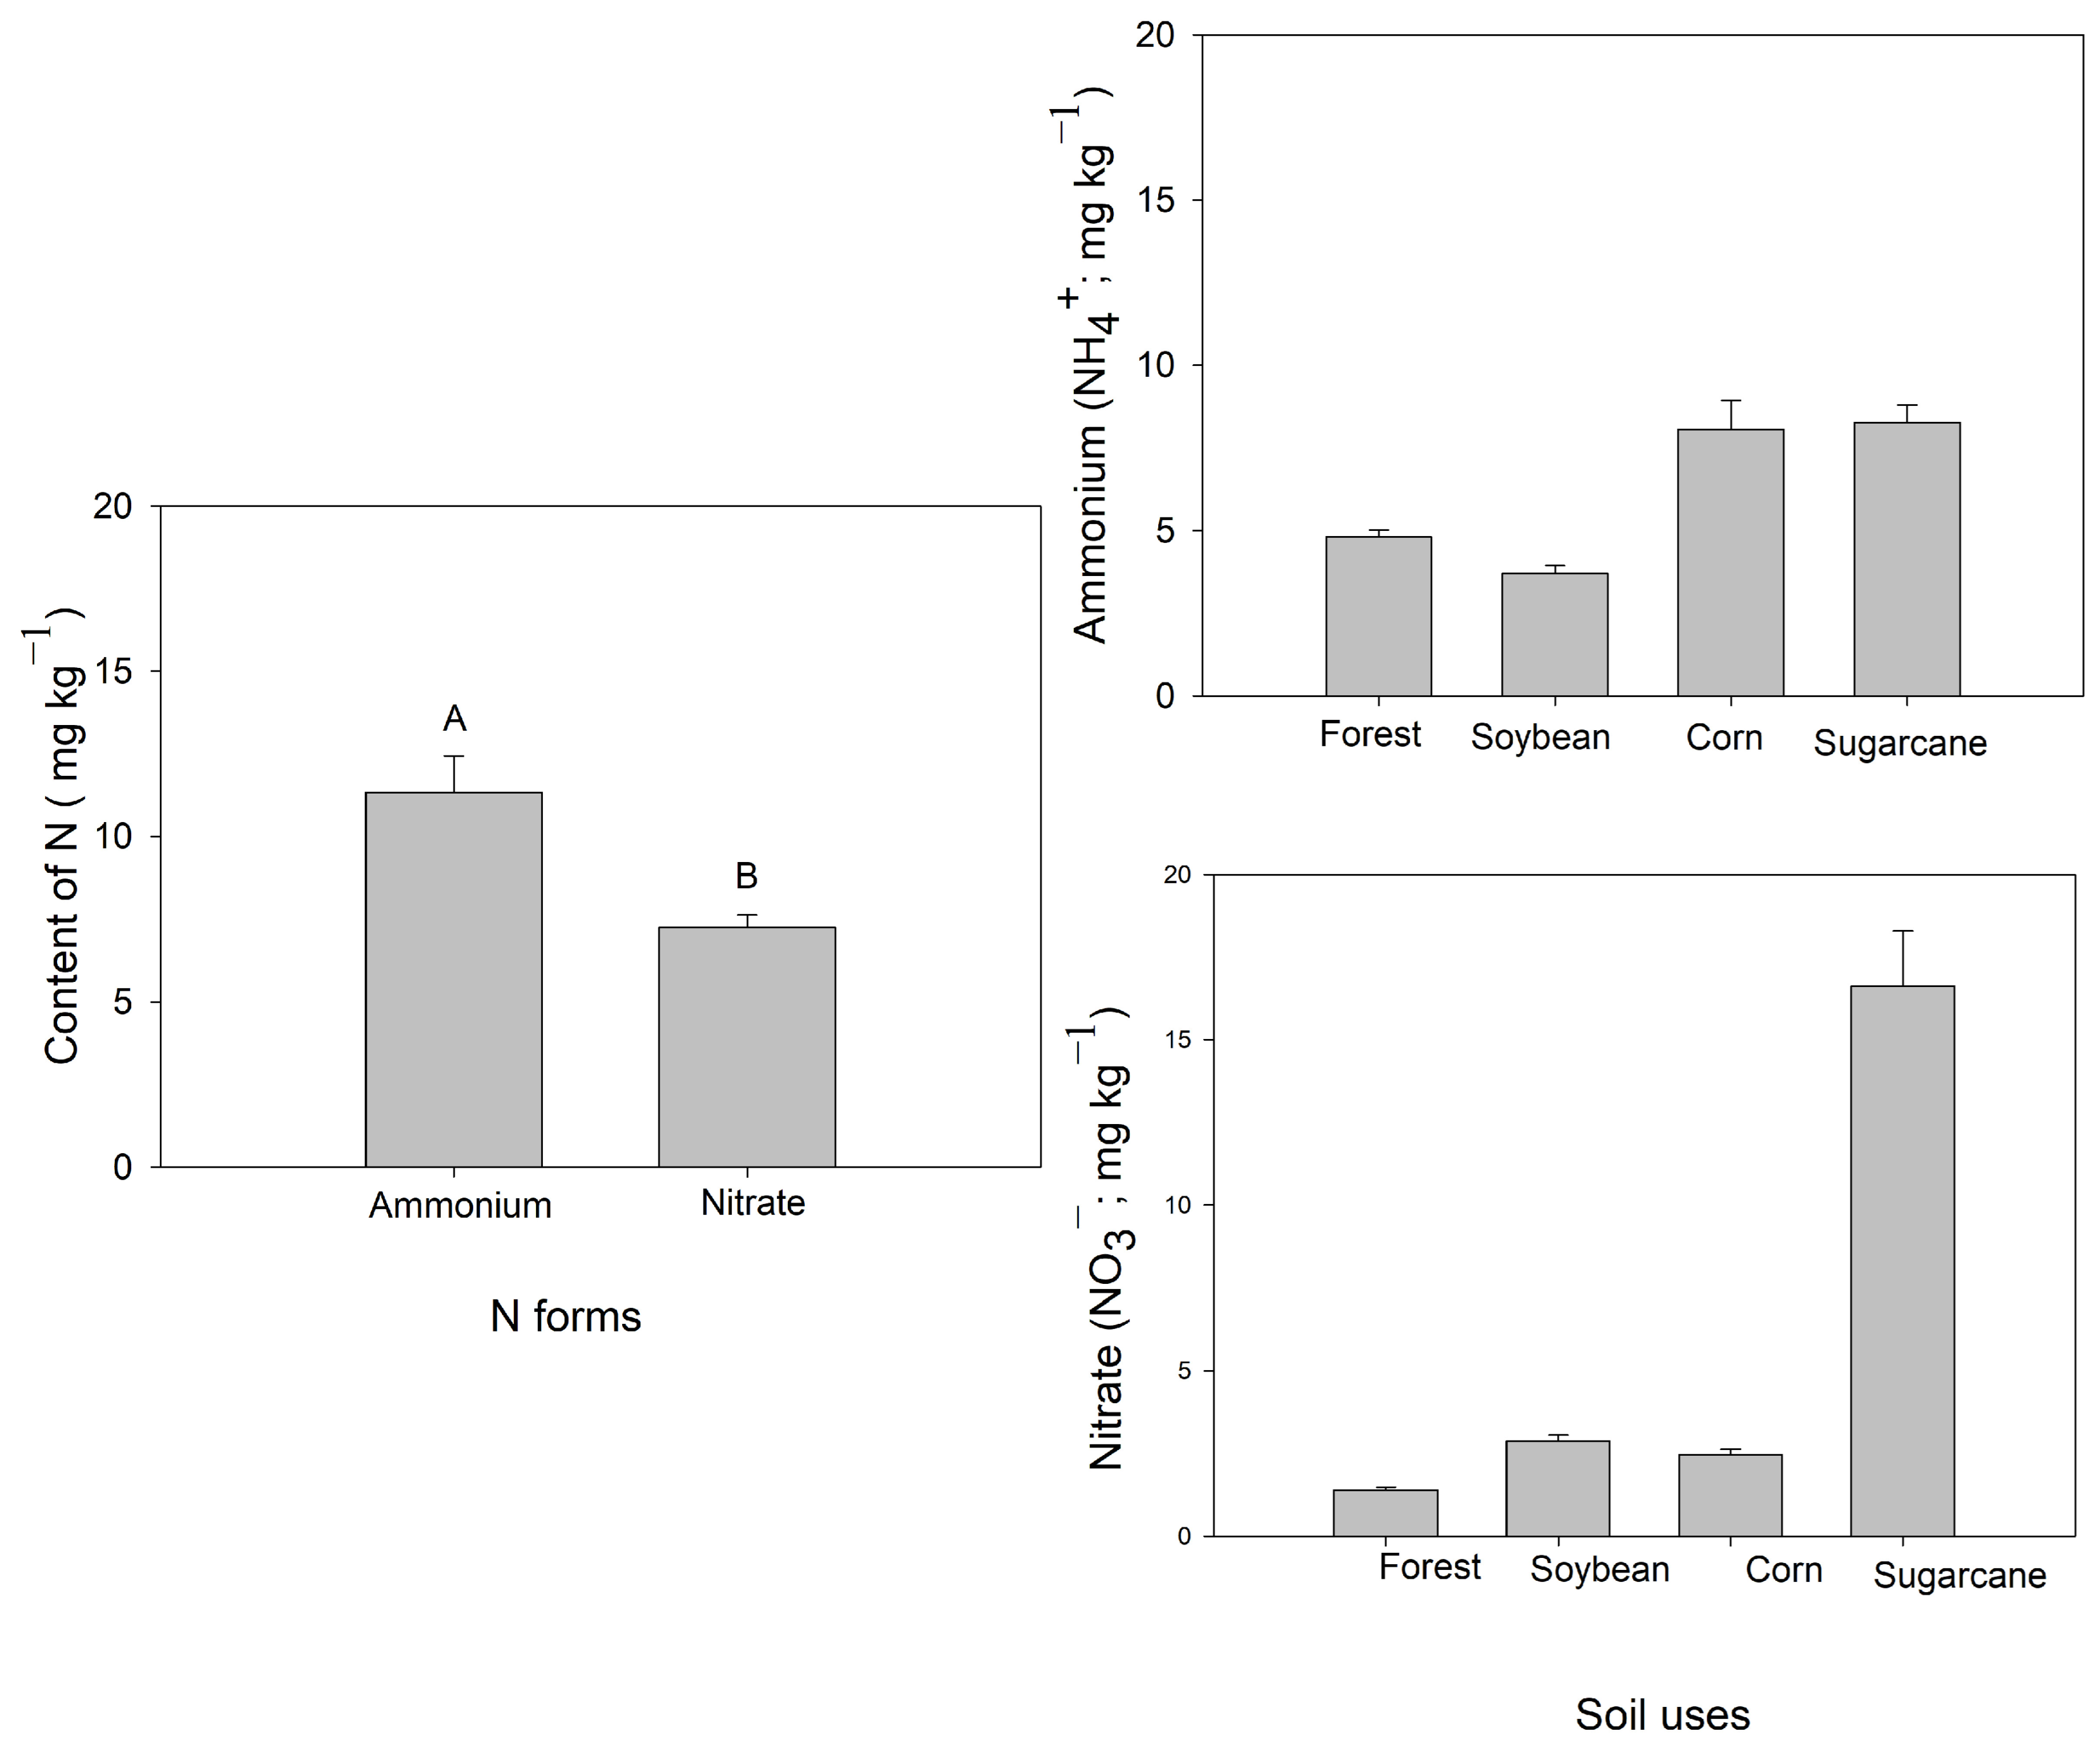
In tropical soil, the content of NO3 was higher than the content of NH4+, with an average increase of 35% represented by an average of 11.3 mg kg−1 (NO3) and 7.2 mg kg−1 (NH4+) with all soil uses, except for the sugarcane areas (Figure 6).
Sugarcane presented higher contents of NO3 (average = 16.5 mg kg−1) compared with NH4+ (average = 8.2 mg kg−1). In soybean, the contents of NH4+ (=3.7 mg kg−1) were higher than NO3 (=2.9 mg kg−1), as well as the contents of NH4+ for corn (average; NH4+ = 8.0 mg kg−1; NO3 = 2.5 mg kg−1), and forest areas (average; NH4+ = 4.8 mg kg−1; NO3 = 1.2 mg kg−1), Figure 4.
Ma et al. [46], monitoring the stocks of ammonium and nitrate in forest soils of Mount Wuyi, China, also noticed a higher nitrate content than ammonium in soil due to the metabolization of tannin in plant leaf litter caused by the secondary plant that reduced the rate of NH4+ more than for NO3 in soil. In contrast, Li et al. [47] showed that the NH4+ concentration in soil tended to be higher than the NO3 concentration in the forest, while in the mixed forest, there was an inverse with a higher NO3 compared to NH4+ concentration.
González-Pedraza et al. [20], monitoring the seasonality of precipitation on contents of NH4+ and NO3 in a Dry Tropical Forest Area in the Western Llanos of Venezuela, showed there was a significant difference in the content of NH4+ with higher content in the end rainy season followed by the dry and early seasons. In contrast, the content of NO3 was higher in the dry season, followed by the end and early rainy seasons. Do Vale et al. [21] noticed that in the sugarcane area, the concentration of NO3 was higher (up to 14%) than the NH4+ concentration with the application of ammonium nitrate (35% of N). These studies demonstrate that the abundance of NH4+ and NO3 is related to organic matter content, the N inputs in soil, and the dynamic of soil use, explaining these variations in content and predominance of NO3 or NH4+ in soil.
The stocks and balance of NH4+ and NO3 in the soil also are explained by the N absorption of plants. Plants can absorb the N as NH4+ and NO3, but plants can absorb a limited proportion of NH4+ due to toxicity [48]. For example, in hydroponic production, the balance between NH4+ and NO3 is essential because NH4+ is a better alternative to control pH in the nutrient solution. Andriolo et al. [49] showed that higher NH4+ concentrations (higher than 9–12%) in the nutrient solution promoted plant water flux restrictions and reduced roots and the number of leaves of lettuce plants.
Some plants are most sensitive to NH4+ toxicity (i.e., citrus species [50], tomato [51], potato [52]), while other plants are considered more adapted to NH4+ (i.e., domesticated species such as rice). Sugarcane is an example of a plant that prefers NH4+ as a source of N with a positive impact on plant development [53]. Rashti et al. [54] and Boschiero et al. [55] showed a difference in N assimilation as NH4+ and NO3 in sugarcane, requiring different amounts of energy and reduction of chloroplast in the plant. Robinson et al. [56] showed that sugarcane presented a low capacity to store nitrate in shoots, indicating rapid assimilation of nitrate in shoots and low nitrate uptake. Boschiero et al. [57] showed that the uptake of NH4+ is faster than NO3, explaining the rapid N assimilation by sugarcane and suggesting that the term “preference” should be used cautiously to avoid misinterpretation. Comparing the N mineral sources, the application of ammonium nitrate (both NH4+ and NO3) presented a higher N utilization (60%) than urea to sugarcane development [55].
Corn is an example that can absorb both ammonium and nitrate forms. In contrast, the application of a source of N as nitrate promotes a superior response on growth compared to ammonium due to the deleterious effect of ammonium on the growth and condition of the root system [43]. Uptake and assimilation of ammonium-N and nitrate-N influenced the growth of corn directly. When both nitrate-N and ammonium-N were supplied, the two forms presented similar uptake rates, but the ammonium is used preferentially to synthesize amino acids and protein [57]. Tills and Alloway [48] noticed that the weight gain of shoots and roots was decreased in the order of NO3 > NH4+/NO3 > NH4+. Some agriculture crops (i.e., rice) request management systems to apply NH4+ to avoid N losses by oxide nitroso.

3.6. Correlation between Soil Textures and the Processes of Nitrification

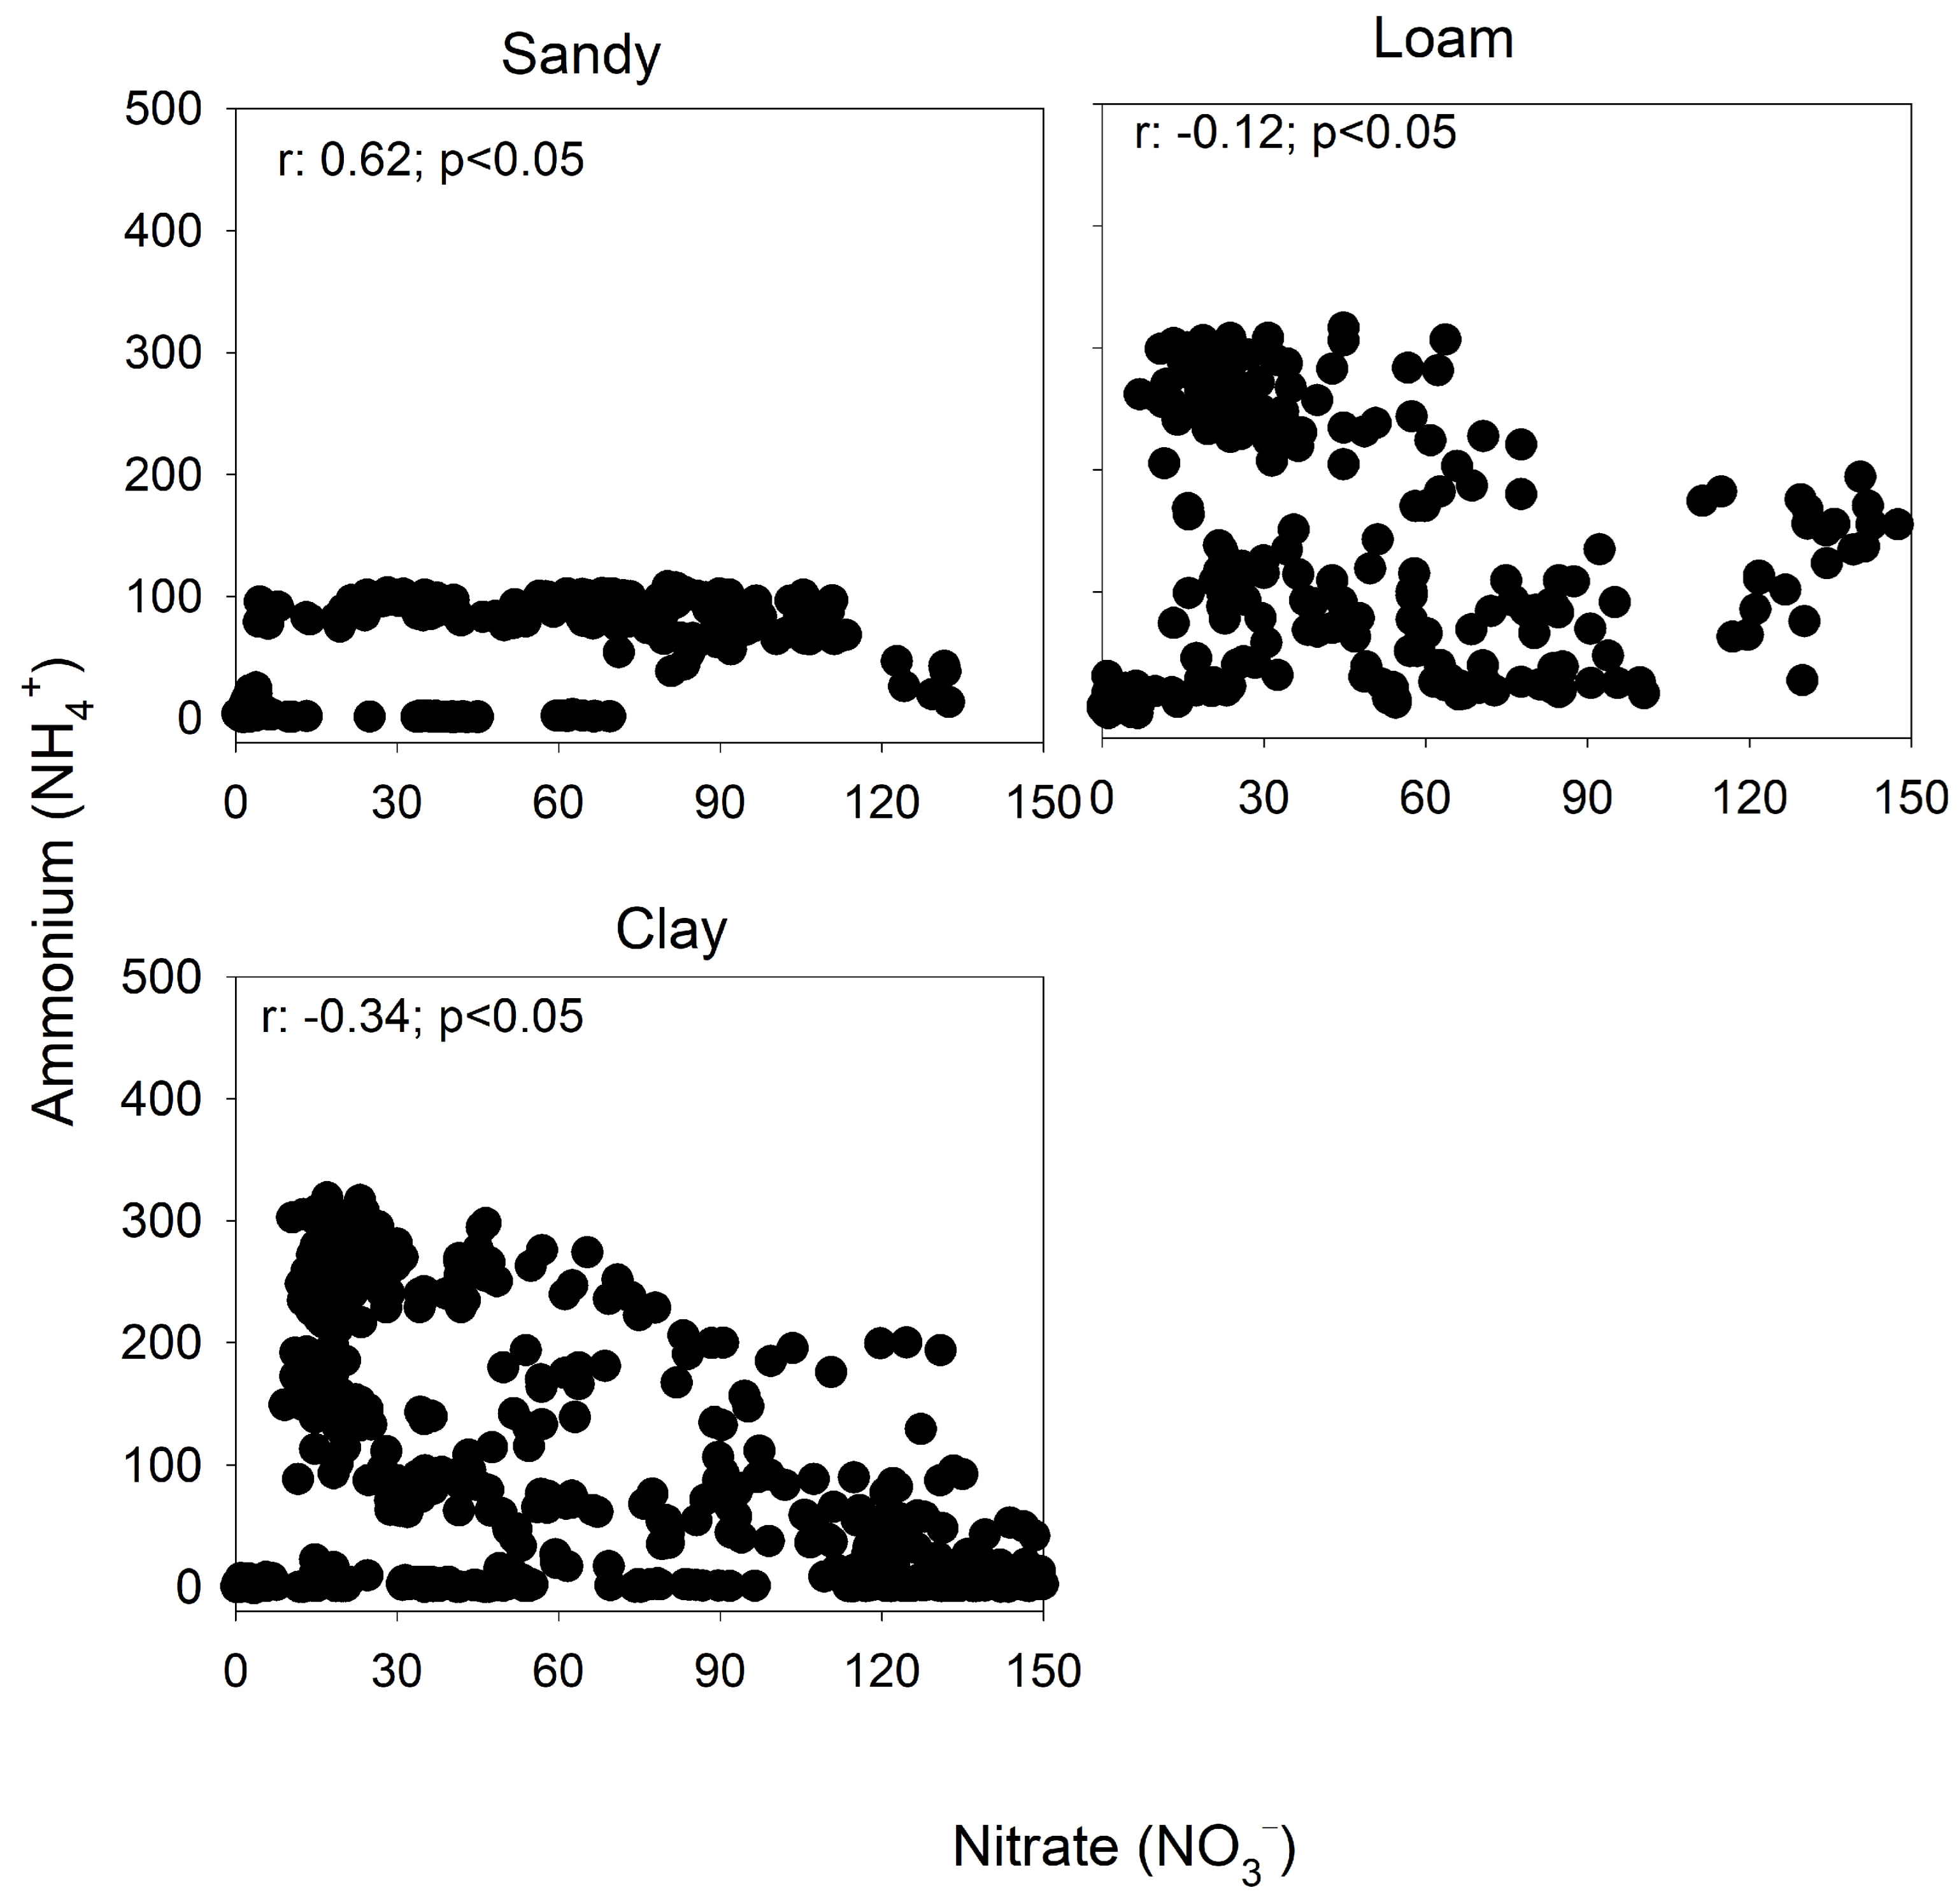
There was a variation in the nitrification caused by the soil texture, indicating that the soil texture directly influences the N dynamic in soil. In sandy soil, there was a positive correlation between NH4+ and NO3 (r: 0.62; p < 0.05), indicating that the increase of NH4+ contributes to an increase in the content of NO3. In loam and clay soils, the flux is inverse while the increase of NO3 reduces NH4+ represented by a correlation of −0.12 (loam soil) and −0.34 (clay soil), Figure 7.
In sandy soil, there is a greater movement of NO3 with inputs of N mineral fertilizers caused by high mass flows [58]. In addition, NO3 movement in sandy soil can be intensified by the excess inputs of water and successive N fertilization, promoting the N losses by leaching [59]. Comparing the dataset from clayey and sandy, the high nitrification rate in clayey soil is explained by higher organic matter and clay content that promote soil biological activities [60].
The alteration of soil pH from nitrification due to the release of H+ in the soil solution is the first step. Barth et al. [60] showed that in the sand-textured soil with the application of N mineral fertilizer, there was a higher NH4+ content with a difference and mean increase of 65% compared to clay-textured soil. As a result of the balance, the increase of NH4+ content in soil promoted a decrease in the content of NO3.

4. Conclusions

Soil textures, N stocks, and pH promoted the formation of a one-dimensional plane represented into three clusters with the similarity between Cluster 1 and Cluster 2 and represented by clay and sand textures with higher contents of nitrate as a result of high nitrification rate and lower contents of ammonium in soil. In agricultural soils, the content of NO3 tends to be higher than the content of NH4+. However, the abundance of NH4+ and NO3 is associated with the organic matter content, the N inputs in soil, the dynamic of soil uses, soil texture, and N absorption by plants. Based on the results of machine learning, for clay and loam soil, the contents of NO3 can be used as indicative of N status as a final result of nitrification rate and higher variation in soil. However, in sandy soil, NO3 can not be used as indicative of N status due to N losses by leaching. For future studies, algorithms with information on crop management and soil factors are requested due to the great variability in the balance of NH4+ and NO3 in the soil, which can help to improve N use efficiency and N recommendation in agriculture. The contents of NO3 can be used in the algorithms as indicative of N status as a final result of nitrification rate and variation in soil, mainly for the condition of clay and loam soils. The N recommendation in agriculture is based on the expected productivity of crops and does not consider the contents of nitrogen, organic, and/or inorganic, which demonstrate a low efficiency for the use of nitrogen. Therefore, the increase in the N use efficiency with the adequate use of the 4R principles (right source, right rate, right time, and right place) contributes to the adequate use of resources with harmony between the economy, environment, and society.

Funding

This research was funded by the Coordenação de Aperfeiçoamento de Pessoal de Nível Superior (CAPES; grant number, 88882.317567/2019-01).

Data Availability Statement

There are no data available.

Conflicts of Interest

The author declares no conflicts of interest.

References

  1. Otto, R.; Netto, G.J.M.S.; Ferraz-Almeida, R.; Altarugio, L.M.; Favarin, J.L. Multisite response of sugarcane to nitrogen rates and split application under Brazilian field conditions. Agron. J. 2020, 113, 419–435. [Google Scholar] [CrossRef]
  2. Altarugio, L.M.; Savieto, J.; Machado, B.D.; Migliavacca, R.A.; Almeida, R.F.; Zavaschi, E.; Carneiro, L.D.; Vitti, G.C.; Otto, R. Optimal Management Practices for Nitrogen Application in Corn Cultivated During Summer and Fall in the Tropics. Commun. Soil Sci. Plant Anal. 2019, 50, 662–672. [Google Scholar] [CrossRef]
  3. Faria, I.K.; Vieira, J.L.; Tenelli, S.; Almeida, R.E.; Campos, L.J.; Costa, R.V.; Zavaschi, E.; Almeida, R.F.; Carneiro, L.D.; Otto, R. Optimal plant density and nitrogen rates for improving off-season corn yields in Brazil. Sci. Agric. 2019, 76, 344–352. [Google Scholar] [CrossRef]
  4. Sun, R.; Zhu, X.; Wang, C.; Yue, J.; Pan, L.; Song, C.; Zhao, Y. Effect of NH4+ and NO3 cooperatively regulated carbon to nitrogen ratio on organic nitrogen fractions during rice straw composting. Bioresour. Technol. 2024, 397, 130316. [Google Scholar] [CrossRef] [PubMed]
  5. Food and Agriculture Organization of the United Nations. World Fertilizer Trends and Outlook to 2022; FAO: Rome, Italy, 2019. [Google Scholar]
  6. Gallucci, A.D.; Natera, M.; Moreira, L.A.; Nardi, K.T.; Altarugio, L.M.; de Mira, A.B.; de Almeida, R.F.; Otto, R. Nitrogen-Enriched Vinasse as a Means of Supplying Nitrogen to Sugarcane Fields: Testing the Effectiveness of N Source and Application Rate. Sugar Tech 2019, 21, 20–28. [Google Scholar] [CrossRef]
  7. USDA ERS. Fertilizer Use and Price; USDA ERS: Washington, DC, USA, 2020. Available online: https://www.ers.usda.gov/data-products/fertilizer-use-and-price/ (accessed on 1 August 2020).
  8. Biradar, S.S.; Patil, M.K.; Desai, S.A.; Singh, S.K.; Naik, V.R.; Lamani, K.; Joshi, A.K. Nitrogen use efficiency in bread wheat: Genetic variation and prospects for improvement. PLoS ONE 2024, 19, e0294755. [Google Scholar] [CrossRef]
  9. Ladha, J.K.; Tirol-Padre, A.; Reddy, C.K.; Cassman, K.G.; Verma, S.; Powlson, D.S.; Van Kessel, C.; de BRichter, D.; Chakraborty, D.; Pathak, H. Global nitrogen budgets in cereals: A 50-year assessment for maize, rice, and wheat production systems. Sci. Rep. 2016, 6, 19355. [Google Scholar] [CrossRef]
  10. Quassi de Castro, S.G.; Costa, V.E.; Quassi de Castro, S.A.; Carvalho, J.L.; Borges, C.D.; de Castro, R.A.; Kölln, O.T.; Franco, H.C. Fertilizer Application Method Provides an Environmental-Friendly Nitrogen Management Option for Sugarcane. J. Soil Sci. Plant Nutr. 2024, 24, 3195–3208. [Google Scholar] [CrossRef]
  11. Almeida, R.F.; Naves, E.R.; Silveira, C.H.; Wendling, B. Emissão de óxido nitroso em solos com diferentes usos e manejos: Uma revisão. Rev. Agronegocio Meio Ambiente 2015, 8, 441–461. [Google Scholar]
  12. Bruno, I.P.; Araújo, A.G.; Merten, G.H.; Ladeira, A.S.; Pinto, V.M. Crop Rotation and Nitrogen Fertilizer on Nitrate Leaching: Insights from a Low Rainfall Study. Nitrogen 2024, 5, 329–348. [Google Scholar] [CrossRef]
  13. Ferraz-Almeida, R.F.; Lopes, N.; Mota, R.; Wendling, B. Changing the sugarcane n credit and c fluxes in soil by the application of N-enhanced efficiency fertilizers. Compost Sci. Util. 2024, 31, 1–11. [Google Scholar] [CrossRef]
  14. Mikhael, J.E.R.; Almeida, R.F.; Franco, F.O.; Camargo, R.O.; Wendling, B. Recalcitrant carbon and nitrogen in agriculture soils with residue accumulation and fertilization under tropical conditions. Biosci. J. 2019, 35, 732–740. [Google Scholar] [CrossRef]
  15. Ferraz-Almeida, R.; Rodrigues Mikhael, J.E.; Oliveira Franco, F.; Fonseca Santana, L.M.; Wendling, B. Measuring the Labile and Recalcitrant Pools of Carbon and Nitrogen in Forested and Agricultural Soils: A Study under Tropical Conditions. Forests 2019, 10, 544. [Google Scholar] [CrossRef]
  16. Wendling, B.; Jucksch, I.; De Sá Mendonça, E.; De Almeida, R.F.; Alvarenga, R.C. Simulação dos estoques de Carbono e Nitrogênio pelo Modelo Century em Latossolos, no Cerrado Brasileiro. Rev. Cienc. Agron. 2014, 45, 238–248. [Google Scholar] [CrossRef]
  17. de Almeida, R.F.; Silveira, C.H.; Mikhael, J.E.; Franco, F.O.; Ribeiro, B.T.; de Siqueira Ferreira, A.; de Sa Mendonca, E.; Wendling, B. CO2 emissions from soil incubated with sugarcane straw and nitrogen fertilizer. Afr. J. Biotechnol. 2014, 13, 3376–3384. [Google Scholar]
  18. Li, S.; Wang, X.; Hui, Z.; Miao, Y.; Li, S. qing. Soil Organic Nitrogen and Its Contribution to Crop Production. J. Integr. Agric. 2014, 13, 2061–2080. [Google Scholar] [CrossRef]
  19. Vilsmeier, K. Bestimmung von Dicyandiamid, Nitrit und Nitratin Bodenextrakten mit Hochdruckflüssigkeitschromatographie. Z. Pflanz. Bodenkunde 1984, 147, 264–268. [Google Scholar] [CrossRef]
  20. González-Pedraza, A.F.; Dezzeo, N. Effects of land use change and seasonality of precipitation on soil nitrogen in a dry tropical forest area in the western llanos of Venezuela. Sci. World J. 2014, 2014, 514204. [Google Scholar] [CrossRef] [PubMed]
  21. do Vale, D.W.; Prado, R.D.; Cantarella, H.; Fonseca, I.M.; Avalhães, C.C.; Correia, M.A.; Barbosa, E.M. Ammonium and nitrate in soil and ratoon sugarcane grown in function of nitrogen on oxisol. J. Plant Nutr. 2013, 36, 201–213. [Google Scholar] [CrossRef]
  22. Barth, G.; Otto, R.; Almeida, R.F.; Cardoso, E.J.; Cantarella, H.; Vitti, G.C. Conversion of ammonium to nitrate and abundance of ammonium-oxidizing-microorganism in tropical soils with nitrification inhibitor. Sci. Agric. 2020, 77, e20180370. [Google Scholar] [CrossRef]
  23. de Oliveira, A.D.; Santos, I.; Figueiredo, C.; Malaquias, J.; Santos Júnior, J.D.; de Carvalho, A.M. Nitrato e Amônio no solo sob Plantio Direto; Anais de congresso (CPAC): Luis Eduardo Magalhães, Brazil, 2014; pp. 1–7. [Google Scholar]
  24. Cantarella, H.; Quaggio, J.A.; Mattos, D.; Boareto, R.; Raij, B.V. Boletim 110, Recomendações de Adubação e Calagem para o Estado de São Paulo; Instituto Agronômico de Campinas: Campinas, Brazil, 2022. [Google Scholar]
  25. De Almeida, R.F.; Silveira, C.H.; Mota, R.P.; Moitinho, M.; Arruda, E.M.; Mendonça, E.D.; La Scala, N.; Wendling, B. For how long does the quality and quantity of residues in the soil affect the carbon compartments and CO2-C emissions? J. Soils Sediments 2016, 16, 2354–2364. [Google Scholar] [CrossRef]
  26. Ferraz-Almeida, R.; Lopes, S.N.; Wendling, B. How does N mineral fertilizer influence the crop residue N credit? Nitrogen 2020, 1, 99–110. [Google Scholar] [CrossRef]
  27. Risi, F.G.E.; Hüther, C.M.; Righi, C.A.; Umburanas, R.C.; Tezotto, T.; Dourado Neto, D.; Reichardt, K.; Pereira, C.R. Sustainability Analysis of Nitrogen Use Efficiency in Soybean-Corn Succession Crops of Midwest Brazil. Nitrogen 2024, 5, 232–253. [Google Scholar] [CrossRef]
  28. Torres, J.L.R.; Pereira, M.G. Production and decomposition residue culture preceding corn and soybeans in the savannah oxisol miner. Comun. Sci. 2014, 5, 419–426. [Google Scholar]
  29. Bolan, N.S.; Hedley, M.J.; White, R.E. Processes of soil acidification during nitrogen cycling with emphasis on legume based pastures. Plant Soil. 1991, 134, 53–63. [Google Scholar] [CrossRef]
  30. Qiu, Y.; Zhang, Y.; Zhang, K.; Xu, X.; Zhao, Y.; Bai, T.; Zhao, Y.; Wang, H.; Sheng, X.; Bloszies, S.; et al. Intermediate soil acidification induces highest nitrous oxide emissions. Nat. Commun. 2024, 15, 2695. [Google Scholar] [CrossRef]
  31. Rawal, A.; Lankau, R.A.; Ruark, M.D. How does soil organic matter affect potato productivity on sandy soil? Soil Sci. Soc. Am. J. 2024. early view. [Google Scholar] [CrossRef]
  32. Oliveira Junior, A.C.; Silva dos Santos, L.N.; Reis, M.N.O.; Vitorino, L.C.; Bessa, L.A.; Teixeira, M.B.; Soares, F.A.L. Effect of Mineral and Organic Nitrogen Sources on Vegetative Development, Nutrition, and Yield of Sugarcane. Agronomy 2023, 13, 1627. [Google Scholar] [CrossRef]
  33. Nyamangara, J.; Bergström, L.F.; Piha, M.I.; Giller, K.E. Fertilizer Use Efficiency and Nitrate Leaching in a Tropical Sandy Soil. J. Environ. Qual. 2003, 32, 599–606. [Google Scholar] [CrossRef]
  34. Li, J.; Hu, W.; Chau, H.W.; Beare, M.; Cichota, R.; Teixeira, E.; Moore, T.; Di, H.; Cameron, K.; Guo, J.; et al. Response of nitrate leaching to no-tillage is dependent on soil, climate, and management factors: A global meta-analysis. Glob. Chang. Biol. 2023, 29, 2172–2187. [Google Scholar] [CrossRef] [PubMed]
  35. Zavaschi, E.; de Abreu Faria, L.; Ferraz-Almeida, R.; do Nascimento, C.A.; Pavinato, P.S.; Otto, R.; Vitti, A.C.; Vitti, G.C. Dynamic of P Flux in Tropical Acid Soils Fertilized with Humic Acid–Complexed Phosphate. J. Soil Sci. Plant Nutr. 2020, 20, 1937–1948. [Google Scholar] [CrossRef]
  36. Zavaschi, E.; Ferraz-Almeida, R.; Fária, L.A.; Otto, R.; Vitti, A.C.; Vitti, G.C. Application of superphosphate complexed with humic acid in an area of sugarcane. Rev. Ciênc. Agron. 2020, 51, e20186463. [Google Scholar] [CrossRef]
  37. Mahmud, K.; Panday, D.; Mergoum, A.; Missaoui, A. Nitrogen Losses and Potential Mitigation Strategies for a Sustainable Agroecosystem. Sustainability 2021, 13, 2400. [Google Scholar] [CrossRef]
  38. IPCC. Overview 2 2019 IPCC Guidelines for National Greenhouse Gas Inventories. 2019. Available online: https://www.ipcc.ch/report/2019-refinement-to-the-2006-ipcc-guidelines-for-national-greenhouse-gas-inventories/ (accessed on 1 August 2020).
  39. Maraseni, T.N.; Qu, J. An international comparison of agricultural nitrous oxide emissions. J. Clean. Prod. 2016, 135, 1256–1266. [Google Scholar] [CrossRef]
  40. Kostyanovsky, K.I.; Huggins, D.R.; Stockle, C.O.; Morrow, J.G.; Madsen, I.J. Emissions of N2O and CO2 Following Short-Term Water and N Fertilization Events in Wheat-Based Cropping Systems. Front. Ecol. Evol. 2019, 7, 63. [Google Scholar] [CrossRef]
  41. Reay, D.S.; Davidson, E.A.; Smith, K.A.; Smith, P.; Melillo, J.M.; Dentener, F.; Crutzen, P.J. Global agriculture and nitrous oxide emissions. Nat. Clim. Chang. 2012, 2, 410–416. [Google Scholar] [CrossRef]
  42. Joris, H.A.W.; Vitti, A.C.; Ferraz-Almeida, R.; Otto, R.; Cantarella, H. Long-term N fertilization reduces uptake of N from fertilizer and increases the uptake of N from soil. Sci. Rep. 2020, 10, 18834. [Google Scholar] [CrossRef] [PubMed]
  43. Mulvaney, R.L.; Khan, S.A.; Ellsworth, T.R. Synthetic nitrogen fertilizers deplete soil nitrogen: A global dilemma for sustainable cereal production. J. Environ. Qual. 2009, 38, 2295–2314. [Google Scholar] [CrossRef]
  44. Qiao, N.; Xu, X.; Hu, Y.; Blagodatskaya, E.; Liu, Y.; Schaefer, D.; Kuzyakov, Y. Carbon and nitrogen additions induce distinct priming effects along an organic-matter decay continuum. Sci. Rep. 2016, 6, 19865. [Google Scholar] [CrossRef]
  45. Li, Y.; Nie, C.; Shao, R.; Du, W.; Liu, Y.H. Soil priming effect mediated by nitrogen fertilization gradients in a semi-arid grassland, China. J. Resour. Ecol. 2019, 10, 147. [Google Scholar]
  46. Ma, H.L.; Gao, R.; Yin, Y.F.; Yang, Y.S. Effects of leaf litter tannin on soil ammonium and nitrate content in two different forest soils of mount Wuyi, China. Toxicol. Environ. Chem. 2016, 98, 395–409. [Google Scholar] [CrossRef]
  47. Gurmesa, G.A.; Li, S.; Zhu, W.; Gundersen, P.; Zhang, S.; Xi, D.; Huang, S.; Wang, A.; Jiang, Y.; Zhu, J.; et al. Fate of atmospherically deposited NH4+ and NO3 in twotemperate forests in China: Temporal pattern and redistribution. Ecol. Appl. 2019, 29, e01920. [Google Scholar]
  48. Tills, A.R.; Alloway, B.J. The effect of ammonium and nitrate nitrogen sources on copper uptake and amino acid status of cereals. Plant Soil 1981, 62, 279–290. [Google Scholar] [CrossRef]
  49. Andriolo, J.L.; Godoi, R.D.; Cogo, C.M.; Bortolotto, O.C.; da Luz, G.L.; Madaloz, J.C. Growth and development of lettuce plants at high NH4+:NO3 ratios in the nutrient solution. Hortic. Bras. 2006, 24, 352–355. [Google Scholar] [CrossRef]
  50. Fan, Z.; Lali, M.N.; Xiong, H.; Luo, Y.; Wang, Y.; Wang, Y.; Lu, M.; Wang, J.; He, X.; Shi, X.; et al. Seedlings of Poncirus trifoliata exhibit tissue-specific detoxification in response to NH4+ toxicity. Plant Biol. 2024, 26, 467–475. [Google Scholar] [CrossRef] [PubMed]
  51. Kong, L.; Zhang, Y.; Zhang, B.; Li, H.; Wang, Z.; Si, J.; Fan, S.; Feng, B. Does energy cost constitute the primary cause of ammonium toxicity in plants? Plant 2022, 256, 62. [Google Scholar] [CrossRef] [PubMed]
  52. Olivera-Viciedo, D.; Salas Aguilar, D.; de Mello Prado, R.; Peña Calzada, K.; Calero Hurtado, A.; de Cássia Piccolo, M.; Bomfim Soares, M.; Lizcano Toledo, R.; Alves, G.R.; Ferreira, D.; et al. Silicon-Mediated Adjustments in C:N:P Ratios for Improved Beetroot Yield under Ammonium-Induced Stress. Agronomy 2024, 14, 1104. [Google Scholar] [CrossRef]
  53. Koltun, A.; Maniero, R.A.; Vitti, M.; de Setta, N.; Giehl, R.F.H.; Lima, J.E.; Figueira, A. Functional characterization of the sugarcane (Saccharum spp.) ammonium transporter AMT2;1 suggests a role in ammonium root-to-shoot translocation. Front. Plant Sci. 2022, 13, 1039041. [Google Scholar] [CrossRef]
  54. Rashti, M.R.; Nelson, P.N.; Lan, Z.; Su, N.; Esfandbod, M.; Liu, X.; Goloran, J.; Zhang, H.; Chen, C. Sugarcane cultivation altered soil nitrogen cycling microbial processes and decreased nitrogen bioavailability in tropical Australia. J. Soils Sediments 2024, 24, 946–955. [Google Scholar] [CrossRef]
  55. Boschiero, B.N.; Mariano, E.; Azevedo, R.A.; Ocheuze Trivelin, P.C. Influence of nitrate—Ammonium ratio on the growth, nutrition, and metabolism of sugarcane. Plant Physiol. Biochem. 2019, 139, 246–255. [Google Scholar] [CrossRef]
  56. Robinson, N.; Brackin, R.; Vinall, K.; Soper, F.; Holst, J.; Gamage, H.; Paungfoo-Lonhienne, C.; Rennenberg, H.; Lakshmanan, P.; Schmidt, S. Nitrate paradigm does not hold up for sugarcane. PLoS ONE 2011, 6, 19045. [Google Scholar] [CrossRef] [PubMed]
  57. Boschiero, B.N.; Mariano, E.; Trivelin, P.C.O. “Preferential” ammonium uptake by sugarcane does not increase the 15N recovery of fertilizer sources. Plant Soil 2018, 429, 253–269. [Google Scholar] [CrossRef]
  58. Furtado da Silva, N.; Cabral da Silva, E.; Muraoka, T.; Batista Teixeira, M.; Antonio Loureiro Soares, F.; Nobre Cunha, F.; Adu-Gyamfi, J.; Cavalcante, W.S. Nitrogen Utilization from Ammonium Nitrate and Urea Fertilizer by Irrigated Sugarcane in Brazilian Cerrado Oxisol. Agriculture 2020, 10, 323. [Google Scholar] [CrossRef]
  59. Padilla, F.M.; Gallardo, M.; Manzano-Agugliaro, F. Global trends in nitrate leaching research in the 1960–2017 period. Sci. Total Environ. 2018, 643, 400–413. [Google Scholar] [CrossRef]
  60. Bortolotto, R.P.; Bruno, I.P.; Dourado-Neto, D.; Timm, L.C.; Silva, A.N.; Reichardt, K. Nitrate leaching through climatologic water balance in a fertigated coffee plantation. Rev. Ceres 2013, 60, 785–792. [Google Scholar] [CrossRef]
Figure 1. Cluster formation with data of soil texture, N stocks, and pH analyzed by machine learning (K-means). A total of 1278 observations were tested. In Figure, the number represents the identification of observation.
Nitrogen 05 00048 g001
Figure 2. Cluster dendrogram with data on soil texture, N stocks, and pH analyzed by machine learning (K-means). A total of 1278 observations were tested.
Nitrogen 05 00048 g002
Figure 3. Expected productivity, N recommendation, and ratio (productivity/N recommendation) of sugarcane, corn, and wheat. N recommendation is the average in planting and cover.
Nitrogen 05 00048 g003
Figure 4. The process of nitrification is divided into two steps: (i) conversion of ammonium (NH4+) to nitrite (NO2) and (ii) conversion of nitrite (NO2) into nitrate (NO3) in soil. Arrows represent the transformation in the nitrogen cycle.
Nitrogen 05 00048 g004
Figure 5. Distribution of water and air volumes: (i) aerobic condition and conversion of ammonium (NH4+) to nitrate (NO3) in the soil; (ii) anaerobic condition and conversion of nitrate (NO3) to nitrous oxide (N2O) in soil. Arrows represent the transformation in the nitrogen cycle.
Nitrogen 05 00048 g005
Figure 6. Contents of ammonium (NH4+) and nitrate (NO3) in soil with the planting of soybean, corn, sugarcane, and forest in tropical conditions. Averages were compared using the t test (p < 0.05), when presented with capital letters there is a significant difference.
Nitrogen 05 00048 g006
Figure 7. Correlation of ammonium (NH4+) and nitrate (NO3) in tropical soil with sandy, loam, and clay textures. Correlations were tested by Pearson correlation using a p of 0.5.
Nitrogen 05 00048 g007
Table 1. Average, minimum, and maximum variation of ammonium (NH4+) and nitrate (NO3) in tropical soil with sandy, loam, and clay textures.
Soil TexturesAverageMinimumMaximumVariation, %
NH4+, mg kg−1
Clay31.024.9207.7±182.8 (±88%)
Loam46.235.2155.0±119.7 (±77%)
Sandy57.02.7135.0±132.2 (±98%)
NO3, mg kg−1
Clay104.25.1104.0±98.9 (±95%)
Loam94.56.8108.3±101.5 (±96%)
Sandy36.44.7103.2±98.5 (±95%)
Soil pH
Clay5.90.16.6±6.4 (±92%)
Loam7.00.17.6±7.5 (±91%)
Sandy5.90.16.8±6.8 (±91%)
Cluster results
Cluster 1Cluster 2Cluster 3
NH4+−0.250.120.39
NO30.390.19−0.99
pH−0.461.4−0.47
Sum of squares578.24232.21237.77
Number252126126
Cluster formation with data on soil texture, N stocks, and pH analyzed by machine learning (K-means). A total of 504 observations were tested.
Disclaimer/Publisher’s Note: The statements, opinions and data contained in all publications are solely those of the individual author(s) and contributor(s) and not of MDPI and/or the editor(s). MDPI and/or the editor(s) disclaim responsibility for any injury to people or property resulting from any ideas, methods, instructions or products referred to in the content.