Article

Fractal Characteristics and Controlling Factors of Pore-Throat Structure in Tight Sandstone Reservoirs: A Case Study of the 2nd Member of the Kongdian Formation in the Nanpi Slope, Cangdong Sag, Bohai Bay Basin

by
Yong Zhou
1,*,
Guomeng Han
2,
Yanxin Liu
3,
Liangang Mou
2,
Ke Wang
1,
Peng Yang
2 and
Kexin Yan
1
1
School of Geoscience, China University of Petroleum, Beijing 102249, China
2
Exploration and Development Research Institute, PetroChina Dagang Oilfield Company, Tianjin 300280, China
3
Key Laboratory of Orogenic Belts and Crustal Evolution, Ministry of Education, School of Earth and Space Sciences, Peking University, Beijing 100871, China
*
Author to whom correspondence should be addressed.
Fractal Fract. 2025, 9(9), 608; https://doi.org/10.3390/fractalfract9090608
Submission received: 6 August 2025 / Revised: 10 September 2025 / Accepted: 15 September 2025 / Published: 20 September 2025

Abstract

Tight sandstone reservoirs generally exhibit poor physical properties and characterization of microscopic pore structure is crucial for evaluating reservoir quality and fluid flow behavior. Fractal dimension provides an effective means to quantify the complexity and heterogeneity of pore structures in such reservoirs. This study investigates tight sandstone reservoirs of the Kongdian Formation in the Nanpi Slope, Cangdong Sag, using cast thin sections, scanning electron microscopy (SEM), high-pressure mercury injection (HPMI), and constant-rate mercury injection (CRMI) experiments. We establish a full-range fractal model to characterize pore-throat distributions and elucidate the correlation between fractal dimensions and reservoir properties, alongside factors influencing pore-structure heterogeneity. Key findings include that (1) pore types are predominantly residual intergranular pores, intergranular dissolution pores, and clay mineral intercrystalline pores, with throats primarily consisting of sheet-like and curved sheet-like types, exhibiting strong pore-structure heterogeneity; (2) full-range fractal dimensions D1, D2 and D4 effectively characterize the heterogeneity of pore structure, where higher D1 and D2 values correlate with increased macro–mega pore and micro-fine throat abundance, respectively, indicating enhanced pore connectivity and superior flow capacity, while elevated D4 reflects greater nano throat complexity, degrading reservoir properties and impeding hydrocarbon flow; (3) compared to conventional methods splicing HPMI and CRMI data at 0.12 μm, the fractal-derived integration point more accurately resolves full-range pore-throat distributions, revealing significant disparities in pore-throat size populations; (4) the fractal dimensions D1, D2, and D4 are collectively governed by clay mineral content, average throat radius, displacement pressure, and tortuosity.

1. Introduction

Amid growing global imbalances in petroleum supply and demand, unconventional hydrocarbon resources have become increasingly critical to worldwide energy security. Within this spectrum, tight oil and gas reservoirs hold substantial resource potential and are technically viable for stimulation, positioning them as a pragmatic frontier for reserve growth and production enhancement in China. Significant accumulations have been documented in petroleum-bearing basins such as the Ordos, Bohai Bay, and Sichuan [1,2,3,4,5]. Tight sandstone reservoirs—defined here as those with a porosity < 10% and matrix permeability < 0.1 mD under confining pressure [6]—have drawn extensive research attention in recent years due to their vast resource base. Compared to conventional sandstones, tight sandstone reservoirs exhibit inferior petrophysical properties and have undergone intensive diagenetic alteration, resulting in pronounced pore-structure heterogeneity [7,8,9]. Pore-throat size distribution exerts more direct control on storage capacity and fluid flow behavior than bulk porosity or permeability alone [10], making its characterization essential for evaluating macroscopic reservoir quality and hydrocarbon mobility. These reservoirs typically feature multiscale pore-throat systems spanning nanometers to micrometers. However, their complex pore-throat geometry, small radii, poor connectivity, and strong heterogeneity pose significant challenges for quantitative microscopic characterization [11,12,13].
Current research on pore structures in tight sandstone reservoirs primarily employs mercury intrusion porosimetry (MIP) [14,15], scanning electron microscopy (SEM) [16], and nuclear magnetic resonance (NMR) [17,18] to qualitatively characterize geometric and topological parameters—including pore-throat morphology, size distribution, and connectivity. Previous studies have confirmed the fractal nature of complex pore systems in reservoir rocks [19,20,21,22,23,24]. Fractals are defined as self-similar objects exhibiting scale-invariant properties [25], with such structures characterized quantitatively by the fractal dimension (Df or D) [21]. Since Mandelbrot’s conceptualization of fractals [25], fractal theory and methodology have been extensively applied in petroleum exploration and development [22,26,27]. This approach effectively interprets the irregularity, instability, and high complexity inherent to pore structures [27,28,29], while providing a critical bridge linking microscopic pore architecture (throat size, pore-throat distribution, connectivity) to macroscopic petrophysical properties (porosity, permeability) [22,28].
Previous studies characterizing the fractal dimensions of rock pore structures using mercury injection methods have typically relied on a single technique—either high-pressure mercury injection (HPMI) or constant-rate mercury injection (CRMI). However, due to the shielding effect of HPMI on large pore throats and the pressure limitation of CRMI (maximum 6.2 MPa), both approaches exhibit inherent limitations in comprehensively characterizing pore structure heterogeneity when used independently. Specifically, HPMI provides higher accuracy for small pore-throat distributions, whereas CRMI more precisely resolves large pore-throat distributions. To integrate pore-throat data across the full scale, prior studies often simply spliced HPMI-derived distributions (<0.12 μm) with CRMI-derived distributions (>0.12 μm) at a fixed threshold of 0.12 μm. Critically, this splicing approach neglects the overlapping pore-throat range near 0.12 μm observed in both HPMI and CRMI data [30], leading to partial loss of pore-throat distribution data and thus failing to reflect the true full-range pore-throat structure. Furthermore, existing research lacks systematic investigations into the correlations between fractal dimensions (quantifying pore structure heterogeneity) and reservoir properties/fluid flow behaviors, as well as their controlling factors. Consequently, it remains challenging to quantitatively evaluate the impact of pore-throat structures on tight reservoir properties and hydrocarbon migration.
The Nanpi Slope in the Cangdong Sag, a representative tight sandstone oil-gas province within the Huanghua Depression of the Bohai Bay Basin, exhibits complex reservoir characteristics in Member 2 of the Paleogene Kongdian Formation, including inherently low permeability, multiscale pore-throat heterogeneity, elevated capillary resistance, and highly variable oil–water relationships and oil saturation [10,30,31]. Critically, prior studies lack systematic characterization of hierarchical (nano-to-micron-scale) pore-throat structures through multi-parameter integration, hindering further exploration and development of tight oil reservoirs. To address this gap, we employ an integrated experimental approach combining cast thin-section imaging, SEM, HPMI and CRMI to comprehensively quantify multiscale pore architecture in the study area. Specifically, we focus on deriving full-range fractal dimensions by synergizing HPMI and CRMI data to characterize pore-throat heterogeneity, establishing quantitative correlations between fractal dimensions, reservoir properties, and fluid flow behavior, and elucidating key controls on fractal signatures. This research provides a novel framework for quantitatively evaluating pore-structure heterogeneity and its impact on fluid mobility, offering critical insights for optimizing tight oil recovery.

2. Geological Background

The Cangdong Sag, situated in the southern Huanghua Depression of the Bohai Bay Basin, is bounded by the Kongdian Uplift to the north, Dongguang Uplift to the south, Cangxian Swell to the west, and Xuhei Uplift to the east. As the second-largest hydrocarbon-rich sag within the Huanghua Depression, it covers a total exploration area of 4700 km2. This sag developed under a regional extensional regime, evolving into an elongated Cenozoic rift basin that tapers from southwest to northeast. Its structural framework comprises two positive structural belts—the Kongdian Structural Belt and Shenüsi Fault Nose—along with three slope systems: the Western Kongxi Slope, Eastern Kongdong Slope, and Nanpi Slope [31,32].
The Nanpi Slope, situated in the southern Cangdong Sag of the Bohai Bay Basin, comprises four sub-sags and seven secondary structural belts, structurally partitioned into three distinct zones: the Low-Slope Zone, Mid-Slope Zone, and High-Slope Zone (Figure 1). This area hosts a thick succession of the Paleogene Kongdian Formation, formally divided into the Kong 1 (Ek1), Kong 2 (Ek2), and Kong 3 (Ek3) members. During the deposition of the Kong 2 Member, braided river delta systems extensively developed across the gentle paleotopography, with facies distribution controlled by slope gradient: delta plain deposits dominated the High-Slope Zone, delta front facies prevailed in the Mid-Slope Zone, and prodelta to distal lacustrine fan sediments accumulated in the Low-Slope Zone. The Kong 2 reservoirs consist predominantly of gray fine-grained siltstones and sandstones, classified lithologically as arkosic sandstones and lithic arkoses.

3. Samples and Methods

3.1. Sample Characteristics and Analytical Procedures

Forty-one tight sandstone samples were collected from the 2nd member of the Kongdian Formation (Kong 2 Member) in the Nanpi Slope of the Cangdong Sag. These samples were subjected to comprehensive analyses including cast thin section observation, SEM, X-ray diffraction (XRD) and HPMI. Nine representative tight sandstone samples, all identified as gray silt-fine sandstones, were selected for additional coupled analyses of CRMI and micro-CT scanning. The nine selected samples were drilled into standard core plugs with a diameter of 2.5 cm and a length of 3.0 cm, followed by cleaning and oven-drying. A series of sequential experiments were conducted on each core plug: first, conventional porosity and permeability were measured; then, mercury intrusion experiments were performed; finally, the samples were ground into thin sections for optical microscopy observation and SEM analysis.
HPMI experiments were carried out using an AutoPore IV 9505 mercury intrusion porosimeter (Micromeritics, Norcross, GA, USA). The experiments included both mercury intrusion (under increasing pressure) and extrusion (under decreasing pressure) processes, with a maximum applied pressure of 200 MPa, enabling the measurement of pore-throat radii as small as approximately 3.6 nm. Constant-rate mercury intrusion experiments were performed using a Coretest ASPE-730 CRMI instrument (Coretest Systems Inc., Roseville, CA, USA), with a maximum intrusion pressure of 900 psi (6.2 MPa), corresponding to a minimum measurable throat radius of approximately 0.12 μm. Mercury was injected into the core samples at a constant ultra-low rate of 0.0001 mL/min under a temperature of 25 °C. The identification of pores and throats in the reservoir was based on the sudden drop and subsequent recovery of pressure during the intrusion process. CT scanning was conducted using a Carl Zeiss Xradia 520 Versa 3D X-ray microscope (Carl Zeiss AG, Pleasanton, CA, USA). Based on 3D CT scanning data, image analysis techniques (processed using Avizo 2023 and Image J 1.54 software) were applied to characterize the internal mineral composition, pore structure, and their distribution characteristics within the cores. This included quantifying parameters of pores, throats, and minerals, as well as generating 2D and 3D spatial visualizations to illustrate their morphological features and spatial distributions. Nuclear magnetic resonance (NMR) experiments were conducted using an Oxford-MARAN DRX 2 NMR spectrometer (Oxford Instruments plc, Abingdon, Oxfordshire, UK). The NMR T2 spectrum was employed to analyze the occurrence state (movable or bound) of fluids within core pores, quantitatively determining both movable fluid saturation and bound fluid saturation. Movable fluid saturation reflects the relative proportion of fluid-flowable pore space within the porous rock media. All the involved equipment information is showed in Table 1.

3.2. Fractal Theory

Fractal theory is an effective approach to describe the complexity and heterogeneity of pore structures in tight sandstone reservoirs [34]. The internal pore structure of porous rocks typically exhibits a non-integer dimension, with the ideal fractal dimension ranging between 2 and 3 [34]. A fractal dimension closer to 2 indicates a more uniform distribution of pore throats and stronger homogeneity within the rock, whereas a value closer to 3 signifies greater heterogeneity of pore throats. An increase in the fractal dimension reflects a transformation in the pore morphology of tight sandstones from regular to complex, which reduces permeability and impedes the migration of pore fluids [35]. Due to the highly complex nature of pore throats in tight sandstones, their distribution usually encompasses multiple fractal intervals. Consequently, the pore structure can be characterized by multiple fractal dimensions, meaning that tight sandstones possess multifractal dimensions [36,37].
A computational model was established based on mercury intrusion porosimetry (MIP) data to calculate the fractal dimension. This model has been widely applied in the study of pore structures in unconventional reservoirs and exhibits the best performance when used for tight sandstone reservoirs [38]. Based on fractal theory, Reference [37] derived a calculation model for the fractal dimension of pore structures using mercury saturation (SHg) and capillary pressure (pc) obtained from MIP experiments, which is shown as follows:
S H g = a p c 2 D ,
where a is a constant; D is the fractal dimension.
Typically, the relationship between mercury saturation and capillary pressure is plotted on a double logarithmic coordinate system, thus yielding the following equation:
lg S H g = D 2 lg p c + C ,
where C is a constant.
Therefore, the fractal dimension of the tight sandstone pore structure can be obtained by plotting the cross-plot of lgSHg versus lgpc. Due to the multifractal characteristics of tight sandstone pore structures [17], the following steps were performed: first, fractal intervals were divided on the cross-plot; second, segmented linear regression was conducted within different fractal intervals to determine the slope K for each interval; finally, the fractal dimension of each fractal interval was derived from the slope, specifically:
D = K + 2
where K is the slope of each fractal interval in the cross-plot of lgSHg versus lgpc.

4. Characteristics of Pore Structure in Tight Sandstone Reservoirs

4.1. Types of Pores and Throats in Tight Sandstone Reservoirs

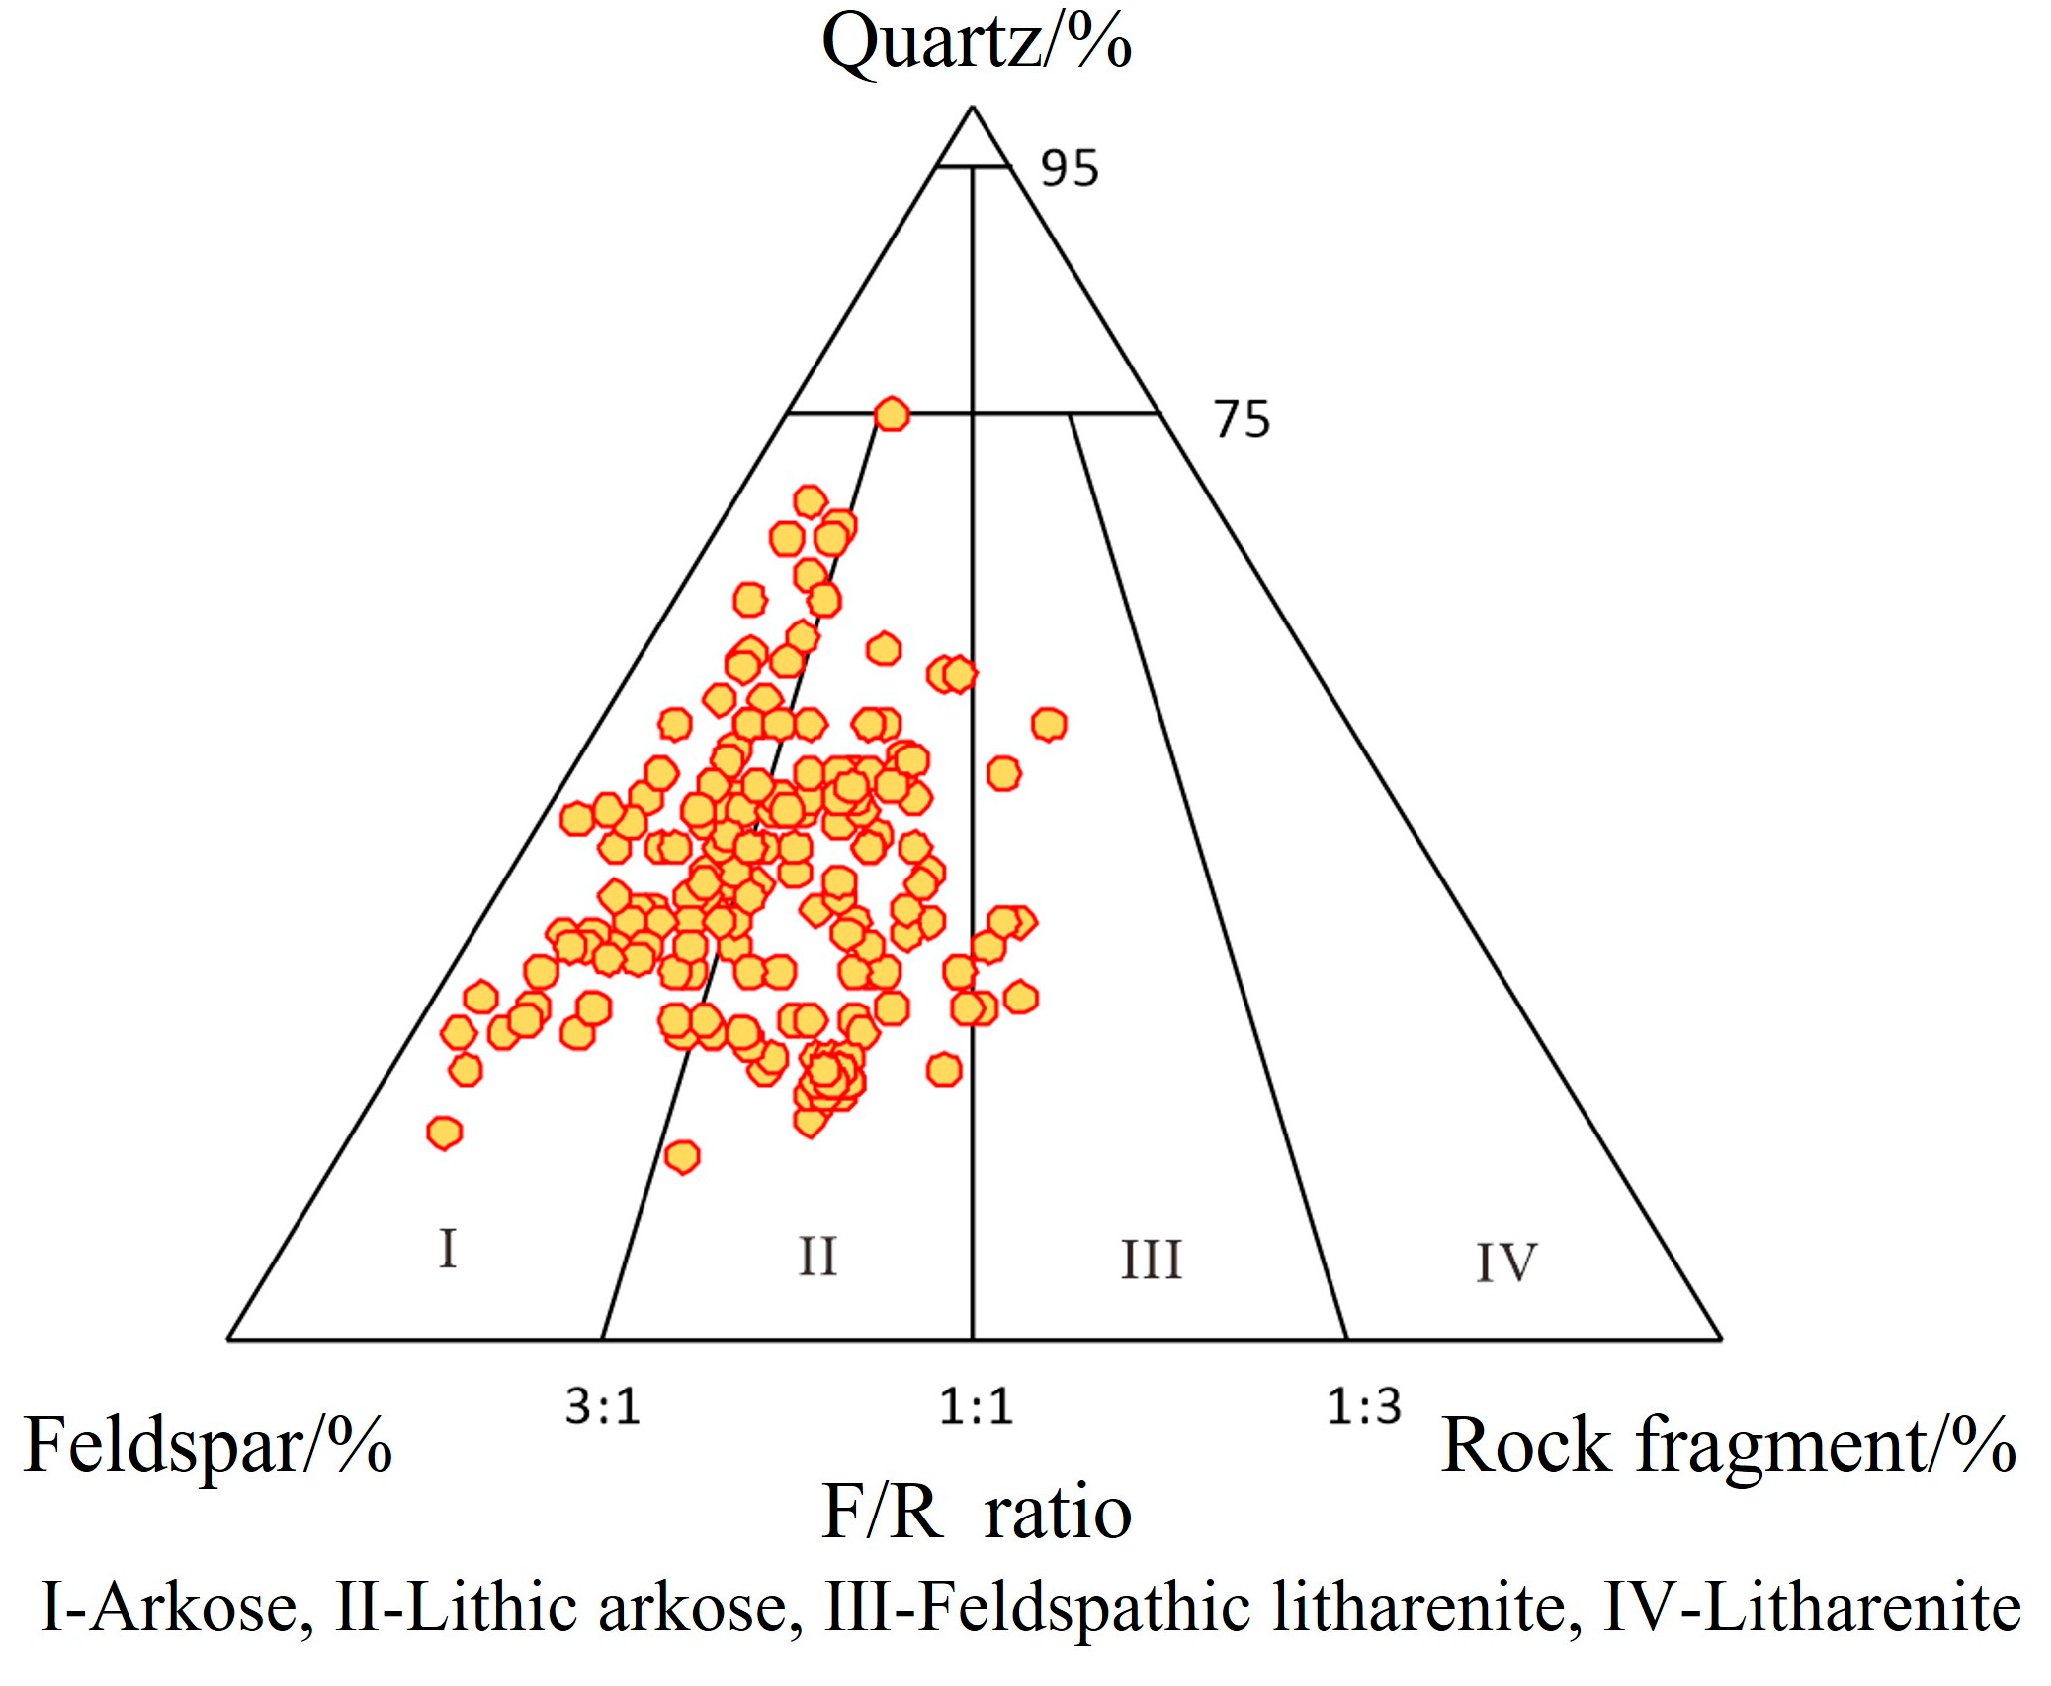
The reservoir rocks in the 2nd member of the Kongdian Formation (Kong 2 Member) of the Cangdong Sag are predominantly feldspathic sandstones and lithic feldspathic sandstones (Figure 2). The quartz content ranges from 15.6% to 75.1% with an average of 37.12%, while feldspar content varies from 18% to 77.3% (average: 44.48%) and lithic content ranges from 0.8% to 38% (average: 18.2%). The sandstones have a sorting coefficient of 1.3–2.1 and are mainly subangular to subrounded in terms of roundness. Grain sizes are dominated by fine sandstone and siltstone. In the study area, the porosity of the Kong 2 Member ranges from 2.1% to 18.5% with an average of 11.01%, and the permeability varies from 0.01 mD to 73 mD, with a mean value of 5.82 mD.
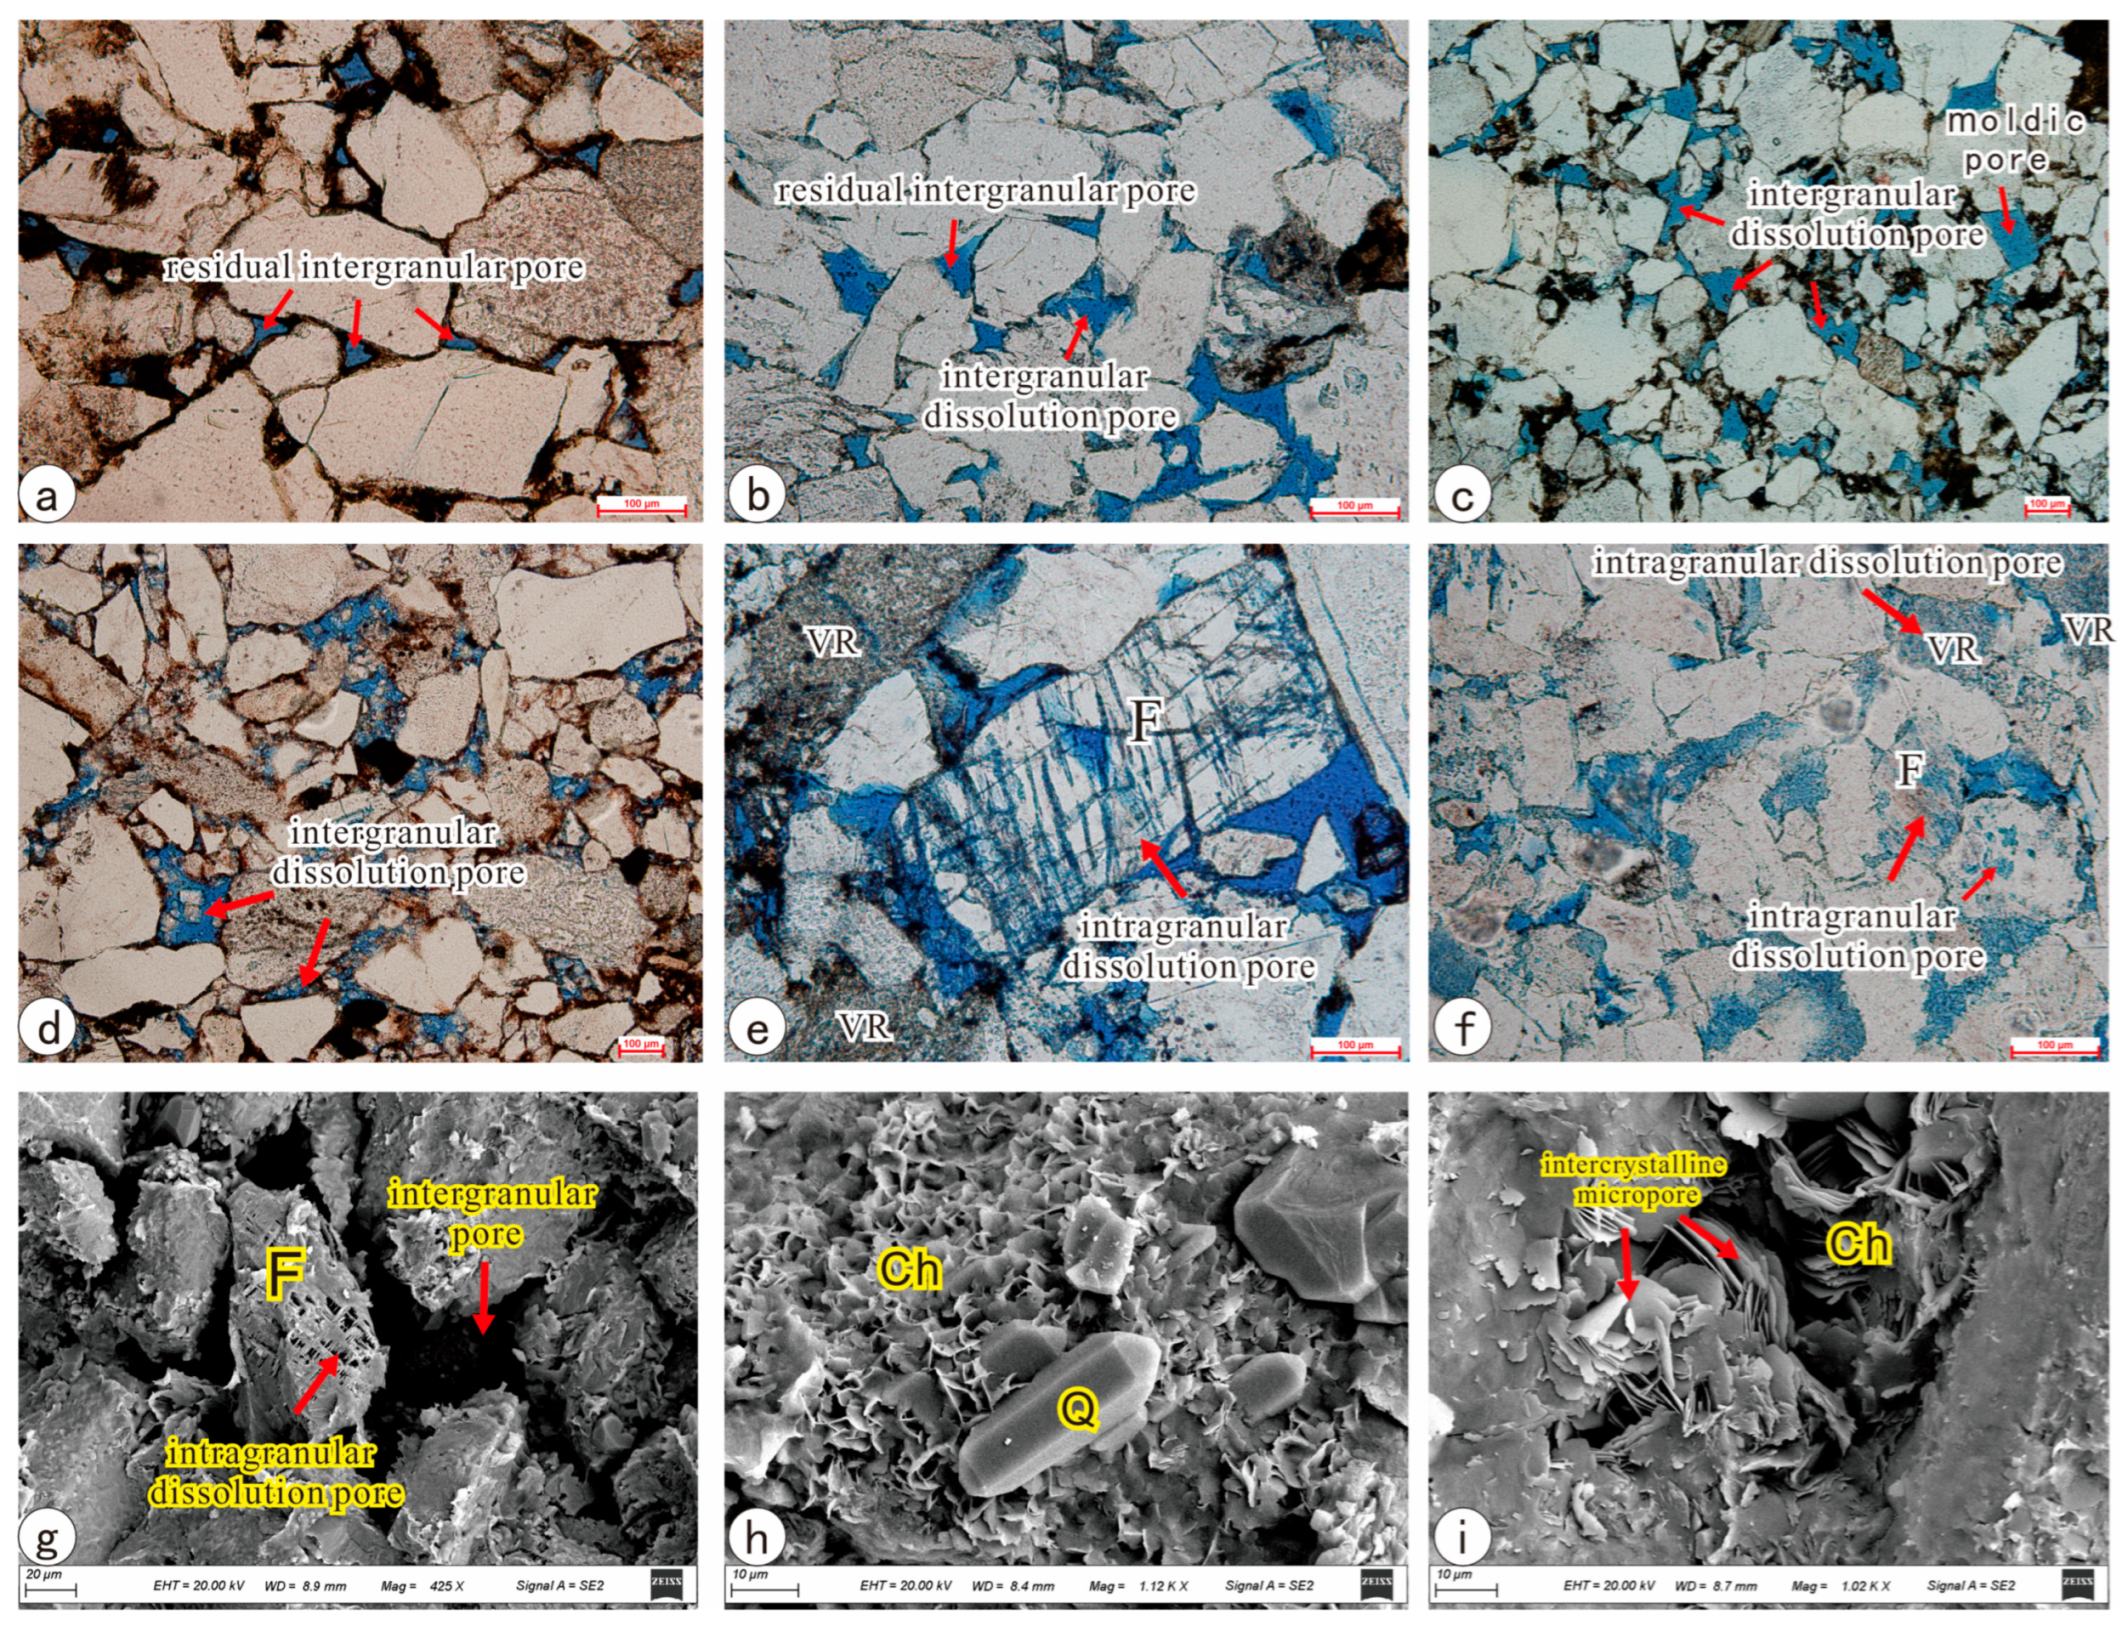
Based on observations from cast thin sections and SEM, three types of pores are predominantly developed in the tight sandstones of the Kong 2 Member in the study area: intergranular pores, intragranular pores, and micropores within clay mineral intercrystalline spaces (Figure 3). Among these, intergranular pores are the most widely developed and distributed, dominated by residual intergranular dissolved pores (Figure 3a,b,g), followed by intergranular dissolved pores (Figure 3c). Intragranular dissolved pores primarily include feldspar dissolution pores (Figure 3e,g) and lithic fragment dissolution pores (Figure 3f), with residual debris from particle dissolution visible within the pores (Figure 3d). Micropores within clay mineral intercrystalline spaces are mainly composed of chlorite intercrystalline pores and illite intercrystalline pores (Figure 3h,i).
The tight sandstone reservoirs of the Kongdian Formation in the study area are dominated by lamellar and curved-lamellar throats (Figure 3a–c), with local occurrences of tubular-bundle throats (Figure 3f,h,i). Clay minerals typically fill intergranular and intragranular dissolution pores; however, they also form capillary-interwoven tubular-bundle throats, making such throats most prevalent in sandstones rich in clay minerals. During the later stage of hydrocarbon charging, these tubular-bundle throats can act both as storage spaces for fluids and as pathways for fluid migration.

4.2. Pore-Throat Distribution Characteristics of Tight Sandstone Reservoirs

Analysis of the physical property data from the study area reveals that the tight sandstone reservoirs exhibit significant variations in physical properties. The porosity ranges from 4.32% to 12.54% with an average of 9.37%, while the permeability is mainly distributed between 0.021 and 0.634 mD, averaging 0.249 mD. These characteristics classify the reservoirs as typical ultra-low porosity and low permeability reservoirs. Based on the analysis of capillary pressure curves and pore-throat radius distribution characteristics derived from high-pressure mercury intrusion porosimetry (Figure 4 and Figure 5), the nine core samples are categorized into three types (Type I, II, and III) according to the morphology of the capillary pressure curves and other pore structure parameters (Table 2 and Table 3).
Type I samples include X-8, X-9, X10-2, Y21, KN6-1, and KN6-2, which are characterized by a flat middle segment in the mercury intrusion curve and coarse skewness (Figure 4a). The average displacement pressure and maximum pore-throat radius are 0.39 MPa and 1.79 μm, respectively. The pore-throat distribution frequency is predominantly unimodal (Figure 4b), with the peak ranging from 0.05 to 0.17 μm, showing a high and more concentrated peak. Samples of this type have larger pores, better physical properties, relatively concentrated pore-throat distribution, and good sorting and connectivity. Type II samples include W26-1 and W26-2. Their mercury intrusion curves exhibit a relatively flat middle segment with coarse skewness (Figure 4a). The pore-throat distribution frequency is mainly unimodal, with the peak primarily distributed between 0.017 and 0.026 μm. The average displacement pressure and maximum pore-throat radius are 2.05 MPa and 1.48 μm, respectively. Compared with Type I samples, Type II samples have poorer pore size; the presence of more small pores results in worse sorting and connectivity. Type III samples are represented by X10-1, featuring a non-flat middle segment with an indistinct platform and fine skewness in the mercury intrusion curve (Figure 4a). The average displacement pressure and maximum pore-throat radius are 2.75 MPa and 0.27 μm, respectively. The pore-throat distribution frequency is dominated by an indistinct bimodal pattern (Figure 4b), with peaks mainly distributed in the range of 0.005–0.035 μm and a wide distribution range. Samples of this type have high displacement pressure, poor pore-throat connectivity and sorting, the most complex pore structure, and strong heterogeneity.
Constant-rate mercury intrusion experiments were performed on tight sandstone samples from the study area. The results showed that the average values of final mercury saturation, total pore mercury saturation, and total throat mercury saturation across all samples were 55.206%, 15.037%, and 40.169%, respectively. Notably, the pore mercury saturation was significantly lower than the throat mercury saturation, indicating poor pore connectivity. This suggests that a large number of isolated pores are present, which are not connected by throats.
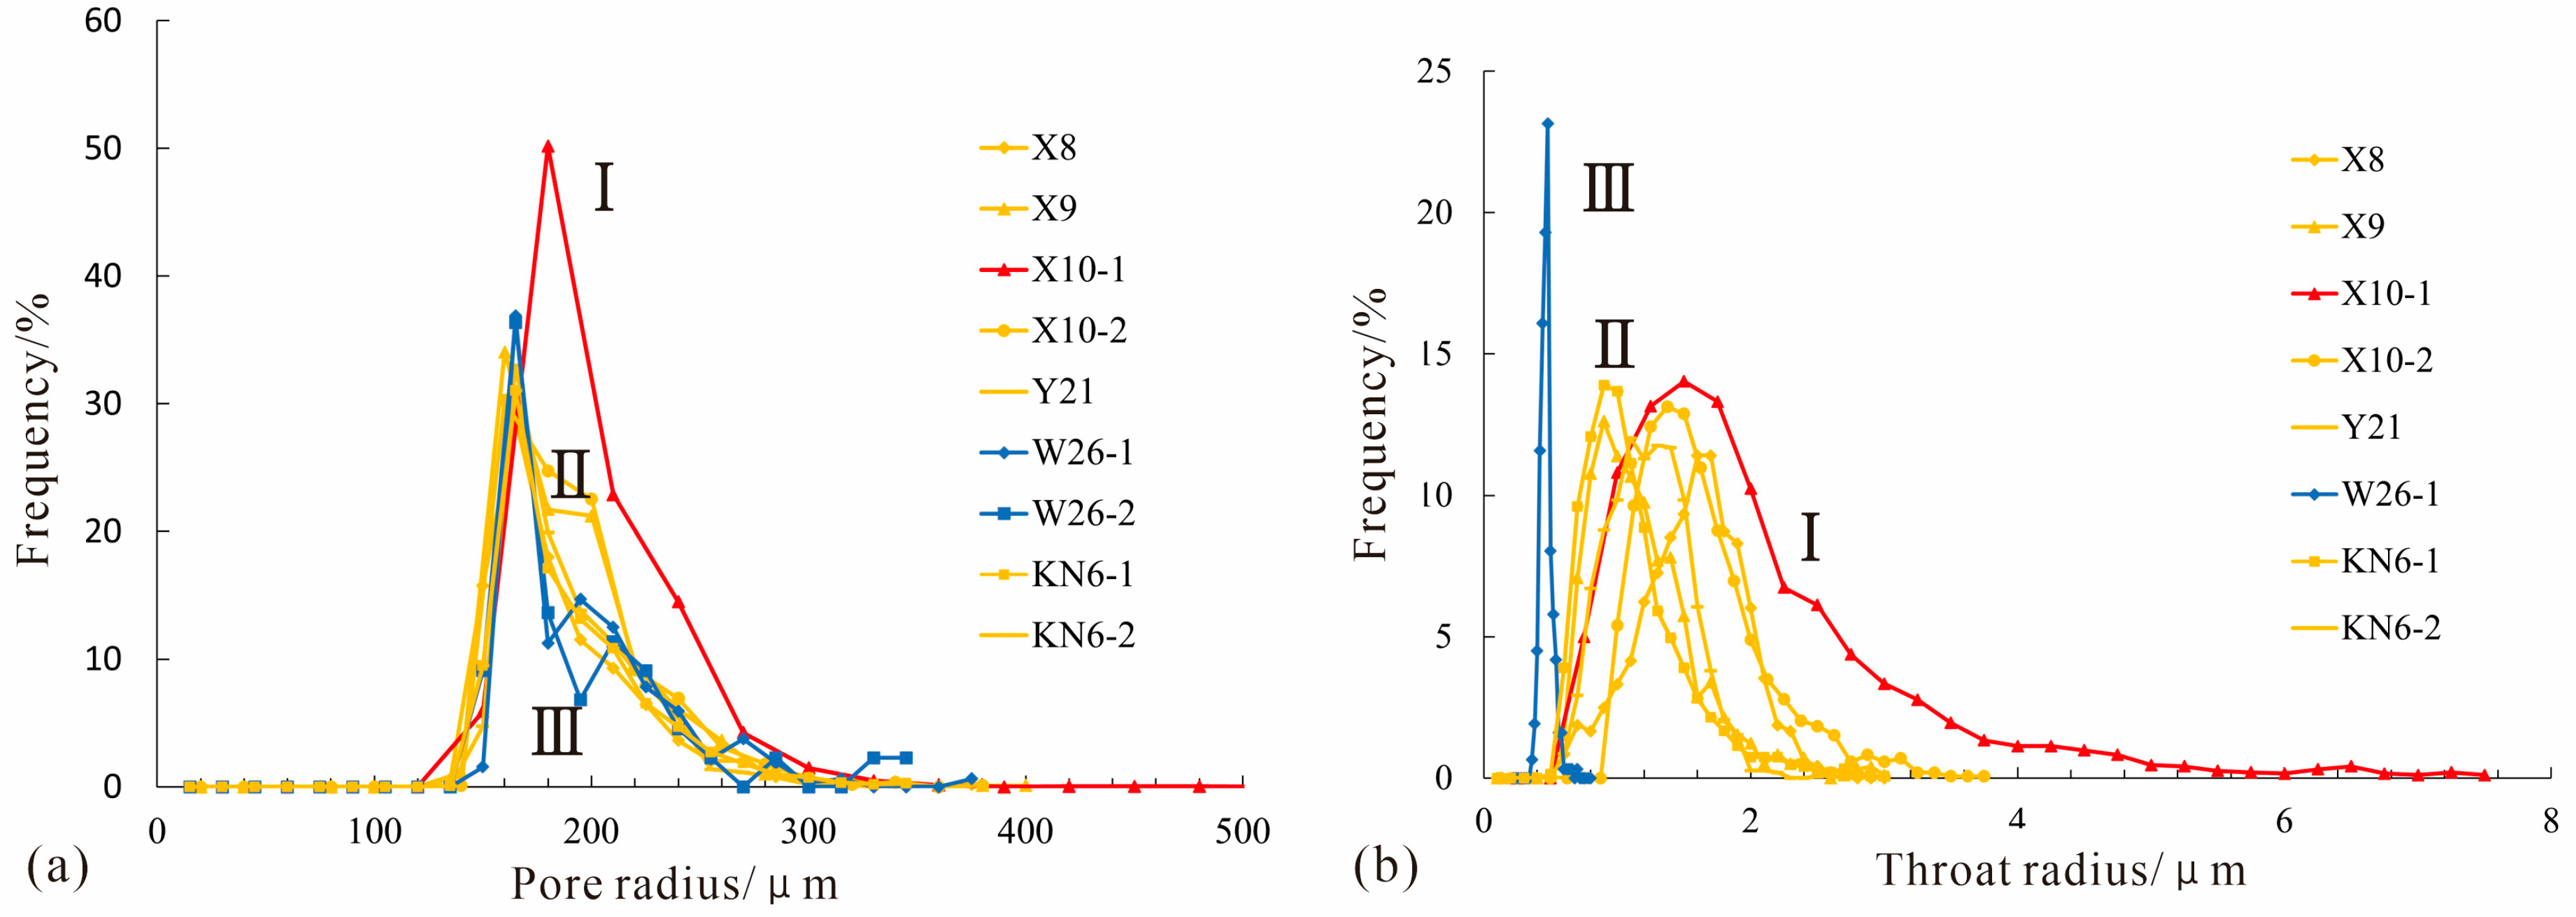
Analysis of the distribution frequency curves of pores and throats reveals that the pore radii of all samples are mainly distributed in the range of 150 to 300 μm (Figure 5a), with a relatively consistent distribution pattern. The average pore radius ranges from 185.85 to 205.31 μm, with a peak value around 190 μm. In contrast, the average throat radius varies significantly from 0.468 to 16.25 μm (Figure 5b), showing a distinct differential distribution. This marked variability in throat distribution results in abnormally large pore-throat ratios. The pore-throat radius ratios of the samples exhibit a wide range of variation, with their average values ranging from 100.01 to 436.07.
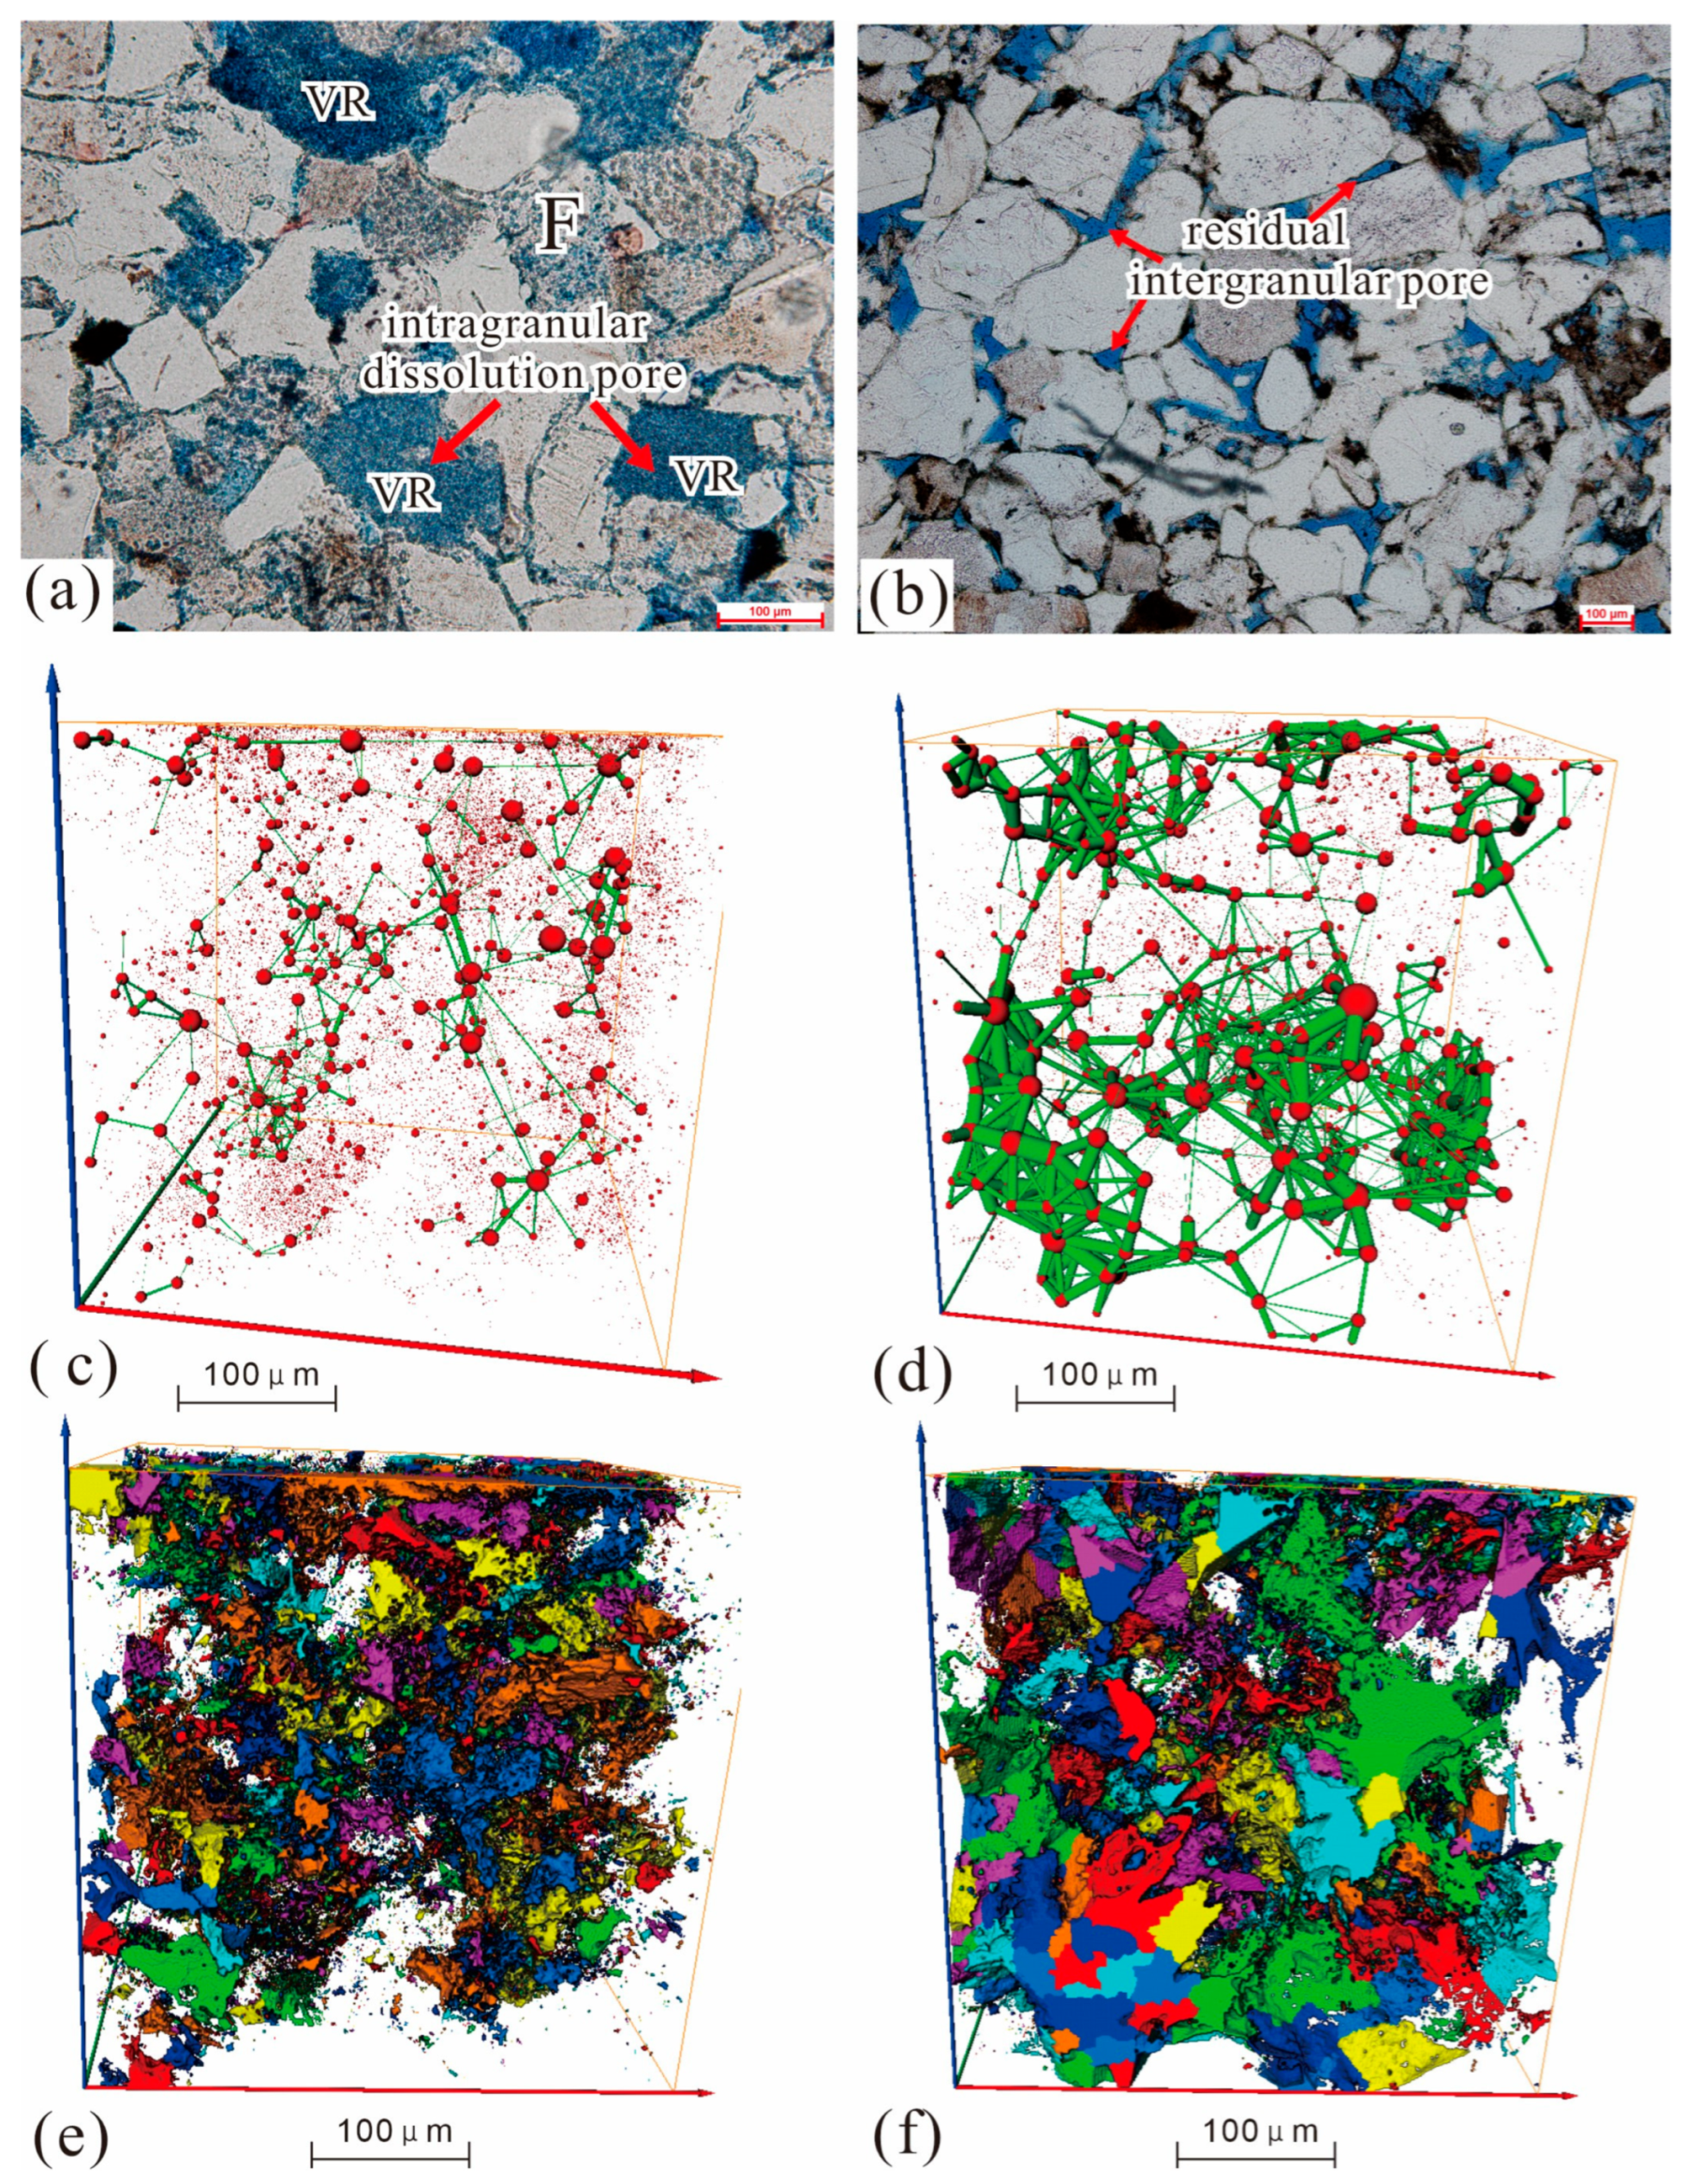
The pore-throat morphologies of tight sandstone samples in the study area are complex. In addition to the controls of pore and throat sizes on reservoir physical properties, the morphology (tortuosity) of pore throats also exerts a significant influence on permeability (Figure 6). For instance, sample W26-2 has a porosity of 11.31%, permeability of 0.078 mD, average throat radius of 0.47 μm, and tortuosity of 30.27; in contrast, sample KN6-2 exhibits a porosity of 11.78%, permeability of 8.155 mD, average throat radius of 1.12 μm, and tortuosity of 2.76. Under the condition that the differences in porosity and average throat radius are insignificant, sample W26-2 has low permeability due to its dominant pore types being intraclastic micropores and intra-matrix micropores (Figure 7a), accompanied by well-developed micro–nano throats with complex morphologies and high tortuosity. CT results indicate that sample W26-2 contains fine throats and poor pore connectivity (Figure 7c,e). Sample KN6-2 is characterized by residual intergranular pores and intergranular dissolution pores as the main pore types, with sheet-like and necking-type throats as the dominant throat types (Figure 7b). The simple throat morphology and low tortuosity contribute to its high permeability. CT results reveal that sample KN6-2 has coarser throats and better pore connectivity (Figure 7d,f).

4.3. Fractal Characteristics of Pore-Throat in Tight Sandstone Reservoirs

4.3.1. Fractal Dimensions Based on High-Pressure Mercury Intrusion and Constant-Rate Mercury Intrusion

Based on the capillary pressure curves derived from high-pressure mercury intrusion and constant-rate mercury intrusion experiments, scatter plots were generated to illustrate the relationship between the logarithm of mercury saturation (lgSHg) and the logarithm of capillary pressure (lgpc) for each sample. Taking sample X10-1 as an example (Figure 8), analysis of the fractal dimension fitting curves from high-pressure and constant-rate mercury intrusion data of the nine samples revealed that most fractal fitting curves exhibit 3 or 4 segments. Segmented linear fitting was performed using the least squares method, and the fitting correlation coefficients (R2) for each segment range mainly from 0.6481 to 0.9920, with an average of 0.9560 (Table 4 and Table 5). These results indicate that the pore-throat structures of the tight sandstones in the Kongdian Formation of the study area possess distinct multifractal characteristics.
Since the fractal dimension fitting curve is derived from the scatter points converted from the mercury intrusion curve, the morphology of the fractal curve is in good agreement with that of the mercury intrusion curve. When the mercury intrusion curve has a high slope, the linear fitting slope of the converted fractal curve is also high, resulting in a larger fractal dimension; conversely, a smaller fractal dimension is generated [37,38,39]. Considering that both high-pressure mercury intrusion and constant-rate mercury intrusion experiments involve a continuous mercury intrusion process, it is assumed that mercury preferentially enters large pore-throat spaces first and then small ones. With a certain initial pressure applied, the non-wetting mercury first enters larger pores. Subsequently, as the pressure increases, the amount of mercury intrusion becomes very small, indicating that the non-wetting mercury is entering the throats. Based on this principle, pores and throats can be distinguished using the fractal dimension fitting curve.
In this study, the fractal dimensions corresponding to the two left segments of the fractal dimension fitting curves derived from high-pressure mercury intrusion and constant-rate mercury intrusion—representing large pores and wide throats—are defined as Dh1, Dh2 and Dc1, Dc2, respectively. The fractal dimensions corresponding to the two right segments, which reflect small pores and narrow throats, are defined as Dh3, Dh4 and Dc3, Dc4, respectively. The pore-throat radii at the intersection points are defined as rh1, rh2, rh3 and rc1, rc2, rc3, corresponding to the boundary radii of large pores, wide throats, small pores, and narrow throats (Table 4 and Table 5).
This study focuses on characterizing the full-pore-size fractal features by combining HPMI and CRMI data. Specifically, the average value of two critical radii was first calculated: rh2, the boundary radius separating large and small pore throats derived from the fractal dimension fitting curve of HPMI (Table 4), and rc2, the corresponding boundary radius from the fractal dimension fitting curve of CRMI (Table 5). Using this average radius as the splicing point, the right segment of the HPMI curve (reflecting small pores and narrow throats) was merged with the CRMI curve (reflecting large pores and wide throats) for each sample to generate a full-pore-size fractal dimension fitting curve. This integrated curve was then used to investigate the fractal characteristics across the entire pore size range.
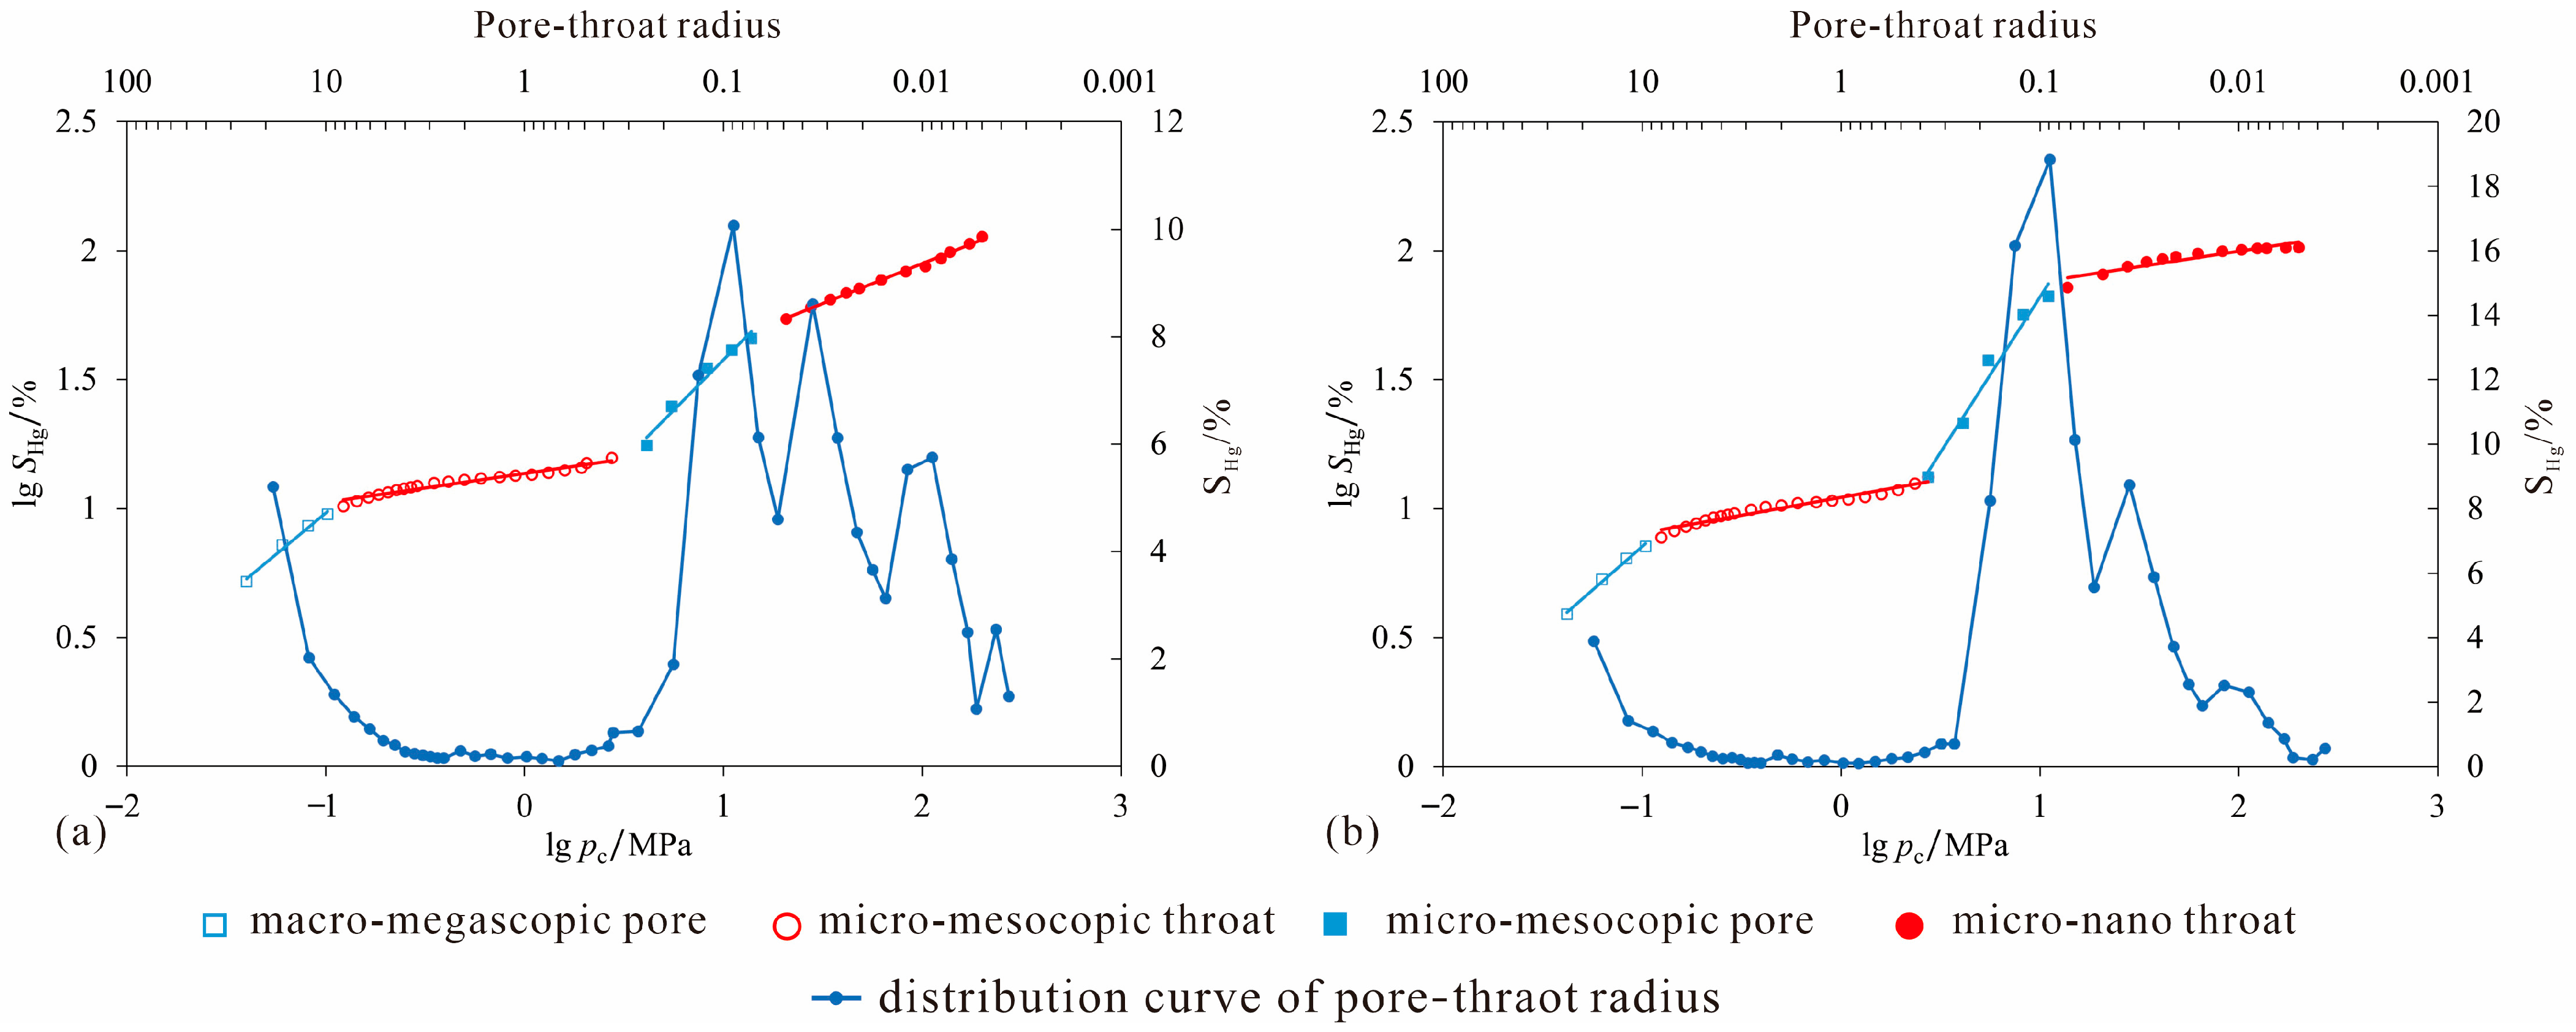
As shown in Figure 9, the full-pore-size fractal dimension fitting curve of tight sandstone samples exhibits a good coupling relationship with the pore-throat radius distribution curve. Since mercury intrusion porosimetry involves a continuous mercury injection process, with a certain initial pressure applied, the non-wetting mercury preferentially enters larger pores. Subsequently, as the pressure continues to increase, the amount of mercury intrusion becomes minimal, indicating that the non-wetting mercury is entering the throats. This allows the differentiation between pores and throats using the fractal dimension fitting curve [37]. In addition, because the fractal dimension fitting curve is derived from the scatter fitting of the transformed mercury intrusion curve, a high slope of the mercury intrusion curve corresponds to a high linear fitting slope of the transformed fractal curve, resulting in a larger fractal dimension; conversely, a lower slope leads to a smaller fractal dimension [37,39]. Based on the above principles and with reference to the pore-throat classification criteria proposed by Hartmann and Beaumont [40], the full-pore-size fractal dimensions of tight sandstone samples in the study area are divided into four intervals: macro–mega pores, micro-fine throats, micro-small pores, and micro–nano throats, which are defined as D1, D2, D3, and D4, respectively. Taking samples X10-1 and W26-2 as examples, the superposition of the full-pore-size fractal dimension fitting curve and the pore-throat radius distribution curve (Figure 9a,b) shows that non-wetting mercury first enters mega pores larger than 10.00 μm, corresponding to the full-pore-size fractal dimension D1. Subsequently, as the pressure increases within the range of 0.50–10.00 μm, the amount of non-wetting mercury intrusion remains minimal, indicating that mercury is entering relatively wide micro-fine throats, which corresponds to the full-pore-size fractal dimension D2. When the mercury intrusion pressure increases slightly within the range of 0.10 to 0.50 μm, the mercury intrusion volume surges, indicating that mercury is entering micro-medium pores, corresponding to the full-pore-size fractal dimension D3. Finally, mercury enters micro–nano throats smaller than 0.10 μm, which corresponds to the full-pore-size fractal dimension D4.
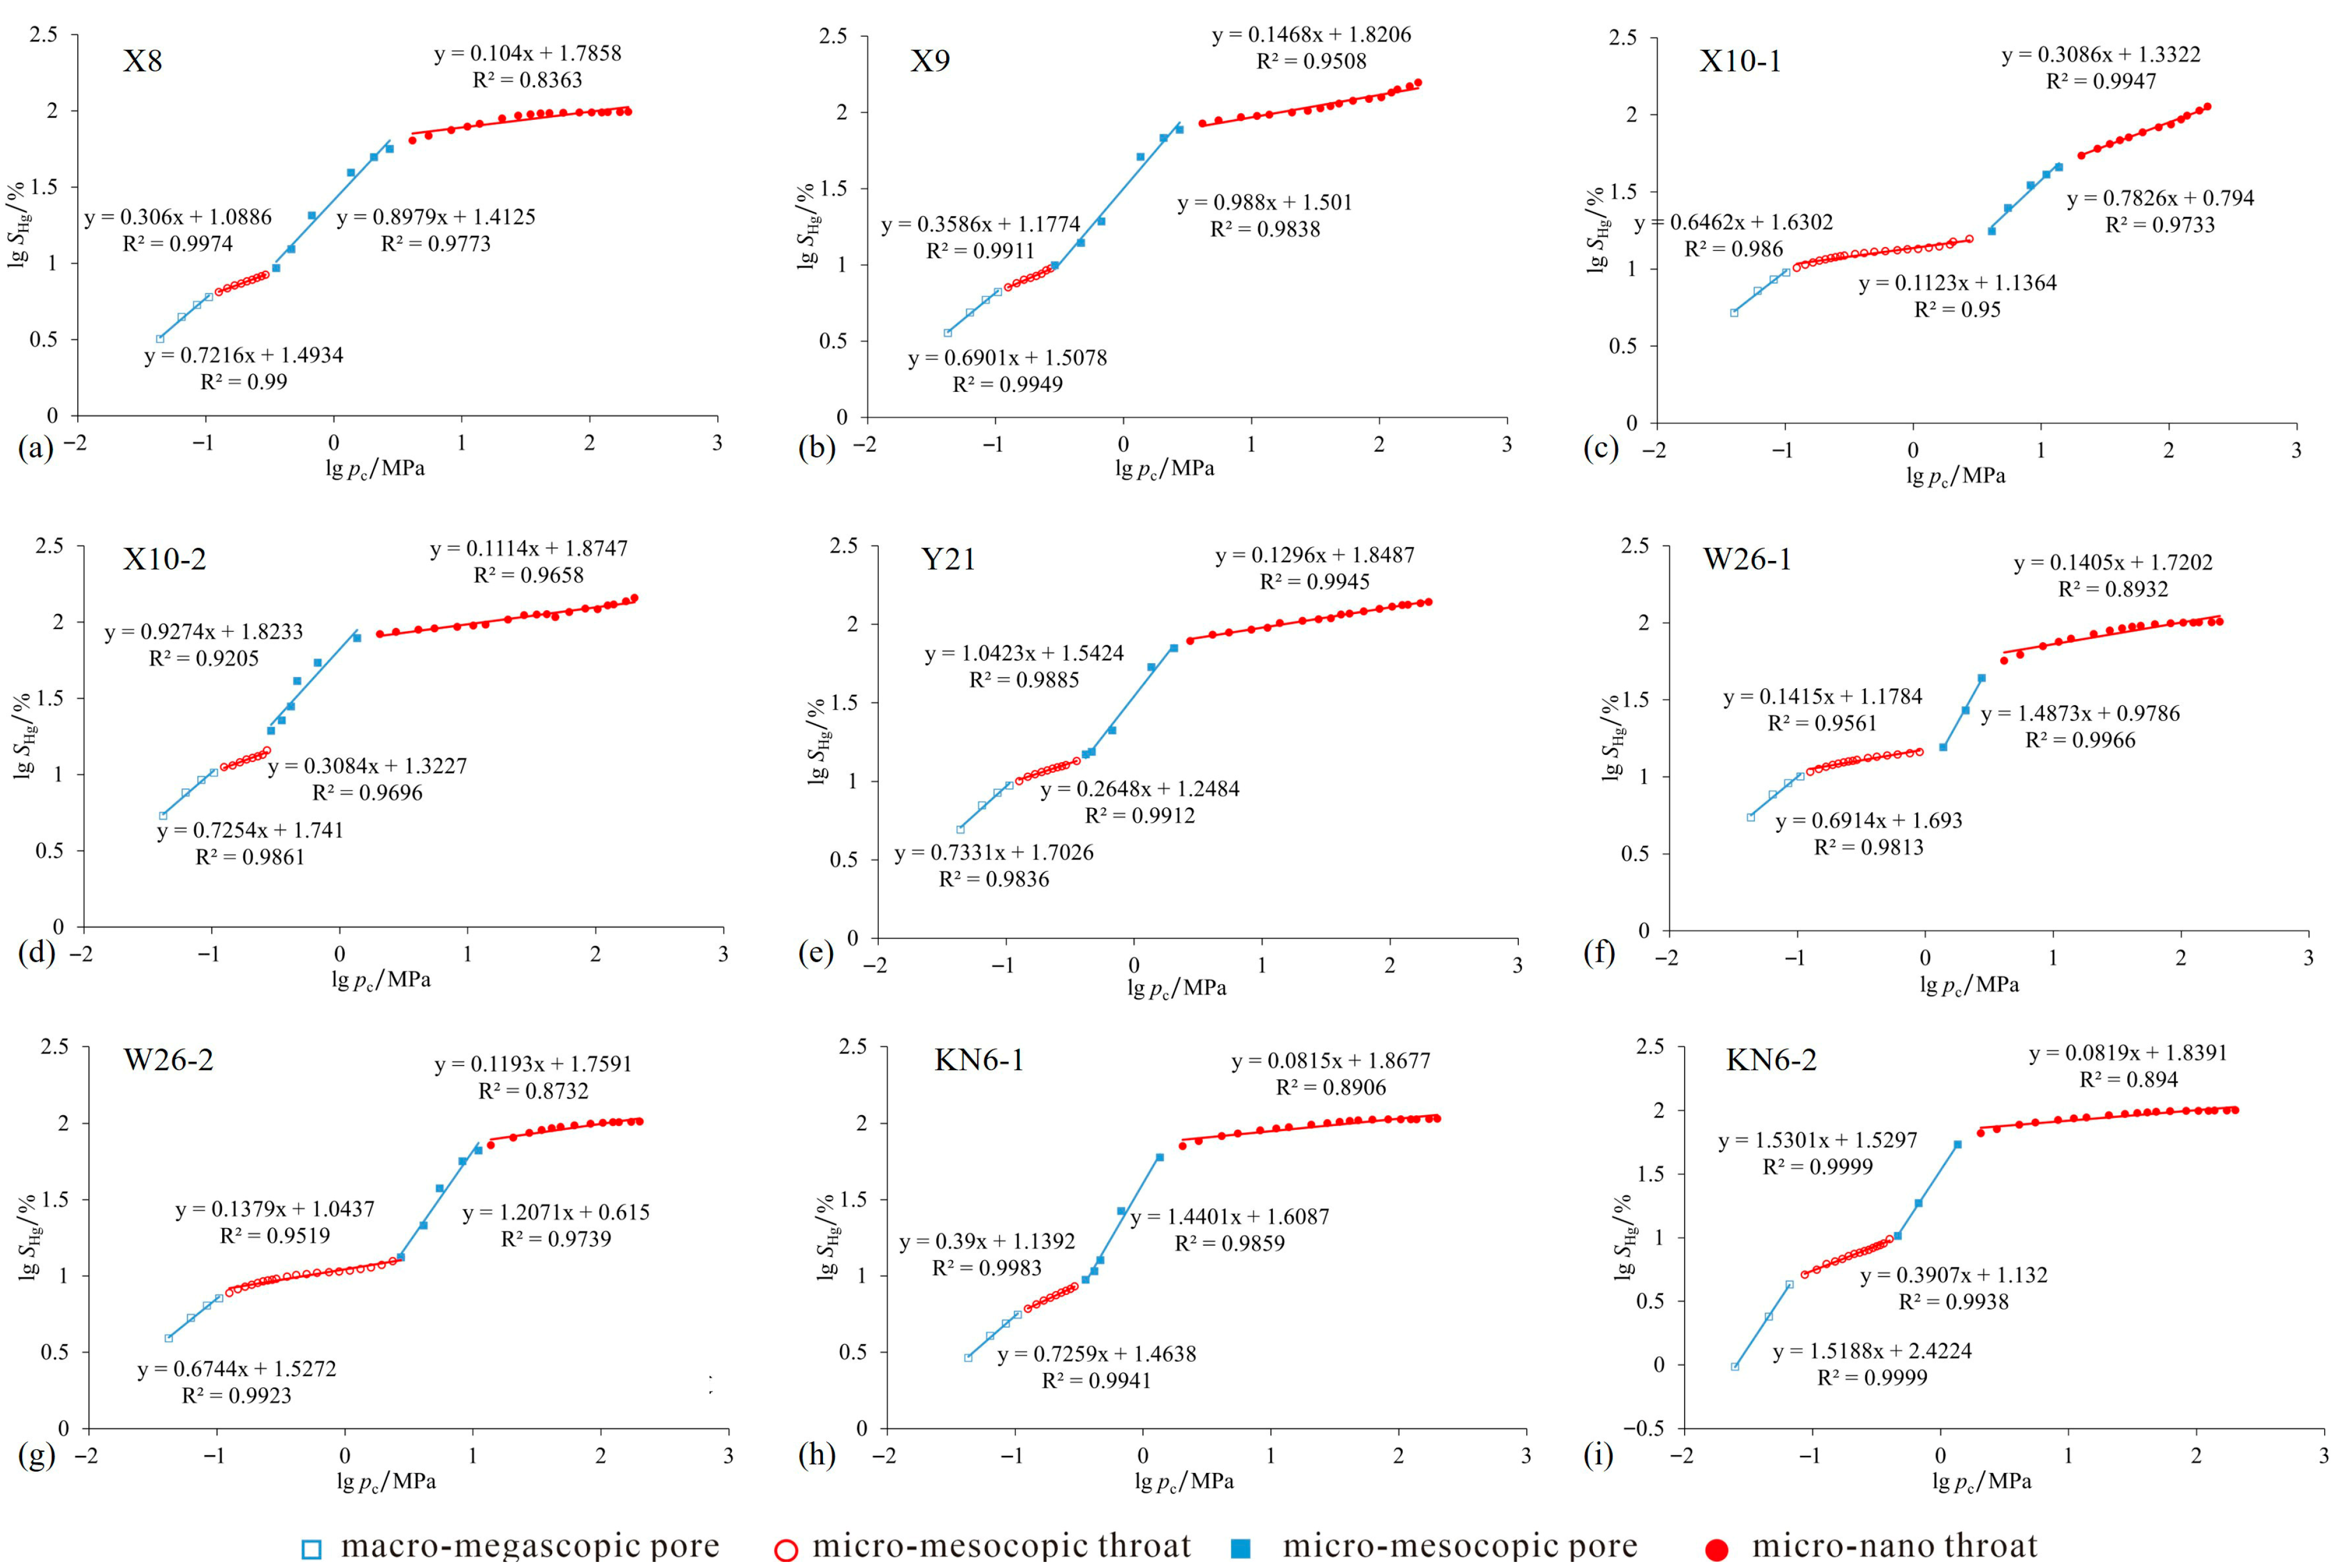
Analysis of the full-pore-size fractal fitting curves (Figure 10) reveals that all samples exhibit four distinct segments in their fractal dimension fitting curves, which provides a more reasonable characterization of the fractal features of pore structures compared to using high-pressure mercury intrusion porosimetry or constant-rate mercury intrusion alone. As shown in Table 6, the fractal dimensions of macro–mega pores (D1), micro-fine throats (D2), and micro–nano throats (D4) range from 2.7919 to 3.5188, 2.2678 to 2.3907, and 2.1359 to 2.3086, with average values of 2.6462, 2.1123, and 2.0815, respectively. In contrast, the full-pore-size fractal dimension of micro-small pores (D3) is generally greater than 3 (Table 6). Since the ideal fractal dimension for the internal pore structure of rocks is recognized to fall within the range of 2 to 3 [34], this interval (D3) does not exhibit ideal fractal characteristics. Therefore, subsequent analyses will focus primarily on the fractal dimensions of macro–mega pores (D1), micro-fine throats (D2), and micro–nano throats (D4).

4.3.2. Combined Characterization of Full-Pore-Size Distribution Using High-Pressure Mercury Intrusion and Constant-Rate Mercury Intrusion

The radius at the splicing point for the full-aperture pore-throat distribution was determined as the average of rh2 and rc2, where rh2 represents the boundary radius between large and small pore-throats derived from the fractal dimension fitting curve of high-pressure mercury intrusion porosimetry for each sample, and rc2 denotes the corresponding boundary radius from the fractal dimension fitting curve of constant-rate mercury intrusion (Table 4 and Table 5). Thus, each sample has its own unique splicing point. Taking sample X10-2 as an example, the boundary radii rh2 and rc2, between large and small pore-throats are 2.8442 μm and 2.5275 μm, respectively (Table 4 and Table 5), with an average value of 2.6859 μm. The full-aperture pore-throat distribution was then obtained by combining the high-pressure mercury intrusion data for pore-throat radii smaller than 2.8442 μm with the constant-rate mercury intrusion data for pore-throat radii larger than 2.5275 μm (Figure 11a).
Analysis of the full-range pore-throat size distribution characterized by fractal dimension splicing points (Figure 11a) reveals that the total pore-throat radius ranges from 3.60 nm to 29.67 μm. Most pore-throats are concentrated in the radius range of less than 2.5 μm, with fewer developed between 2.5 and 10 μm. Within the range of <2.5 μm, the distribution curves exhibit diverse morphologies with multiple peaks (multimodal distribution) and significant differences in peak values, primarily attributed to variations in the combinations of pore-throat sizes in tight sandstone reservoirs. The full-range pore-throat distribution curve is divided into three intervals: pore-throat radius < 0.1 μm, 0.1–2.5 μm, and >10 μm. The tight sandstone reservoirs in the study area are predominantly distributed in the ranges of 0.1–2.5 μm and <0.1 μm. A prominent peak occurs in the 0.1–2.5 μm interval, indicating that micropores and meso-pores are the most developed in the study area. In the <0.1 μm interval, all samples show a certain amount of mercury intrusion, with mercury saturation generally around 5%. This is due to the widespread development of micro–nano scale pore-throats in the study area, which can provide certain storage space and seepage channels. In the >10 μm interval, a distinct peak of mercury intrusion is observed, suggesting the presence of some macro-pores, which correspond to various dissolution pores with larger sizes. In summary, the full-range pore-throat distribution characteristics are consistent with the observations from cast thin sections and scanning electron microscopy, indicating that the full-range pore-throat distribution characterized by fractal dimension splicing points can effectively represent the pore-throat structure of tight sandstone reservoirs.
Previous studies typically characterize the full-range pore-throat distribution by simply splicing the pore size distribution < 0.12 μm obtained from SEMHPMI with that >0.12 μm derived from CRMI (Figure 11b). Comparison with the full-range pore-throat distribution characterized by the fractal dimension splicing point of HPMI and CRMI (Figure 11a) reveals that, for the pore-throat distribution characterized by splicing HPMI and CRMI at 0.12 μm, all samples exhibit a certain degree of mercury saturation loss relative to that characterized by the fractal dimension splicing point. In other words, this splicing method leads to a certain loss of pore-throats, with the most significant loss occurring in the 0.1 to 2.5 μm interval. This indicates that splicing HPMI and CRMI at 0.12 μm cannot truly and effectively characterize the full-range pore-throat distribution. Instead, using the fractal dimensions obtained from HPMI and CRMI as the splicing point to characterize the full-range pore-throat distribution is more reasonable. This method holds important significance for studying the full-range micropore-throat distribution in tight sandstone reservoirs.

5. Factors Influencing Fractal Characteristics of Pore Structure, and Connection Between Fractal Results and Reservoir Performance

5.1. Factors Influencing Fractal Dimensions

To investigate the factors affecting the magnitude of fractal dimensions, fitting curves were plotted between fractal dimensions and clay mineral contents as well as pore structure characteristic parameters (Figure 12). The results of correlation analysis between mineral contents and fractal dimensions (Figure 12) show that the macro–mega pore fractal dimension D1 and micro-fine throat fractal dimension D2 are negatively correlated with clay mineral contents (Figure 12a,b), while the micro–nano throat fractal dimension D4 is positively correlated (Figure 12c). The content of authigenic clay minerals in the study area is relatively high, which usually attach to the surfaces of mineral particles and fill in pores, reducing the connectivity of pore throats. Meanwhile, they also form certain micro–nano-scale pore throats, increasing the specific surface area of pore throats. In addition, due to the extreme instability of clay minerals, these properties can all affect the magnitude of fractal dimensions. Therefore, the clay mineral content is significantly positively correlated with the micro–nano throat fractal dimension D4, but weakly negatively correlated with the macro–mega pore fractal dimension D1 and micro-fine throat fractal dimension D2.
The correlation analysis results between pore structure characteristic parameters and fractal dimensions (Figure 12d–l) show that the macro–mega pore fractal dimension D1 and micro-fine throat fractal dimension D2 are negatively correlated with the average throat radius rc, constant-rate mercury intrusion displacement pressure Pd1, and tortuosity λ, while the micro–nano throat fractal dimension D4 shows the opposite trend. The average throat radius has a significant controlling effect on micro-fine throats and micro–nano throats but almost no impact on macro–mega pores. A larger average throat radius corresponds to a greater number of micro-fine throats, leading to better homogeneity, whereas the opposite is true for micro–nano throats. A higher displacement pressure indicates a greater number of micro–nano throats, and these throats surrounding the pores deteriorate the pore-throat connectivity and enhance the heterogeneity, thus resulting in a larger micro–nano throat fractal dimension D4, which is contrary to the cases for the macro–mega pore fractal dimension D1 and micro-fine throat fractal dimension D2. Tortuosity has a more significant controlling effect on macro–mega pores and micro-medium throats; a higher tortuosity means more complex throat morphologies and stronger throat heterogeneity, with more irregular throats surrounding the pores and poor pore-throat connectivity, consequently leading to an increase in the macro–mega pore fractal dimension D1 and micro-fine throat fractal dimension D2. Due to the extremely small scale of micro–nano throats, the impact of tortuosity on them is limited. In summary, the full-pore-size fractal dimensions are mainly controlled by the comprehensive effects of clay mineral content, average throat radius, displacement pressure, and tortuosity.

5.2. Relationship Between Fractal Dimension and Physical Properties

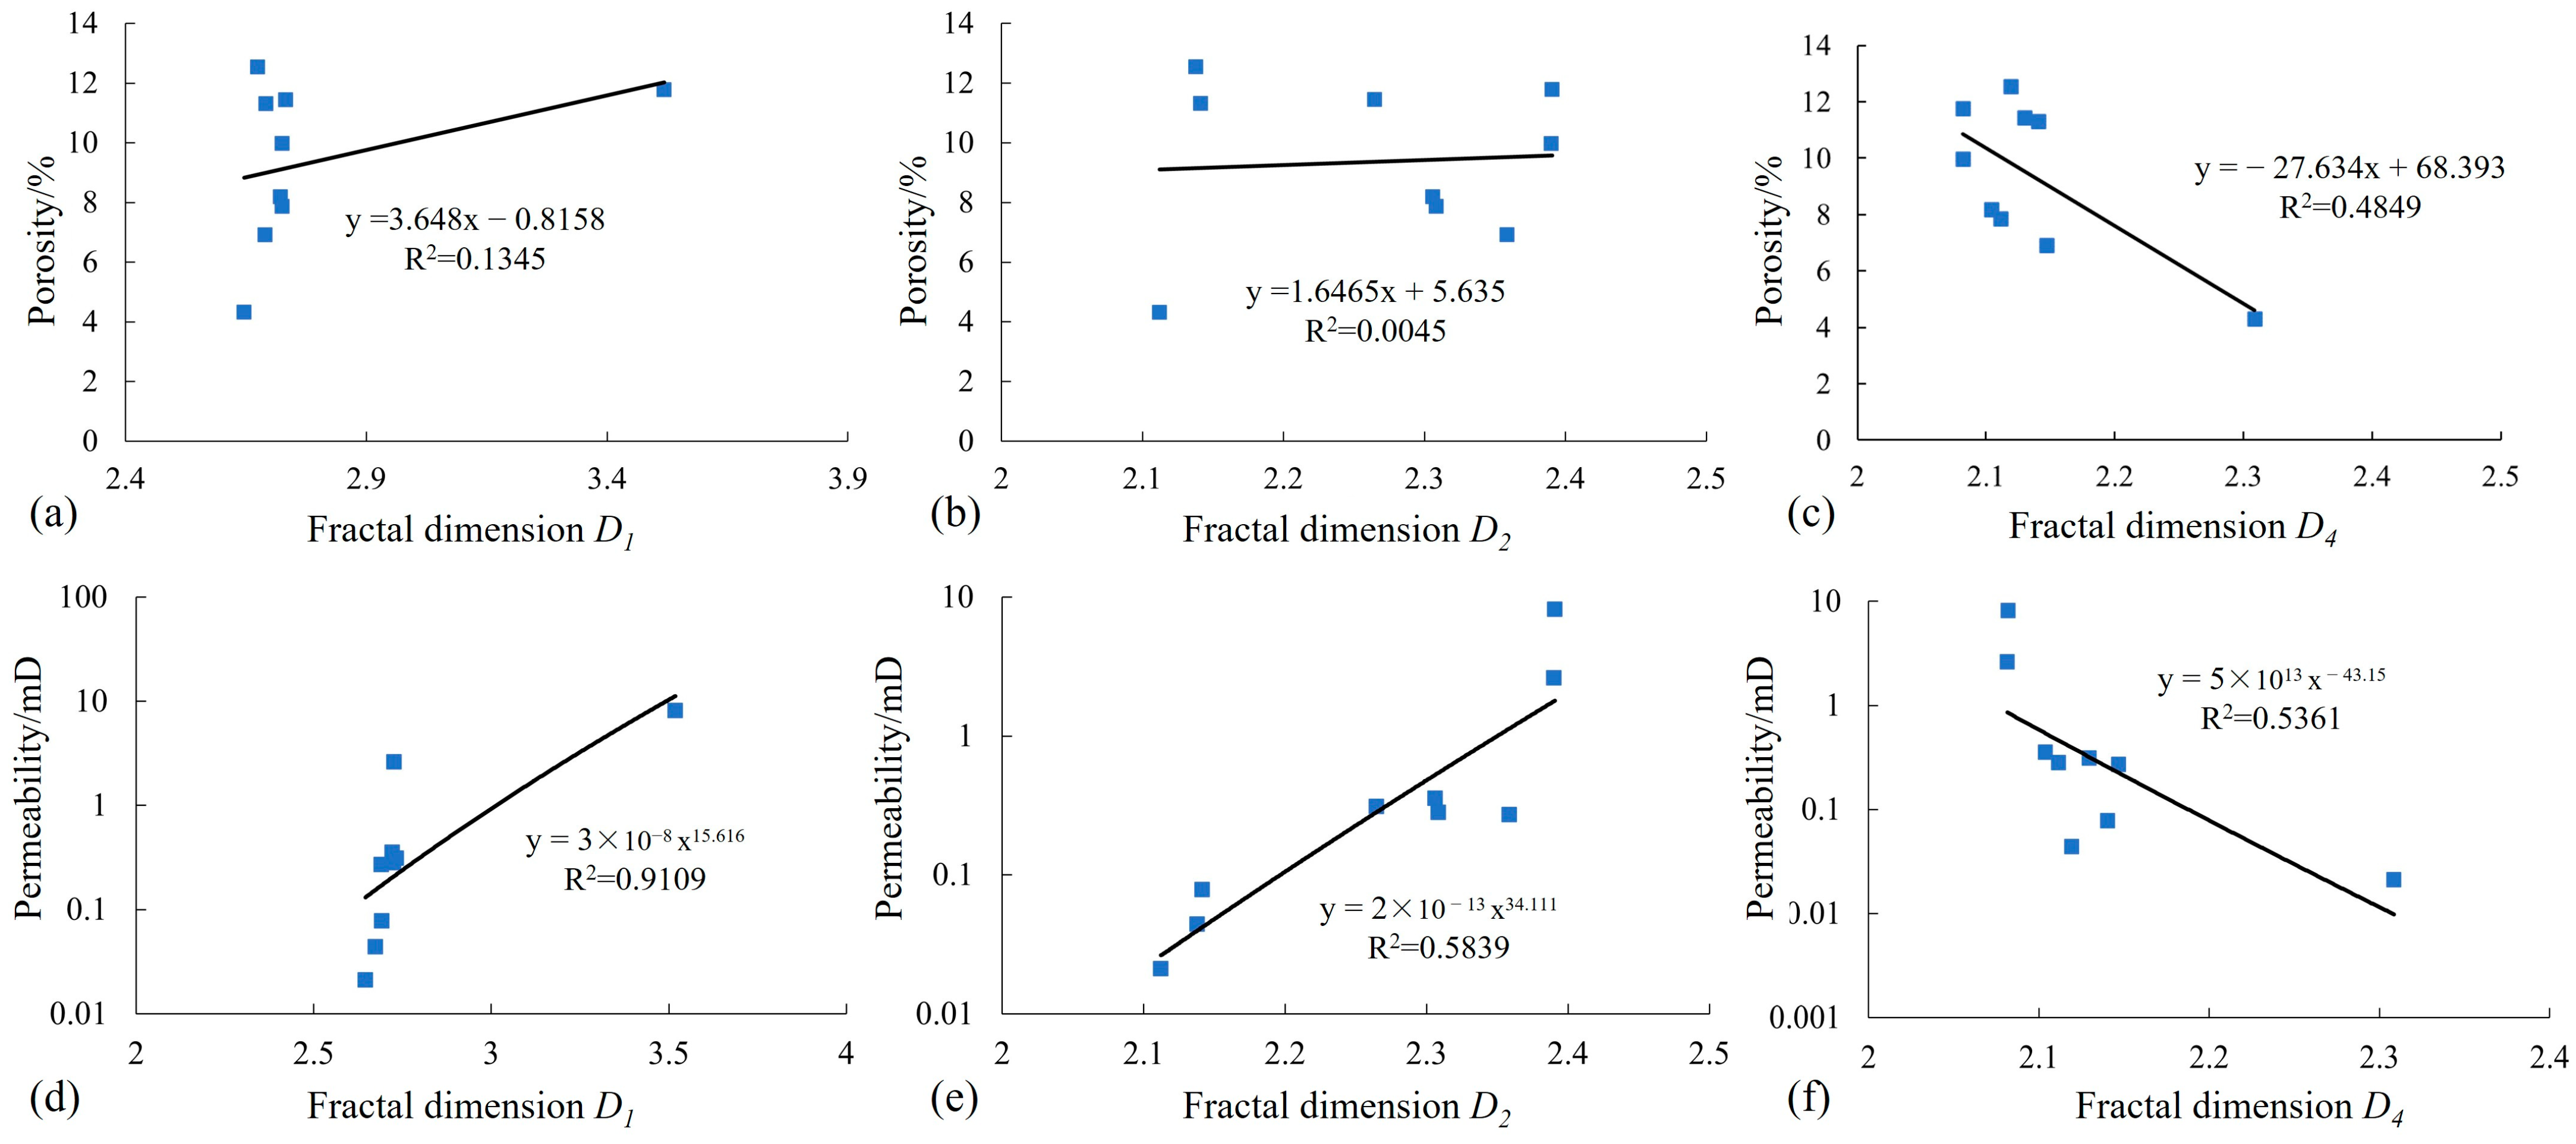
Based on the relationship between full-range fractal dimensions and petrophysical properties (Figure 13), the macro–mega pore fractal dimension D1 (Figure 13a,d) and micro-fine throat fractal dimension D2 (Figure 13b,e) exhibit positive correlations with porosity and permeability, with stronger correlations to permeability. This trend arises because the macro–mega pores and micro-fine throats in the study area are primarily provided by various dissolution pores, dominated by feldspar dissolution pores. While these dissolution pores enhance reservoir properties, their formation generates semi-connected to disconnected throats with irregular morphologies. Concurrently, clay minerals partially fill feldspar residues, further complicating the pore-throat systems. Consequently, dissolution pores increase pore-throat heterogeneity, elevating D1 and D2 values while exerting minimal impact on porosity. In contrast, the nano throat fractal dimension D4 displays negative correlations with porosity and permeability (Figure 13c,f), attributed to the prevalence of tubular throats within clay minerals. These tubular throats form complex micro-throat networks with pores; their development degrades tight sandstone reservoir quality, thereby increasing D4 values [40].
Therefore, the porosity and permeability of tight sandstones in the study area are primarily controlled by the complexity of macro–mega pores, micro-fine throats, and nano–micro throats. The development of various dissolution pores significantly improves reservoir quality, while the tubular throats developed in clay minerals reduce reservoir quality due to their strong heterogeneity. Specifically, higher quantities of macro–mega pores and micro-fine throats, along with larger fractal dimensions D1 and D2, combined with fewer nano–micro throats and a smaller fractal dimension D4, result in better reservoir quality in the tight sandstone reservoirs of the study area.

5.3. Fractal Dimension and Fluid Flow Characteristics

In low-permeability tight reservoirs, fluids exhibit two distinct occurrence states within the pores: one portion exists as movable fluid that can be displaced from rock pores under external forces, while the other portion remains immobile due to adsorption by hydrophilic clay minerals or capillary trapping [41,42]. These immobilized fluids cannot be effectively extracted during core centrifugation and is thus classified as immobile fluid. Based on NMR centrifugal experimental data, the movable fluid saturation and movable fluid porosity can be determined for samples with varying pore structures [43]. The average movable fluid saturation in Type I pore-structured reservoirs is 71.57%, while in Type II it is 51.7%. Type III pore-structured reservoirs exhibit the lowest movable fluid saturation, with a minimum value of 34.4% and an average of 39.16%. Movable fluid porosity is calculated based on the relationship between movable fluid saturation and porosity. Due to their lower porosity, Type III reservoirs show the lowest movable fluid porosity at 1.1%, with an average of 2.7%. In contrast, Type I and II reservoirs reach a maximum movable fluid porosity of 10.8%, with an average of 5.2%.
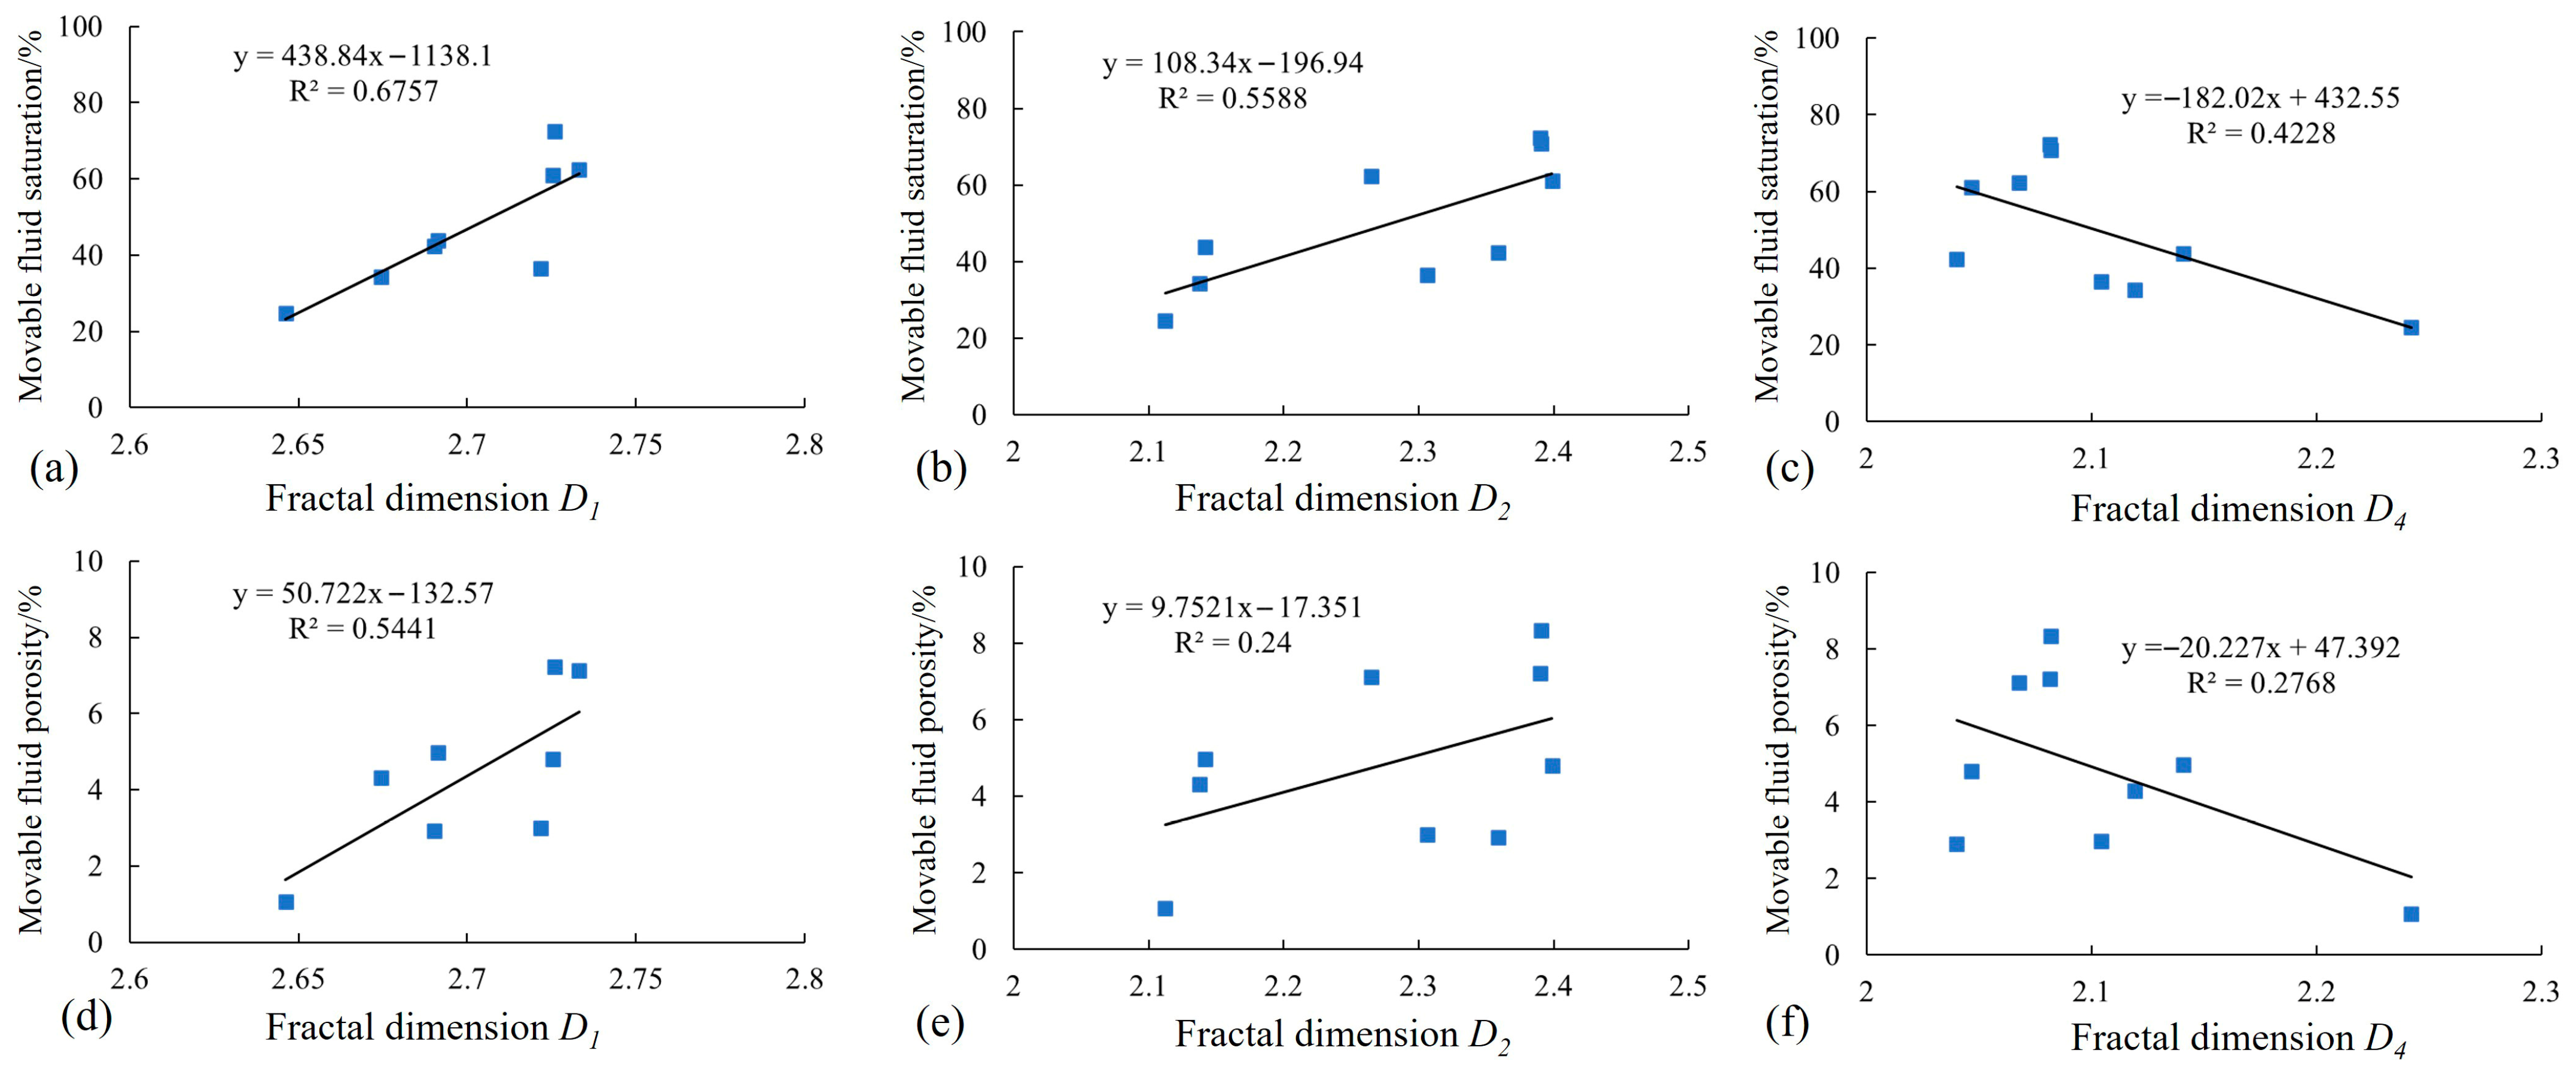
Based on the relationship between full-range fractal dimensions and movable fluid characteristics (Figure 14), the fractal dimensions D1 (reflecting macro–mega pores) and D2 (reflecting micrometer-sized large throats) exhibit positive correlations with reservoir movable fluid saturation and movable fluid porosity (Figure 14a,b,d,e). In contrast, the fractal dimension D4 (reflecting nanometer-sized pore-throat systems) shows negative correlations with these parameters (Figure 14c,f). This is because the low-permeability tight reservoirs in the study area contain numerous fine throats with small radii. These narrow throats require higher displacement pressures for fluid flow, thereby hindering overall reservoir fluid flow processes. Consequently, larger throats generally exert positive influences on fluid storage and flow, enabling relatively easier fluid mobility and predicting higher productivity. Conversely, nanometer-sized throats—predominantly comprising clay mineral-bound tubular throats—form complex micropore-throat systems with pores. Their increased development deteriorates tight sandstone reservoir properties, resulting in higher D4 fractal dimension values, reduced fluid mobility within pore throats, and inferred lower productivity.

6. Conclusions

(1) The tight sandstone reservoirs in the 2nd member of the Kongdian Formation (Kong 2 Member) exhibit diverse types of pores and throats, with intergranular dissolved pores, residual intergranular pores, and intercrystalline pores of clay minerals being the dominant pore types, and lamellar and curved-lamellar throats being the main throat types, showing strong heterogeneity in pore structure.
(2) Compared with the conventional method of characterizing the full-pore-size pore-throat distribution by splicing high-pressure and constant-rate mercury intrusion data at 0.12 μm, the characterization based on the splicing point of full-pore-size fractal dimensions is more reasonable. The overall curve presents a multi-peak pattern with obvious differences in peak values, the pore-throat distribution range is 3.6 nm to 29.66 μm, and the pore-throat distribution shows significant differences.
(3) The full-pore-size fractal dimensions D1, D2, and D4 can effectively characterize the heterogeneity of pore structure and exhibit good correlations with physical properties. The greater the number of macro–mega pores and micro-fine throats, the larger the fractal dimensions D1 and D2, indicating that the pores often have better connectivity and the tight sandstone reservoirs have better seepage capacity; the greater the number of micro–nano throats, the larger the fractal dimension D4, indicating a more complex pore structure, which leads to poorer reservoir physical properties and is unfavorable for hydrocarbon seepage. The full-pore-size fractal dimensions D1, D2, and D4 are mainly controlled by the comprehensive effects of clay mineral content, average throat radius, displacement pressure, and tortuosity.

Author Contributions

Conceptualization and methodology, Y.Z.; software, K.W.; formal analysis, K.Y.; investigation, K.W.; resources, G.H., L.M. and P.Y.; data curation, Y.L.; writing—original draft preparation, Y.Z.; writing—review and editing, K.W.; visualization, Y.L.; funding acquisition, G.H. All authors have read and agreed to the published version of the manuscript.

Funding

This research was funded by the National Natural Science Foundation of China (No. 42472178).

Data Availability Statement

All of the data and models generated or used in the present study are available from the corresponding author upon request.

Conflicts of Interest

Authors Guomeng Han, Liangang Mou and Peng Yang are employed by the PetroChina Dagang Oilfield Company. The remaining authors declare that they have no known competing financial interest or personal relationships that might have influenced the work presented in this article.

Abbreviations

HPMIHigh-pressure mercury intrusion
MIPMercury intrusion porosimetry
NMRNuclear magnetic resonance
SEMScanning electron microscopy
CRMIConstant-rate mercury injection
XRDX-ray diffraction

References

  1. Zou, C.N.; Zhang, G.Y.; Tao, S.Z.; Hu, S.Y.; Li, X.D.; Li, J.Z.; Dong, D.Z.; Zhu, R.K.; Yuan, X.J.; Hou, L.H.; et al. Geological features, major discoveries and unconventional petroleum geology in the global petroleum exploration. Pet. Explor. Dev. 2010, 37, 129–145. (In Chinese) [Google Scholar] [CrossRef]
  2. Zou, C.N.; Zhu, R.K.; Bai, B.; Yang, Z.; Hou, L.H.; Zha, M.; Fu, J.H.; Shao, Y.; Liu, K.Y.; Cao, H.; et al. Significance, geologic characteristics, resource potential and future challenges of tight oil and shale oil. Bull. Mineral. Petrol. Geochem. 2015, 34, 3–17. (In Chinese) [Google Scholar]
  3. Zou, C.N.; Yang, Z.; He, D.B.; Wei, Y.S.; Li, J.; Jia, A.L.; Chen, J.J.; Zhao, Q.; Li, Y.L.; Li, J.; et al. Theory, technology and prospects of conventional and unconventional natural gas. Pet. Explor. Dev. 2018, 45, 575–587. (In Chinese) [Google Scholar] [CrossRef]
  4. Jia, C.Z. Breakthrough and significance of unconventional oil and gas to classical petroleum geological theory. Pet. Explor. Dev. 2017, 44, 1–11. (In Chinese) [Google Scholar] [CrossRef]
  5. Hu, S.Y.; Zhu, R.K.; Wu, S.T.; Bai, B.; Yang, Z.; Cui, J.W. Profitable exploration and development of continental tight oil in China. Pet. Explor. Dev. 2018, 45, 737–748. (In Chinese) [Google Scholar] [CrossRef]
  6. Zou, C.N.; Zhu, R.K.; Liu, K.Y.; Su, L.; Bai, B.; Zhang, X.X.; Yuan, X.J.; Wang, J.H. Tight gas sandstone reservoirs in China: Characteristics and recognition criteria. J. Pet. Sci. Eng. 2012, 88–89, 82–91. (In Chinese) [Google Scholar] [CrossRef]
  7. Yao, J.L.; Deng, X.Q.; Zhao, Y.D.; Han, T.Y.; Chu, M.J.; Pang, J.L. Characteristics of tight oil in Triassic Yanchang Formation, Ordos Basin. Pet. Explor. Dev. 2013, 40, 150–158. (In Chinese) [Google Scholar] [CrossRef]
  8. Ming, D.Q.; Chang, X.C.; Shang, F.K.; Zhang, P.F.; Xu, Y.D.; Qu, Y.S.; Gao, W.Z.; Ge, T.C.; Zhao, H.K. Heterogeneity of pore structure in braided river delta tight sandstone reservoirs: Implications for tight oil enrichment in the Jurassic Badaowan Formation, central Junggar Basin. Nat. Resour. Res. 2025, 34, 1743–1771. [Google Scholar] [CrossRef]
  9. Gong, L.; Gao, X.Z.; Qu, F.T.; Zhang, Y.S.; Zhang, G.Y.; Zhu, J. Reservoir quality and controlling mechanism of the Upper Paleogene fine-grained sandstones in lacustrine basin in the hinterlands of northern Qaidam Basin, NW China. J. Earth Sci. 2023, 34, 806–823. [Google Scholar] [CrossRef]
  10. Cao, Z.; Liu, G.D.; Liu, Z.X.X.; Yuan, Y.F.; Wang, P.; Niu, Z.C.; Zhang, J.Y. Research status on tight oil and its prospects. Nat. Gas Geosci. 2014, 25, 1499–1508. (In Chinese) [Google Scholar] [CrossRef]
  11. Higgs, K.E.; Zwingmann, H.; Reyes, A.G.; Funnell, R.H. Diagenesis, porosity evolution, and petroleum emplacement in tight gas reservoirs, Taranaki basin, New Zealand. J. Sediment. Res. 2007, 77, 1003–1025. [Google Scholar] [CrossRef]
  12. Desbois, G.; Urai, J.L.; Kukla, P.A.; Konstanty, J.; Baerle, C. High-resolution 3D fabric and porosity model in a tight gas sandstone reservoir: A new approach to investigate microstructures from mm-to nm-scale combing argon beam cross sectioning and SEM imaging. J. Pet. Sci. Eng. 2011, 78, 243–257. [Google Scholar] [CrossRef]
  13. Lai, J.; Wang, G.W.; Wang, Z.; Chen, J.; Pang, X.J.; Wang, S.C.; Zhou, Z.L.; He, Z.B.; Qin, Z.Q.; Fan, X.Q. A review on pore structure characterization in tight sandstones. Earth-Sci. Rev. 2018, 177, 436–457. [Google Scholar] [CrossRef]
  14. Purcell, W.R. Capillary Pressures—Their measurement using mercury and the calculation of permeability therefrom. Trans. AIME 1949, 186, 39–48. [Google Scholar] [CrossRef]
  15. Katz, A.J.; Thompson, A.H. Fractal sandstone pores: Implications for conductivity and pore formation. Phys. Rev. Lett. 1985, 54, 1325–1328. [Google Scholar] [CrossRef]
  16. Liu, X.F.; Wang, J.F.; Lin, G.; Hu, F.L.; Li, C.L.; Li, X.; Yu, J.; Xu, H.J.; Lu, S.F.; Xue, Q.Z. Pore-scale characterization of tight sandstone in Yanchang Formation Ordos Basin China using micro-CT and SEM imaging from nm to cm-scale. Fuel 2017, 209, 254–264. [Google Scholar] [CrossRef]
  17. Zhang, C.M.; Chen, Z.B.; Zhang, Z.S.; Li, J.; Ling, H.; Sun, B.D. Based on NMR T2 study on pore fractal structure of reservoir rock based on spectrum distribution. J. Oil Gas Technol. 2007, 4, 80–86. (In Chinese) [Google Scholar]
  18. Guo, X.B.; Huang, Z.L.; Zhao, L.B.; Han, W.; Ding, C.; Sun, X.W.; Yan, R.T.; Zhang, T.H.; Yang, X.J.; Wang, R.M. Pore structure and multi-fractal analysis of tight sandstone using MIP, NMR and NMRC methods: A case study from the Kuqa depression, China. J. Pet. Sci. Eng. 2019, 178, 544–558. [Google Scholar] [CrossRef]
  19. Broseta, D.; Barré, L.; Vizika, O. Capillary condensation in a fractal porous medium. Phys. Rev. Lett. 2001, 86, 5313. [Google Scholar] [CrossRef]
  20. Li, K.W.; Horne, R.N. Fractal modeling of capillary pressure curves for the Geysers rocks. Geothermics 2006, 35, 198–207. [Google Scholar] [CrossRef]
  21. Giri, A.; Tarafdar, S.; Gouze, P.; Dutta, T. Fractal pore structure of sedimentary rocks: Simulation in 2-D using a relaxed bidisperse ballistic deposition model. J. Appl. Geophys. 2012, 87, 40–45. [Google Scholar] [CrossRef]
  22. Lai, J.; Wang, G.W. Fractal analysis of tight gas sandstones using high-pressure mercury intrusion techniques. J. Nat. Gas Sci. Eng. 2015, 24, 185–196. [Google Scholar] [CrossRef]
  23. Sakhaee-Pour, A.; Li, W.F. Fractal dimensions of shale. J. Pet. Sci. Eng. 2016, 30, 578–582. [Google Scholar] [CrossRef]
  24. Kulesza, S.; Bramowicz, M. A comparative study of correlation methods for determination of fractal parameters in surface characterization. Appl. Surf. Sci. 2014, 293, 196–201. [Google Scholar] [CrossRef]
  25. Mandelbrot, B.B. Fractals: Form, Chance and Dimension; W. H. Freeman: New York, NY, USA, 1977. [Google Scholar]
  26. Cai, J.C.; Wei, W.; Hu, X.Y.; Wood, D.A. Electrical conductivity models in saturated porous media: A review. Earth Sci. Rev. 2017, 171, 419–433. [Google Scholar] [CrossRef]
  27. Xie, S.Y.; Cheng, Q.M.; Ling, Q.C.; Li, B.; Bao, Z.Y.; Fan, P. Fractal and multifractal analysis of carbonate pore-scale digital images of petroleum reservoirs. Mar. Pet. Geol. 2010, 27, 476–485. [Google Scholar] [CrossRef]
  28. Hu, Q.H.; Ewing, R.P.; Dultz, C.S. Low pore connectivity in natural rock. J. Contam. Hydrol. 2012, 133, 76–83. [Google Scholar] [CrossRef]
  29. Hao, R.L.; Huang, W.H.; Bo, J.; Yuan, L. Fractal characteristics and main controlling factors of high-quality tight sandstone reservoirs in the southeastern Ordos Basin. Pet. Geol. 2024, 35, 631–641. [Google Scholar] [CrossRef]
  30. Jiao, Y.X. Sedimentary Characteristics and Study of the Formation Conditions of Fine-Grained Mixed Sedimentary Rocks in the Second Member of Kongdian Formation in Cangdong Sag. Master Thesis, China University of Petroleum (East China), Dongying, China, 2017. (In Chinese). [Google Scholar]
  31. Liu, Z.C.; Zhou, Y.W.; Yang, P.; Shao, H.F.; Mu, L.G.; Lin, L.; Yuan, X.H. The reservoir control mechanism by fault-sand coupling in faulted basin and its exploration discovery: A case study of the member 2 of Kongdian Formation in Nanpi slope of Cangdong Sag, Bohai Gulf, China. J. Chengdu Univ. Technol. 2020, 47, 645–651. (In Chinese) [Google Scholar] [CrossRef]
  32. Xu, Z.X.; Zhang, Y.J.; Wang, J.F.; Liu, H.T.; Jiang, W.Y. Quantitative characterization of pore structure of the second member of Kongdian Formation tight reservoirs in Cangdong sag. Nat. Gas Geosci. 2016, 27, 102–110. (In Chinese) [Google Scholar] [CrossRef]
  33. Deng, Y.; Pu, X.G.; Chen, S.Y.; Yan, J.H.; Shi, Z.N.; Zhang, W.; Han, W.Z. Analysis on reservoir characteristics and main controlling factors of fine-grained migmatite—Taking Kong 2 member of Cangdong sag in Bohai Bay Basin as an example. J. China Univ. Min. Technol. 2019, 48, 1301–1316. (In Chinese) [Google Scholar]
  34. Li, P.; Zheng, M.; Bi, H.; Wu, S.T.; Wang, X.R. Pore throat structure and fractal characteristics of tight oil sandstone: A case study in the Ordos basin, China. J. Pet. Sci. Eng. 2017, 149, 665–674. [Google Scholar] [CrossRef]
  35. Mandelbrot, B.B. On the geometry of homogenous turbulence, with stress on the fractal dimension of the iso-surfaces of scalars. J. Fluid Mech. 2006, 72, 401–416. [Google Scholar] [CrossRef]
  36. Shao, X.H.; Pang, X.Q.; Li, H.; Zhang, X. Fractal analysis of pore network in tight gas sandstones using NMR method: A case study from the Ordos basin, China. Energy Fuels 2017, 31, 10358–10368. [Google Scholar] [CrossRef]
  37. Wang, W.R.; Yue, D.L.; Eriksson, K.A.; Qu, X.F.; Li, W.; Lv, M.; Zhang, J.Q.; Zhang, X.T. Quantification and prediction of pore structures in tight oil reservoirs based on multifractal dimensions from integrated pressure and rate controlled porosimetry for the upper Triassic Yanchang Formation, Ordos Basin, China. Energy Fuels 2020, 34, 4366–4383. [Google Scholar] [CrossRef]
  38. Chen, F.Y.; Zhou, Y.; Yang, D.J.; Wan, H.F. Study of pore structure of tight sandstone reservoir based on fractal theory: A case study from Chang 7 tight sandstone of Yanchang formation in Qingcheng area, Ordos Basin. J. China Univ. Min. Technol. 2022, 51, 944–958. (In Chinese) [Google Scholar] [CrossRef]
  39. Li, K.W. Analytical derivation of Brooks-Corey type capillary pressure models using fractal geometry and evaluation of rock heterogeneity. J. Pet. Sci. Eng. 2010, 73, 20–26. [Google Scholar] [CrossRef]
  40. Wang, W.; Chen, Z.B.; Xu, S.; Li, Y.H.; Zhu, Y.S.; Huang, X.Y. Fractal characteristics and its controlling factors of pore-throat with different scales of in tight sandstones of the Yanchang Formation in Ordos Basin. Pet. Geol. Exp. 2022, 44, 33–40. (In Chinese) [Google Scholar]
  41. Harmann, D.J.; Beaumont, E.A. Predicting Reservoir System Quality and Performance. In Exploring for Oil and Gas Traps, AAPG Treatise of Petroleum Geology, Handbook of Petroleum Geology; Beaumont, E.A., Foster, N.H., Eds.; AAPG: Tulsa, OK, USA, 1999; pp. 438–456. [Google Scholar]
  42. Chang, B.; Tong, Q.; Cao, C.; Zhang, Y.D. Effect of pore-throat structure on movable fluid and gas–water seepage in tight sandstone from the southeastern Ordos Basin, China. Sci. Rep. 2025, 15, 7714. [Google Scholar] [CrossRef] [PubMed]
  43. Zhang, N.; Wang, X.Y.; Wang, S.D.; Wang, H.Y. Pore structure analysis of tight sandstone based on nuclear magnetic resonance and fractal techniques. Acta Geophys. 2025. [Google Scholar] [CrossRef]
Figure 1. Structural unit division and study area location of the Nanpi slope in Cangdong Sag, Baihai Bay Basin (Adapted from [33]).
Fractalfract 09 00608 g001
Figure 2. Ternary diagram showing the QFL detrital composition of the Kong 2 sandstones in the Nanpi Slope plotted.
Fractalfract 09 00608 g002
Figure 3. Microscopic characteristics of pore and throat types of tight sandstone reservoirs in the Kongdian Formation in the Nanpi Slope. (a) Residual intergranular pores developed, Well X10, 3547.8 m, PPL; (b) residual intergranular pores and intergranular dissolution pores, Well KN6, 3746 m, PPL; (c) intergranular dissolution pores developed, with locally observed feldspar dissolution cast molds, Well X9, 3524.8 m, PPL; (d) intergranular dissolution pores developed, showing grain dissolution residues, Well X10, 3540.2 m, PPL; (e) feldspar intragranular dissolution pores, Well KN6, 3570.3 m, PPL; (f) lithic fragment and feldspar intragranular dissolution pores developed, Well W26, 3632.3 m, PPL; (g) intergranular pores, feldspar dissolution pores, and clay minerals (e.g., illite-smectite mixed-layer) in intergranular/grain-surface, Well X10, 3545.5 m, SEM; (h) grain-surface microcrystalline quartz and clay minerals (e.g., chlorite), Well X9, 3930.15 m, SEM; (i) intercrystalline micropores in intergranular chlorite, Well X10, 3545.5 m, SEM. F: feldspar; Ch: Chlorite; Q: quartz; VR: volcanic rock fragment.
Fractalfract 09 00608 g003
Figure 4. Pore structure classification based on high-pressure mercury injection data (HPMI). (a) Characteristics of capillary pressure curve of different samples; (b) pore-throat radius distribution characteristics of different samples.
Fractalfract 09 00608 g004
Figure 5. Characterization of pore radius (a) and throat radius (b) distribution based on constant-rate mercury injection (CRMI) experiments. I, II and III represent the pore structure types, the red dot line is type I, the yellow dot line is type II, and the sky blue dot line is type III.
Fractalfract 09 00608 g005
Figure 6. Plots showing correlation between permeability and average throat radius (a), and correlation between permeability and tortuosity (b) in tight sandstone samples in the Kongdian Formation in the Nanpi Slope.
Fractalfract 09 00608 g006
Figure 7. Compaction of microscopic characteristics of pore structure of different samples with different tortuosity. (a,b) Casting thin photograph showing the characteristics of various pores and throats, occurred in blue color; (c,d) Sphere-stick model of pore and throats, the red spheres represent pores and green sticks represent throats; (e,f) 3D visualization of pore connectivity network of the sub-volumes, the pores colored in the same color are connected. (a,c,e) from sample W26-2, 3632.3 m, (b,d,f) from sample KN6-2, 3750.3 m. F: feldspar; VR: volcanic rock fragment.
Fractalfract 09 00608 g007
Figure 8. Fractal dimension fitting curve for sample X10-1 based on high-pressure mercury injection method (a) and constant-rate mercury injection method (b).
Fractalfract 09 00608 g008
Figure 9. Fractal dimension fitting curves and throat radius distribution plots for sample X10-1 (a) and sample W26-2 (b).
Fractalfract 09 00608 g009
Figure 10. Fractal dimension fitting curves for full-range pore size characterization in the Kongdian Formation tight sandstones via synergistic integration of HPMI and CRMI.
Fractalfract 09 00608 g010
Figure 11. Full-range pore-throat distribution via HPMI-CRMI integration, (a) characterized by fractal-dimension transition point; (b) integration of pore-throat distribution at fixed radius threshold of 0.12 μm.
Fractalfract 09 00608 g011
Figure 12. Relationship between full-pore-size fractal dimensions and clay mineral content, pore structure characteristic parameters of tight sandstone samples in the study area. (ac) relationship between full-range fractal dimensions D1, D2 and D4 and clay mineral contents; (df) relationship between full-range fractal dimensions D1, D2 and D4 and average throat radius; (gi) relationship between full-range fractal dimensions D1, D2 and D4 and displacement pressure; (jl) relationship between full-range fractal dimensions D1, D2 and D4 and tortuosity.
Fractalfract 09 00608 g012
Figure 13. Relationship between full-range fractal dimensions D1, D2 and D4 and physical properties of tight sandstone samples in the study area. (ac) relationship between D1, D2 and D4 and porosity; (df) relationship between D1, D2 and D4 and permeability.
Fractalfract 09 00608 g013
Figure 14. Relationship between full-range fractal dimensions D1, D2 and D4 and movable fluid saturation (and movable fluid porosity) of tight sandstone samples in the study area. (ac) relationship between D1, D2 and D4 and movable fluid saturation; (df) relationship between D1, D2 and D4 and movable fluid porosity.
Fractalfract 09 00608 g014
Table 1. The involved equipment information.
Experimental MethodInstrument Name/ModelManufactureCity and Country
HPMIAutoPore IV 9505Micromeritics Instrument CorporationNorcross, GA, USA
CRMICoretest ASPE-730Coretest Systems Inc.Roseville, CA, USA
Micro CTCarl Zeiss Xradia 520 VersaCarl Zeiss AGPleasanton, CA, USA
SEMTM4000plusHitachiTokyo, Japan
NMRMARAN DRX 2Oxford Instruments plcAbingdon, Oxfordshire, UK
XRDD8 ADVANCEBrukerKarlsruhe, Germany
Table 2. The key characteristic parameters of different types of pore structures based on HPMI experiment.
Pore Structure TypeSample
No.
Depth
/m
Porosity
/%
Permeability
/mD
Ra
/μm
Rp
/μm
R50
/μm
SpSkpDαSHgmax
/%
We
/%
Pd
/Mpa
KN6-23750.3011.788.1551.5870.4880.5072.4310.5894.4960.30794.33228.190.463
KN6-13746.009.972.60991.5850.5390.5552.0280.5253.380.3498.31929.1640.464
X83484.208.190.3551.5770.4420.2322.5840.3056.4040.2889.35329.5970.466
Y213511.6011.440.311.5790.4450.4581.980.4813.9680.28296.98824.0340.465
X10-23547.807.860.2812.8440.6850.3663.4460.5076.1860.24171.04821.0520.258
X93522.706.910.2711.5780.4570.4662.1450.4954.1370.28990.07924.1110.466
W26-13623.3011.310.0780.5330.190.1452.1760.45112.2040.35690.49733.0081.379
W26-23634.3012.540.0440.2690.0910.0851.7070.41818.0290.33894.66832.1152.737
X10-13533.854.320.0210.2680.0630.0282.1320.03639.1090.23583.92841.5652.746
Ra: maximum pore-throat radius; Rp: average pore-throat radius; R50: median pore-throat radius; Sp: sorting coefficient; Skp: skewness; D: relative sorting coefficient; α: homogeneity coefficient; SHgmax: maximum mercury intrusion saturation; We: mercury withdrawal efficiency; Pd: displacement pressure.
Table 3. The key characteristic parameters of different types of pore structures based on CRMI experiment.
Pore Structure TypeSample
No.
Depth
/m
Porosity
/%
Permeability
/mD
Rt
/μm
Rp
/μm
ηRmax
/μm
Sf
/%
Sp
/%
St
/%
ελPd
/MPa
IKN6-23750.3011.788.1551.116190.579197.0335.56856.10219.04637.0560.5142.7660.132
KN6-13746.009.972.60991.113190.225196.1312.08265.41326.65038.7630.68810.7970.353
X83484.208.190.3551.562185.848131.3491.66747.2188.64238.5760.22411.4900.441
Y213511.6011.440.311.234189.573171.0721.58173.84926.93746.9120.57420.7140.465
X10-23547.807.860.2811.621192.413129.0191.52570.42329.15641.2670.70717.4220.482
X93522.706.910.2711.188190.889185.7821.50360.06017.75742.3030.42013.9760.489
IIW26-13623.3011.310.0780.468196.453411.5070.92950.3125.89544.4170.13330.2750.791
W26-23634.3012.540.0447.000194.318436.0710.74542.4460.86041.5860.02133.7960.986
IIIX10-13533.854.320.02116.250205.313100.0000.56031.0310.38730.6440.01325.3721.312
Rt: average throat radius; Rp: average pore radius; η: average pore-throat radius ratio; Rmax: maximum connected pore-throat radius; Sf: final mercury injection saturation; Sp: total pore mercury injection saturation; St: total throat mercury injection saturation; ε: total pore/throat volume ratio; λ: tortuosity; Pd: displacement pressure.
Table 4. Fractal dimension (D), R2 value, and cross-point throat radius from high-pressure mercury injection (HPMI) for tight sandstone samples in the study area.
Sample
No.
Depth
/m
Porosity
/%
Permeability
/mD
Dh1R2Dh2R2Dh3R2Dh4R2rh1/μmrh2/μmrh3/μm
KN6-23750.3011.788.155 2.18810.89223.31660.98362.07860.9041 2.82830.3564
KN6-13746.009.972.60990.99030.96172.12240.98173.31660.98362.0803 21.39512.85870.3596
X83484.208.190.3552.61760.99852.17910.98264.03430.93292.15470.845321.39321.57680.5398
Y213511.6011.440.31 2.16760.96863.31660.98362.0910.8451 2.84310.3589
X10-23547.807.860.2812.5420.98032.15420.95143.31660.98362.06570.889921.39202.84420.3583
X93522.706.910.2712.67760.99992.14130.96613.69060.98182.04240.648121.39322.84960.3578
W26-13623.3011.310.0782.65410.99082.07680.95833.31660.98362.14560.884721.39511.08450.5329
W26-23634.3012.540.044 2.10770.96033.31660.98362.13160.870.54050.0667
X10-13533.854.320.0212.60020.96472.10590.93493.31660.98362.33550.956921.40510.35850.0890
Table 5. Fractal dimension (D), R2 value, and cross-point throat radius from constant-rate mercury injection (CRMI) for tight sandstone samples in the study area.
Sample
No.
Depth
/m
Porosity
/%
Permeability
/mD
Dc1R2Dc2R2Dc3R2Dc4R2rc1/μmrc2/μmrc3/μm
KN6-23750.3011.788.1553.56960.95092.40130.99513.34810.97852.24060.941611.10971.83740.6875
KN6-13746.009.970.6342.72590.99412.390.96133.70540.99922.36050.98527.00582.52050.5507
X83484.208.190.3552.78050.99492.3210.99483.333980.98822.40250.98228.63802.51281.2133
Y213511.6011.440.312.81060.99222.2880.98983.73110.98922.23460.93578.62732.07210.9800
X10-23547.807.860.2812.79790.99452.41570.99623.24860.98172.13770.93178.85722.52750.9808
X93522.706.910.2712.73360.99832.36380.99563.09840.9922.27980.95728.79252.52550.6780
W26-13623.3011.310.0782.69140.98132.13790.96133.70540.99922.36050.98526.98180.68740.3820
W26-23634.3012.540.0442.63280.98752.12610.95863.27780.8876 5.90170.3123
X10-13533.854.320.0212.59860.97952.10110.95752.9410.9768 5.99320.3112
Table 6. Full-range pore size fractal dimensions and R2 coefficients characterized by integrated HPMI and CRMI in the Kongdian Formation tight sandstones.
Sample
No.
Depth
/m
Porosity
/%
Permeability
/mD
D1R2D2R2D3R2D4
KN6-23750.3011.788.1553.51880.99992.39070.99383.53010.99992.0819
KN6-13746.009.972.60992.72590.99412.390.99833.44010.98592.0815
X83484.208.190.3552.72160.99002.3060.99742.89790.97732.1040
Y213511.6011.440.312.73310.98362.26480.99123.04230.98852.1296
X10-23547.807.860.2812.72540.98612.30840.96962.92740.92052.1114
X93522.706.910.2712.69010.99492.35860.99113.0430.98532.1468
W26-13623.3011.310.0782.69140.98132.14150.95613.48730.99662.1405
W26-23634.3012.540.0442.67440.99232.13790.95193.20710.93192.1193
X10-13533.854.320.0212.64620.98602.11230.95002.78260.97332.3086
Disclaimer/Publisher’s Note: The statements, opinions and data contained in all publications are solely those of the individual author(s) and contributor(s) and not of MDPI and/or the editor(s). MDPI and/or the editor(s) disclaim responsibility for any injury to people or property resulting from any ideas, methods, instructions or products referred to in the content.