Abstract
Microseismic monitoring has become a critical technology for hydraulic fracturing in unconventional oil and gas reservoirs, owing to its high temporal and spatial resolution. It plays a pivotal role in tracking fracture propagation and evaluating stimulation effectiveness. However, the automatic picking of first-arrival times and accurate source localization remain challenging under complex noise conditions, which constrain the reliability of fracture parameter inversion and reservoir assessment. To address these limitations, we propose a hybrid approach that combines optimized variational mode decomposition (OVMD), wavelet thresholding denoising (WTD), and an adaptive fractal box-counting dimension algorithm for enhanced first-arrival picking and source localization. Specifically, OVMD is first employed to adaptively decompose seismic signals and isolate noise-dominated components. Subsequently, WTD is applied in the multi-scale frequency domain to suppress residual noise. An adaptive fractal dimension strategy is then utilized to detect change points and accurately determine the first-arrival time. These results are used as inputs to a particle swarm optimization (PSO) algorithm for source localization. Both numerical simulations and laboratory experiments demonstrate that the proposed method exhibits high robustness and localization accuracy under severe noise conditions. It significantly outperforms conventional approaches such as short-time Fourier transform (STFT) and continuous wavelet transform (CWT). The proposed framework offers reliable technical support for dynamic fracture monitoring, detailed reservoir characterization, and risk mitigation in the development of unconventional reservoirs.
1. Introduction
The efficient exploitation of unconventional oil and gas resources is vital to achieving national development goals, sustaining daily energy consumption, and safeguarding national energy security [1]. Since the initiation of the 13th Five-Year Plan, approximately 70% of newly proven oil reserves and 90% of newly proven natural gas reserves in China have been categorized as low-grade, unconventional resources [2]. Ensuring the efficient exploitation of these resources is therefore critical to the sustainable development of China’s petroleum and natural gas industry. China’s tight oil and gas formations are widely distributed and lithologically diverse; however, most of these reservoirs exhibit low porosity and low permeability, thereby constraining their production capacity [3]. To overcome these challenges, volumetric hydraulic fracturing is employed to fracture the reservoir rock, reduce flow resistance, maximize the stimulated reservoir volume, and ultimately enhance hydrocarbon production. To evaluate the effectiveness of the fracturing treatment in a timely and accurate manner, microseismic monitoring has been established as a reliable and robust technique [4]. When large volumes of fluid are injected into the formation, the pre-existing stress field is substantially disturbed, causing stress concentrations around existing or newly generated fractures. As the external load increases, micro-yielding or deformation can occur within weak zones along the fracture surfaces, ultimately inducing fracture propagation. During this process, part of the stored elastic energy is released as seismic waves, giving rise to low-magnitude seismic events commonly referred to as microseismicity [5]. To comprehensively assess the dynamic changes and potential risks associated with hydraulic fracturing, real-time monitoring is essential. By employing reliable monitoring technologies and targeted control strategies, it is possible to track the evolution of fracturing risks effectively. Microseismic monitoring, which provides critical information on event location, origin time, and focal mechanism, is a powerful tool for inferring reservoir structure and monitoring the changes induced by fluid injection or production [6]. This technique has demonstrated significant potential for the precision development of low-permeability and other unconventional reservoirs [7]. Microseismic monitoring typically relies on geophone arrays deployed downhole or at the surface to detect subsurface signals, from which source parameters are derived to evaluate fracture network morphology. Therefore, accurately identifying the first-arrival times of microseismic signals generated during fracture propagation is of paramount importance for real-time geological assessment and risk evaluation in hydraulic fracturing operations. However, microseismic signals are often contaminated by various types of noise, rendering automatic first-arrival picking particularly challenging. Traditional approaches, which rely on manual interpretation or simple threshold-based techniques, are inefficient and prone to external interference [8]. A key challenge in microseismic monitoring is the accurate identification of the onset times of seismic events and their associated frequency components [9]. Consequently, there is a growing need for efficient and robust automated first-arrival picking algorithms.
Algorithms for first-arrival picking of microseismic signals have progressively evolved over the years. R. V. Allen [10] initially proposed the Short-Term Average/Long-Term Average (STA/LTA) method, which became one of the most widely used first-arrival picking algorithms for microseismic signals owing to its simplicity and high computational efficiency. However, the traditional STA/LTA method is sensitive to the positioning of time windows, which can result in inconsistent or low picking accuracy. Subsequently, K. Munro [11] proposed a strategy that constructs a detection function using pre-, post-, and delayed-time windows, effectively addressing the limitations of STA/LTA in identifying microseismic signals. However, these approaches remain sensitive to noise and continue to suffer from limited picking accuracy. J. Akram [12] further proposed applying weights to the detection function using coefficients derived from the ratio of the standard deviations of the amplitudes of the long and short time windows, thereby enhancing detection accuracy. Liu et al. [13] proposed using the maximum point of the detection function as the arrival time, but the overall accuracy is still constrained by the performance of the detection function itself. Chen Bingrui et al. [14], on the other hand, introduced energy ratio variability to identify rock rupture signals, which improved signal recognition but showed reduced stability under high-noise conditions. J. Li et al. [15] employed a genetic algorithm for hyperparameter tuning, which improved signal recognition accuracy. However, the method involved high computational complexity, limiting its real-time applicability. With advances in technology, J. P. Jones and M. Van der Baan [16] introduced the Hidden Markov Model (HMM) to enhance the triggering performance of STA/LTA. However, the method still encounters difficulties in handling complex microseismic signals. Zhu et al. [17] combined STA/LTA with the Akaike Information Criterion (AIC) to improve both processing speed and picking accuracy, but accuracy degradation remains a concern in noisy environments. Li et al. [18] proposed a method based on tracking the dissipated energy power associated with damping to determine the arrival time, which improves accuracy but incurs high computational cost when processing complex signals. Zhang et al. [19] proposed a dual-task deep neural network that combines convolutional feature extraction and attention mechanisms to simultaneously perform P-wave arrival picking and signal classification. However, this method exhibits strong data dependency and limited interpretability, relying on large-scale manually labeled data for training to achieve optimal performance. Zhan et al. [20] introduced the LGF SeismoLocator model, which integrates LSTM, GCN, and FCN for precise microseismic event localization in coal mines. Despite achieving high accuracy, the approach has poor cross-regional generalization, limited noise robustness, and a complex structure with high computational cost, making its applicability in practical scenarios a trade-off between performance and usability. Luo et al. [21] proposed the CGAS deep learning algorithm for P-wave arrival time picking, which combines CNN, attention mechanisms, and GRU to improve the accuracy of microseismic signal picking in mining areas. While the method performs well in low signal-to-noise ratio environments, it has a high dependency on data volume and computational resources.
During hydraulic fracturing operations in field applications, the large-scale injection of fluid disturbs the in situ stress field, inducing microseismic events that are typically closely associated with the generation and propagation of fractures. In the development of unconventional oil and gas resources such as shale gas and tight oil, microseismic monitoring has become a key technique for evaluating the effectiveness of fracturing and the spatial extent of the fracture network [22]. However, under conditions of strong noise interference or limited sensor deployment, conventional methods often struggle to accurately identify the first-arrival time of microseismic signals in low signal-to-noise ratio environments. In some deep shale gas fracturing zones, surface noise and lithological complexity can lead conventional methods to produce timing errors exceeding several hundreds of milliseconds. This leads to significant inaccuracies in source localization, making it difficult to meet the demands of high-precision fracture tracking and reservoir stimulation assessment [23]. Therefore, improving the accuracy of first-arrival picking is crucial for enhancing source localization precision and supporting the evaluation of fracturing effectiveness. Therefore, improving the accuracy of first-arrival picking is crucial for enhancing source localization precision and supporting the evaluation of fracturing effectiveness. In recent years, signal processing techniques based on machine learning and deep learning methods have been widely applied to the analysis of microseismic signals. Deep learning methods, such as convolutional neural networks and long short-term memory networks, have demonstrated excellent adaptability in feature extraction and signal detection, particularly showing significant advantages when processing large-scale datasets. However, these methods often rely on a large amount of labeled data and involve high computational complexity, which limits their application in real-time monitoring. Moreover, machine learning models are prone to overfitting when dealing with environments with strong noise or weak signals, leading to poor generalization. Additionally, deep learning models often lack interpretability, making their application and adjustment in practical engineering more difficult. To address this challenge, we propose a novel signal processing approach that combines OVMD with DWT for denoising, and a first-arrival picking strategy based on adaptive fractal box-counting dimension analysis. OVMD adaptively decomposes the microseismic signal, while DWT performs multi-scale denoising. The fractal box-counting dimension quantitatively captures abrupt changes in local complexity, allowing the precise detection of first-arrival characteristics.
By combining these techniques, the proposed OVMD–DWT–Fractal framework enhances signal clarity, applies adaptive windowing, and leverages local complexity variation to improve picking accuracy. This results in more precise source localization and provides essential technical support for fine-scale reservoir characterization and optimization in unconventional hydrocarbon development.
2. Data and Methods
This study proposes an automated first-arrival picking method for microseismic signals based on the integration of OVMD-DWT and fractal dimension analyses. The method first applies OVMD to adaptively decompose the raw signal, effectively suppressing noise interference. Subsequently, DWT is employed on selected modes for multi-scale denoising to further eliminate residual noise. Finally, an adaptive fractal box-counting dimension analysis is used to detect abrupt changes in local signal complexity, enabling the accurate identification of the first-arrival time. The following sections provide a brief overview of the fundamental principles and implementation procedures of each component, along with detailed information regarding the experiment.
2.1. Data
2.1.1. Simulated Microseismic Dataset
The simulated microseismic dataset used in this study was generated based on an idealized homogeneous and isotropic medium model, with the source location fixed at specific coordinates and a background wave velocity of 1500 m/s. The dataset contains time-series data of microseismic signals, stored in the csv file format. During the simulation, a 250 Hz Ricker wavelet was used as the seismic source, and the signal was sampled at a frequency of 10,000 Hz. The simulation was conducted under idealized conditions, without considering complex geological factors such as dispersion effects or multiple wave reflections. The raw microseismic signals were preprocessed with added noise, decomposed into intrinsic mode functions (IMFs) using OVMD (Table 1), followed by the application of a wavelet thresholding denoising method to effectively remove high-frequency noise. After noise suppression, the first-arrival times were extracted using the fractal box-counting dimension method (Table 2), and the picked times were used as inputs for source localization via the PSO algorithm (Table 3).

Table 1.
Determination of the optimal number of modes K using OVMD decomposition.

Table 2.
Comparison of initial arrival time detection.

Table 3.
Localization results.
2.1.2. Experimental Dataset and Test Site Conditions
The experimental microseismic dataset was collected from a monitoring system deployed at a test site composed of artificial concrete and natural sand. The system was designed to simulate microseismic signals during hydraulic fracturing, with a background velocity of approximately 1100 m/s. The data were recorded in the time-series format, with a sampling frequency of 5000 Hz, and stored as csv files, with each file corresponding to the data recorded by a geophone, containing signals from nine geophones. The test site was subject to various environmental factors, including noise from nearby machinery and electromagnetic interference, which impacted the quality of the recorded signals. Similar to the simulated dataset, the experimental data were preprocessed by first decomposing the signals using OVMD to extract the intrinsic modes (Table 4), followed by wavelet thresholding to reduce high-frequency noise. After noise suppression, first-arrival times were extracted using the fractal box-counting dimension method (Table 5), and the picked times were input into the PSO algorithm for source localization.

Table 4.
OVMD decomposition center frequency process.

Table 5.
Comparison between picking methods.
2.2. Methods
2.2.1. Optimal Modal Decomposition of Microseismic Signals
Variational mode decomposition (VMD) was proposed by Konstantin Dragomiretskiy in 2014 [24] to modal aliasing issues inherent in Empirical Mode Decomposition (EMD). VMD determines the center frequency and bandwidth of each decomposed mode by iteratively solving a variational optimization problem, resulting in a fully non-recursive and adaptive decomposition framework. The VMD method not only mitigates end point effects and modal aliasing, but also effectively processes complex nonlinear time-series, yielding smooth subsequences across multiple frequency bands [25]. The core idea is to achieve effective signal decomposition by constructing and solving a variational problem. Variational mode decomposition involves both the formulation and solution of a variational optimization problem.
Formulation and Solution of the Variational Problem
Assuming that each mode has finite bandwidth and center frequency, the goal of the variational problem is to determine
modal functions
by minimizing the sum of their estimated bandwidths, subject to the constraint that the sum of all modal components equals the input signal
. The construction process is outlined as follows:
(1) The Hilbert transform is applied to
to obtain its analytical signal and compute the corresponding one-sided spectrum. Then, the center frequency is shifted to baseband by multiplying with the exponential operator
.
(2) The bandwidth of each modal component is estimated by computing the squared magnitude of the gradient of its demodulated signal. The corresponding constrained variational problem can be written as follows:
is the K modal component obtained from the signal decomposition;
is the center frequency of the corresponding
;
is the Dirac function;
is the time;
is the partial derivation of
;
is the noise-containing seismic signal; and
is the summation of all the variational modes.
(3) By introducing the quadratic penalty parameter
and the Lagrange multiplier
, the constrained variational problem is transformed into an unconstrained one. The augmented Lagrangian is expressed as follows:
is the quadratic penalty parameter that ensures reconstruction accuracy, while
is the Lagrange multiplier used to strictly enforce the constraint condition.
(4) The Alternating Direction Method of Multipliers (ADMM) is then applied to iteratively update each mode and its associated center frequency, and ultimately converges to the saddle point of the unconstrained variational model, which corresponds to the optimal solution of the original constrained problem. The modal components are recovered in the frequency domain using the following expression:
In the above equation,
represents the frequency, while
,
, and
correspond to the Fourier transforms of
, respectively.
Similarly, by formulating the center frequency selection problem in the frequency domain, the update rule for each center frequency can be derived as follows:
In the equation,
corresponds to the Wiener filter of the current residual
;
represents the centroid of the current modal function’s power spectrum; performing the inverse Fourier transform on
, its real part yields
.
Optimized variational mode decomposition is an enhanced signal processing technique based on standard VMD. Its core innovation lies in the adaptive determination of the number of decomposition modes through a center frequency optimization strategy. By analyzing the spectral characteristics of the signal, OVMD iteratively adjusts the number of modes according to the distribution of center frequencies, thus overcoming the limitation of manually specifying a fixed number of modes in traditional VMD.
Specifically, the key steps of the OVMD method include the following:
(1) Spectral analysis and initial modal decomposition: A preliminary analysis of the signal’s spectral characteristics is first conducted. An initial variational mode decomposition (VMD) is then applied to extract several preliminary modes
, and the center frequency
of each mode is computed.
(2) Mode number optimization: In each iteration, the VMD algorithm adjusts the mode number based on the spectral characteristics of the current decomposition. The center frequency of each mode is computed and compared with those from the previous iteration. If the frequency difference between a current mode and its counterpart in the previous iteration is smaller than a predefined threshold, the two modes are considered spectrally similar. In such cases, merging is performed or the addition of new modes is terminated. The optimal number of modes is determined using the following criterion:
Here,
represents the frequency difference between adjacent modes,
, while
is a threshold value set according to practical considerations.
(3) Determination of the optimal number of modes
: When the center frequency of a newly decomposed mode falls below a specified threshold, the current value of
at which similar frequencies first emerge is considered the optimal number of modes.
2.2.2. Wavelet Transform-Based Threshold Denoising Method for Microseismic Signals
The wavelet transform, as a time–frequency analysis tool, offers high time–frequency resolution and a strong capability to capture signal singularities [26]. It can decompose a signal into multi-scale approximation and detail components, extracting multiple sub-bands across different frequency ranges and thereby enabling multiresolution and multi-scale analysis [27]. Compared with the traditional Fourier transform, the wavelet transform overcomes the limitation of purely global analysis and simultaneously retains both the temporal and spectral characteristics of a signal. Depending on the implementation, wavelet transforms are classified into two basic forms: discrete and continuous. The discrete wavelet transform (DWT) is well suited to digital signal processing, whereas the continuous wavelet transform (CWT) is advantageous for analog signal analysis. Wavelet threshold denoising is an efficient noise-reduction technique derived from the wavelet transform. Its core concept is to construct a multiresolution representation of the signal—via scaling and translation of the mother wavelet—in order to accurately separate and effectively filter noise components. This approach achieves multi-scale decomposition and incrementally extracts the various frequency components of the signal [28]. Consequently, the method exhibits excellent denoising performance when applied to complex signals. The specific steps of wavelet thresholding denoising can be summarized as follows:
Wavelet Decomposition
According to the characteristics of the microseismic signal and the characteristics of the wavelet basis function, the decomposition layer
is determined. The target signal is decomposed using the selected wavelet basis function to obtain the wavelet decomposition coefficients, which contain the wavelet coefficients of the target signal and the interfering signal.
Threshold Quantization
An appropriate threshold is selected for the wavelet coefficients obtained from decomposition. In this study, soft thresholding is adopted due to its superior continuity and stability. The functional form of the soft thresholding operator is defined as follows:
In this context,
represents the wavelet coefficients, which include both the target signal and noise components, while
denotes the threshold value.
Wavelet Reconstruction
The signal is reconstructed using the inverse wavelet transform, based on the low-frequency coefficients from the
th decomposition level and the quantized high-frequency coefficients from levels 1 to
th, thereby recovering the denoised version of the original signal.
2.2.3. Fractal Box Counting Dimension Algorithm for the First-Arrival Picking of Microseismic Signals
Fractals, as a modern branch of mathematics, focus on describing irregular and complex shapes or behaviors [29]. In this context, the fractal dimension serves as a quantitative measure of an object’s surface complexity or geometric irregularity [30]. Several methods exist for calculating the fractal dimension, including the similarity dimension, Hausdorff dimension, information dimension, and box-counting dimension. Among these, the box-counting dimension is widely used in fractal research due to its intuitive representation of spatial distribution and relatively simple computation [31]. Here, we employ the box-counting fractal dimension to detect the first-arrival point of the microseismic signal. Let
be a nonempty bounded subset of
, and let
represent the minimum number of boxes with a maximum diameter of
required to cover the set
. The box counting dimension of
is defined as follows:
Let the microseismic signal be
, and let
be any non-empty subset of the
-dimensional Euclidean space
. For discrete signals, the sampling interval
does not tend to be 0, so the condition
ends at 0 does not hold. Therefore, we define the minimum side length of the boxes as
[32]. The collected microseismic signal
is regarded as a closed set on the Euclidean space
, the signal sequence
is covered by the approximation method, the minimum side length of the box is the sampling interval
, and the minimum box
with side length
covering
is calculated; then, we obtain the following equations:
where
,
,
is the number of samples of the signal,
,
is the range of vertical scales of
, and
can be defined as follows:
Since microseismic signals are irregular fractals that cannot be described by a function, they only exhibit a fractal dimension in their scale-invariant region [33]. In section
, portion of the signal with a good linear fit is selected as the scale-invariant region, where its start and end points are denoted as
and
, respectively.
Finally, the slope is fitted using least squares to obtain the fractal box dimension D,
Building upon this, we have established a rigorous mathematical framework that defines the relationship between fractal dimension and P-wave arrival time, as detailed through the definition of
.
represents the first-arrival time, which is the time point at which a significant change in the fractal dimension of the signal occurs.
represents the fractal dimension at time t.
represents the time step, which is the time difference between the current window and the previous window.
is the threshold for the change in fractal dimension, and when
exceeds this threshold, it is considered that the P-wave arrival time has been reached.
After extracting the first-arrival times, these values, along with the spatial coordinates of the geophones and the known background velocity, are input into the particle swarm optimization (PSO) algorithm to perform source localization. During the PSO optimization process, the objective function is designed to minimize the discrepancy between the observed and theoretical arrival times. The formulation is as follows:
where
denotes the source location,
is the coordinate of the
-th geophone,
represents the origin time of the seismic event, and
is the first-arrival time recorded by the
-th geophone.
3. Results
3.1. Microseismic Location Method and Process
To address the challenge of accurately identifying the first-arrival time of microseismic signals under complex noise environments, this study proposes a method that combines OVMD, WTD, and box-counting fractal dimension analyses. By integrating multi-level noise suppression with intelligent optimization strategies, this method significantly improves the accuracy and robustness of first-arrival picking under low-SNR conditions. First, the noisy microseismic signal is adaptively decomposed into multiple intrinsic mode functions (IMFs) using OVMD. Low-frequency IMFs that exhibit little or no noise are directly retained for reconstruction, while high-frequency IMFs, as well as any low-frequency IMFs heavily contaminated by noise, are subject to wavelet-based multi-scale decomposition. The wavelet coefficients in each frequency band are separated and processed with soft-thresholding to suppress noise effectively. In this study, an adaptive box-counting dimension analysis is employed to extract the first-arrival time of microseismic signals. The fractal dimension serves as an indicator of local signal complexity, and its temporal evolution captures the dynamic structural features of the waveform. The first-arrival typically marks the transition from background noise to a seismic event-dominated phase, which is often reflected as a noticeable jump in the fractal dimension curve. Traditional methods—primarily based on amplitude statistics, energy variations, or spectral characteristics—generally rely on fixed window lengths. As a result, they struggle to accurately detect subtle structural changes in the time-domain waveform. To overcome this limitation, this study introduces an adaptive sliding window mechanism to compute the fractal dimension across successive time segments. By comparing the variation in fractal dimension between adjacent windows, the method identifies the first notable transition point, which is then used as an initial estimate of the first-arrival time. The proposed workflow innovatively integrates signal decomposition, noise suppression, and fractal dimension. This synergy overcomes the misjudgment and omission problems that plague traditional methods under low-SNR conditions, providing an efficient and accurate solution for engineering-scale microseismic monitoring. The detailed processing flow is illustrated in Figure 1 and Figure 2.
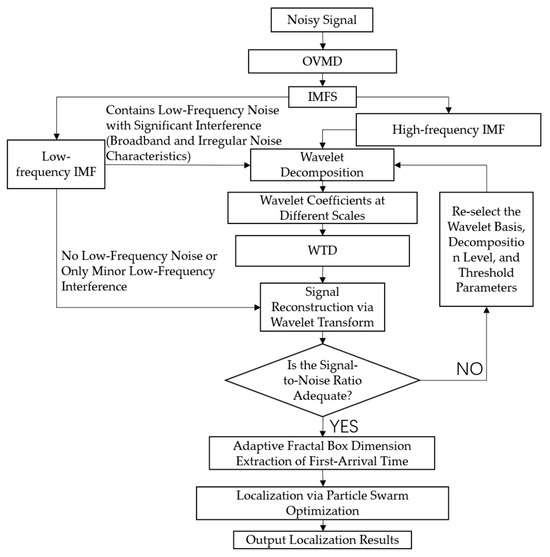
Figure 1.
Overall processing flow chart.
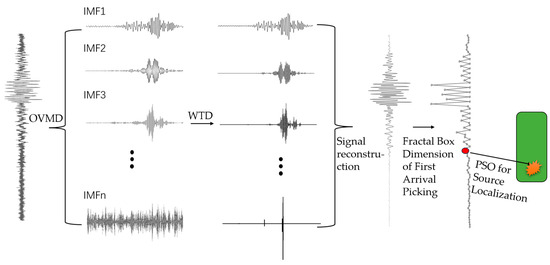
Figure 2.
Schematic diagram of signal processing and localization.
Figure 1 and Figure 2 illustrate the complete processing workflow of the proposed method, including microseismic signal decomposition, denoising, first-arrival picking, and source localization. The raw signal is first decomposed into multiple mode components using an OVMD technique. These components are subsequently denoised using wavelet thresholding, in which the wavelet basis, decomposition level, and thresholding strategy (soft or hard) are adaptively selected based on the signal’s time–frequency characteristics to suppress noise while preserving critical features. All valid components are then reconstructed to yield a denoised waveform. Fractal box-counting dimension analysis is applied to detect abrupt changes in local signal complexity, enabling the precise identification of the first-arrival time. The picked first-arrival time serves as the input for the PSO-based source localization module.
3.2. Numerical Simulation of Microseismic Localization
To validate the effectiveness and robustness of the proposed first-arrival picking method based on OVMD–WTD and fractal box-counting dimension analysis, a simplified homogeneous and isotropic medium model was constructed. A constant background wave velocity was assumed, and complex wave propagation factors such as dispersion, multiples, and dipping interfaces were not included. This idealized and controlled environment allows for a focused evaluation of the algorithm’s performance under low signal-to-noise ratio conditions. Synthetic microseismic source signals were generated, and six geophones were placed at various positions and orientations around the source to simulate the wave propagation process. To approximate real observation conditions, random noise was superimposed onto the recorded signals to create noisy data. The proposed OVMD–WTD method was then applied for denoising, followed by first-arrival picking using the fractal box-counting dimension method. The extracted first-arrival times were used as input parameters for the PSO algorithm to perform source localization. This framework enables a systematic assessment of the proposed method’s capability for signal processing and localization accuracy in noisy environments.
The seismic source and geophone layout are illustrated in Figure 3.
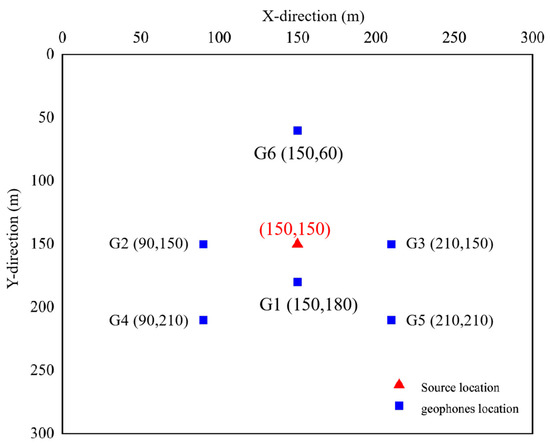
Figure 3.
Schematic diagram of the source and geophone locations. The red triangle indicates the source location at coordinates (150, 150), while the six blue dots represent the positions of the geophones, located at (150, 180), (90, 150), (210, 150), (90, 210), (210, 210), and (150, 60), respectively.
This configuration ensures spatial constraint coverage in multiple directions for accurate source localization. The background velocity is set to 1500 m/s. The source excitation signal has a frequency of 250 Hz, and the sampling frequency is set to 10,000 Hz [34]. The signals recorded by each geophone are presented in Figure 4.
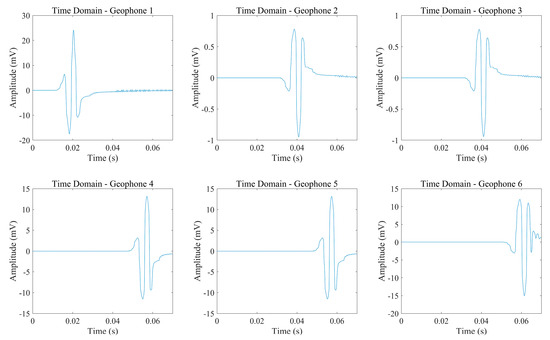
Figure 4.
Signals received by the geophones.
Figure 4 displays the vertical component of the simulated microseismic signals, highlighting the first-arrival waveform characteristics recorded by each geophone. These waveforms serve as a reliable basis for fractal box-counting-based first-arrival picking and provide essential input for validating the accuracy of the seismic event localization algorithm. The synthetic signals realistically replicate the features of microseismic events induced by fracture propagation and material failure during hydraulic fracturing. In the initial stage, signal amplitudes remain low and are characterized by smooth variations and small-scale random oscillations. After the onset of a microseismic event, a sharp increase in amplitude and the emergence of distinct waveform patterns indicate rapid energy release and intense seismic activity associated with fracture dynamics.
To simulate the uncertainty inherent in real field acquisition environments and to assess the effectiveness of the proposed denoising algorithm, Gaussian white noise was superimposed on the original synthetic signals, significantly reducing the signal-to-noise ratio. The resulting noise-contaminated signals are presented in Figure 5.
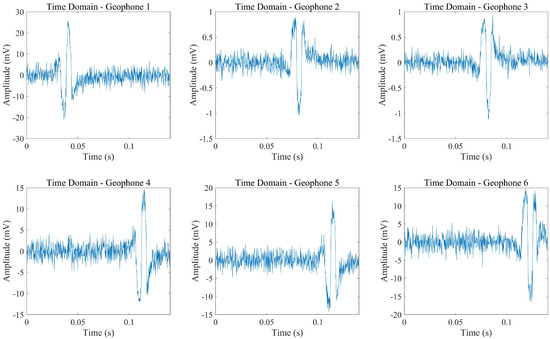
Figure 5.
Noisy signal for each detector.
As an example, signal decomposition and reconstruction are performed using the signal recorded by Geophone 1. The frequency spectra of the signal before and after noise addition are shown in Figure 6a and Figure 6b, respectively.
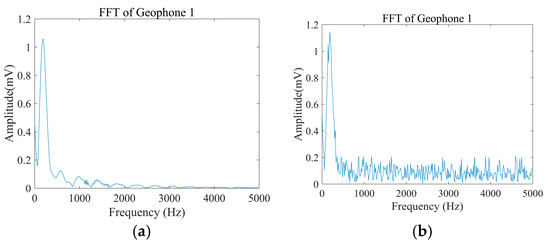
Figure 6.
Frequency-domain comparison of the signal before and after noise addition: (a) original signal without noise; (b) signal after noise addition.
In the signal spectrum prior to noise contamination, the signal energy is concentrated in the low-frequency band and exhibits a pronounced low-frequency peak. The spectrum decays smoothly, indicating that the signal is dominated by low-frequency components and is essentially noise-free. This well-defined spectrum indicates that the signal is pure and that its frequency-domain characteristics are relatively simple. In the spectrum after noise is introduced, the low-frequency peak decreases markedly, with noticeable broadening—particularly in the high-frequency range—where pronounced fluctuations and irregularities appear. High-frequency noise renders the signal spectrum unsmooth, increasing the complexity of its frequency-domain characteristics; numerous small-amplitude fluctuations emerge, indicating that noise now exerts a significant influence on the signal. Therefore, mitigating noise in the signal is imperative.
3.2.1. Signal Decomposition and Reconstruction
Prior to noise reduction, the signal is initially decomposed by OVMD to determine its optimal modal number, K. In variational mode decomposition (VMD), the modal number K is critical because an appropriate value balances decomposition accuracy and the faithful extraction of the underlying frequency components. If K is set too low, the signal’s high-frequency components may not be adequately decomposed, causing information loss; if K is too high, over-decomposition can occur, producing redundant modes or noise and degrading overall performance. The procedure begins with one mode (K = 1) and sequentially increases K while recording each mode’s center frequency until K = 11 is reached. Frequency analysis reveals that, for 1 ≤ K ≤ 9, the center frequencies of the IMFs are uniformly distributed and well separated, which results in a clearer allocation of frequency content. Therefore, mode numbers within this range efficiently capture the signal’s distinct spectral components. At K = 11, although the overall frequency distribution remains valid, changes in the center frequencies of higher-order modes are negligible, indicating over-decomposition that may introduce high-frequency noise or redundant information. Specifically, when K = 9, the center frequency of the corresponding mode stabilizes near 4710 Hz, and the frequency components are clearly separated and accurately captured, confirming K = 9 as the optimal modal number for this signal. The detailed center frequency values are shown in Table 1.
Table 1 lists the central frequencies of each intrinsic mode function (IMF1 to IMF11) obtained during the OVMD process for noise-contaminated synthetic microseismic signals, under varying numbers of decomposition modes. K denotes the selected number of modes for decomposition. Each column labeled IMF corresponds to one mode, with the value representing its central frequency in the frequency domain. These central frequencies are derived from the spectral characteristics calculated through the variational optimization process, reflecting the dominant frequency components contained within each mode. All data were generated based on a synthetic microseismic event scenario.
After determining the optimal number of modes (K = 9), the signal is decomposed using VMD. The detailed decomposition process and the corresponding spectra of each mode are presented in Figure 7.
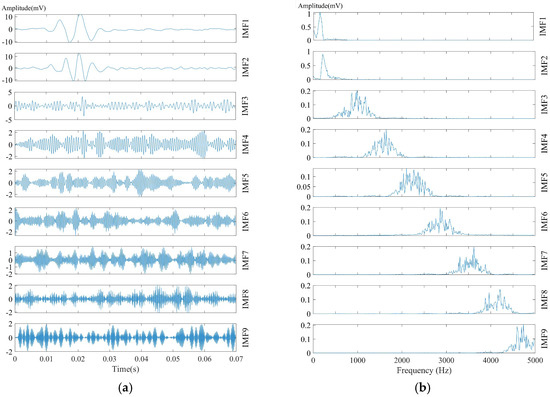
Figure 7.
OVMD decomposition modes and their corresponding frequency spectra: (a) decomposition of each mode; (b) spectrum corresponding to each OVMD mode.
Figure 7 presents the nine intrinsic mode functions (IMF1–IMF9) obtained by applying OVMD to the noise-contaminated signal from Geophone 1. Figure 7a presents the nine intrinsic mode functions (IMFs) obtained by applying OVMD to the noise-contaminated signal from Geophone 1. Each curve in the figure represents the variation in an individual mode, illustrating the time-varying characteristics of different frequency components throughout the signal. This demonstrates the capability of OVMD to effectively decompose non-stationary signals. Figure 7b displays the spectral information of each mode presented in Figure 7a. The spectra were obtained by applying the FFT to each IMF component, revealing the energy distribution of each mode in the frequency domain. It can be observed that the IMFs exhibit clear band separation in the frequency domain, indicating that OVMD effectively extracts the multi-scale features of the signal.
IMF1–IMF3 primarily capture the signal’s low- and mid-frequency components. In microseismic signals, low-frequency content typically reflects steady seismic activity or sustained vibrational features, whereas high-frequency components often correspond to noise or rapid environmental disturbances. Thus, IMF1 and IMF2 embody the principal microseismic vibrational modes, making these bands the primary focus in microseismic signal processing. IMF4 and IMF5 mark the transition into the mid-frequency range; their spectra exhibit multiple peaks, suggesting they capture higher-frequency variations within the signal. IMF6–IMF11 progressively cover the high-frequency region; in particular, IMF9–IMF11 concentrate energy above 3.5 kHz. Such high-frequency spectra typically reflect rapid signal fluctuations, including noise or high-frequency oscillations, indicating that these modes chiefly capture the signal’s high-frequency content and noise.
The frequency components transition progressively from low to high from IMF1 to IMF11. IMF1–IMF3 mainly capture the signal’s low-frequency components; IMF4 and IMF5 represent the mid-frequency portion; and IMF6–IMF11 capture high-frequency components, which may include noise or high-frequency oscillations. This decomposition enables the separation of distinct frequency components in the original signal, allowing for the clearer analysis of signal variations and the impact of noise and other disturbances.
After completing OVMD, the signal’s distinct frequency components become available for further processing and analysis. To obtain microseismic signals with minimal interference, we remove the noisy portions of each mode using wavelet threshold denoising. First, each mode is subject to wavelet decomposition, which separates the signal into multiple scales. Each wavelet scale represents a distinct frequency band, enabling the precise localization of frequency information within the hierarchical decomposition. In this study, the sym4 wavelet basis, known for its good symmetry and compact support, was selected to enhance the preservation of microseismic signal transients while reducing the risk of phase distortion. It is particularly suitable for suppressing high-frequency noise and extracting signal details. Based on the spectral characteristics of microseismic signals and the requirements of multi-scale analysis, the number of wavelet decomposition levels was set to four to enable efficient frequency band separation and avoid excessive information decomposition. For thresholding, a soft thresholding method was applied to the wavelet coefficients. This approach avoids introducing excessive artificial oscillations during signal processing and provides smoother denoising performance, especially under strong high-frequency noise conditions. After thresholding, we reconstruct the denoised signal via inverse wavelet transform, using the low-frequency coefficients at level N and the quantized high-frequency coefficients from levels 1 to N. The denoised signal obtained using wavelet thresholding, along with its spectrum, is compared with the results from other denoising methods. Figure 8 and Figure 9 present the time-domain waveforms and the corresponding frequency spectra of signals processed by four different denoising methods, respectively: (a) the OVMD–WTD joint denoising method, (b) Butterworth filtering, (c) elliptic filtering, and (d) the EMD–wavelet joint denoising method. By comparing the performance of each method in both time and frequency domains, the overall effectiveness in terms of signal fidelity and noise suppression can be intuitively evaluated.
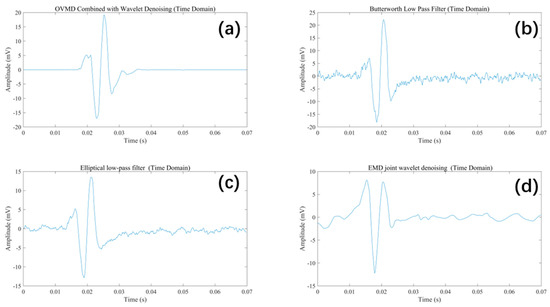
Figure 8.
Comparison of time-domain signals using different denoising methods.
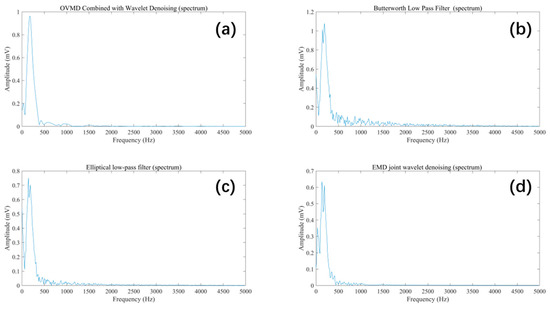
Figure 9.
Comparison of frequency spectra using different denoising methods.
According to the filtering results, the OVMD–wavelet joint denoising method demonstrates superior performance the other methods in microseismic signal denoising. It effectively suppresses high-frequency noise while preserving the integrity of low-frequency components. Its steeper transition band enables the efficient separation of noise from useful signals, minimizing residual noise. In contrast, the other three methods—Butterworth low-pass filtering, elliptic filtering, and EMD–wavelet joint denoising—also reduce high-frequency noise but are limited by wider transition bands and slower attenuation rates. As a result, residual high-frequency noise remains, degrading signal purity and quality. Among them, the EMD–wavelet method loses fine signal details, particularly in rapidly changing segments, leading to significant differences from the original signal. Overall, the OVMD–wavelet joint denoising method offers clear advantages in both denoising and signal reconstruction, particularly for microseismic signal processing and accurate event detection. It retains fine signal details while effectively suppressing noise interference.
3.2.2. Fractal Box Dimension and Initial Time Detection
First-arrival picking is critical in microseismic monitoring. It directly influences source localization accuracy and aids in identifying the event type, analyzing subsurface properties, and estimating event magnitude. Accurate first-arrival picking enables more precise source localization and event classification. After signal reconstruction, the first-arrival time can be extracted from the denoised signal.
The fractal dimension is a metric used to characterize signal complexity and self-similarity. In microseismic signals, the occurrence of a first-arrival event often leads to a sharp change in signal complexity, typically reflected as a sudden fluctuation in the fractal dimension. By quantifying local complexity, this method effectively captures the abrupt point corresponding to the first-arrival wave. Therefore, analyzing the signal’s fractal box dimension facilitates the accurate identification of the first-arrival time. Compared with traditional methods, the fractal box dimension better accommodates the nonlinear and nonsmooth nature of microseismic signals, offering stronger noise robustness and higher computational efficiency. It can accurately locate the first-arrival time even under low signal-to-noise ratio conditions. An adaptive algorithm is employed for window selection, allowing the automatic determination of optimal window size based on signal characteristics. This improves the accuracy of first-arrival picking.
The first-arrival picking process consists of the following steps:
- (1)
- Adaptive window size selection and signal segmentation
During signal preprocessing, an adaptive windowing mechanism is introduced. Based on signal length and dynamic characteristics, the method adjusts segmentation flexibly by setting minimum and maximum window size limits. Compared to traditional fixed-window methods, the adaptive window dynamically adjusts the segmentation scale according to local signal features, effectively avoiding information loss or redundancy and improving the accuracy of first-arrival picking.
- (2)
- Fractal dimension calculation
For each windowed signal segment, the fractal dimension is estimated using the box-counting method to quantify local signal complexity. By scanning across multiple box scales, the method performs multi-scale analysis by counting the number of boxes covering the signal at each scale, and the fractal dimension is then obtained via curve fitting. This method leverages the signal’s nonsmooth characteristics across scales and provides a quantitative indicator for detecting significant change points.
- (3)
- Significant change point detection based on fractal dimension difference
By computing the difference in fractal dimension between adjacent windows, points of significant signal variation are identified. When the difference exceeds a predefined threshold, the corresponding point is marked as a significant change point. Since the first-arrival time typically corresponds to a transition from a stable to a rapidly changing state, this approach effectively detects the key features associated with the first-arrival time.
- (4)
- First-arrival picking and verification
The first-arrival time is located by identifying the earliest point with a significant fractal dimension change. Combined with the adaptive windowing strategy, the method adjusts segmentation at different stages of the signal to ensure precise first-arrival time extraction. The accuracy and robustness of the method are validated by comparing the extracted first-arrival times with calibrated references in wavefield snapshots.
The fractal dimension is highly sensitive to local structural variations in signals, and the first-arrival time of seismic waves typically corresponds to a significant jump in its distribution. In this study, a sliding window approach is employed to dynamically calculate the local fractal dimension, enabling the identification of abrupt changes and the determination of first-arrival times. These arrival times are subsequently used for source localization inversion, thereby improving the spatiotemporal accuracy of microseismic event localization.
In the calculation of fractal dimension, the selection of box size
is a key factor affecting both the accuracy and stability of the results. The choice of
must strike a balance among several criteria: (1) sufficient scale resolution to ensure sensitivity to abrupt features in the microseismic signal; (2) avoidance of overly large values that may obscure features or cause misinterpretation across scales; and (3) prevention of excessively small scales that may lead to numerical oscillation or insufficient statistical sampling. To address these requirements, a multi-scale box-counting strategy is adopted, selecting a representative set of
values that span the dominant frequency (or period) range of the signal. This range is designed to capture the primary temporal features of the signal while avoiding the loss of short-duration information or the introduction of cross-period confusion. The selected ε values are used to compute a linear relationship between
and
, from which the best-fitting linear segment is identified via least-squares regression. The slope of this segment is then taken as the local fractal dimension, enabling the multi-scale quantitative characterization of signal complexity.
To comprehensively illustrate the temporal evolution of seismic wave propagation following source excitation in the numerical simulation, multiple key time points were selected to generate wavefield snapshots. In the figure, the color scale represents the spatial distribution of wave amplitude, allowing for a clear visualization of wave propagation paths and the arrival times of the wavefronts at each geophone. This figure not only provides the physical basis for applying the fractal box-counting method to first-arrival picking but also serves as a visual reference for validating the accuracy of the subsequent event localization, further supporting the reliability and effectiveness of the proposed approach. The wavefield snapshot from the numerical simulation is shown in Figure 10.
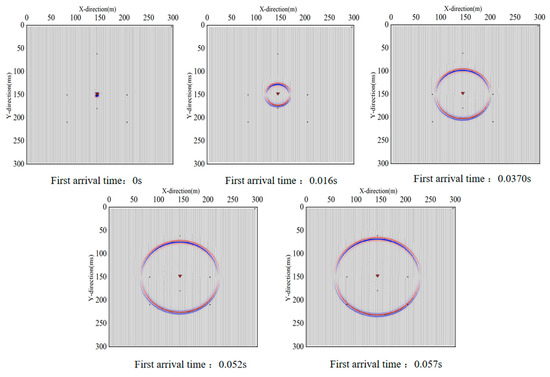
Figure 10.
Wavefield snapshot from numerical simulation.
To accurately extract the first-arrival time from the signals received by each geophone, this study employs the fractal box-counting dimension method to quantify local variations in signal complexity. Several key parameters are configured to enhance the accuracy and adaptability of the algorithm: the box sizes are set to [2, 4, 6, 8, 10, 12, 14, 15] to cover the signal plot and count the number of boxes containing waveform structures, thereby characterizing complexity variations across multiple scales. An adaptive sliding window mechanism is introduced for segmented analysis, with a window length range of 1 to 15 and a step size of 1, allowing the analysis scale to dynamically adjust based on local signal features. The computation length for each segment is set to 15 to balance stability and resolution. During the sliding window traversal, abrupt points are identified by calculating the difference in fractal dimension between adjacent windows. To ensure both accuracy and computational efficiency, the threshold for fractal dimension variation is set to 0.1; when the difference between two consecutive windows exceeds this threshold, the corresponding position is regarded as a significant change in signal complexity. To ensure physical plausibility, only the first point that meets the criterion—located in the early part of the signal—is extracted and designated as the effective first-arrival time.
This parameter configuration enhances the method’s stability and generalization across different signal structures, while maintaining a balance between computational efficiency and detection precision. The effectiveness of the proposed method is illustrated in Figure 11, where Figure 11a shows the denoised synthetic signal, and Figure 11b displays the first-arrival picking process. The red marker in Figure 11b indicates the first-arrival point identified by the adaptive fractal box-counting method.
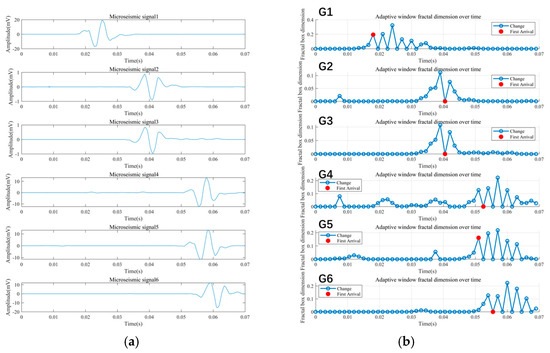
Figure 11.
Detection of signal first-arrival times based on the fractal box-counting dimension (a) original signal; (b) detected first-arrival time using the fractal box-counting dimension.
It can be observed from the table that the first-arrival times obtained using the fractal box-counting dimension closely match those indicated by the wavefield snapshots at the corresponding detector locations, with a maximum deviation of only 0.005 s.
In addition, to more comprehensively evaluate the accuracy of the proposed method in first-arrival picking, we calculated the RMSE between the picked arrival times and the theoretical values at each detection point. This metric quantitatively reflects the overall average picking error and provides a more convincing basis for the subsequent analysis of localization accuracy. The error is calculated using the RMSE formula as follows:
where
denotes the number of seismic sensors (geophones),
is the observed first-arrival time extracted from the
-th geophone, and
represents the corresponding theoretical first-arrival time for the
-th geophone.
Based on the theoretical arrival times and the results obtained from the fractal box-counting dimension analysis presented in the table, the calculated RMSE of the first-arrival times is approximately 0.00430 s. This indicates that the proposed method demonstrates high picking accuracy in the time domain, providing a solid foundation for improved localization precision in subsequent analysis.
3.2.3. Microseismic Source Localization
Using the readout time as the input, we employ particle swarm optimization to determine the earthquake-source location. The swarm size is set to 50 particles, ensuring a comprehensive search while keeping computational overhead manageable. The iteration count is set to 100, providing sufficient computational rounds to achieve convergence. The inertia weight is set to 0.7, balancing exploration and exploitation, while both the cognitive individual and social group learning factors are fixed at 1.5 to harmonize self-experience and collective experience during updates. The search is two-dimensional (x and y), and each particle seeks the optimum within this plane. The search ranges for both x and y are set to [−300, 300], while the z-coordinate is fixed at 0, effectively constraining the swarm to a reasonable two-dimensional solution space. After the optimization by the particle swarm search, the optimized location results obtained are almost the same as the original earthquake source location. The localization results are shown in Figure 12.
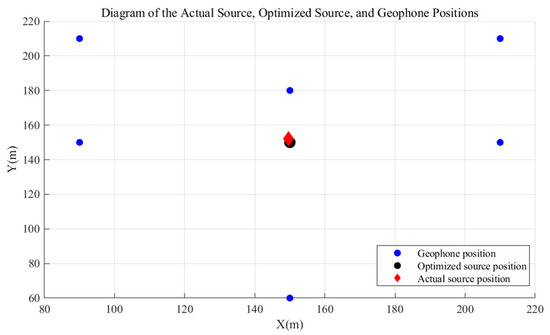
Figure 12.
PSO-based source localization results.
3.3. Microseismic Localization Physical Experiment
In the previous section, first-arrival times recorded by detectors at various locations were extracted with the fractal box-counting dimension. The positions of the simulated sources were then inverted via particle swarm optimization, yielding results that nearly overlapped the true source positions; a physical-model experiment was subsequently conducted to further verify the method’s accuracy.
The physical experiment was conducted in a composite medium consisting of artificial concrete and natural sand. The background wave velocity of the test site is approximately 1100 m/s, verified through both historical data and on-site measurements. Data acquisition was performed using the KJ1640 microseismic monitoring system, with a sampling frequency of 5000 Hz. The experimental layout is shown in Figure 13. The site environment exhibits significant heterogeneity, including surface weathering and fracturing, water accumulation, and electromagnetic interference and vibrational noise caused by nearby equipment operation and high-voltage power lines. Additionally, variations in the coupling between the geophones and the ground surface led to differences in signal quality. These environmental conditions are representative of typical real-world complexities in terms of wavefield propagation and noise contamination, providing an effective validation platform for assessing the performance and robustness of the proposed method under challenging practical conditions.
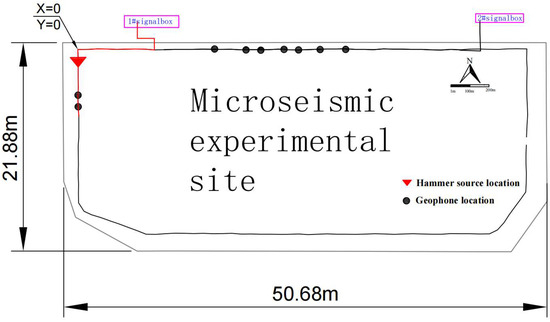
Figure 13.
Schematic of the microseismic experiment site.
The red triangles and black circles in the figure represent the seismic source and the geophones deployed around the site, respectively. All coordinate data were accurately measured using RTK. During the experiments, waveforms were recorded on-site using the microseismic monitoring system. The OVMD-WTD method was employed for denoising, and the fractal box-counting dimension was used to extract the first-arrival times. These times, along with the geophone positions, were then fed into the particle swarm optimization algorithm to invert the source location and compare it with the actual position. The inversion results obtained through particle swarm optimization are recorded and compared with the actual source location to assess accuracy.
During signal acquisition, environmental noise from nearby factory machinery, high-voltage power lines, and other sources interfered with the experimental site. The acquired x-direction signal is presented in Figure 14.
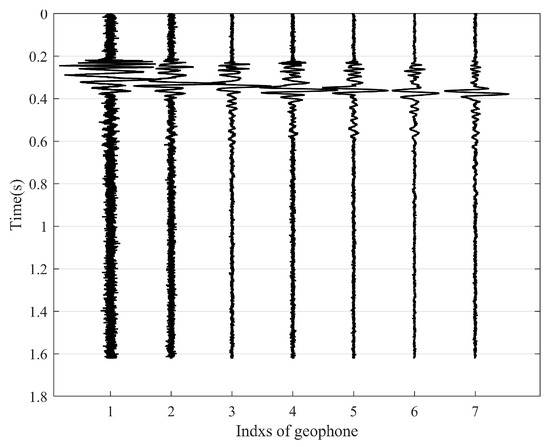
Figure 14.
Waveform acquired during the experiment (x-direction).
Under these conditions, the first-arrival time is difficult to identify. The presence of noise severely degrades signal clarity and waveform continuity, thereby increasing the difficulty of accurately extracting the first-arrival time. Therefore, denoising the signal is essential.
The first signal data in the figure are decomposed using OVMD, and the decomposition results are shown in Table 4.
For the first signal, when the number of decomposition modes reaches K = 7, the center frequencies of subsequent modes stabilize around 2280–2540 Hz, and the frequency components are clearly separated and accurately captured. Therefore, K = 7 is determined to be the optimal modal decomposition number for this signal. Given that the experimental conditions are consistent, the same optimal modal number is assumed for the decomposition of the remaining signals. After decomposition, wavelet threshold denoising is applied to each mode using the sym4 wavelet basis, with the number of decomposition levels set to 4. The final denoised x-direction signal is presented in Figure 15.

Figure 15.
Waveform of the signal after denoising (in the x-direction).
Before noise reduction, the signal waveform contains pronounced noise components with large amplitude fluctuations, which significantly interfere with the signal and make accurate identification more difficult. This level of noise negatively impacts the processing and analysis of subsequent seismic data, particularly during the first-arrival picking stage. It becomes difficult to accurately determine the arrival time and set appropriate picking parameters. After noise reduction, the signal waveform becomes smoother and more coherent, the noise components are significantly reduced, and signal clarity is greatly improved. This not only enhances signal quality but also facilitates more accurate first-arrival picking.
Here, the fractal box-counting dimension is further employed to extract the first-arrival time. The selected box side lengths are [2, 4, 5, 6, 7, 8], which are used to cover the signal and count the number of boxes containing the structure. An adaptive window size is applied, with a minimum of 1, a maximum of 10, and a step size of 1. The fractal dimension change threshold is set to 0.02. The segment step size is set to 5. The final first-arrival time results obtained using this method are shown in Figure 16.
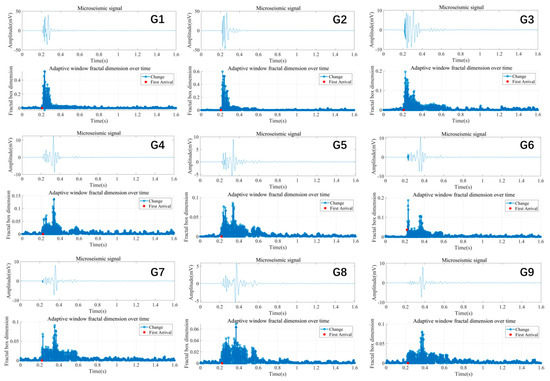
Figure 16.
Result of the first-arrival time obtained using the fractal box dimension method.
The figure presents the microseismic signal processing results from nine geophone channels. In each subplot, the upper part shows the time-domain waveform of the signal after denoising using the proposed OVMD–WTD joint method, while the lower part displays the corresponding variation in the fractal box-counting dimension over time under an adaptive sliding window. The red dot indicates the first-arrival time automatically identified based on the abrupt change criterion of the fractal dimension. By capturing the local discontinuities in the fractal dimension curve, the proposed method effectively characterizes the transition from a stationary background to the seismic response phase, enabling the accurate extraction of the first-arrival time.
Due to limitations in accurately recording the start time during hammering, the absolute propagation time cannot be directly measured. Instead, the propagation time from the source to each geophone is estimated by subtracting the first-arrival time at the reference geophone from those recorded by the receiving geophones. The filtered signal, with first-arrival times extracted using the fractal box-counting dimension, is compared with results obtained via manual picking, CWT, and STFT, as shown in Table 5.
The theoretical arrival times at different geophones are compared with those calculated by various methods, and the results are presented in Table 6.

Table 6.
Comparison of arrival times from different methods with theoretical arrival times.
Table 5 and Table 6, along with Figure 17, present a comparison of various microseismic first-arrival picking methods against manual picking and theoretical arrival times. Manual picking results show close agreement with theoretical values, and the arrival times obtained using the fractal box-counting dimension method also exhibit high accuracy. In contrast, traditional methods such as CWT and STFT result in significantly larger deviations from the theoretical arrival times. This demonstrates that the fractal box-counting dimension method significantly outperforms CWT and STFT in first-arrival time extraction.
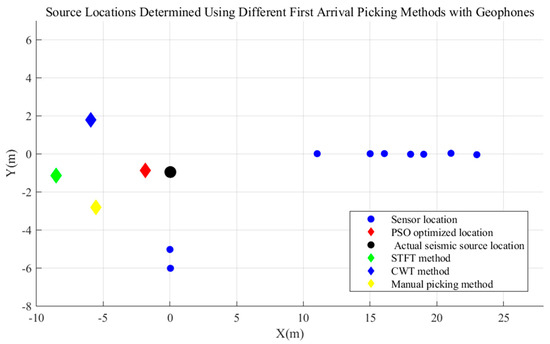
Figure 17.
Comparison of PSO-optimized coordinates from different methods with the actual source location.
The detailed error analysis is presented in Table 7.

Table 7.
Comparison of results from different localization methods.
In this study, after denoising the microseismic event signals using the OVMD-WTD method, an improved fractal box-counting dimension algorithm was applied to accurately identify the first-arrival times. These times were then used in source localization inversion via the PSO algorithm. The localization results are shown in Figure 17. The true source location was (0.032, −0.943) m, and the inverted result was (−1.85, −0.85) m, yielding an error of approximately 1.882 m in the x-direction and 0.093 m in the y-direction. The total localization error was within 2 m. Compared with traditional approaches such as CWT and STFT, the proposed method demonstrates higher accuracy in first-arrival picking and improved spatial localization reliability, significantly enhancing overall localization performance. It is important to note that, in the physical experiment conducted in this study, source localization relied solely on first-arrival information extracted using the fractal dimension method, without incorporating amplitude or energy attenuation parameters. Given the directionality of the hammer source and the inherent heterogeneity of the experimental medium, amplitude values are subject to significant fluctuations, which can compromise the stability of amplitude-based localization. Therefore, this study focuses on a time-domain-based localization framework, which includes signal denoising, first-arrival identification, and PSO-based inversion, effectively avoiding cumulative errors caused by amplitude instability.
The microseismic localization experiment was conducted under complex geological conditions, such as hydraulic fracturing, and involved various sources of noise interference, including vibrations from nearby factory equipment, electromagnetic interference from power transmission lines, and variations in the coupling between the ground and geophones. These factors contributed to the high complexity of the experimental environment. Therefore, we believe that the physical experiment adequately represents the complex conditions encountered in real-world scenarios. Both numerical simulations and physical experiments demonstrated that, under strong noise conditions, the proposed method is capable of effectively extracting the first-arrival time and providing accurate event localization. The proposed method exhibits strong robustness and practical applicability under complex noise conditions, providing reliable support for real-time monitoring of fracture propagation and evolution during hydraulic fracturing. By accurately capturing microseismic responses induced by fracture activity, the method enables the effective evaluation of the fracture network development and its impact on hydrocarbon flow pathways, thereby offering a solid geophysical basis for reservoir characterization, production optimization, and risk control in unconventional oil and gas development.
4. Discussion
The OVMD-WTD and adaptive fractal box-counting dimension methods proposed in this study demonstrate high accuracy and robustness in microseismic signal denoising and first-arrival time picking, particularly under low signal-to-noise ratio conditions. These methods effectively address complex noise environments and exhibit low computational complexity, making them especially suitable for real-time monitoring scenarios. Traditional deep learning methods show strong learning capabilities on large-scale datasets, but they typically rely on a large amount of labeled data and have high computational complexity, resulting in longer processing times. This makes them more limited in terms of real-time processing and efficient applications. In contrast, the method proposed in this study avoids the dependency on large labeled datasets, providing a more efficient and easily implementable solution that is well suited for rapid response requirements in practical engineering applications. Nevertheless, there are still some limitations to the proposed method in real-world engineering applications.
(1) Given that this study only validated the proposed method in a two-dimensional space, future work will focus on extending it to three-dimensional source localization by adopting software platforms that support 3D modeling. We also plan to conduct validation in more complex experimental environments to enhance the method’s applicability and robustness under realistic geological conditions. This will enable a more comprehensive understanding of fracture propagation, and improve the accuracy of reservoir characterization and risk assessment.
(2) In future research, more complex geological models involving multilayered media and velocity gradients will be introduced. The proposed method will be systematically evaluated under varying source depths, sensor configurations, and noise types to assess its adaptability and generalizability.
5. Conclusions
This study proposed a novel microseismic signal processing framework that integrates OVMD-WTD and adaptive fractal box-counting dimension analyses to enhance first-arrival picking and improve localization accuracy under low signal-to-noise conditions.
(1) The application of OVMD effectively avoids both over- and under-decomposition, allowing for the accurate extraction of signal components without the loss of critical information. Compared with conventional techniques, OVMD demonstrates superior capability in capturing fine features in complex signals. The integration of WTD within the decomposed modes further suppresses high-frequency noise while preserving essential low-frequency content, thereby improving the overall signal quality for microseismic analysis.
(2) The adaptive fractal box-counting dimension method accurately detects the first-arrival time by characterizing local complexity variations in the waveform. Its ability to capture abrupt structural changes enables the precise identification of arrival points, even under strong noise interference. The adaptive window strategy dynamically adjusts to signal characteristics, improving both accuracy and computational efficiency. This method proves particularly effective in the real-time monitoring of hydraulic fracturing, facilitating fracture growth tracking and enhancing reservoir characterization.
(3) The proposed method was validated through numerical simulations and physical experiments, demonstrating robustness and high accuracy in both idealized and noisy environments. The picked arrival times were used as inputs to a PSO-based localization algorithm, yielding stable and precise source locations. This highlights the practical applicability of the proposed workflow for microseismic monitoring in unconventional oil and gas reservoirs.
Author Contributions
Methodology, G.Z.; formal analysis, S.L.; software and resources, Y.W.; project administration, Y.G.; visualization, X.H. and W.Z.; validation, G.Z. and Y.W.; investigation, Y.W.; software, W.Z.; writing—original draft preparation, C.R. All authors have read and agreed to the published version of the manuscript.
Funding
This study was sponsored by the Fundamental Research Funds for the Central Universities (Grant No. JZ2025HGTG0266).
Data Availability Statement
This research is still under ongoing development. To ensure transparency and reproducibility, we are currently organizing and documenting the relevant experimental data and code resources. The authors are willing to provide access to the data or code upon reasonable request for academic purposes. Interested researchers may contact the corresponding author for further communication. In the future, the materials may also be made publicly available on appropriate platforms to support broader academic exchange and collaboration.
Acknowledgments
I thank the reviewers for their valuable suggestions and all the authors for their hard work.
Conflicts of Interest
The authors declare that there are no conflicts of interest regarding the publication of this paper. Author Chuan Ren was employed by the company Anhui Huizhou Geology Security Institute Co., Ltd. The remaining authors declare that the research was conducted in the absence of any commercial or financial relationships that could be construed as a potential conflict of interest.
Abbreviations
The following abbreviations are used in this manuscript:
| OVMD | Optimal Variational Mode Decomposition |
| WTD | Wavelet Threshold Denoising |
| PSO | Particle Swarm Optimization |
| DWT | Discrete Wavelet Transform |
| CWT | Continuous Wavelet Transform |
| STFT | Short-time Fourier transform |
| STA/LTA | Short-Term Average/Long-Term Average |
| HMM | Hidden Markov Model |
| AIC | Akaike Information Criterion |
References
- Fu, L.; Shao, Y.; Shao, M.; Zhu, T.; Li, X.; Yang, Z.; Zou, J.; Fan, M.; Liao, K. Application and Research Progress of CO2 Stimulation Technology in Unconventional Oil and Gas Reservoirs: A Review and Prospect. Energy Fuels 2023, 37, 19400–19418. [Google Scholar] [CrossRef]
- Li, Y. The Dearth of Oil Resource and the Decrease of Oil Quality. China Pet. Enterp. 2018, 12, 36–38. [Google Scholar]
- Liu, Z.; Sa, L.; Wu, F.; Dong, S.; Li, Y. Microseismic Monitor Technology Status for Unconventional Resource E&P and Its Future Development in CNPC. Oil Geophys. Prospect. 2013, 48, 843–853. [Google Scholar]
- Guo, J.; Zhang, Y.; Zeng, F. Research Progress and Prospects of Intelligent Fracturing Technology for Unconventional Reservoirs. Nat. Gas Ind. B 2024, 44, 13–26. [Google Scholar]
- Liu, Y.; Gao, D.; Li, Q.; Wan, Y.; Duan, W.; Zeng, X.; Li, M.; Su, Y.; Fan, Y.; Li, S.; et al. Mechanical Frontiers in Shale-Gas Development. Adv. Mech. 2019, 49, 201901. [Google Scholar]
- Maxwell, S.C.; Rutledge, J.; Jones, R.; Fehler, M. Petroleum Reservoir Characterization Using Downhole Microseismic Monitoring. Geophysics 2010, 75, 75A129–75A137. [Google Scholar] [CrossRef]
- Dong, W.; Gui, Z.; Wang, Y.; Zhang, H.; Jin, P. Asymmetry analysis of microseismic monitoring results of horizontal well fracturing. Oil Geophys. Prospect. 2023, 58, 161–169. [Google Scholar]
- Wang, B.; Sheng, S.; Wei, L.; Liu, S.; Zeng, L. Mine seismic adaptive noise suppression method based on VMD and GA-SVM. J. China Coal Soc. 2018, 49, 1530–1538. [Google Scholar]
- Lu, C.; Dou, L.; Wu, X.; Yu, L.; Liu, S.; Zheng, L. Frequency spectrum analysis on microseismic monitoring and signal differentiation of rock material. Chin. J. Geotech. Eng. 2005, 7, 772–775. [Google Scholar]
- Allen, R.V. Automatic earthquake recognition and timing from single traces. Bull. Seismol. Soc. Am. 1978, 68, 1521–1532. [Google Scholar] [CrossRef]
- Munro, K. Automatic Event Detection and Picking of P-Wave Arrivals; CREWES Research Report; CREWES: Calgary, AB, Canada, 2004. [Google Scholar]
- Akram, J. Automatic P-wave arrival time picking method for seismic and microseismic data. In Proceedings of the CSPG CSEG CWLS Convention Abstracts, Calgary, AB, Canada, 9–11 May 2011; pp. 1–4. [Google Scholar]
- Liu, X.; Zhao, J.; Wang, Y.; Peng, P. Automatic picking of microseismic events P-wave arrivals based on improved method of STA/LTA. J. Northeast. Univ. (Nat. Sci.) 2017, 38, 740–745. [Google Scholar]
- Chen, B.R.; Wu, H.; Chi, X.W.; Liu, H.; Wu, M.D.; Yan, J.W. Real-time recognition algorithm for microseismic signals of rock failure based on STA/LTA and its engineering application. Rock Soil Mech. 2019, 40, 3689–3696. [Google Scholar]
- Li, J.; He, M.; Cui, G.; Wang, X.; Wang, W.; Wang, J. A novel method of seismic signal detection using waveform features. Appl. Sci. 2020, 10, 2919. [Google Scholar] [CrossRef]
- Jones, J.P.; Van der Baan, M. Adaptive STA–LTA with outlier statistics. Bull. Seismol. Soc. Am. 2015, 105, 1606–1618. [Google Scholar] [CrossRef]
- Zhu, Q.; Jiang, F.; Wei, Q.; Wang, B.; Liu, J.; Liu, X. An automatic method determining arrival times of microseismic P-phase in hydraulic fracturing of coal seam. Chin. J. Rock Mech. Eng. 2018, 37, 2319–2333. [Google Scholar]
- Li, S.; Tang, C.; Liu, Y. The research about new method of picking onset of microseismic P-wave based on power of damping energy. Chin. J. Rock Mech. Eng. 2021, 40 (Suppl. S1), 2613–2622. [Google Scholar]
- Zhang, H.; Li, R.; Ma, C.; Cheng, X.; Meng, S.; Huang, Z.; Li, D. A Dual-Task Approach for Onset Time Picking and the Detection of Microseismic Waveforms Based on Deep Learning. Appl. Sci. 2024, 14, 11689. [Google Scholar] [CrossRef]
- Zhan, K.; Wen, X.; Xu, R.; Wang, X.; Wang, C.; Song, P.; Kong, C. LGF SeismoLocator: A Deep Learning Model for Precision Microseismic Event Localization in Coal Mines. Rock Mech. Rock Eng. 2024, 57, 10717–10730. [Google Scholar] [CrossRef]
- Luo, H.; Xu, X.; Pan, Y.; Yu, J.; Zhang, Y.; Zhang, L. The CGAS Deep Learning Algorithm for P-Wave Arrival Time Picking of Mining Microseismic Events. IEEE Access 2023, 11, 102961–102970. [Google Scholar] [CrossRef]
- Li, Q.; Zhao, Y.; Hu, Q.; Liang, Y.; Sun, W.; Li, W.; Zhan, J.; He, J.; He, K.; Chen, H. Denoising method and application of microseismic signals for coal seam hydraulic fracturing based on deep neural network mode. J. China Coal Soc. 2025, 58, 1–17. [Google Scholar]
- Fang, D.; Gu, H.; Qian, J.; Gan, Y.; Liang, B. Real-time microseismic monitoring for the hydraulic fracture of horizontal wells at NC block. Prog. Geophys. 2022, 37, 577–587. [Google Scholar]
- Konstantin, D.; Dominique, Z. Variation mode decomposition. IEEE Trans. Signal Process. 2014, 62, 531–544. [Google Scholar]
- Du, D.; Sheng, Y.; Zhao, H.; Liu, W. Fault diagnosis for proton exchange membrane fuel cell system based on VMD. Control Eng. China 2023, 30, 1190–1197. [Google Scholar]
- Chen, Y.; Zhang, J.; Lin, C.; Zhao, J.; Reng, L. The method and application of minor strike-slip faults identification about deep and ultra-deep carbonate reservoir based on wavelet transform sensitive frequency. Prog. Geophys. 2021, 36, 1941–1947. [Google Scholar]
- Liu, Y.; Wu, Y.; Zhang, Q.; Yan, F.; Chen, S. Road crack detection based on separable convolution and wavelet transform fusion. Comput. Sci. 2024, 51 (Suppl. S2), 314–322. [Google Scholar]
- Liu, Y.Q.; Deng, H.W.; Wu, L.B.; Shen, Y.P.; Tian, Y.Q.; Yu, S.T. Study on signal denoising of microseismic monitoring based on combined variational mode decomposition and wavelet threshold method. Min. Res. Dev. 2020, 40, 98–103. [Google Scholar]
- Yang, R.; Xu, P. Fractal study of media damage under blasting loading. J. China Coal Soc. 2017, 42, 3065–3071. [Google Scholar]
- Wang, L.; Zeng, X.; Yang, H.; Lv, X.; Guo, F.; Shi, Y.; Hanif, A. Investigation and application of fractal theory in cement-based materials: A review. Fractal Fract. 2021, 5, 247. [Google Scholar] [CrossRef]
- An, Q.; Chen, X.; Wang, H.; Yang, H.; Yang, Y.; Huang, W.; Wang, L. Segmentation of concrete cracks by using fractal dimension and UHK-Net. Fractal Fract. 2022, 6, 95. [Google Scholar] [CrossRef]
- Yang, C.; Li, T.; Hu, B.; Li, H.; Gen, W.; Hao, P.; Ji, X.; Sun, Z.; Zhu, F.; Zhang, H. Research on arrival time picking of mine microseismic first arrival based on improved wavelet threshold denoising and fractal box dimension. Min. Res. Dev. 2023, 43, 125–132. [Google Scholar]
- Li, Y.; Fu, S.; Jiao, Y.; Wu, M. Collapsing coal-rock identification based on fractal box dimension and wavelet packet energy moment. J. China Coal Soc. 2017, 42, 803–808. [Google Scholar]
- Chen, B. The Tomography Method of the Transmitted Waves in Coalmining Face. Ph.D. Thesis, China University of Mining and Technology, Beijing, China, 2022. [Google Scholar]
Disclaimer/Publisher’s Note: The statements, opinions and data contained in all publications are solely those of the individual author(s) and contributor(s) and not of MDPI and/or the editor(s). MDPI and/or the editor(s) disclaim responsibility for any injury to people or property resulting from any ideas, methods, instructions or products referred to in the content. |
© 2025 by the authors. Licensee MDPI, Basel, Switzerland. This article is an open access article distributed under the terms and conditions of the Creative Commons Attribution (CC BY) license (https://creativecommons.org/licenses/by/4.0/).