Article

Fracture Complexity and Mineral Damage in Shale Hydraulic Fracturing Based on Microscale Fractal Analysis

1
State Key Laboratory of Coastal and Offshore Engineering, Dalian University of Technology, Dalian 116024, China
2
Information Research Institute of the Department of Emergency Management, Beijing 100029, China
3
PetroChina Research Institute of Petroleum Exploration & Development, Beijing 100083, China
4
Sanying Precision Instruments Co., Ltd., Tianjin 300000, China
5
School of Civil Engineering, Tianjin University, Tianjin 300354, China
6
College of Civil Engineering and Architecture, Dalian University, Dalian 116622, China
*
Author to whom correspondence should be addressed.
Fractal Fract. 2025, 9(8), 535; https://doi.org/10.3390/fractalfract9080535
Submission received: 13 July 2025 / Revised: 29 July 2025 / Accepted: 11 August 2025 / Published: 15 August 2025
(This article belongs to the Special Issue Multiscale Fractal Analysis in Unconventional Reservoirs)

Abstract

The geological structural complexity and microscale heterogeneity of shale reservoirs, characterized by the brittleness index and natural fracture density, exert a decisive effect on hydraulic fracturing’s effectiveness. However, the mechanisms underlying the true microscale heterogeneity of shale structures, which is neglected in conventional models and influences fracture evolution, remain unclear. Here, high-resolution scanning electron microscopy (SEM) was employed to obtain realistic distributions of mineral components and natural fractures, and hydraulic–mechanical coupled simulation models were developed within the Realistic Failure Process Analysis (RFPA) simulator using digital rock techniques. The analysis examined how the brittleness index and natural fracture density affect the fracture morphology’s complexity, mineral failure behavior, and flow conductivity. Numerical simulations show that the main fractures preferentially propagate toward areas with high local brittleness and dense natural fractures. Both the fracture’s fractal dimension and the stimulated reservoir volume increased with the brittleness index. A moderate natural fracture density promotes the fracture network’s complexity, whereas excessive densities may suppress the main fracture’s propagation. Microscopically, organic matter and silicate minerals are more prone to damage, predominantly tensile failures under external loading. These findings highlight the dominant role of microscale heterogeneity in shale fracturing and provide theoretical support for fracture control and stimulation optimization in complex reservoirs.

1. Introduction

Hydraulic fracturing has become a widely adopted technique for developing tight shale oil and gas reservoirs by injecting high-pressure fluids into formations to create artificial fracture networks that enhance reservoir permeability and hydrocarbon recovery rates [1,2,3]. The effectiveness of fracturing, characterized by fracture propagation paths, the geometric form, and spatial complexity, is controlled by both artificial parameters and geological formation factors [4,5]. Among the various artificial parameters, the fluid injection rate exerts the most significant influence on a fracture’s geometry and propagation behavior. It is generally considered the dominant factor controlling the fracture-driving pressure and geometric development characteristics [6,7]. Among the geological controlling factors, the brittleness index (BI) and natural fracture density (NFD) are recognized as particularly critical to influencing fracture evolution and determining the overall stimulation efficiency [8,9].
In heterogeneous shale reservoirs, the complex mineral composition and fracture networks create unpredictable fracture propagation pathways [10]. Studies have shown that high brittleness in shale promotes long-distance fracture propagation vertical to the minimum principal stress and facilitates connectivity with natural fractures, leading to complex fracture networks [11]. BI, commonly calculated from mineral composition ratios, increases with higher contents of brittle minerals like quartz and carbonates. A higher BI facilitates brittle failure and fracture development [12,13]. Chen et al. (2021) reported that a high BI leads to X-shaped shear fractures or intersecting networks, while a low BI results in more regular, symmetrical wing-shaped fractures [14]. Khan et al. (2023) found a negative correlation between the BI and fracture initiation pressure. Rocks with a higher BI fracture more easily under lower net pressures, promoting fracture complexity and larger stimulated volumes [15]. However, these studies typically assume idealized homogeneous models while overlooking the heterogeneous distribution of brittle minerals in real reservoirs [16,17,18]. The irregular spatial arrangement of brittle minerals within shale formations creates complex perturbations that affect fracture initiation, propagation directions, and branching behaviors [19,20]. Microstructural features such as grain boundaries, weak interfaces, and pore structures also impact the energy dissipation required for fracture propagation [10]. Therefore, qualitative fracture behavior analysis based solely on brittle mineral content is inaccurate, requiring systematic studies that integrate coupling mechanisms with the actual structural characteristics of rock [17,18].
Natural fractures, as critical structural weaknesses in reservoirs, decisively influence hydraulic fracture propagation paths and morphological development [21,22,23]. Chong et al. (2017) found that increasing the NFD enhances the number of fractures and pore pressure concentration but suppresses tensile fracture development in the matrix [24]. The effect on shear fractures is less pronounced [24]. Yoshioka et al. (2022) noted that interaction between hydraulic and natural fractures leads to complex outcomes such as crossing, slipping, or termination [25]. A higher NFD intensifies these interactions and increases the network’s complexity [25]. Wang et al. (2023) demonstrated that a high NFD promotes fracture network complexity through branching [26] but causes uncontrollable fracturing outcomes, including unstable fracture paths, main fracture deflection, and premature propagation termination [27,28]. Therefore, the positive and negative impacts of natural fractures must be evaluated based on specific geological conditions [29]. While the aforementioned studies enhance our understanding of natural fracture effects on hydraulic fracturing, they typically simplify natural fractures as linear weak planes, neglecting their actual geometric and physical structures [30,31]. In reality, natural fracture tortuosity, surface roughness, and mineral filling significantly influence stress redistribution and fracture growth mechanisms [32,33,34]. These oversimplified modeling approaches limit realistic representation of hydraulic and natural fracture interactions, resulting in biased predictions of fracture complexity and network connectivity [35,36].
To address these limitations, high-resolution digital rock modeling (DRM) has emerged as a powerful tool for analyzing microstructural responses [37,38,39]. Using techniques such as SEM and micro-/nano-computed tomography, DRM reconstructs realistic models of mineral phases, pore structures, and fracture networks [40,41,42]. Coupled multi-physics models capture the full fracture process and enhance simulation fidelity [10]. High-resolution scanning electron microscopy (SEM) enables the reconstruction of microscale rock features, such as mineral distributions, microfractures, and pore structures, which directly influence local mechanical behavior and hydraulic–mechanical interactions [43]. Although these features exist at the microscale, they serve as fundamental building blocks for macroscopic fracture evolution [44]. By statistically sampling representative SEM regions and converting them into digital rock models, microscale characteristics can be upscaled to capture large-scale mechanical heterogeneity and fracture tendencies [45]. This multiscale coupling approach enhances the physical realism of simulations and strengthens the correlation between numerical results and field-scale hydraulic fracturing behavior [46]. DRM is especially effective in evaluating the coupled effects of brittle minerals and natural fractures [47].
Li et al. [48,49] demonstrated that in highly heterogeneous reservoirs, the brittleness index (BI) and natural fracture density (NFD) are key geological factors governing fracture initiation pressure, propagation paths, and geometric complexity. Integrating the BI and NFD into high-resolution digital rock models enables more accurate reproduction of multiscale coupling mechanisms between rock structures and fluid-induced failure, thereby improving the physical realism and predictive capability of numerical simulations. However, existing studies primarily focus on simplified models involving either the BI or NFD as a single variable, with limited investigation into their effects on fracture propagation under realistic geological conditions [50]. Furthermore, the dynamic response of different minerals during fracture development needs further exploration [51,52]. Therefore, it is necessary to introduce simulation methods with enhanced physical realism and structural representation to reproduce complex fracture evolution under multi-factor coupling conditions [53,54].
Fractal theory has been widely applied to characterize irregular and scale-dependent structural features in geological materials. It is particularly effective in describing the geometric complexity of fracture surfaces, pore networks, mineral distributions, and microstructural features in rocks [55,56,57]. Studies have shown that fractal-based methods are capable of capturing fracture propagation, permeability evolution, and energy dissipation in heterogeneous media, highlighting their advantages in revealing multiscale heterogeneity and failure mechanisms in rock materials [58,59]. In addition, digital core analysis combined with fractal dimension calculations has further demonstrated the influence of pore structures on permeability, porosity, and fluid transport properties [60]. Building on these insights, this study incorporates microscale fractal analysis into a numerical modeling framework to more accurately represent microstructural complexity and to investigate the heterogeneous evolution of hydraulic fractures in shale.
The present study develops a novel numerical framework that integrates high-resolution SEM-based digital rock models, the RFPA method, and a microscale mechanical parameter identification scheme to simulate hydraulic fracture propagation under realistic multivariable geological conditions. The analysis examines how the BI and NFD affect fracture morphology complexity and mineral failure behavior. Moreover, a hydraulic fracture effectiveness index is proposed to evaluate the relationship between fluid transport capacity and both NFD and the BI.

2. Materials and Methods

In this study, a self-developed mesoscopic simulation framework, Rock Failure Process Analysis (RFPA),was employed to model hydraulic fracturing. This method is grounded in continuum mechanics and statistical damage theory, treating rock as a heterogeneous continuum. Mechanical parameters such as elastic modulus and strength are assigned to finite elements following a Weibull probability distribution, enabling effective representation of mineralogical and pore-scale heterogeneity, as well as the brittle–ductile transitions and pore effects. Each finite element is assumed to form a perfect bond with its neighbors, sharing a common interface and four nodal points. To maintain kinematic compatibility, elements carry different stress values. When the local stress exceeds the assigned strength, the element undergoes stiffness degradation, where a very small value replaces its elastic modulus. Under the small-deformation assumption, this mechanism ensures numerical convergence and computational stability. Fractures are represented by contiguous chains of degraded elements, sharing the same mesh resolution and nodal structure as the surrounding material. As loading progresses, internal damage accumulates, leading to crack initiation, element failure, and local stress release. Stress redistribution drives further fracture propagation. When propagating fractures intersect pre-existing damaged zones, their interaction is governed by the principle of energy minimization, resulting in fracture coalescence or redirection.
To simulate hydraulic–mechanical interaction, a bidirectional hydraulic–mechanical coupling mechanism is introduced based on Biot’s poroelastic theory. Fluid pressure within pores influences the mechanical behavior of the rock, while deformation and fracture evolution dynamically modify porosity and permeability, thereby altering fluid flow. The fluid phase obeys Darcy’s law, and the coupling is primarily reflected in [10,61]
(1)
Adjustments to effective stress due to evolving pore pressure.
(2)
Updates to permeability in response to damage accumulation.
Compared with interface-based contact models such as those proposed by Dang-Trung et al. [62] and Wang et al. [63], the RFPA method maintains sound physical assumptions while offering superior computational efficiency and scalability, particularly in simulating hydraulic fracture propagation in highly heterogeneous shale formations.

2.1. Governing Equations

(1)
Probability density functions describing the heterogeneity of mineral mechanical properties (such as elastic modulus and strength) [64]:
f ( x ) = m x 0 ( x x 0 ) m 1 e ( x x 0 ) m
(2)
Damage evolution equation and failure criteria:
E = ( 1 D ) E 0
Only one failure mode is assumed for each element. Two criteria are used for failure determination: the maximum tensile stress criterion or the Mohr–Coulomb criterion [65]:
σ 3 σ t                                                                             σ 1 σ c 1 + sin φ 1 + sin φ σ t   σ 1 1 + sin φ 1 + sin φ σ 3 > σ c                       σ 1 > σ c 1 + sin φ 1 + sin φ σ t
For elements satisfying the maximum tensile stress criterion (see Figure 1a), the damage variable D is expressed as [10]
D = 0                                                 ε ¯ < ε t 0 1 σ r t ε E i                         ε t ε ¯ ε t u 1                                                 ε ¯ ε t u
For elements satisfying the maximum tensile stress criterion (see Figure 1b), the damage variable D is expressed as [10]
D = 0                                                 ε 3 > ε c 1 + σ r c ε 1 E i                       ε 3 ε c
For different mineral components, the rate of damage evolution is used to modulate their brittle or ductile characteristics. The final damage variable can be expressed as
D k = k D × D
where kD is the damage rate coefficient. A larger kD indicates faster damage accumulation, typically representing minerals with more brittle behavior, which are prone to sudden failure once the stress threshold is exceeded. In contrast, a smaller kD corresponds to slower damage development, generally associated with more ductile mineral phases that exhibit gradual softening behavior. The value of kD ranges from 0 to 1.
(3)
HM coupling equation [66]:
σ = 2 G ε + 2 ν G 1 2 ν t r ( ε ) I α p I
(4)
The mass balance equation for fluid flow is expressed as [67]
ρ g k μ 2 H q = S s H t
(5)
Permeability is updated based on the damage state of each element [68]:
k = k 0   e β ( σ i i 3 α p )               D k = 0 V 2 3 108 ε v 2                                 0 < D k < 1 V 2 3 8 π                                 D k = 1

2.2. Model Construction Method

To accurately represent the microstructural features of shale, a digital rock numerical model was developed based on high-resolution SEM images. In this study, SEM imaging was performed using a field emission scanning electron microscope (FE-SEM) under an accelerating voltage of 5.00 kV, a working distance of 4.0 mm, and a beam current of 0.40 nA. A composite imaging mode (A + B) and a T1 detector were employed to capture high-resolution surface morphology. The horizontal field width (HFW) was 829 µm at a magnification of 500×.
In this simulation, the image resolution reached 0.36 μm, allowing for the direct identification of intergranular boundaries. Where two mineral phases intersect, weak mineral materials were used to represent cementation zones between grains. Therefore, grain-to-grain interfaces were not modeled separately. These parameters ensured accurate reconstruction of mineral distribution and fracture features for digital rock modeling.
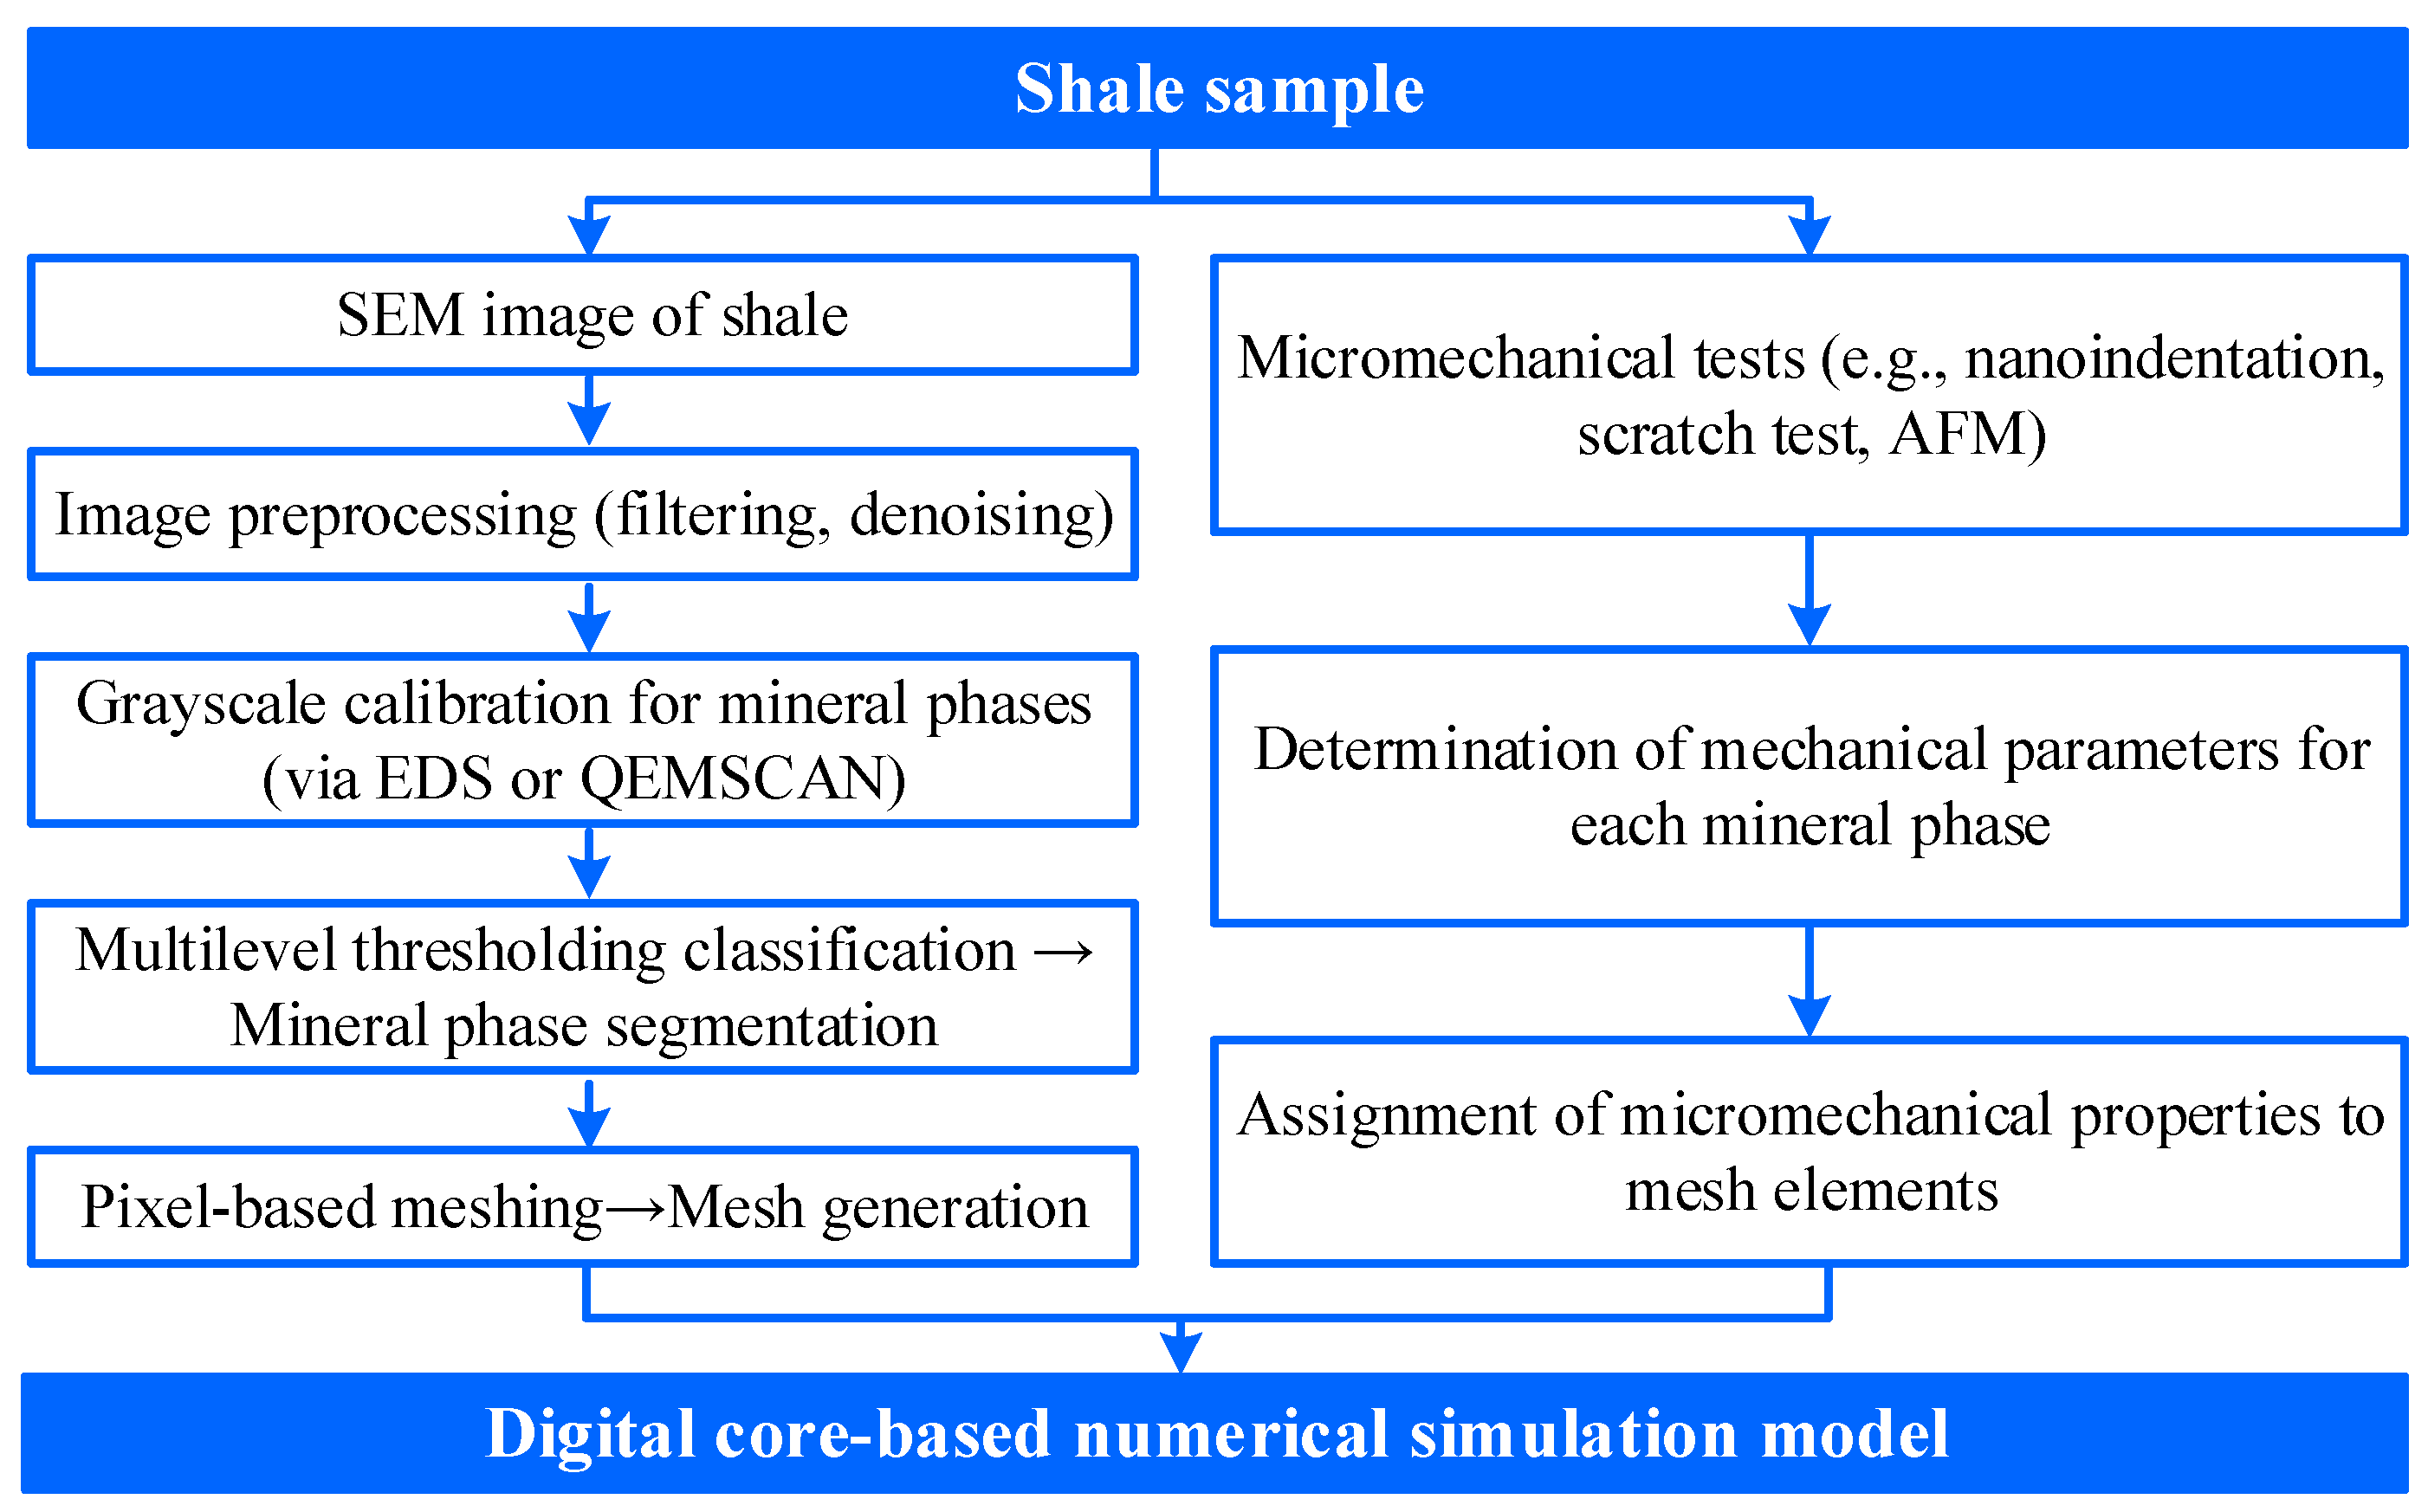
This image-driven modeling workflow includes five key steps: image acquisition, image processing, mineral phase identification and segmentation, mesh generation, and mechanical property assignment (Figure 2). First, SEM images of shale slices were collected under the conditions described above. The images were preprocessed through filtering, noise reduction, and size normalization. Energy-dispersive spectroscopy (EDS) or QEMSCAN data were used to calibrate grayscale values, establishing a mapping between image grayscale and mineral phases. A multi-threshold classification method was applied to segment the mineral phases and identify the spatial distribution of typical microstructural units, such as organic pores, organic fractures, and quartz grains.
The processed images were then converted into two-dimensional finite element meshes using pixel-level mapping. Each pixel corresponds to one element in the model.

2.3. Mechanical Property Assignment Based on Nanoindentation

To ensure accurate representation of shale’s mechanical response, the spatially heterogeneous mechanical properties of mineral phases were quantified and incorporated into the model. The detailed methodology is described below.
The methodology for determining the mechanical properties of individual minerals is illustrated in Figure 3. Scanning electron microscopy (SEM) is first employed to identify and locate distinct mineral phases. Targeted nanoindentation is then performed at these locations to acquire load–displacement (P-h) curves. The resulting data are analyzed using the Oliver–Pharr method to extract fundamental mechanical parameters, such as hardness and elastic modulus. To improve statistical reliability, a large-area grid nanoindentation test is subsequently conducted. Finally, deconvolution analysis of the indentation data yields the mechanical properties of individual mineral phases and their associated heterogeneity, quantified by the Weibull modulus (m), as summarized in Table 1.
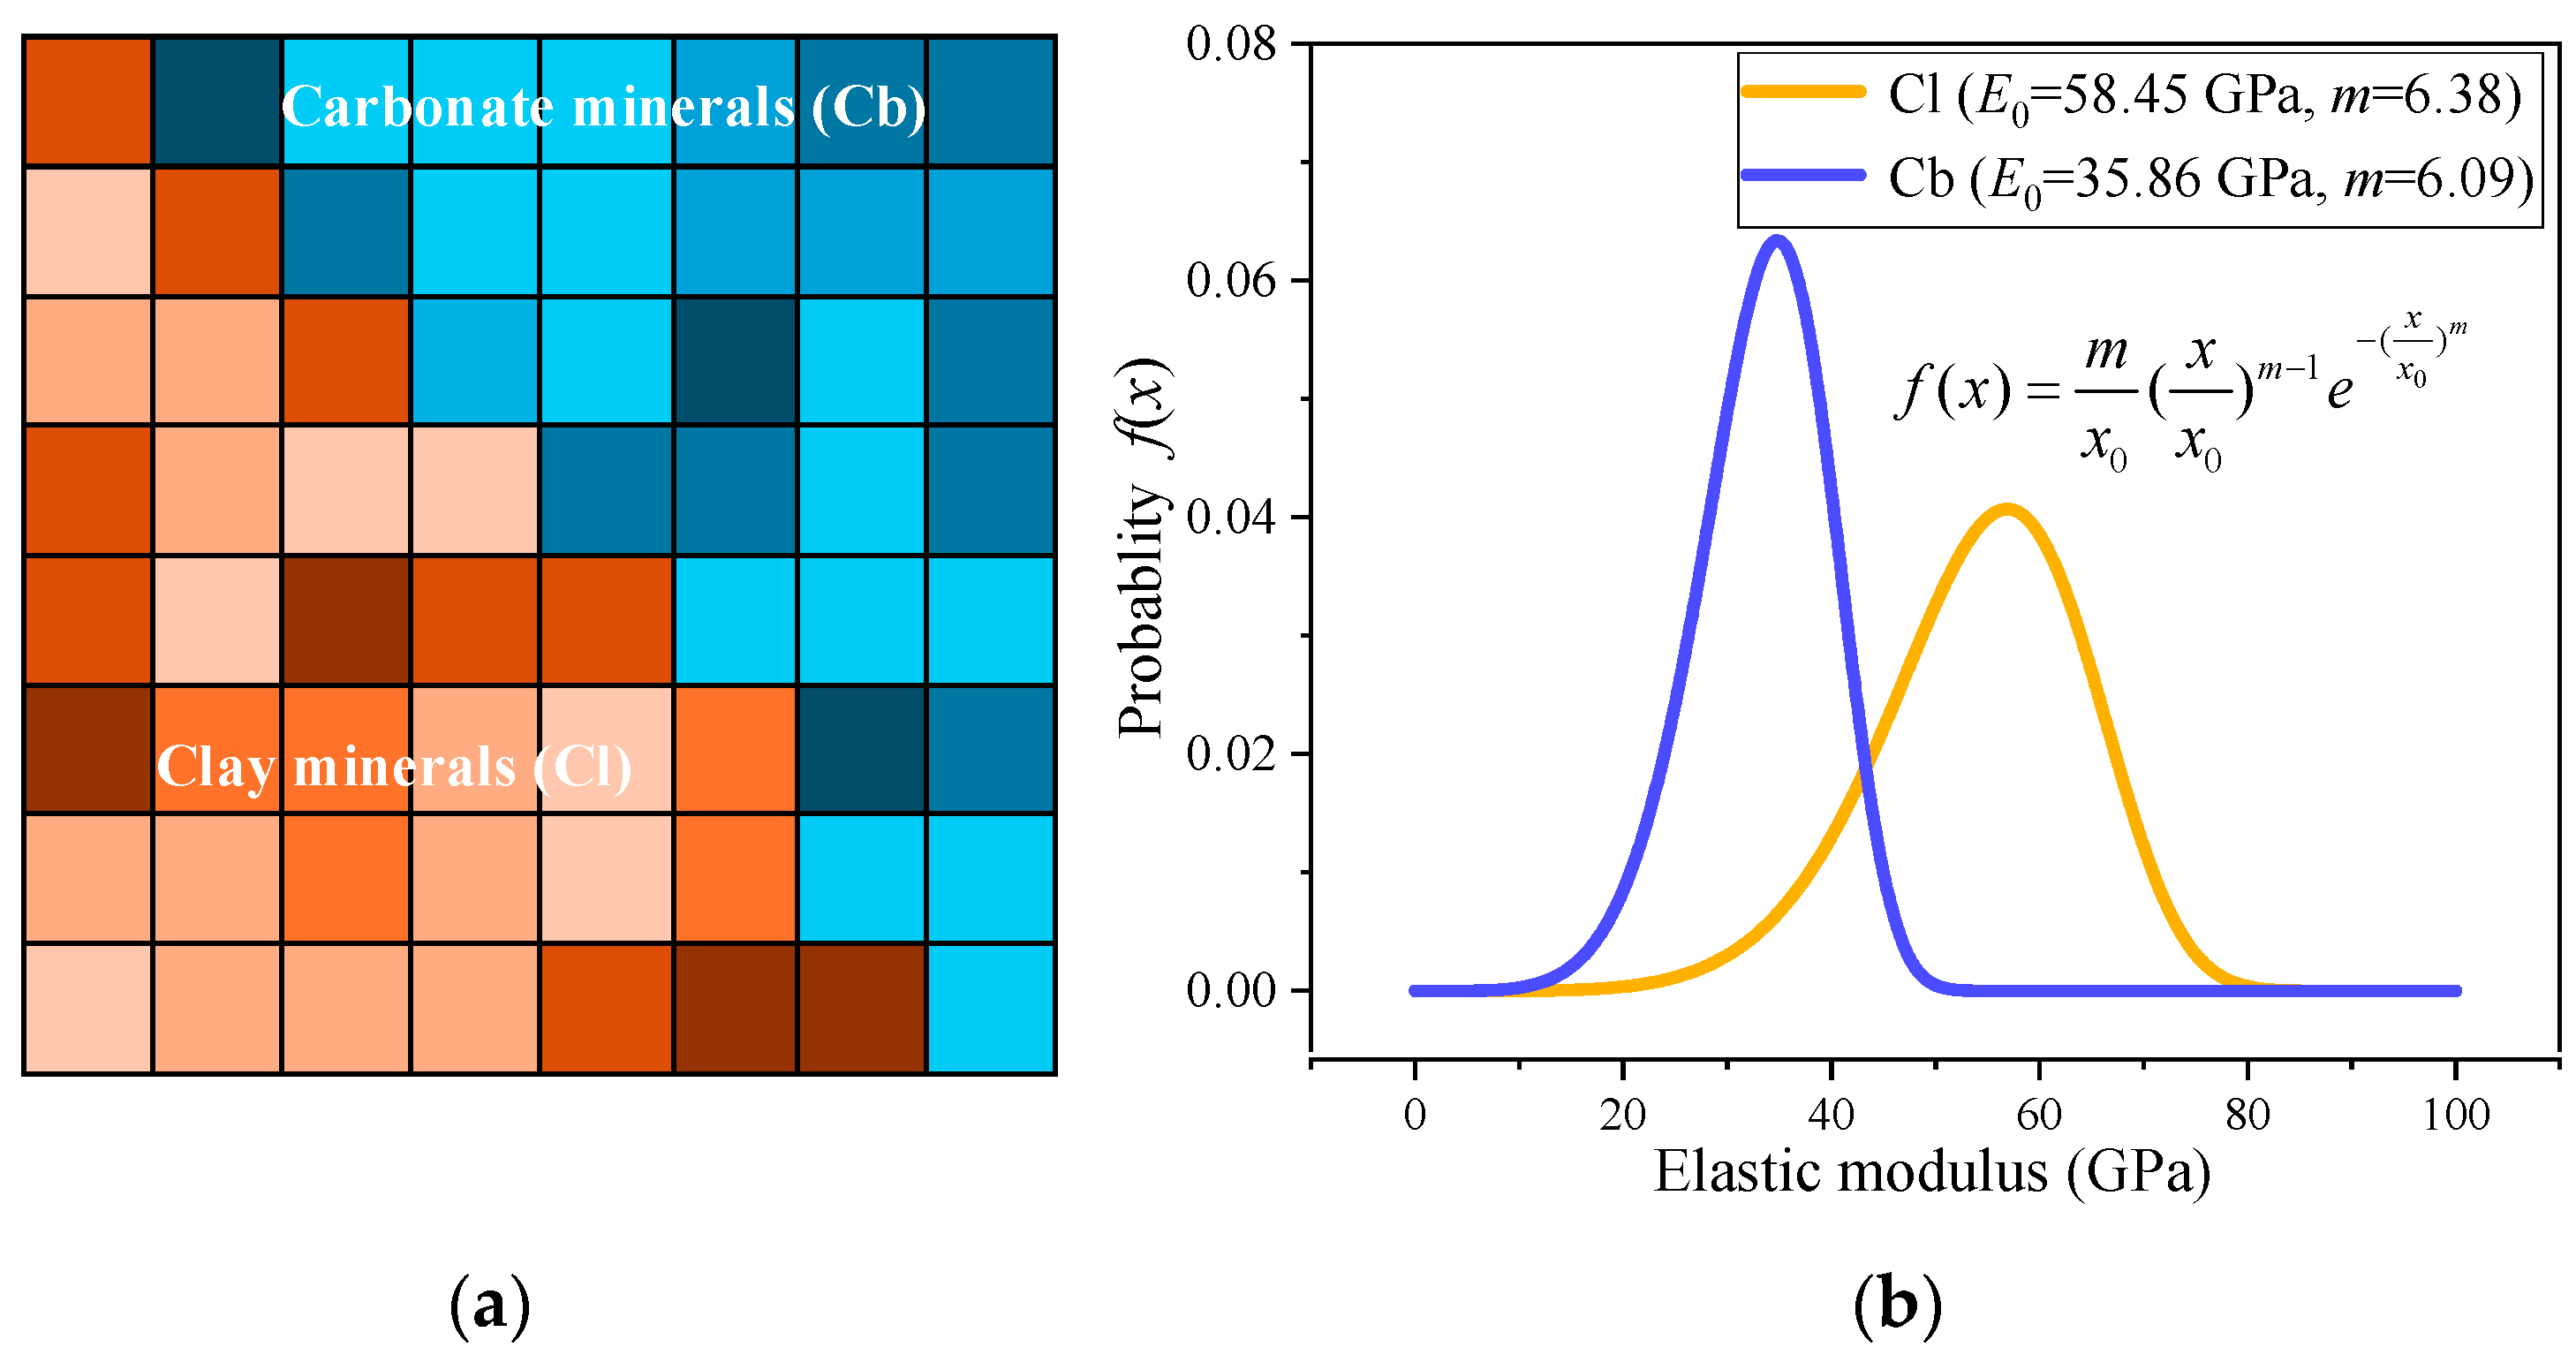
As shown in Figure 4, the spatial and statistical heterogeneity of each mineral component was incorporated into the numerical model. Each mineral phase was assigned mechanical properties based on its experimentally measured probability distribution. Figure 4a illustrates a color-coded mineral map, where different shades within the same color family represent intra-phase mechanical variability. For example, carbonate minerals (Cb) exhibit a lower elastic modulus (E0 = 35.86 GPa) and greater variability (m = 6.09), whereas clay minerals (Cl) have a higher modulus (E0 = 58.45 GPa) and slightly more uniform behavior (m = 6.38). These distributions were statistically characterized by fitting Weibull probability density functions (Figure 4b) and used to generate element-wise property assignments in the simulation. This approach enables faithful representation of both mineral-specific mechanical behavior and microscale heterogeneity within the model domain.

3. Generation of Shale Models

3.1. Models with Different Brittleness Indexes

Mineralogical composition is a major contributor to shale heterogeneity and a key indicator of its fracturability, reflecting the potential to initiate and propagate fractures. Shale with a higher content of brittle minerals such as quartz, carbonates, and feldspar and lower content of ductile minerals such as clay exhibits greater brittleness and more favorable fracture propagation behavior [9,69].
In this study, the brittleness index (BI) is defined as the total volume fraction of brittle minerals, including quartz, feldspar, and carbonate minerals, within the shale matrix. The BI is calculated by the following equation:
B I = V F s p + V Q t z + V C b V T o t × 100 %
where VQtz, VCb, and VFsp are the respective volume fractions (or area in 2D) of the mineral phases and VTot is the total volume (or area) of all mineral components in the rock. This definition is widely accepted in the literature and provides a physically grounded means to quantify shale brittleness [70,71].
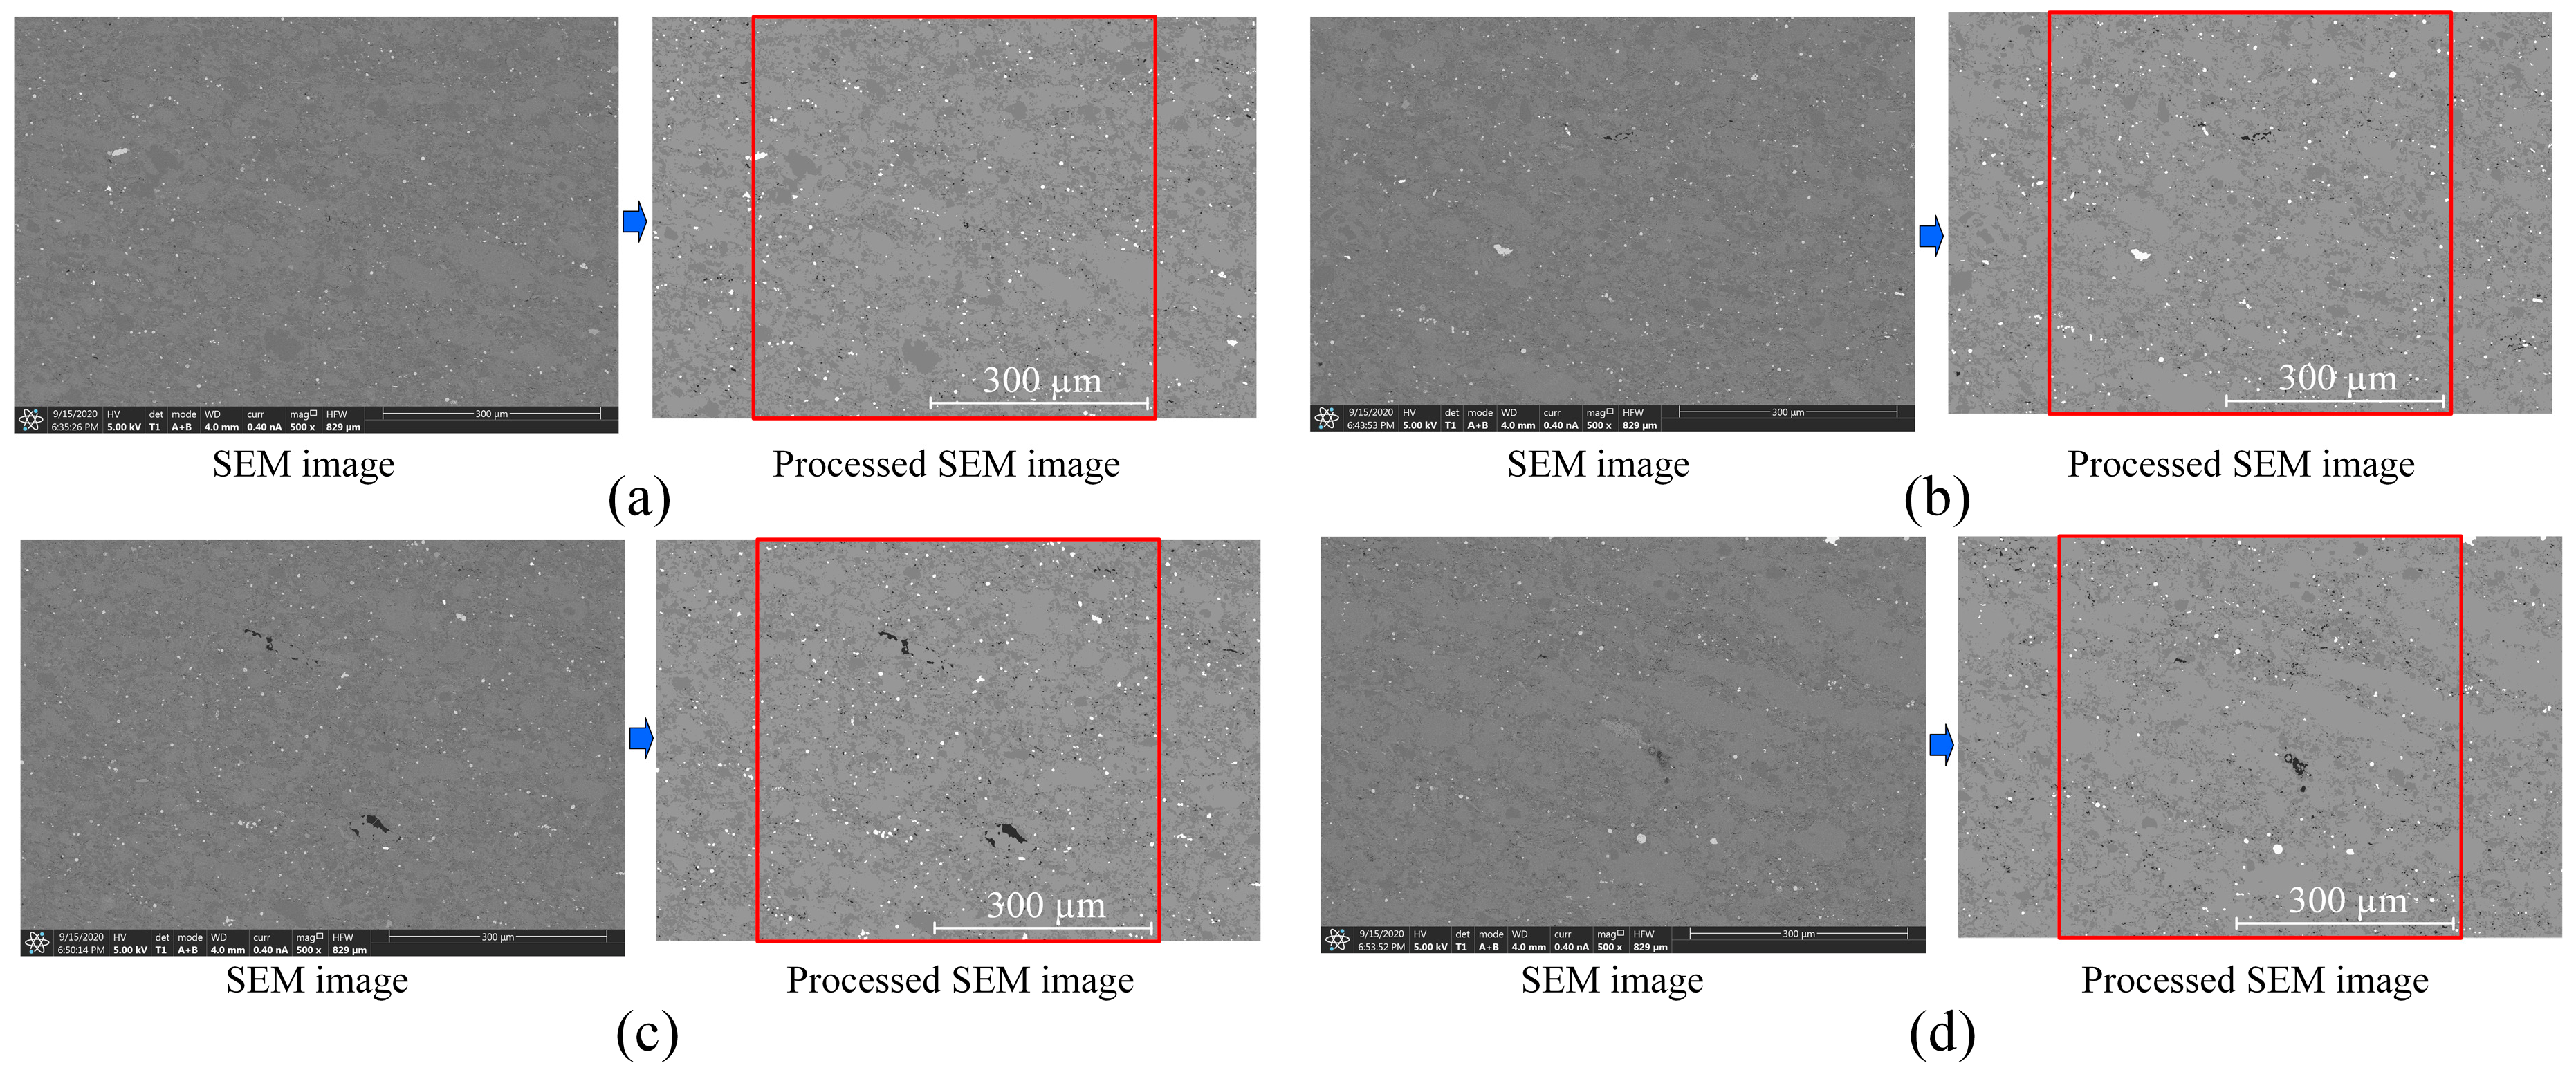
To ensure geological representativeness, BI values were calculated directly from the mineral phase distributions extracted from high-resolution SEM images. Based on this, four digital core models were constructed with BI values of 64.94%, 65.77%, 70.25%, and 73.61%. The selected BI range reflects realistic geological variation and provides a solid foundation for simulating the effect of mineralogical brittleness on hydraulic fracture propagation behavior.
To ensure the reliability of the digital models, the segmentation accuracy of the SEM image-based mineral classification was validated. Grayscale thresholds were calibrated using energy-dispersive spectroscopy (EDS) and QEMSCAN data obtained from the same shale samples. Representative regions of interest (ROIs) were selected and cross-compared between the segmented images and the corresponding EDS mineral maps. The phase boundaries, mineral proportions, and textural patterns showed strong consistency, confirming that the grayscale-based segmentation accurately represents the true mineralogical features. This validation ensures that the digital rock models faithfully preserve spatial heterogeneity and material realism required for accurate simulation. Figure 5 shows the original and processed SEM images of shale samples with different BI values. Mineral volume fractions and corresponding fractal dimensions were calculated from the segmented images, including organic matter, clay, carbonate, and silicate phases (Table 2).
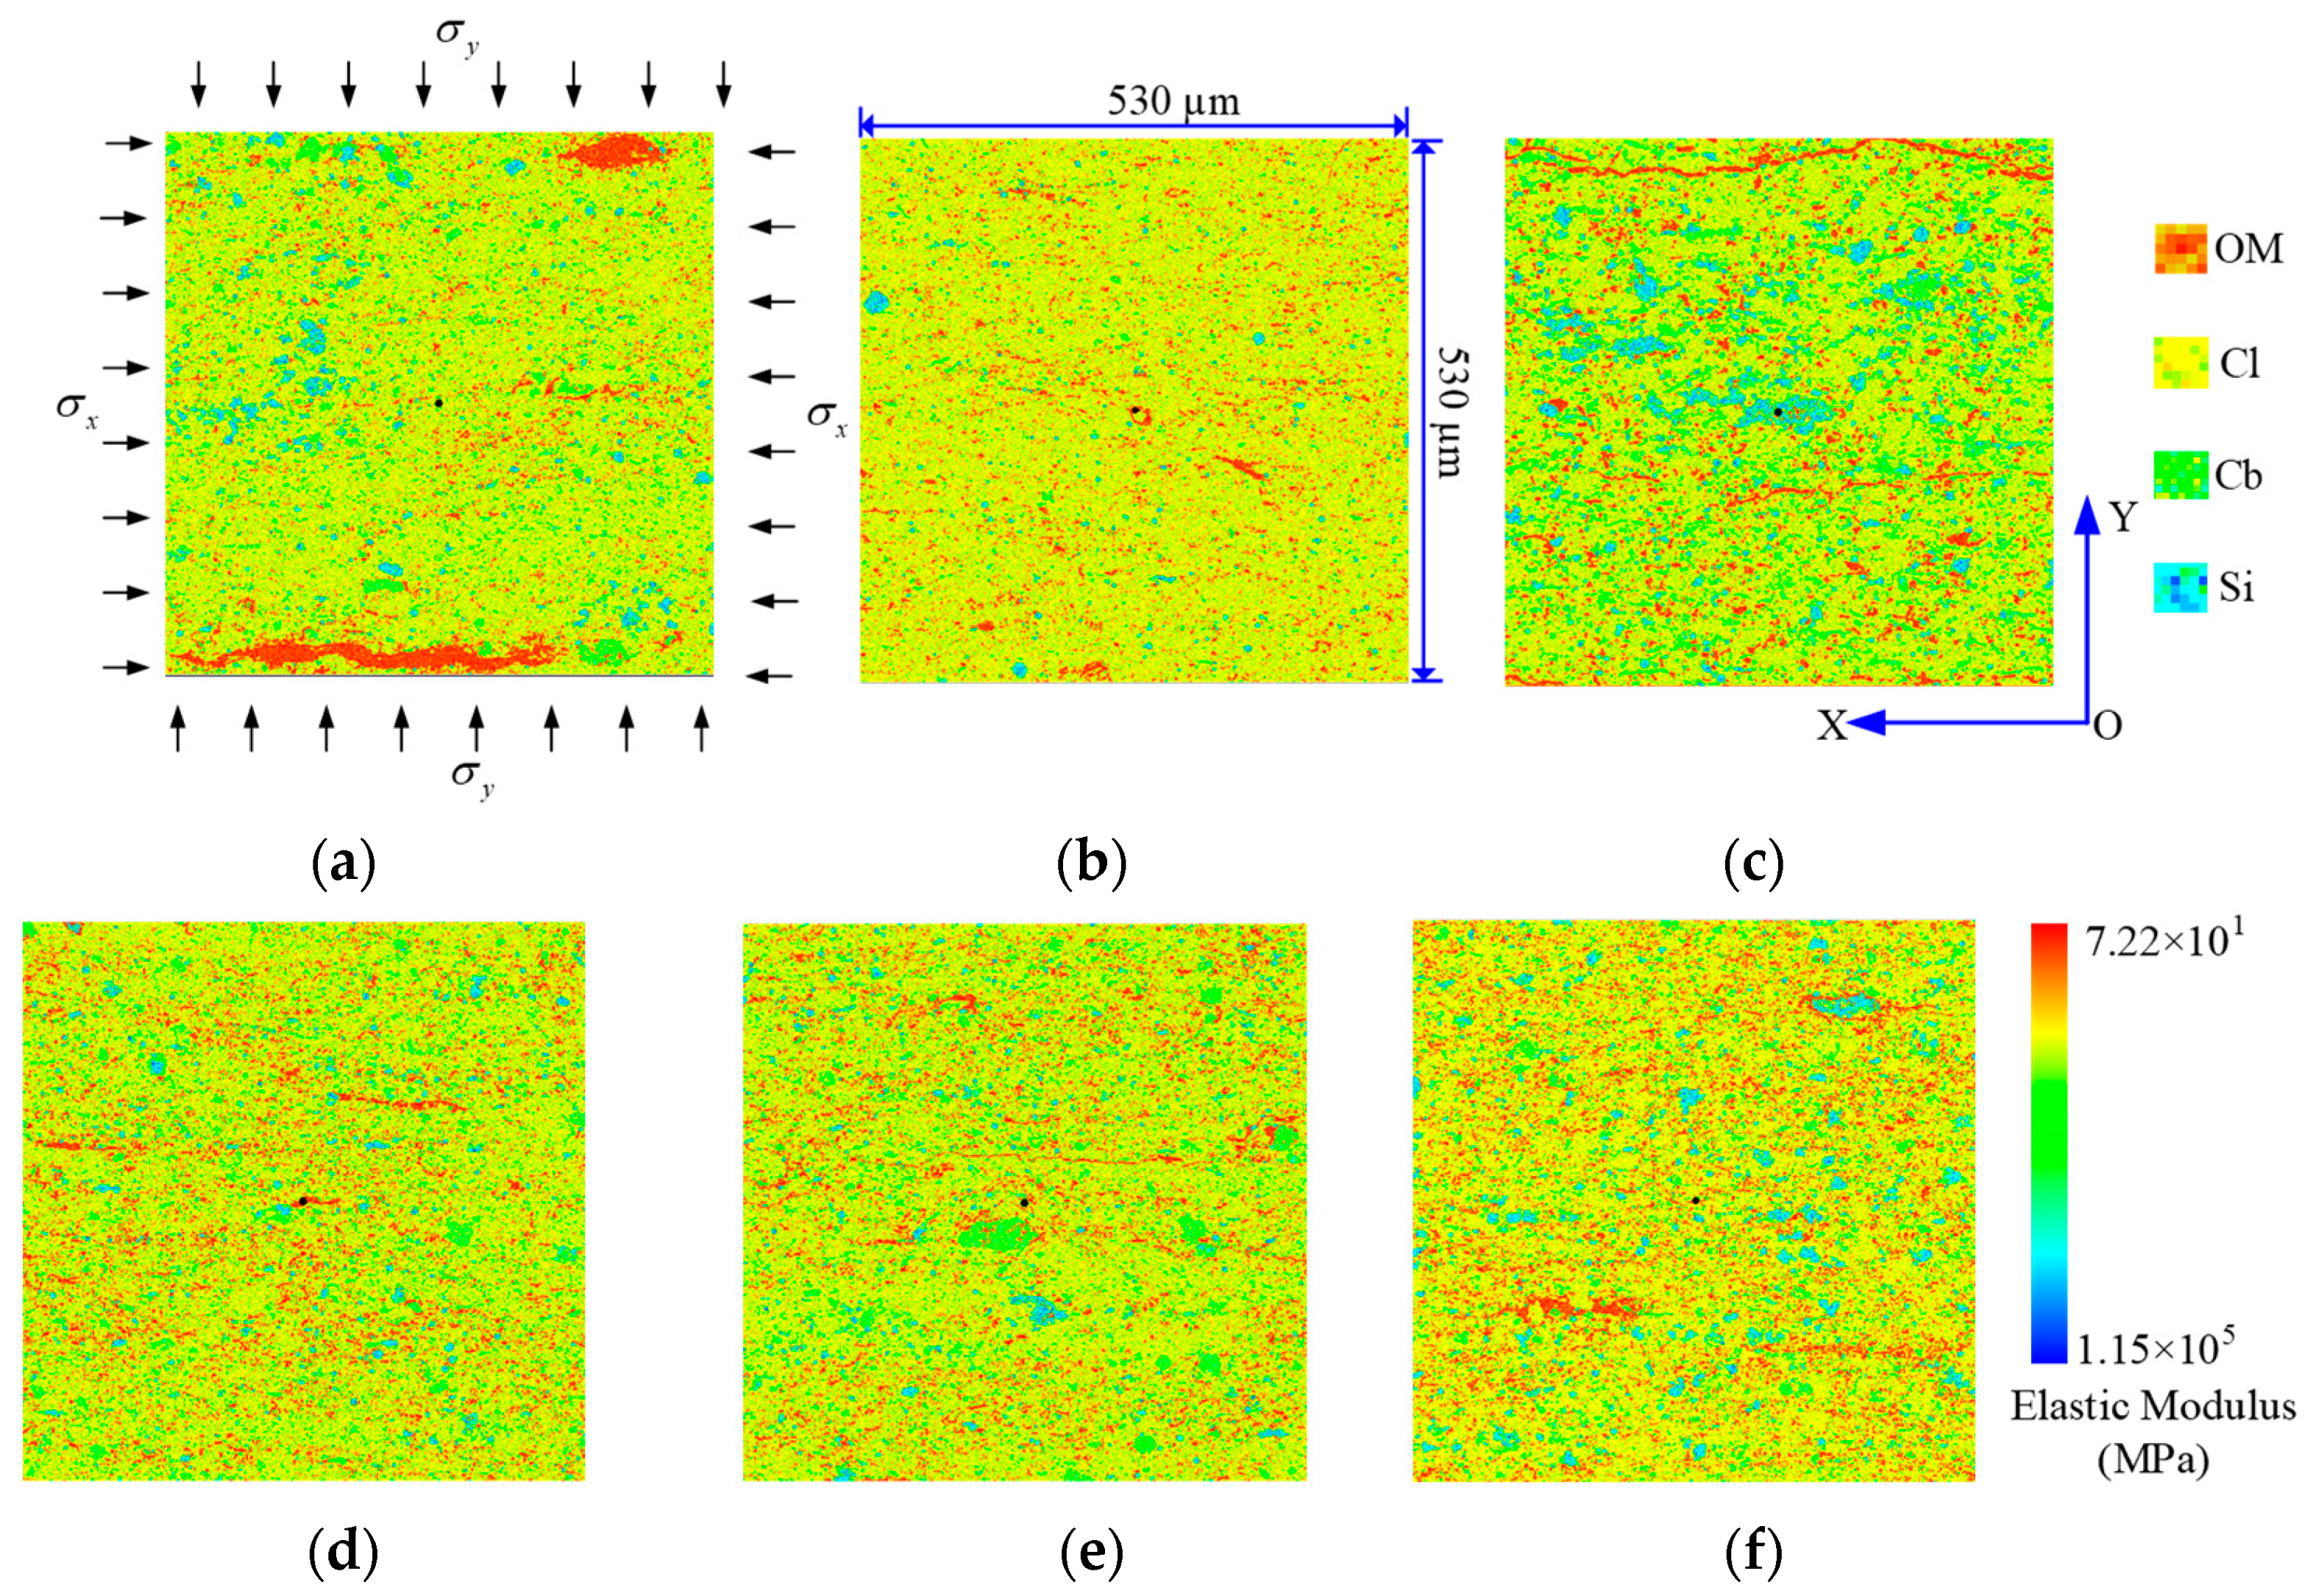
As shown in Figure 6, each simulation domain was defined as 530 μm × 530 μm and discretized into 509 × 509 finite elements. A circular injection point with a diameter of 13.25 μm was placed at the geometric center to simulate fluid injection. Boundary stresses of 48 MPa in the Y-direction and 46 MPa in the X-direction were applied, consistent with well-logging data. Water was used as the fracturing fluid, with a dynamic viscosity of 0.001 Pa·s and an injection rate of 0.012 m3/s.

3.2. Models with Different Natural Fracture Densities

Numerical models were developed containing natural organic fractures based on SEM images of shale samples. The natural fracture density (NFD) in this study is quantified by the volume fraction of natural organic fractures observed in SEM images. It is calculated using
N F D = V F r / V T o t × 100 %
where VFr represents the volume (or area in 2D) of pre-existing natural fractures within the model domain. Organic matter volume is used as a proxy for fracture density based on image segmentation results.
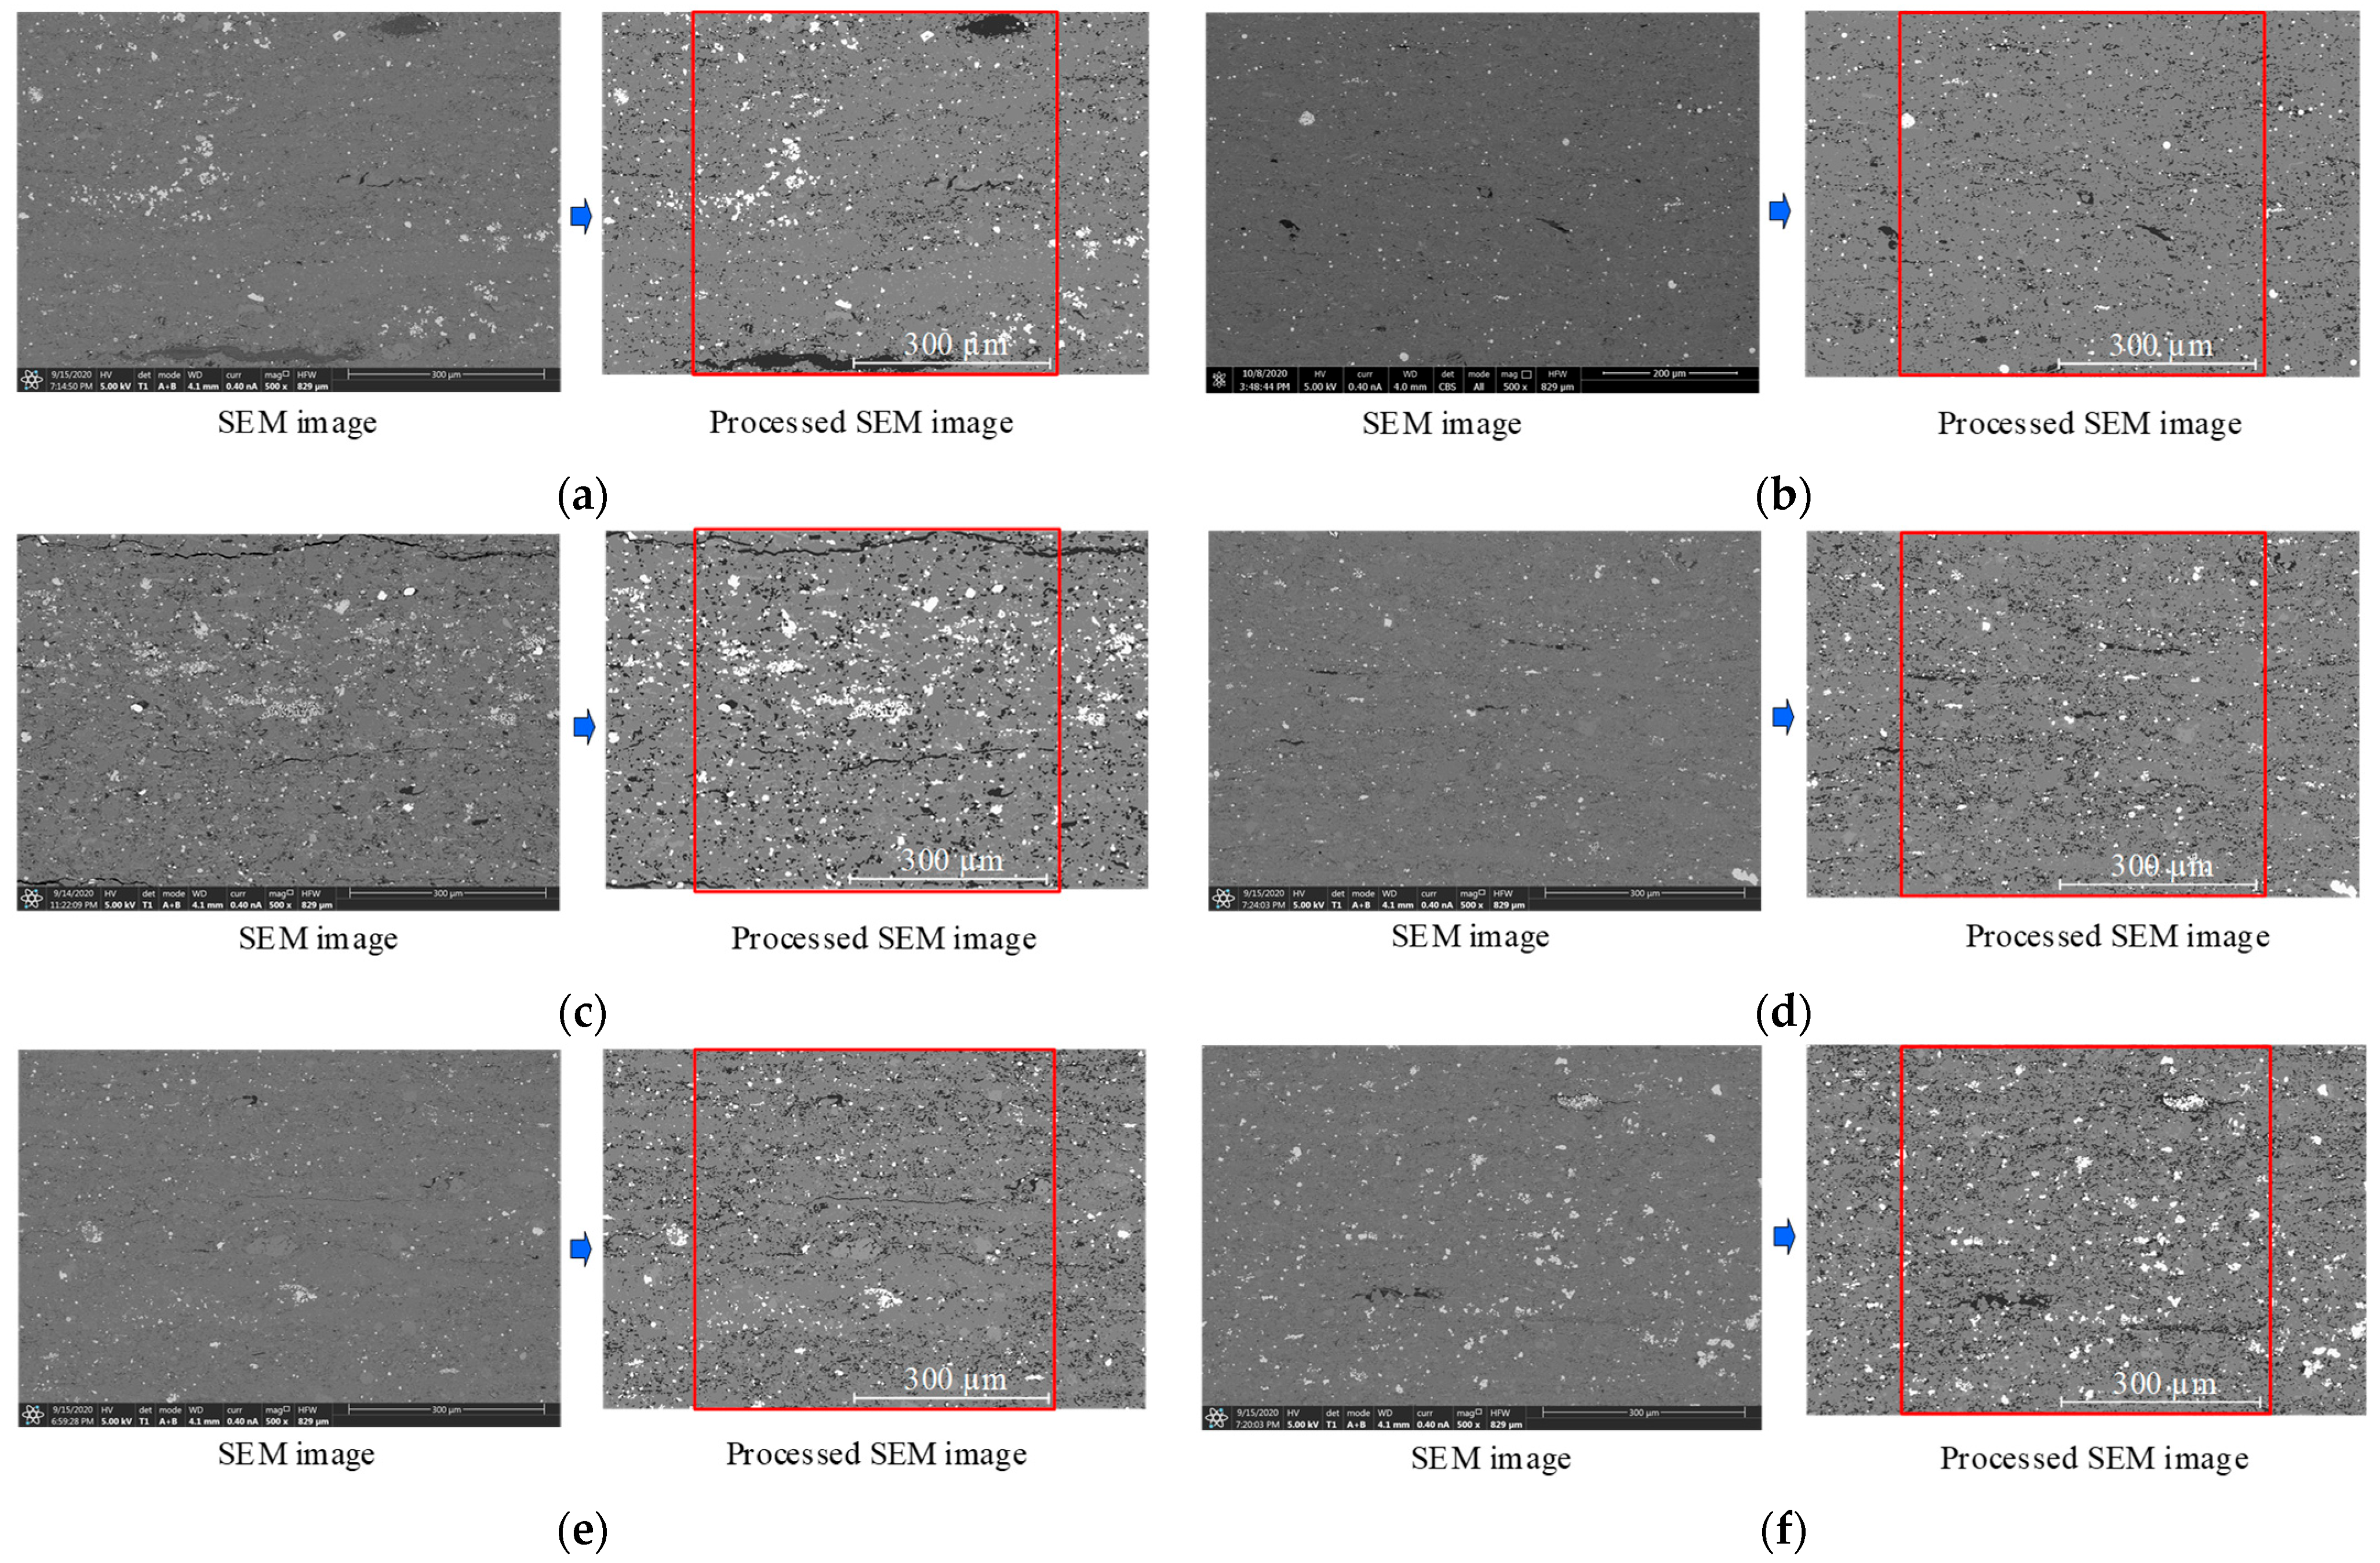
Figure 7 shows the original and processed images of six shale samples with varying NFD values. Volume fractions and fractal dimensions of organic matter, clay, carbonate, and silicate minerals were derived through image analysis and are listed in Table 3. Organic matter content was used as a quantitative indicator of natural fracture density. The selected models (NFD1–NFD6) exhibit natural fracture densities ranging from 7.97% to 17.79%, with corresponding fractal dimensions between 1.55 and 1.71.
Square regions marked in red boxes were extracted from each image to construct numerical models with varying NFD values (Figure 8). The model size, element discretization, and injection hole diameter remained the same as in the brittleness models. Mineral distributions were directly mapped from the images, and microscale mechanical heterogeneity was assigned based on element type. To isolate the effects of natural fracture density on fracturing response, all other model parameters, including fluid properties, mineral mechanical properties, and boundary conditions, were kept consistent with those in the BI models.

4. Results and Analysis

4.1. Effects of BI on Fracture Propagation Characteristics

4.1.1. Fracture Geometry Analysis Under Different BI Values

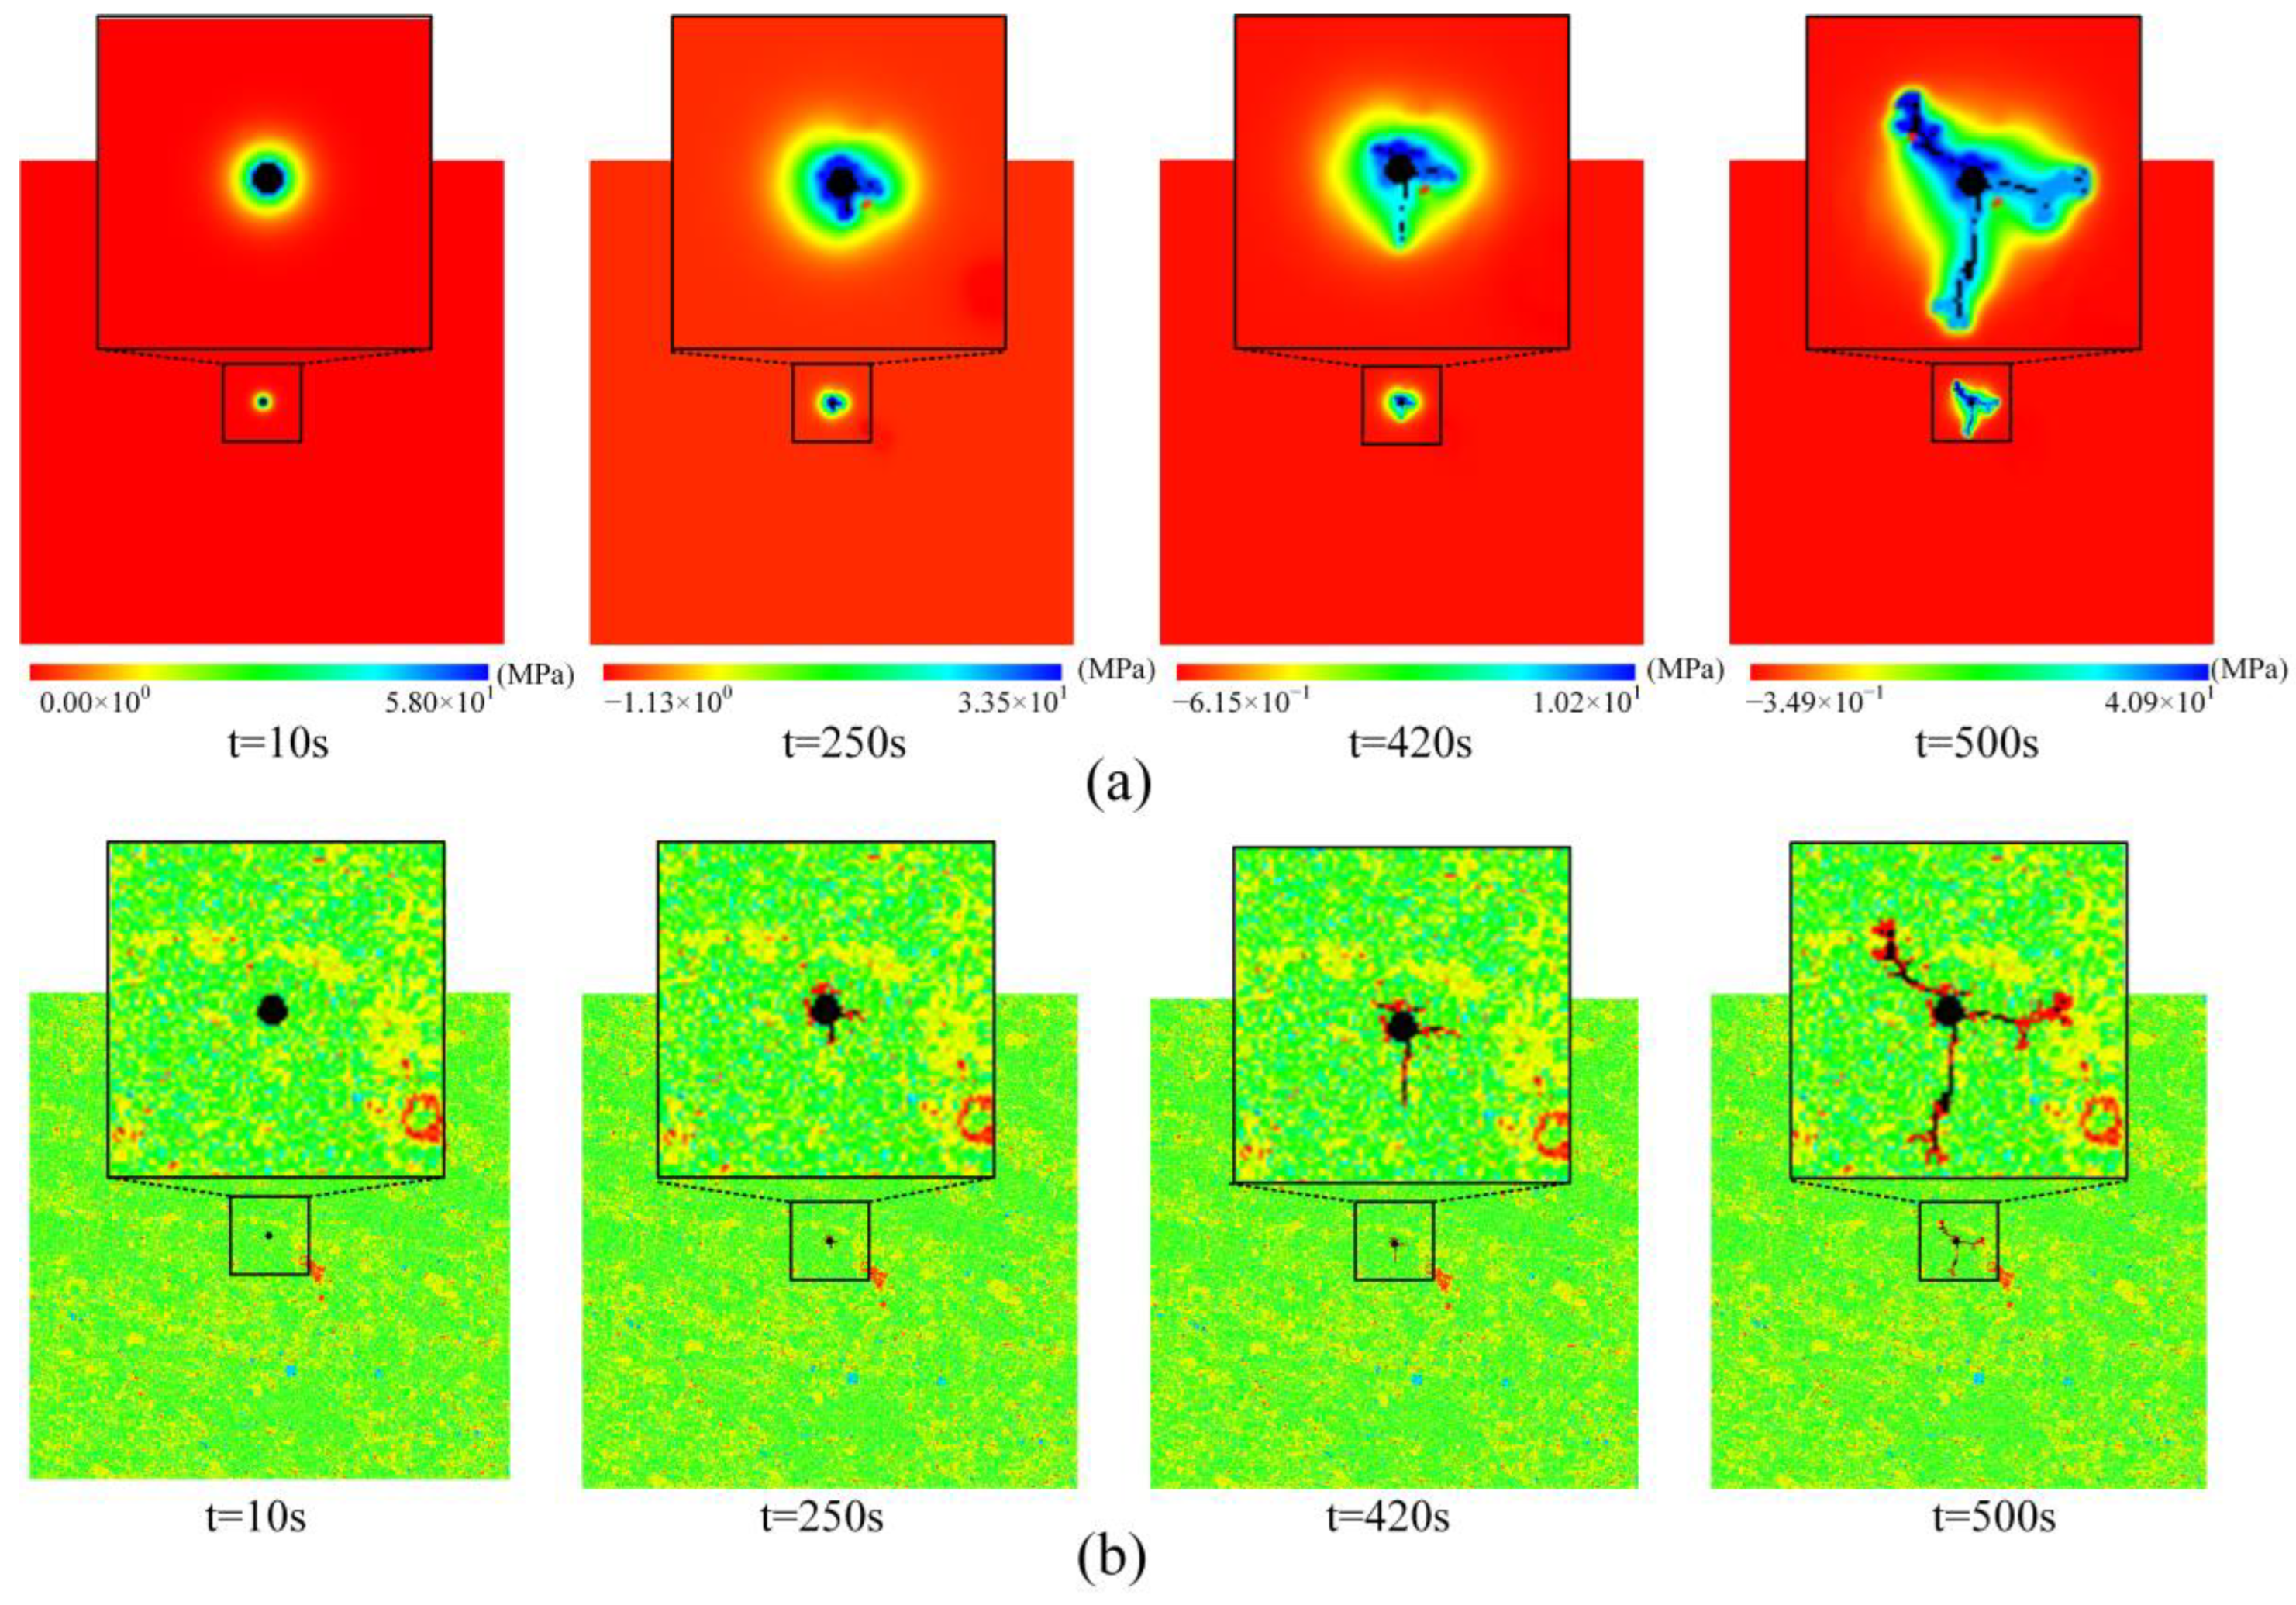
Figure 9 presents the fracture propagation process based on model BI4 with the highest brittleness index. At t = 10 s, pore pressure is low and evenly distributed around the injection point, with no sign of fracturing. As fluid injection continues, pore pressure rises. By t = 250 s, fractures begin to form below and to the right of the injection hole, indicating fracture initiation. At t = 420 s, a new fracture path appears above the injection hole, indicating multidirectional propagation. By t = 500 s, fractures extend in three directions, distributed symmetrically with roughly 120° between them, suggesting that the local stress field primarily governs the early-stage propagation. At t = 640 s, the upper-left fracture deviates and reorients along the Y-axis, corresponding to the direction of maximum principal stress. All three fracture tips show bifurcation, increasing the overall complexity of the network. By t = 1000 s, the fractures continue to grow along the branching paths, forming a multi-branch network. At t = 1250 s, continued fluid injection drives further propagation. However, the lower-right fracture becomes deflected toward the organic-rich zone and eventually terminates, showing that organic matter may hinder fracture growth. By t = 2450 s, fractures in all other directions continue to propagate, confirming that mineral distribution plays a key role in controlling hydraulic fracture behavior. In general, zones rich in brittle minerals promote rapid and stable fracture extension, while ductile zones, such as those rich in organic matter, tend to cause deviation, slow growth, or termination, thereby altering the fracture network geometry.
Figure 10 presents the hydraulic fracture morphology and pore pressure distribution under different BI values, where blue and green regions represent brittle minerals, and black lines indicate the fracture paths. As the volume fraction of brittle minerals increases, fracture patterns evolve from simple to complex. In BI1 and BI2, fractures are primarily linear, with limited branching and shorter lengths, following the direction of principal stress. In BI1, the lower-right fracture terminates early due to insufficient brittle mineral support, resulting in two slightly asymmetric main fractures. In BI3, branching becomes more pronounced, with increased propagation directions and overall length. In BI4, three main fractures form early, followed by the emergence of secondary branches in multiple directions, eventually developing into a highly complex fracture network that enhances reservoir stimulation. These results indicate that in low-BI shale, fracture propagation is dominated by in situ stress and remains linear. As the BI increases, brittle minerals exert greater control, promoting deflection, branching, and intersection, thereby forming more intricate networks. High-BI shale is, therefore, more favorable to achieving effective stimulation and enhanced conductivity.
To quantitatively evaluate the effectiveness of hydraulic fracturing stimulation, three characterization parameters are introduced in this study: stimulated reservoir area (SRA), hydraulic fracture ratio, and the fractal dimension of hydraulic fractures. Using model BI1 as an example, the definitions of these parameters are illustrated, as shown in Figure 11. In Figure 11a, the SRA is defined as the blue region enclosed by the dashed boundary, representing the area affected by fracturing. The fracture ratio is the area occupied by fractures (black lines) divided by the total model area. For clarity, Figure 11b extracts only the fractures. Fracture complexity is quantified by calculating the fractal dimension using the box-counting method, based on a binarized image, as shown in Figure 11c, where white pixels indicate damaged elements and black pixels represent undamaged regions.
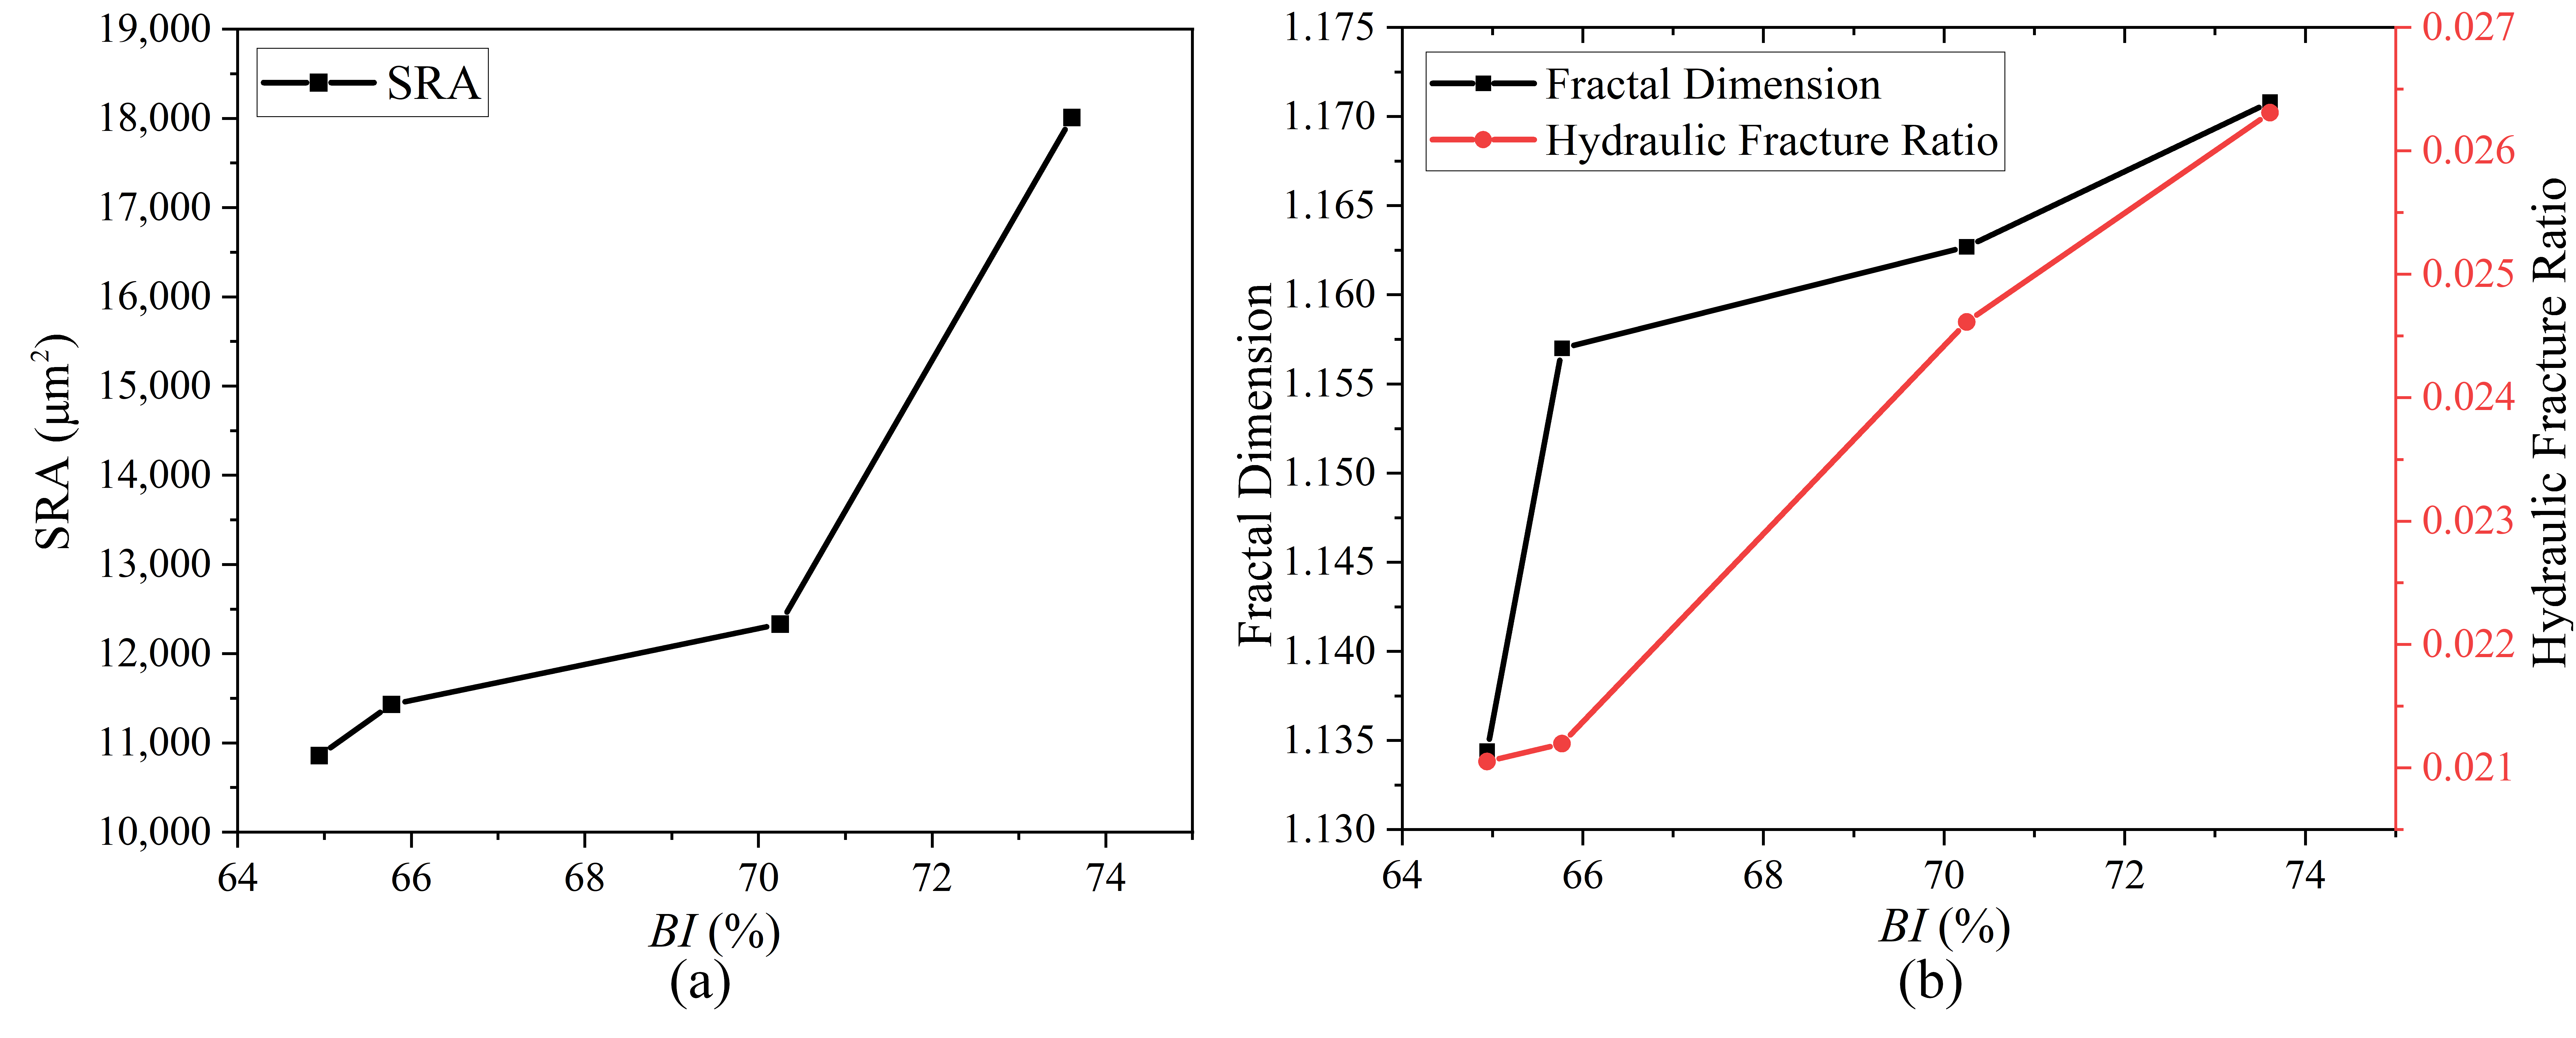
Figure 12 shows the effect of the BI on hydraulic fracture characteristic parameters. In Figure 12a, the SRA increases significantly with the BI. As the BI rises from 0.65 to 0.74, the SRA increases from 10,856.75 µm2 to 18,010.72 µm2, a 65.89% growth, indicating that higher-BI shale is more likely to form well-developed fracture networks and larger stimulated zones. Figure 12b shows that both fractal dimension and fracture ratio also increase with the BI. The fractal dimension increases from 1.134 to 1.171 (up 3.26%), and the fracture ratio increases from 0.0211 to 0.0263 (up 24.64%), reflecting more complex and densely branched networks in high-BI models. Among the three parameters, the SRA shows the highest sensitivity to the BI, followed by fracture ratio and fractal dimension, suggesting that the SRA is the most effective indicator for evaluating the impact of brittleness on fracture performance.

4.1.2. Fracture Effectiveness Index Analysis Under Different BI Values

To evaluate the conductive capacity and connectivity of hydraulic fracture networks, a fracture effectiveness index (FEI) model is proposed. This model accounts for the coupled relationships among fracture conductivity, structural connectivity, and path stability. It serves as a comprehensive metric that integrates both geometric characteristics and fluid transport performance. The model introduces key parameters, including fracture structural complexity, the proportion of conductive dominant fractures, and a penalty factor for path deflection. The general expression is as follows:
F E I = SRA × d × C f 1 + α θ
Here, the fractal dimension d characterizes geometric complexity. The conductivity correction factor Cf is expressed as the ratio of effective fracture length (Leff) to the total fracture length (Ltotal), indicating the contribution of dominant fractures to overall conductivity. The term (1 + α·θ) represents the path disturbance factor, where θ is the path deflection coefficient, reflecting the degree of deviation during fracture propagation caused by stress perturbation, natural fracture interference, or geological heterogeneity. α is the penalty factor for path deflection, typically ranging from 0.5 to 2, and adjusts the negative impact of deviation on fluid transport.
To investigate the influence of rock brittleness on fracture conductivity, both the BI and FEI were normalized. The relationship between them is illustrated in Figure 13. Blue solid dots represent simulated normalized FEI values, and the red line shows the linear fit. The fitting equation is as follows:
F E I = 0.93 B I + 0.008       ( R 2 = 0.96 )
The results indicate a strong linear positive correlation between the normalized brittleness index and the normalized fracture effectiveness index. As the BI* increases, the FEI* rises significantly. This suggests that rocks with higher brittleness tend to initiate, propagate, and interconnect fractures more easily. As a result, they form more stable and continuous fluid flow channels, enhancing the overall conductivity of the hydraulic fracture system. Since both the FEI and BI are normalized using the Min–Max method, the normalized FEI is theoretically expected to be zero when the normalized BI is zero. Therefore, the regression relationship in Figure 13 should approximately pass through the origin (0,0) under standardized conditions, reflecting a linear proportional relationship between the normalized flow capacity and geological parameters.

4.1.3. Fracture Propagation Direction Analysis Under Different BI Values

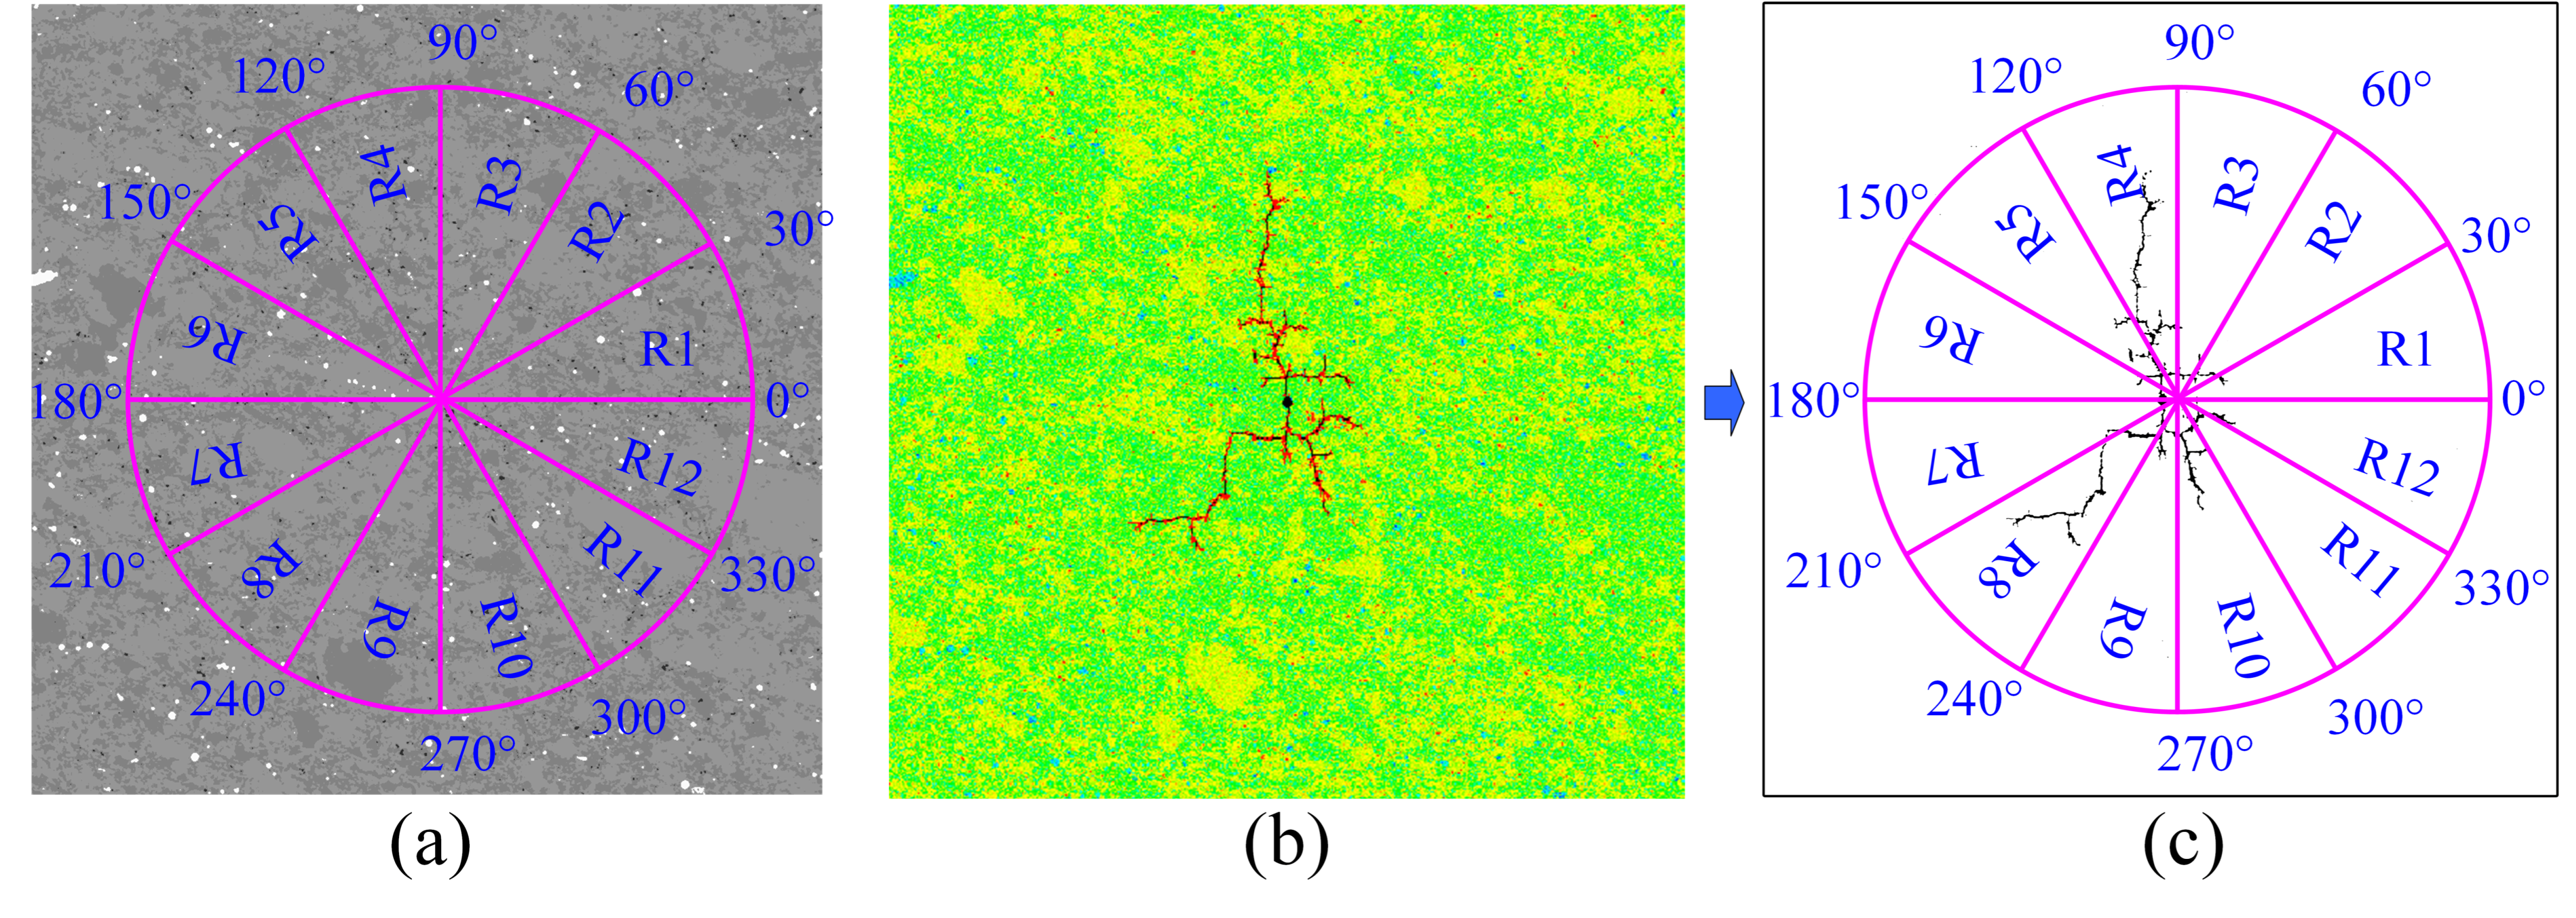
To investigate how the spatial distribution of brittle minerals influences the propagation direction of hydraulic fractures, this study adopts a polar coordinate partitioning method for directional analysis of the fracture network. The study area was divided into 12 equal sectors at 30° intervals (Figure 14). Two key parameters are statistically analyzed within each sector: the BI representing the enrichment of brittle minerals in that sector, and the hydraulic fracture length (HFL), extracted from the simulated fracture network.
Figure 15 illustrates the directional relationships between brittleness and fracture length under four different average brittleness conditions (BI1–BI4). In each plot, blue bars indicate the normalized brittleness index, and red bars show the normalized hydraulic fracture length. Normalization eliminates dimensional differences and enhances comparability, allowing for the evaluation of the control exerted by brittleness distribution on fracture orientation. In the low-brittleness model (BI1), fracture length strongly correlates with brittleness distribution. Both parameters peak at 90° and decrease at 0° and 270°. Fractures develop almost entirely along directions with high brittleness, indicating that even under low average brittleness, local brittle zones can significantly guide fracture propagation. The influence of stress orientation is weak, and the spatial distribution of brittleness primarily controls fracture patterns. In the low-to-moderate brittleness model (BI2), fractures are concentrated along 0°, 90°, 120°, and 150°. Some directions align with high BI values, such as 120°, while others, such as 240°, show weak fracture development despite high brittleness. At this stage, stress remains the dominant factor, while brittleness plays a secondary regulatory role. Fracture growth at 0°, the minimum principal stress direction, may result from enhanced local brittleness continuity, reflecting a complex coupling between stress and brittleness.
In the moderate-to-high-brittleness model (BI3), fracture propagation is enhanced not only in the principal stress direction (270°) but also at 60° and 180°, indicating joint control by stress and brittleness. High-BI regions such as 180° and 240° partially coincide with fracture-enhanced directions. However, sectors like 240° and 330° show a high BI but low HFL, suggesting that other factors, such as local stress disturbances or shielding effects, may also constrain fracture propagation. The fracture network becomes more multidirectional, with increased complexity and features like deflection and intersection. In the high-brittleness model (BI4), fractures are enhanced not only in the principal stress direction (90°) but also in brittle-rich directions such as 60°, 150°, and 300°. The effect of “brittleness-induced deflection” becomes more pronounced. Local brittleness peaks at 150° and 120° guide fracture propagation, indicating that high-brittleness zones can alter fracture paths. The fracture network exhibits strong multidirectionality and branching, reflecting increased complexity in high-brittleness reservoirs. This promotes fracture volume expansion but also imposes stricter requirements for fracture orientation control.
These results indicate that as the average brittleness index increases, the fracture propagation mechanism evolves from brittleness-dominated to stress–brittleness coupling and eventually to brittleness-induced deflection. Brittleness distribution affects not only the initiation points and path stability of fractures but also dominates the geometry and complexity of the fracture network under high-brittleness conditions.

4.1.4. Mineral Damage Behavior Analysis Under Different BI Values

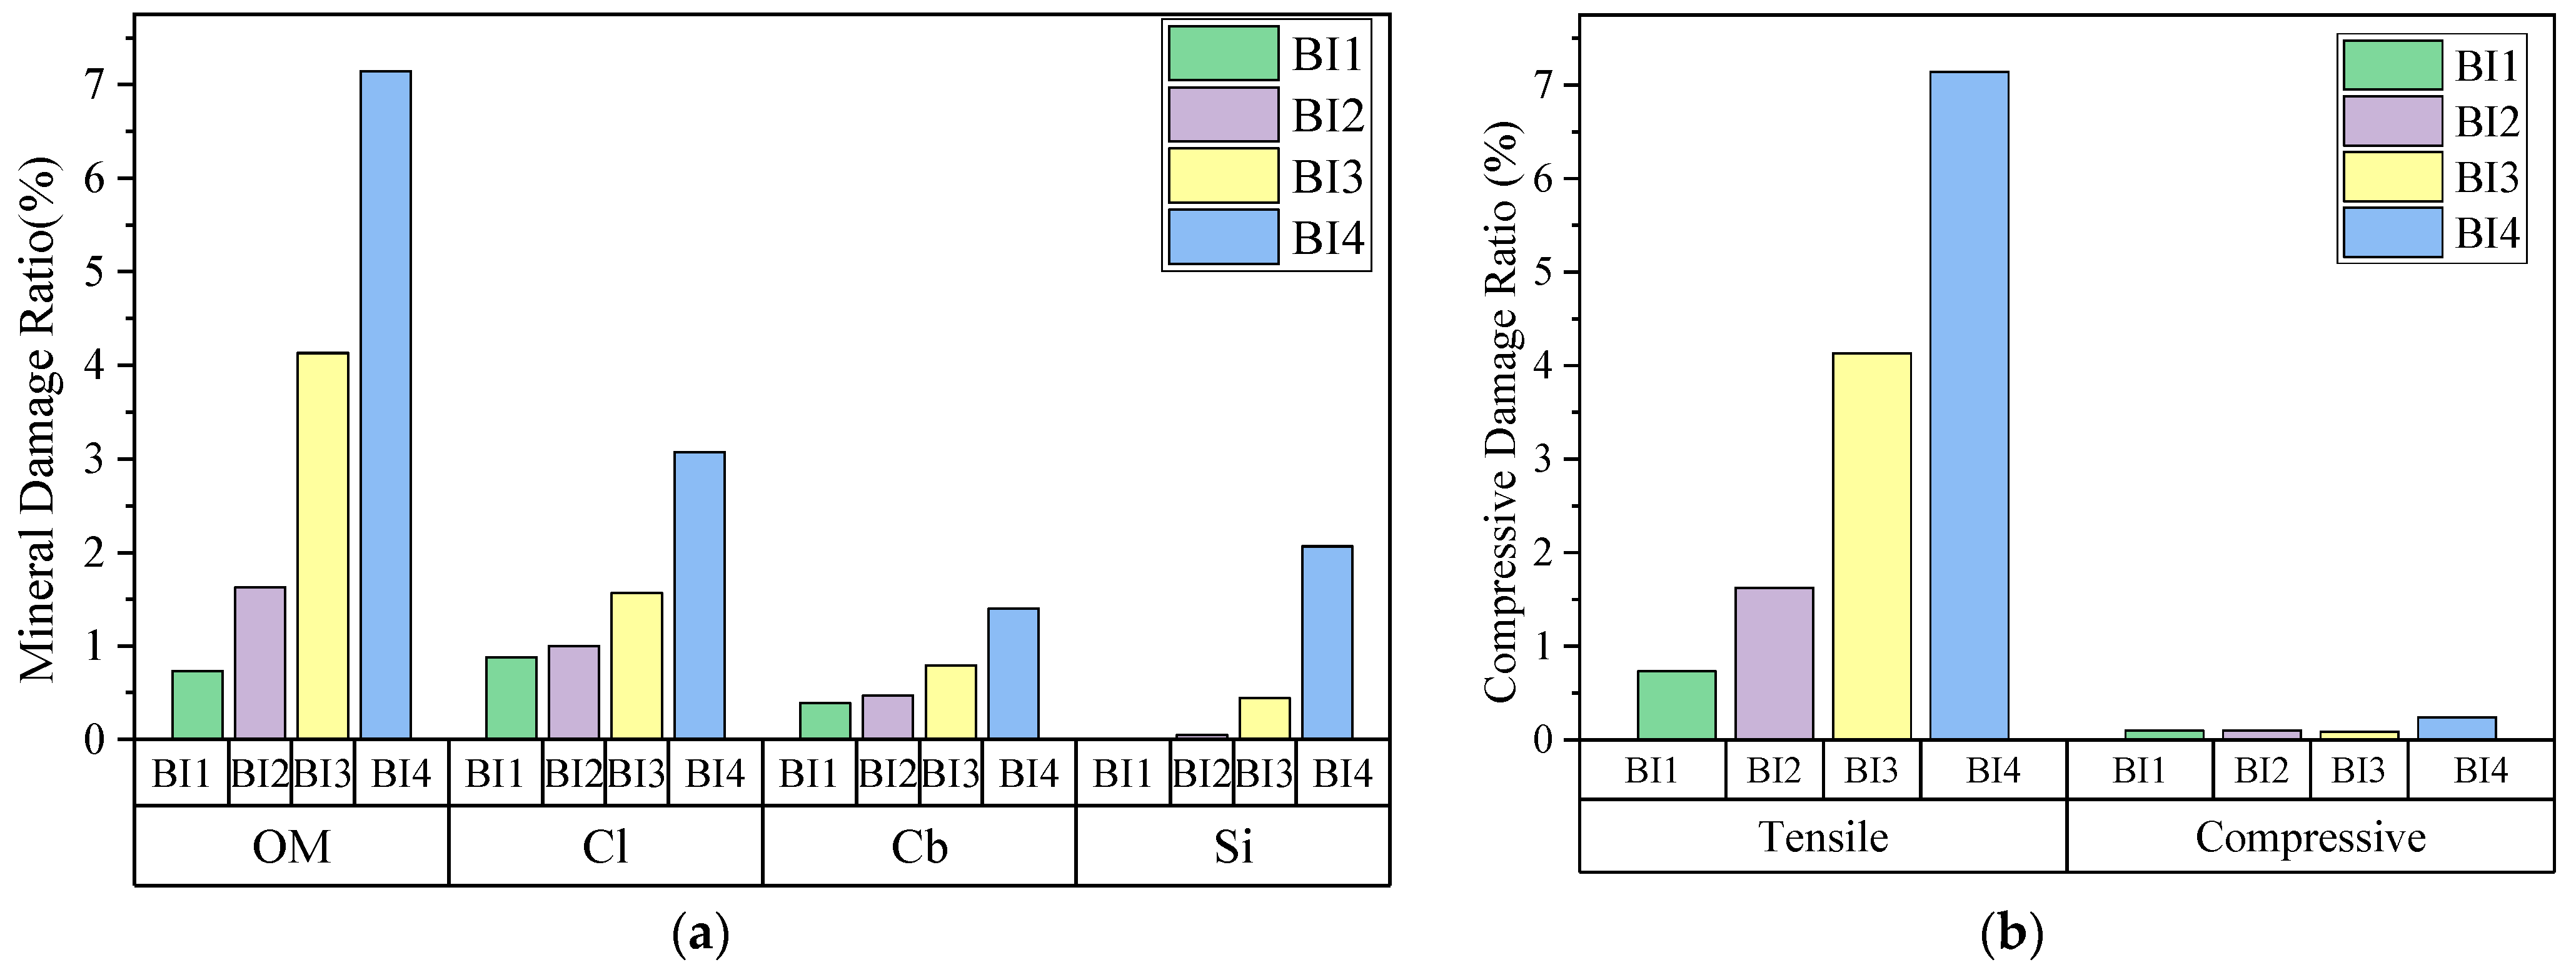
To clarify how the brittleness index regulates mineral failure during hydraulic fracturing, particularly in terms of differential responses under fracturing stress, this study systematically analyzes the damage behavior of four primary mineral components (organic matter (OM), clay minerals (Cl), carbonate minerals (Cb), and silicate minerals (Si)) across four brittleness index models (BI1–BI4). The results are presented in Figure 16.
Figure 16 illustrates the variation in damage ratios of major minerals under different brittleness levels. As the brittleness index increases from BI1 (64.94%) to BI4 (73.61%), all four minerals show a general rise in damage ratios. This indicates that higher brittleness significantly reduces mineral structural stability. Among the minerals, organic matter exhibits the highest damage ratio, reaching approximately 7.2% under BI4, which is significantly higher than that of other minerals and consistently remains the most affected across all brittleness levels. Clay minerals also show an upward trend, with damage rising to 4.1% under BI4. In contrast, carbonate and silicate minerals exhibit relatively low damage, reaching about 1.5% and 2.8%, respectively, with slower growth rates.
These results demonstrate clear differences in mineral sensitivity to increased brittleness. Organic matter is the most vulnerable, followed by clay, while carbonate and silicate minerals exhibit greater structural stability. Quantitative analysis shows that from BI1 to BI4, the damage ratio of organic matter increases by 6.3%, that of clay by 2.3%, that of silicate by 2.0%, and that of carbonate by only 1.0%. Based on brittleness sensitivity, the response ranking is OM > Cl > Si > Cb.
Given that compressive damage is minimal for minerals other than organic matter, Figure 16b focuses on the damage mode distribution of organic matter under varying brittleness levels. The results indicate that tensile failure dominates. The tensile damage ratio increases significantly with brittleness, from 0.7% under BI1 to 7.0% under BI4. In comparison, compressive–shear damage remains low, reaching only about 0.24% under BI4. The ratio of tensile to compressive damage ranges from 7 to 45 across all brittleness levels, confirming that tensile mechanisms play the primary role in organic matter failure. Notably, there is a sharp increase in tensile damage between BI3 and BI4, indicating a critical brittleness threshold at which organic matter becomes structurally unstable and prone to failure.
Notably, increased brittleness significantly amplifies the degree of organic matter damage, with tensile failure being the dominant mechanism. This mechanical response strongly influences fracture propagation and reservoir conductivity. Therefore, in brittleness evaluations, special attention should be given to the mechanical behavior of organic matter to improve predictions of fracturing performance and production potential.

4.2. Effects of NFD on Fracture Propagation Characteristics

4.2.1. Fracture Geometry Analysis Under Varying NFD Values

Under the same hydraulic fracturing conditions, natural fracture density plays a significant role in controlling the propagation paths and geometry of hydraulic fractures. Due to the strong spatial heterogeneity and structural uncertainty of natural fractures in shale reservoirs, variations in fracture density result in complex and diverse fracture evolution behaviors.
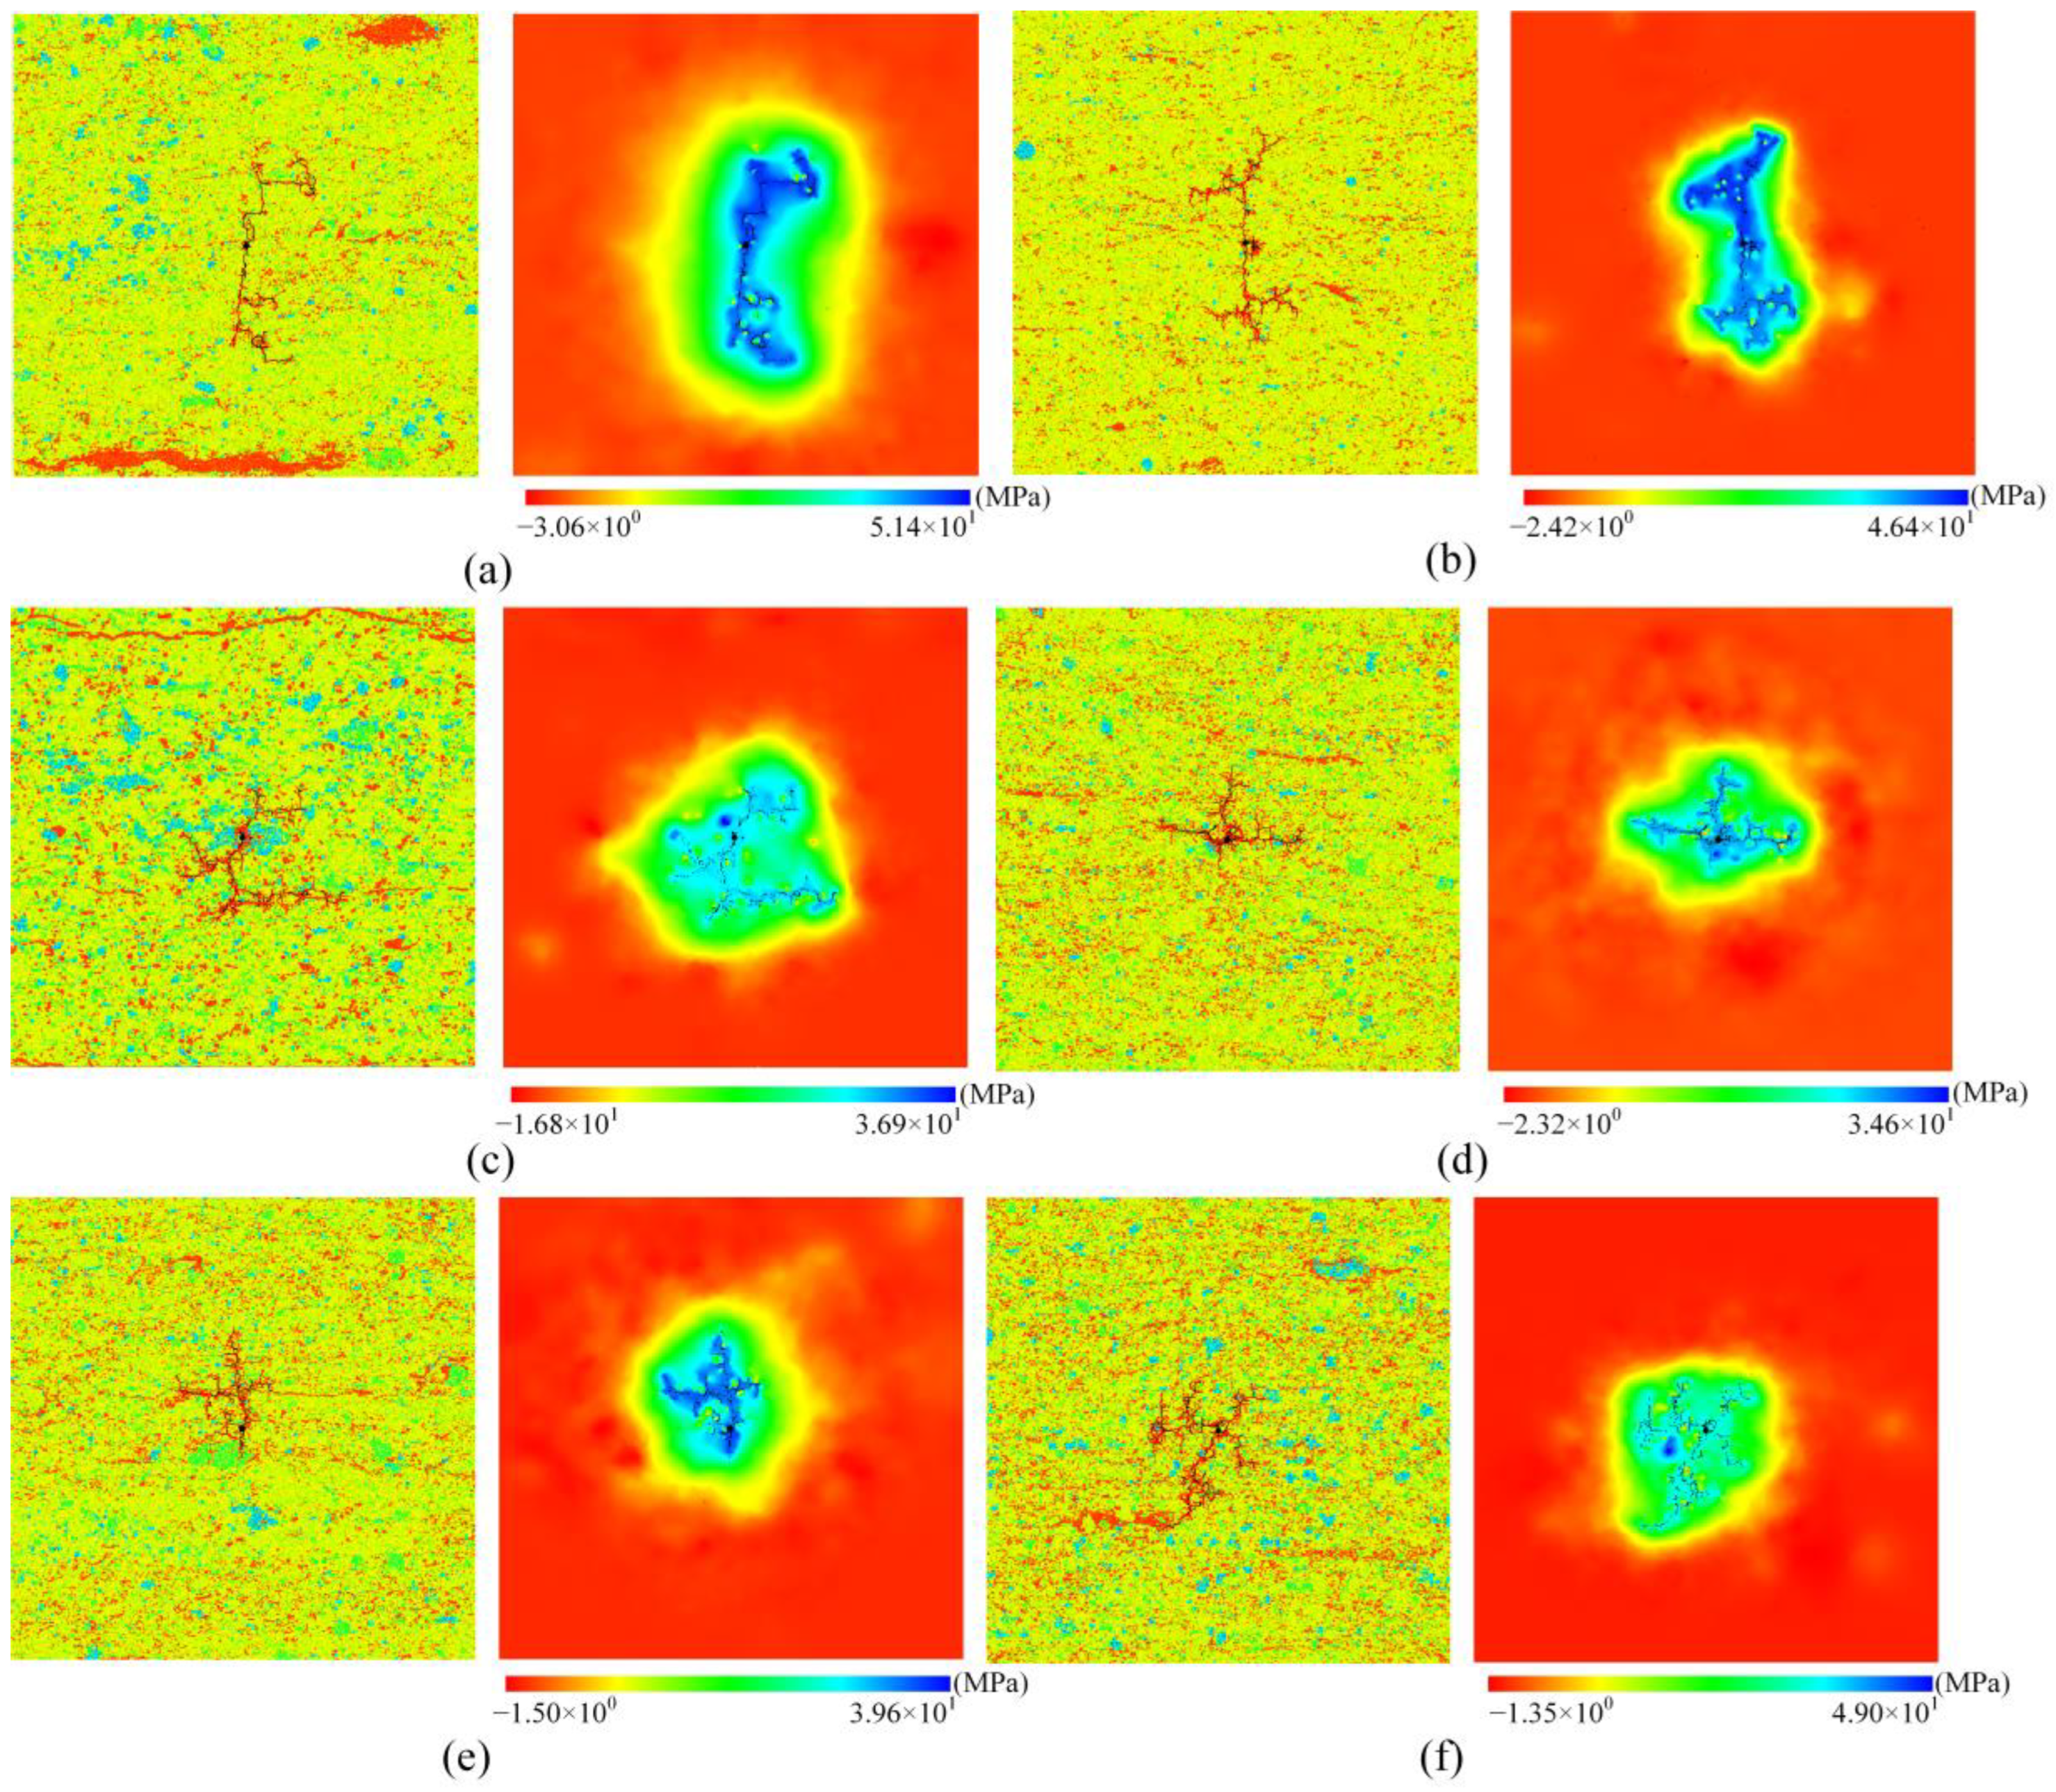
Figure 17 presents the fracture morphologies and corresponding pore pressure distributions in six models with different natural fracture densities (NFD1 to NFD6). At lower fracture densities (e.g., NFD1 and NFD2), hydraulic fractures exhibit regular, linear propagation patterns, primarily aligned with the direction of maximum principal stress. These models feature clear main fracture paths with few branches, and pore pressure is mainly concentrated around the main fracture zone. In contrast, models with higher fracture densities (NFD3 to NFD6) display more complex fracture geometries. Branching increases significantly, and fractures propagate in multiple directions. Main fracture lengths decrease slightly, and some regions develop radial or symmetric fracture networks. These networks have greater spatial complexity, and pore pressure becomes more widely and heterogeneously distributed. This trend can be attributed to two main factors. First, increased fracture density provides more flow paths for the injected fluid, enhancing fluid loss and reducing the driving energy needed for long-distance fracture propagation. This limits the extension of the main fractures. Second, high-density fractures intensify local stress perturbations, making hydraulic fractures more likely to deflect, branch, or change direction at fracture intersections, which promotes the formation of complex multi-branch networks. Specifically, in NFD1 and NFD2, fractures initially propagate along the direction of maximum principal stress, forming distinct main channels. As propagation progresses, some fractures branch at intersections with natural fractures. In NFD3, NFD4, NFD5, and NFD6, dense natural fractures cause more frequent deviations and branching. In NFD4 and NFD6, spiral fracture patterns emerge near the injection zone. These are associated with locally enriched silicate minerals, which enhance fracture deflection and curvature during propagation.
At low natural fracture densities, fracture propagation is primarily stress-controlled, resulting in stable and directional paths. As fracture density increases, propagation becomes more multidirectional, branched, and nonlinear, forming complex networks. Local mineral heterogeneity, such as silicate enrichment, further increases irregularity in fracture patterns. These factors should be carefully considered in reservoir evaluation and fracturing design.
Figure 18 illustrates how the SRA, hydraulic fracture ratio, and fractal dimension vary with natural fracture density. Figure 18a shows that the SRA increases significantly as fracture density rises from 7.97% to 10.03%, growing from 7870.34 µm2 to 9292.24 µm2. This suggests that a moderate density of natural fractures promotes larger fracture networks and improved stimulation. However, when fracture density increases further to 11.13%, the SRA drops sharply to 6161.56 µm2. A slight rebound occurs at 11.36%, and the SRA eventually climbs again to 9092.67 µm2 at 14.79%. This fluctuation suggests that overly dense fracture systems may induce interference, overlap, and branching that restrict effective propagation. Figure 18b further shows changes in the hydraulic fracture ratio and fractal dimension. From 7.97% to 10.03%, the fracture ratio increases from 0.0234 to 0.0264, and the fractal dimension increases from 1.151 to 1.175, indicating enhanced fracture complexity and connectivity. From 10.03% to 11.36%, both metrics decline and then rise again at 14.79% (fracture ratio: 0.0266; fractal dimension: 1.178). This pattern aligns with the SRA fluctuation, confirming the nonlinear influence of fracture density on fracture geometry. These results suggest that natural fracture density affects fracture morphology and parameters in a nonlinear and staged manner. Moderate fracture density is beneficial for stimulation, while excessive density may cause interference, deflection, or premature closure, reducing stimulation efficiency.

4.2.2. Fracture Effectiveness Index Analysis Under Varying NFD Values

To examine the influence of natural fracture density on the FEI, both the FEI and NFD were normalized. As shown in Figure 19, a clear positive correlation is observed between the two parameters. A linear regression was performed, and the resulting equation is given as
F E I = 0.91 N F D + 0.019       ( R 2 = 0.84 )
The results indicate strong goodness of fit, confirming that natural fracture density has a significant positive effect on fracture effectiveness. Higher natural fracture density suggests a greater number of potential pre-existing flow paths within the fracture network. When hydraulic fracturing is applied, the interconnectivity between fractures improves, thereby enhancing the overall conductive capacity of the system. It is worth noting that under moderate-NFD conditions, some data points deviate slightly from the regression line, suggesting minor nonlinear responses. These deviations may be attributed to local variations such as geometric complexity or limited connectivity of natural fractures. However, these local discrepancies do not alter the overall trend of a significant positive correlation between the normalized FEI* and NFD*.

4.2.3. Fracture Propagation Direction Analysis Under Varying NFD Values

Figure 20 presents the normalized comparison of HFL and NFD in polar coordinates across six models with varying NFD levels (NFD1–NFD6). This analysis aims to explore how the spatial distribution of natural fractures influences fracture propagation paths. In low-density model NFD1 (Figure 20a), hydraulic fractures are mainly concentrated in the 270° direction. Notable propagation is also observed at 30° and 240°, which correspond to regions with higher NFD. Although the NFD at 60° is relatively low, longer fractures still appear in this direction, suggesting a strong influence of principal stress. In contrast, little to no propagation occurs in low-NFD sectors such as 150°, 180°, and 300°, indicating a clear barrier effect. Overall, hydraulic fractures tend to initiate and propagate along natural fracture clusters, with their development being jointly governed by stress orientation and natural fracture alignment.
In model NFD2 (Figure 20b), fractures develop significantly along 60° and 270°, which are aligned with or close to the maximum principal stress direction, indicating that stress remains the dominant factor. Some propagation also occurs in high-NFD sectors such as 240° and 300°, suggesting that natural fractures provide secondary guidance along stress-controlled paths. However, sectors like 0° and 330°exhibit minimal fracture development, implying that high density alone may be insufficient to overcome dominant stress control. In medium-density model NFD3 (Figure 20c), fractures mainly appear at 240°, 210°, 270°, and 300°. These directions deviate from the principal stress axis and generally coincide with high-NFD sectors, indicating that natural fractures begin to exert a stronger influence on propagation. Fractures also emerge at 0°, 30°, and 60°, reflecting a shift toward multidirectional propagation and the provision of new pathways by natural fractures.
Model NFD4 (Figure 20d), with moderately high fracture density, shows stronger structural control. Fractures mainly propagate along 0°, 60°, 90°, and 150°, with a significant increase in fracture length at 150°, a high-NFD direction. In contrast, 270° shows reduced fracture development, suggesting that the influence of principal stress is gradually replaced by dense fracture networks. Propagation becomes increasingly dominated by structural features. In NFD5 (Figure 20e), although natural fracture density is high in several directions (0° to 150°), hydraulic fractures still propagate mainly along the principal stress direction (90°). Some development is observed at 60° and 120°, while propagation remains limited in other high-NFD sectors, indicating that stress orientation still dominates, and effective guidance from natural fractures requires favorable connectivity and geometry. In high-density model NFD6 (Figure 20f), fractures predominantly propagate along 240°, despite relatively low NFD in that direction. Additional fractures develop at 180°, 300°, and 30°, where NFD is higher, although these directions do not align with the maximum principal stress. Meanwhile, fracture development along 90° and 270°, the stress-controlled axes, is weaker with shorter lengths. This suggests that the natural fracture network has disrupted and weakened stress-guided propagation. Overall, fracture paths become increasingly structurally guided and progressively controlled by natural fractures. At this stage, propagation is governed by the coupled effects of stress and fracture geometry, reflecting a dual-control mechanism.
These findings indicate that as natural fracture density increases, fracture propagation transitions from stress-dominated to structure-dominated control. Natural fractures significantly enhance their influence on propagation paths. Under medium-to-high-NFD conditions, propagation increasingly deviates from the principal stress axis, demonstrating a “structure-induced deflection” mechanism. This highlights the importance of identifying and leveraging natural fractures in designing fracture orientation strategies.

4.2.4. Mineral Damage Behavior Analysis Under Varying NFD Values

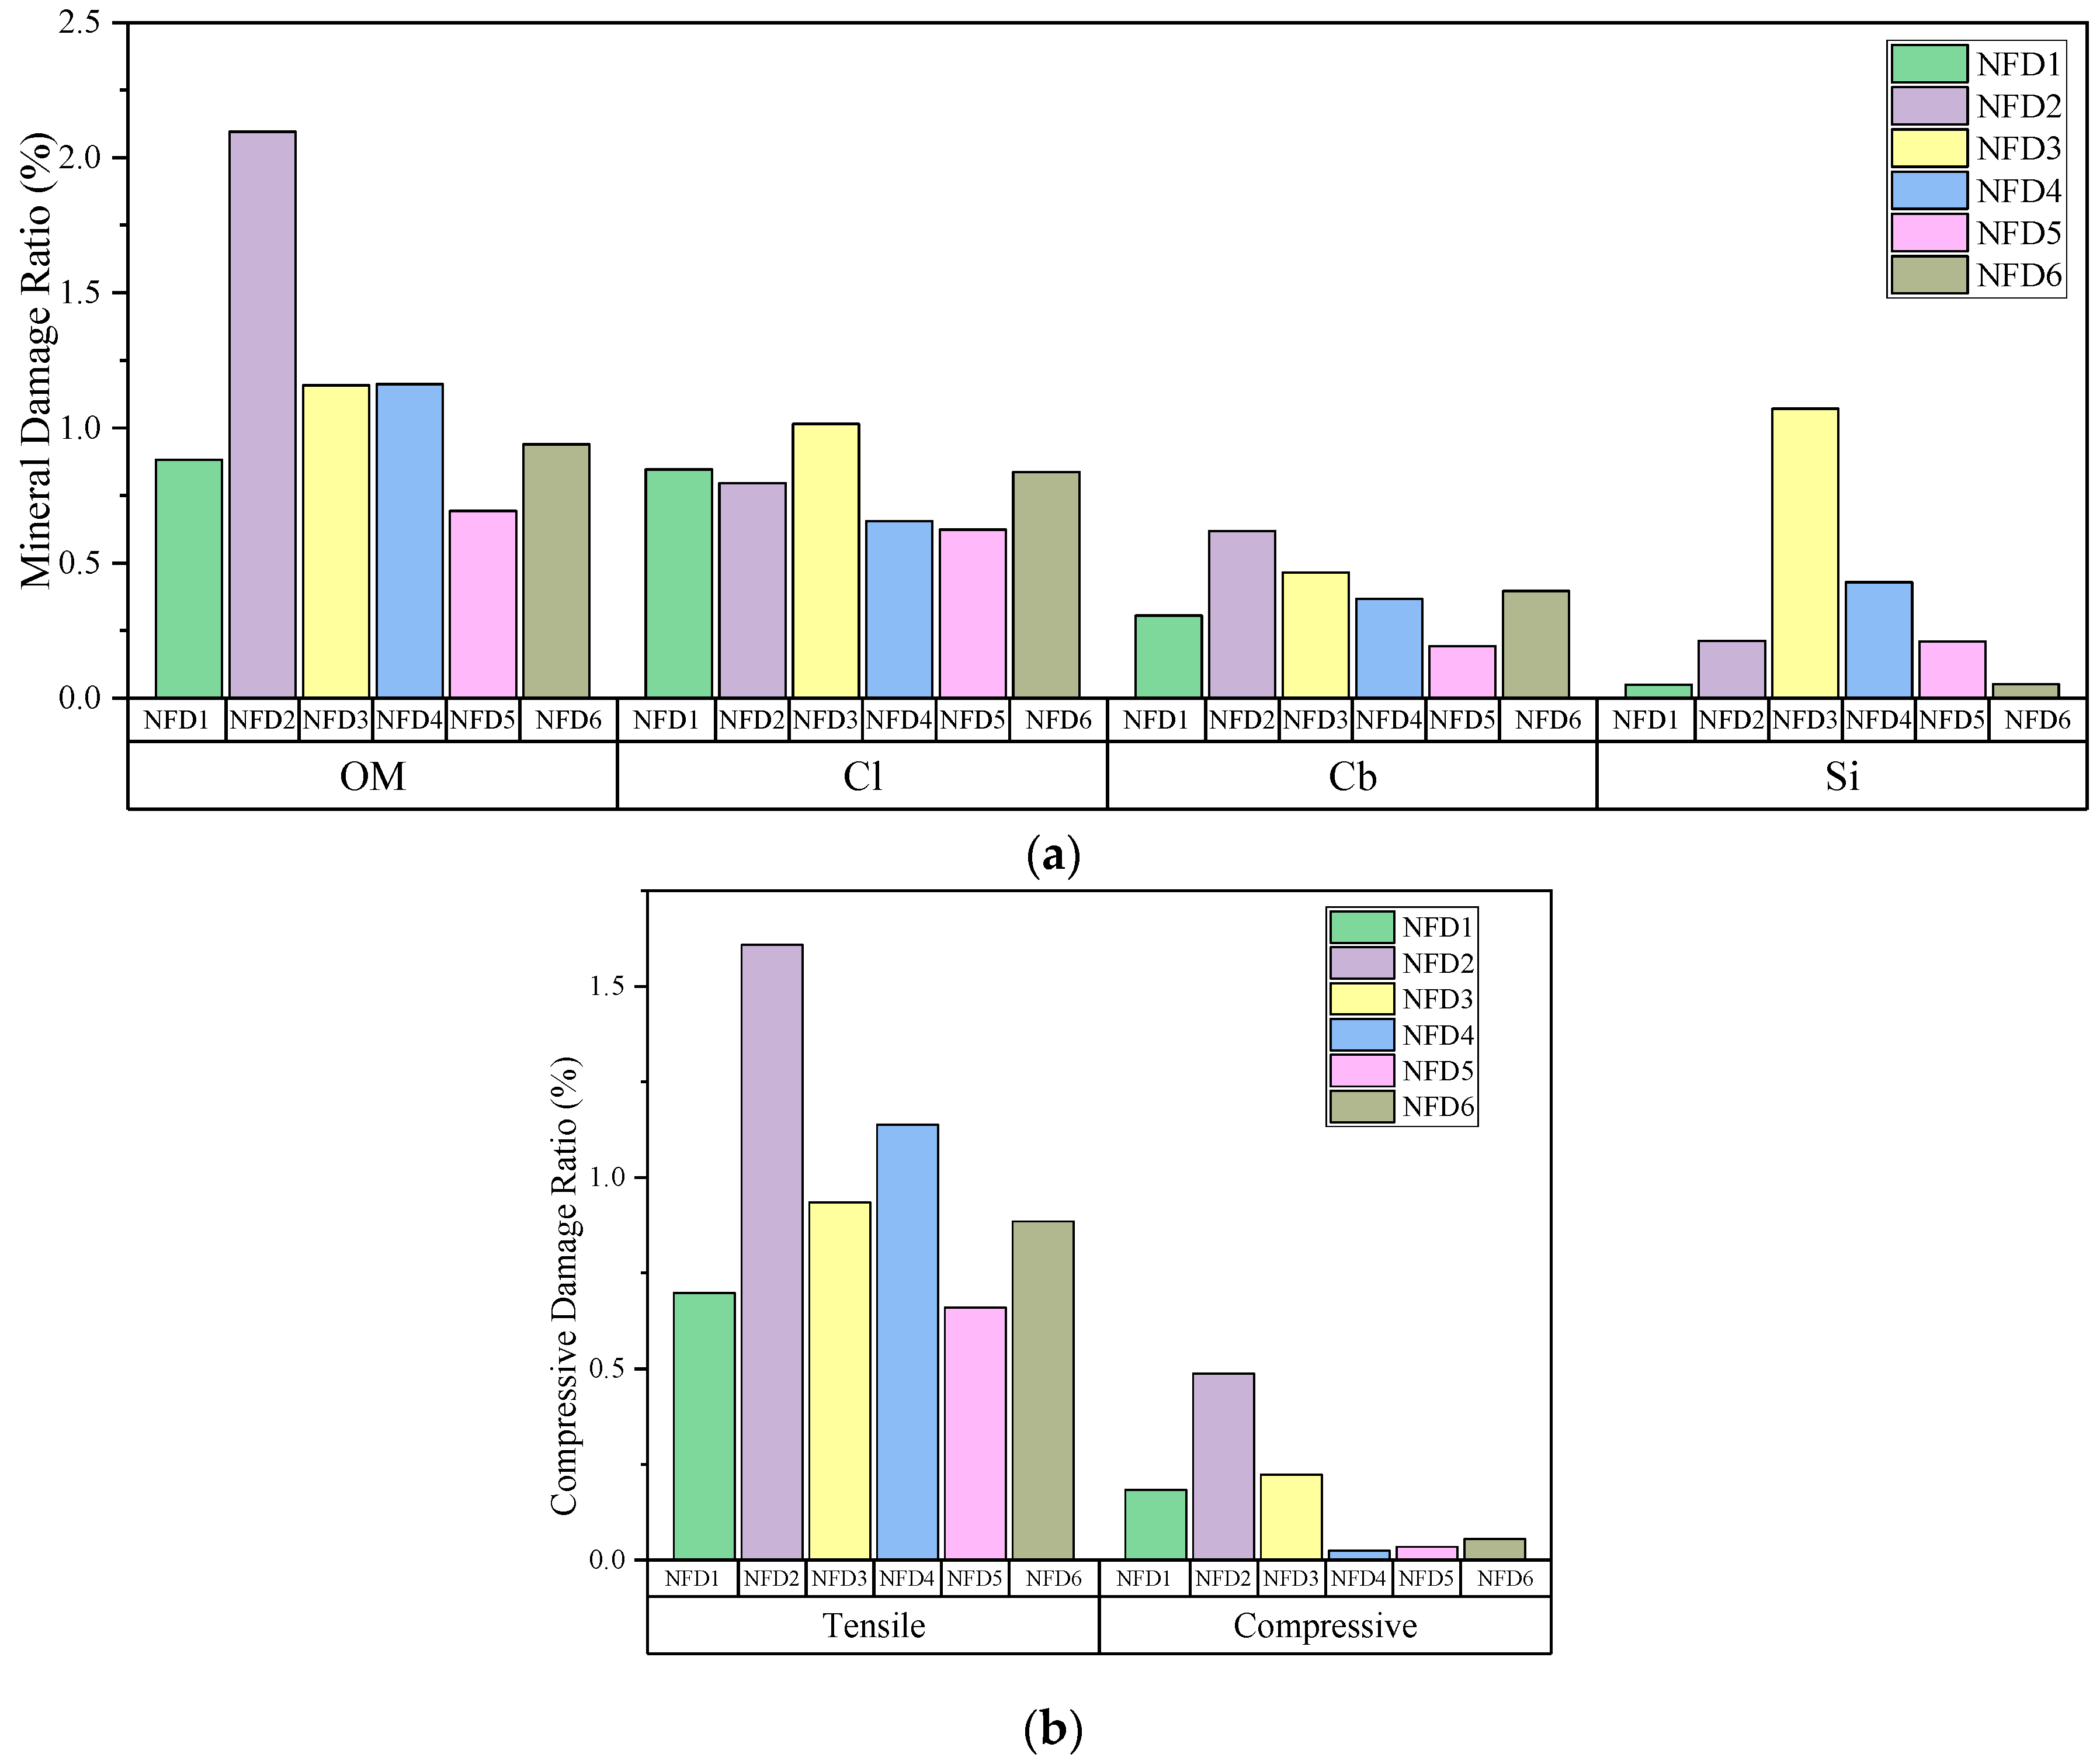
To further investigate the influence of natural fracture density on reservoir response mechanisms, particularly the damage behavior of various mineral components during hydraulic fracturing, this study conducts a systematic analysis of mineral damage rates and organic matter failure modes based on six fracture density models (NFD1–NFD6). The results are shown in Figure 21.
Figure 21a presents the damage rate variations of key minerals under different fracture densities. The damage rate of OM shows significant fluctuations, peaking at NFD2 (approximately 2.10%) and reaching a minimum at NFD5 (about 0.69%). This indicates that OM is highly sensitive to fracture-induced stress, especially under certain density conditions, such as NFD2. Clay minerals display a relatively stable response, with the highest damage rate being observed at NFD3 (around 1.05%) and limited variation overall. Carbonate minerals consistently show low damage rates (mostly between 0.3% and 0.6%), suggesting a weak response to fracture disturbances. Silicate minerals exhibit strong nonlinear behavior, with a peak damage rate of approximately 1.07% at NFD3, and notably lower rates under other densities. The overall ranking of mineral damage rates is OM > Si > Cl > Cb, reflecting significant differences in mechanical sensitivity among mineral types.
Figure 21b further analyzes the failure modes of OM. Under all fracture density conditions, tensile failure is dominant, while compressive–shear failure remains minimal. The highest tensile damage rate occurs at NFD2 (1.61%), followed by NFD4 and NFD3 (1.14% and 0.94%, respectively). The lowest values appear in NFD5 and NFD1 (less than 0.7%). In contrast, compressive–shear damage rates are generally low, with a maximum of only 0.49% at NFD2 and typically less than 0.2% for other densities. The ratio of tensile to compressive damage ranges from 3 to 40 across all cases, confirming that tensile stress is the primary driver of OM failure. This behavior may be related to the brittle nature, occurrence state, and mechanical properties of OM. Additionally, Cl, Cb, and Si minerals primarily exhibit tensile failure, with little evidence of compressive–shear damage. Therefore, the latter failure mode is not further analyzed for these minerals.
The influence of natural fracture density on mineral damage behavior is characterized by nonlinear responses and pronounced structural sensitivity. OM and silicate minerals respond more strongly to changes in fracture density, particularly under NFD2 and NFD3, where tensile stress concentration may lead to localized failure. In contrast, clay and carbonate minerals exhibit relatively stable behavior, indicating greater tolerance to fracture disturbances. OM consistently displays tensile-dominated failure under fracture influence. This finding is significant for understanding the coupling between OM occurrence and fracture network evolution.

5. Discussion

This study integrates the digital rock method with high-resolution SEM images to overcome the limitations of conventional homogeneous models in capturing shale microheterogeneity. RFPA mesoscale elements accurately represent the real distribution of mineral components and natural fractures, delivering more reliable predictions of fracture propagation and mineral damage than conventional idealized models.
Our numerical simulations show that higher brittleness indexes enhance fracture network complexity and propagation scale, aligning with previous studies [72,73]. This research study reveals that organic minerals exhibit greater sensitivity to changes in the brittleness indexes than clay minerals, a phenomenon also observed in recent related studies [74,75,76]. Compared with previous studies that focused on macroscopic statistical analysis, our results reveal that locally dense natural fracture zones may limit the propagation of hydraulic fractures under certain conditions. This hindrance effect can be attributed to two key mechanisms. First, densely distributed natural fractures act as energy dissipation interfaces, absorbing propagation energy, thereby weakening the driving force of hydraulic fractures. Second, the overlapping stress fields surrounding closely spaced fractures create stress shielding effects, which reduce the effective differential stress required for continued fracture extension. These mechanisms are especially pronounced under low initiation pressure and minimal horizontal stress difference, where natural fractures may deflect or even terminate the main fracture front.
This observation aligns with existing findings [77,78,79,80], which suggest that high-density natural fractures can induce strong leak-off effects and stress shadowing, thereby suppressing the long-range extension of hydraulic fractures. Particularly, under limited initiation pressure and small in situ stress difference conditions, natural fractures may act as energy dissipation interfaces, causing main fracture deviation and propagation interruption. Moreover, the coupled influence of mineral phase distribution, grain size variation, and interactions between fractures can further enhance uncertainty and nonlinearity in fracture propagation [76,81]. These findings highlight the importance of accounting for small-scale heterogeneity in fracture modeling and fracturing design to improve the accuracy of fracture network evolution predictions.
While this study successfully simulates hydraulic fracture propagation in specific rock samples using SEM imaging and digital rock methods, the inherent microscale randomness of natural fractures and mineral distribution creates considerable uncertainty. Therefore, future work should include extensive experimental validation and model calibration to ensure accuracy and stability. Upcoming research will focus on improving digital rock modeling by incorporating advanced multiscale characterization techniques, such as synchrotron X-ray CT, nanoscale mineral imaging, and crystal orientation analysis. These efforts aim to obtain more representative and quantitatively accurate structural data, ultimately enhancing the model’s ability to predict shale fracture behavior at the microscale.
The results of this study provide theoretical guidance for optimizing field hydraulic fracturing parameters. By systematically analyzing how the BI and NFD influence key indicators such as the SRA, fractal dimension, and fracture ratio, this work offers a scientific basis for segment selection and parameter design. The proposed fracture effectiveness index quantitatively evaluates the relationship between geological factors (BI and NFD) and fracture conductivity, which helps identify favorable reservoir zones during the design phase. Moreover, the findings contribute to avoiding unstable fracture propagation caused by unfavorable geological conditions, enhancing operational controllability and stimulation efficiency. This enables the effective translation of numerical simulation results into engineering practice.

6. Conclusions

A hydraulic–mechanical coupled fracturing model was developed by integrating high-resolution SEM imaging with digital rock methods to incorporate the actual distribution of mineral components and natural fractures. The analysis focused on how the brittleness index and natural fracture density affect hydraulic fracture propagation and mineral damage mechanisms. The main conclusions are as follows:
(1)
In highly brittle shale, fractures initiate, branch, and interconnect more easily, forming complex multidirectional networks that improve reservoir stimulation and flow capacity. The fracture effectiveness index shows a linear positive correlation with the brittleness index.
(2)
Natural fracture density has a nonlinear effect on fracture propagation. Moderate fracture density (approximately 8–10%) improves connectivity and network complexity, enhancing fracturing efficiency. However, when the natural fracture density exceeds approximately 10%, excessive density may lead to energy dissipation, fracture shielding, and limited propagation, which can reduce stimulation performance. Overall, the fracture effectiveness index correlates positively with natural fracture density.
(3)
Fracture propagation paths are jointly controlled by the spatial distribution of brittle minerals and natural fractures. Local concentrations of brittle minerals or dense natural fractures can cause deflection, intersection, or termination of fractures. This reflects a coupled control mechanism of brittleness-induced and structure-guided deflection, which, together with in situ stress, determines fracture patterns and directions.
(4)
Both the brittleness index and natural fracture density significantly affect mineral damage behavior. Higher brittleness increases the damage rate across all mineral types. Changes in fracture density cause nonlinear variations in mineral response. Organic matter is the most sensitive, mainly failing in tension. Silicates follow, while clays and carbonates exhibit higher stability and adaptability.

Author Contributions

Conceptualization, X.L.; Formal analysis, X.L., J.Z. and T.L.; Funding acquisition, X.L., T.L. and N.W.; Investigation, X.L., J.Z. and N.W.; Methodology, X.L., T.L. and Z.L.; Resources, S.M. and L.Z.; Software, Z.L.; Supervision, T.L., Z.L. and S.M.; Validation, X.L.; Visualization, X.L. and J.Z.; Writing—original draft, X.L.; Writing—review and editing, X.L. and T.L. All authors have read and agreed to the published version of the manuscript.

Funding

This work was supported by the Fundamental Research Funds for the Central Universities DUT24RC(3)034, National Natural Science Foundation of China (NSFC) (42202305 and 52209123), China Postdoctoral Science Foundation (2024M750322), and Postdoctoral Fellowship Program of CPSF (GZC20230364).

Data Availability Statement

The original contributions presented in this study are included in the article. Further inquiries can be directed to the corresponding author.

Acknowledgments

During the preparation of this work, the authors used ChatGPT4.0 to improve readability and language. After using this tool/service, the authors reviewed and edited the content as needed and take full responsibility for the content of the publication.

Conflicts of Interest

Author Licai Zheng was employed by the company Sanying Precision Instruments Co., Ltd. The remaining authors declare that the research was conducted in the absence of any commercial or financial relationships that could be construed as a potential conflict of interest.

Abbreviations

The following abbreviations are used in this manuscript:
BIBrittleness index, dimensionless
CbCarbonate minerals
ClClay minerals
FEIFracture effectiveness index
HFHydraulic fracture
NFNatural fracture
NFDNatural fracture density
OMOrganic matter
SRAStimulated reservoir area, μm2
SiSilicate minerals
CfConductivity correction factor
dFractal dimension, dimensionless
DDamage variable, dimensionless
DiMineral Fractal Dimension, i = OM, Cl, Cb, Si
E0Initial elastic modulus of the element, Pa
GShear modulus, Pa
gGravitational acceleration, m/s2
HHydraulic head, m
IUnit tensor, dimensionless
k Current permeability, mD
k 0 Initial permeability, mD
kDDamage rate coefficient, dimensionless
LefEffective fracture length, μm
LtotalTotal fracture length, μm
mDegree of material homogeneity
p Pore pressure, Pa
q Volume source, s−1
VVolume of an element, m2
ViMineral volume fraction, i = OM, Cl, Cb, Qzt, Si
xSpecific value of an element
x0Mean value of the meso-elements
α Biot’s coefficient, dimensionless
β Empirical coefficient, dimensionless
ε Strain tensor, dimensionless
ε v Volumetric strain, dimensionless
ε 1 First principal strain, dimensionless
ε 3 Third principal strain, dimensionless
ε c Compressive strain at elastic limit, dimensionless
ε t Tensile strain at elastic limit, dimensionless
ε t u Ultimate tensile strain, dimensionless
θ Path deflection coefficient, dimensionless
μ Fluid viscosity, Pa·s
ν Poisson’s ratio, dimensionless
ρ Density of the fracturing fluid, kg/m3
σ Stress tensor, Pa
σ 0 Uniaxial compressive strength, Pa
σ 1 Maximum effective principal stress, Pa
σ 3 Minimum effective principal stress, Pa
σ r c Residual compressive strength, Pa
σ r t Residual tensile strength, Pa
σ i i 3 α p Average effective stress, Pa

References

  1. Gates, I.; Vishkai, M. On multistage hydraulic fracturing in tight gas reservoirs: Montney Formation, Alberta, Canada. J. Pet. Sci. Eng. 2019, 174, 1127–1141. [Google Scholar] [CrossRef]
  2. Boak, J.; Kleinberg, R. Shale gas, tight oil, shale oil and hydraulic fracturing. In Future Energy, 3rd ed.; Elsevier: Amsterdam, The Netherlands, 2020; pp. 67–95. [Google Scholar] [CrossRef]
  3. Lu, J.; Li, L.; Yang, F.; Zhang, Z.; Lu, M. Finite element simulation and stimulated reservoir volume optimization of hydraulic fracture propagation in heterogeneous formations based on flow-stress-damage coupling. Phys. Fluids 2025, 37, 036604. [Google Scholar] [CrossRef]
  4. Gong, X.; Ma, X.; Liu, Y. Analysis of geological factors affecting propagation behavior of fracture during hydraulic fracturing shale formation. Geomech. Geophys. Geo-Energy Geo-Resour. 2024, 10, 102. [Google Scholar] [CrossRef]
  5. Gong, X.; Ma, X.; Liu, Y.; Li, G. Advances in Hydraulic Fracture Propagation Research in Shale Reservoirs. Minerals 2022, 12, 1438. [Google Scholar] [CrossRef]
  6. Zhuo, R.; Ma, X.; Li, J.; Zhang, S.; Zou, Y.; Ma, J. Study on the Effect of Fluid Viscosity and Injection Rate on the Geometry of Hydraulic Fractures Penetrating Through Laminae Planes and the Proppant Distribution in Deep Shale Oil Reservoirs. Rock. Mech. Rock. Eng. 2024, 58, 2763–2780. [Google Scholar] [CrossRef]
  7. Fallahzadeh, S.; Hossain, M.; Cornwell, A.; Rasouli, V. Near Wellbore Hydraulic Fracture Propagation from Perforations in Tight Rocks: The Roles of Fracturing Fluid Viscosity and Injection Rate. Energies 2017, 10, 359. [Google Scholar] [CrossRef]
  8. Wu, J.; Li, X.; Wang, Y. Insight into the Effect of Natural Fracture Density in a Shale Reservoir on Hydraulic Fracture Propagation: Physical Model Testing. Energies 2023, 16, 612. [Google Scholar] [CrossRef]
  9. Zhang, D.; Ranjith, P.G.; Perera, M.S.A. The brittleness indices used in rock mechanics and their application in shale hydraulic fracturing: A review. J. Pet. Sci. Eng. 2016, 143, 158–170. [Google Scholar] [CrossRef]
  10. Li, T.; Yao, M.; Xia, Y.; Feng, X.; Cong, W.; Shi, Y.; Tang, C.A. The Influences of Mineral Components and Pore Structure on Hydraulic Fracture Propagation in Shale. Rock. Mech. Rock. Eng. 2024, 58, 2929–2952. [Google Scholar] [CrossRef]
  11. Nagaso, M.; Mikada, H.; Takekawa, J. Mechanism of complex fracture creation in hydraulic fracturing. In Proceedings of the 20th International Symposium on Recent Advances in Exploration Geophysics (RAEG 2016), Chiba City, Japan, 24 May 2016; European Association of Geoscientists & Engineers: Bunnik, The Netherlands, 2016; pp. 1–5. [Google Scholar]
  12. Huo, Z.; Zhang, J.; Li, P.; Tang, X.; Yang, X.; Qiu, Q.; Dong, Z.; Li, Z. An improved evaluation method for the brittleness index of shale and its application—A case study from the southern north China basin. J. Nat. Gas. Sci. Eng. 2018, 59, 47–55. [Google Scholar] [CrossRef]
  13. Zeng, F.; Gong, G.; Zhang, Y.; Guo, J.; Jiang, J.; Hu, D.; Chen, Z. Fracability evaluation of shale reservoirs considering rock brittleness, fracture toughness, and hydraulic fracturing-induced effects. Geoenergy Sci. Eng. 2023, 229, 212069. [Google Scholar] [CrossRef]
  14. Chen, S.; Liu, Y.; Zhang, J.; Li, P.; Tang, X.; Li, Z.; Dong, Z.; Xu, L.; Zhao, X. Formation conditions and evolution of fractures in multiple tight rocks: Implications for unconventional reservoir exploitation. J. Pet. Sci. Eng. 2021, 200, 108354. [Google Scholar] [CrossRef]
  15. Khan, J.A.; Padmanabhan, E.; Ul Haq, I.; Franchek, M.A. Hydraulic fracturing with low and high viscous injection mediums to investigate net fracture pressure and fracture network in shale of different brittleness index. Geomech. Energy Environ. 2023, 33, 100416. [Google Scholar] [CrossRef]
  16. Lan, R.; Jinzhou, Z.; Yongquan, H. Hydraulic Fracture Extending into Network in Shale: Reviewing Influence Factors and Their Mechanism. Sci. World J. 2014, 2014, 847107. [Google Scholar] [CrossRef] [PubMed]
  17. Wang, J.G.; Dou, F. A numerical investigation for the impacts of shale matrix heterogeneity on hydraulic fracturing with a two-dimensional particle assemblage simulation model. J. Nat. Gas. Sci. Eng. 2022, 104, 104678. [Google Scholar] [CrossRef]
  18. Liu, H.; Song, H.; Chen, J.; Wang, R.; Wu, Z.; Wang, W.; Wang, S. Fracture Propagation Modes of Lower Cambrian Shale Filled with Different Quartz Contents under Seepage-Stress Coupling. Geofluids 2022, 2022, 1051284. [Google Scholar] [CrossRef]
  19. Sun, W.; Liang, B.; Hao, J.; Zhao, H.; Hou, M.; Liu, Q. Study on the Fracture Extension Pattern of Shale Reservoir Fracturing under the Influence of Mineral Content. ACS Omega 2024, 9, 32525–32535. [Google Scholar] [CrossRef]
  20. Sui, H.; Hu, R.; Gao, W.; Xu, D.; Iqbal, J. Effect of Brittle Mineral Size on Hydraulic Fracture Propagation in Shale Gas Reservoir. Geofluids 2019, 1, 9147048. [Google Scholar] [CrossRef]
  21. Taleghani, A.D.; Gonzalez, M.; Shojaei, A. Overview of numerical models for interactions between hydraulic fractures and natural fractures: Challenges and limitations. Comput. Geotech. 2016, 71, 361–368. [Google Scholar] [CrossRef]
  22. Zou, Y.; Zhang, S.; Ma, X.; Zhou, T.; Zeng, B. Numerical investigation of hydraulic fracture network propagation in naturally fractured shale formations. J. Struct. Geol. 2016, 84, 1–13. [Google Scholar] [CrossRef]
  23. Li, Y.; Hu, W.; Wei, S.; Zhang, Z.; Yang, P.; Song, S. Sensitivity analysis on the effect of natural fractures and injected fluid on hydraulic fracture propagation in a fractured reservoir. Eng. Fract. Mech. 2022, 263, 108288. [Google Scholar] [CrossRef]
  24. Chong, Z.; Li, X.; Chen, X.; Zhang, J.; Lu, J. Numerical Investigation into the Effect of Natural Fracture Density on Hydraulic Fracture Network Propagation. Energies 2017, 10, 914. [Google Scholar] [CrossRef]
  25. Yoshioka, K.; Hofmann, H.; Liang, Y.; Luo, Y.; Li, X. Phase-Field Modelling of Interactions Between Hydraulic Fractures and Natural Fractures. Rock. Mech. Rock. Eng. 2022, 55, 6227–6247. [Google Scholar] [CrossRef]
  26. Wang, J.; Xie, H.-P.; Matthai, S.K.; Hu, J.-J.; Li, C.-B. The role of natural fracture activation in hydraulic fracturing for deep unconventional geo-energy reservoir stimulation. Pet. Sci. 2023, 20, 2141–2164. [Google Scholar] [CrossRef]
  27. Xie, J.; Huang, H.; Ma, H.; Zeng, B.; Tang, J.; Yu, W.; Wu, K. Numerical investigation of effect of natural fractures on hydraulic-fracture propagation in unconventional reservoirs. J. Nat. Gas. Sci. Eng. 2018, 54, 143–153. [Google Scholar] [CrossRef]
  28. Zheng, H.; Li, F.; Wang, D. Numerical Investigation of Complex Hydraulic Fracture Propagation in Shale Formation. Processes 2024, 12, 2630. [Google Scholar] [CrossRef]
  29. Li, S.; Li, W.; Xue, Y.; Fu, J.; Zhu, J.; Zhao, H.; Wang, L. The Influence of the Distribution Characteristics of Complex Natural Fracture on the Hydraulic Fracture Propagation Morphology. Front. Earth Sci. 2022, 9, 784931. [Google Scholar] [CrossRef]
  30. Wang, L.; Yang, C.; Chang, X.; Zeng, Y.; Zhenkun, H.; Zhou, J.; Liu, L. Effect of natural filling fracture on the cracking process of shale Brazilian disc containing a central straight notched flaw. J. Pet. Sci. Eng. 2021, 196, 107993. [Google Scholar] [CrossRef]
  31. Chen, Z.; Yang, Z.; Wang, M. Hydro-mechanical coupled mechanisms of hydraulic fracture propagation in rocks with cemented natural fractures. J. Pet. Sci. Eng. 2018, 163, 421–434. [Google Scholar] [CrossRef]
  32. Wang, W.-H.; Olson, J.; Wu, K. Characterization of hydraulic fracture geometry in shale rocks through physical modeling. Int. J. Fract. 2019, 216, 71–85. [Google Scholar] [CrossRef]
  33. Geng, Y.; Liu, Z.; Wang, L.; Wang, S.; Zhao, H.; Zhang, G.; Tao, S.; Chen, M.; Li, W. Effect of Random Natural Fractures on Hydraulic Fracture Propagation Geometry in Fractured Carbonate Rocks. Rock. Mech. Rock. Eng. 2018, 51, 491–511. [Google Scholar] [CrossRef]
  34. Meng, S.; Zhang, Z.; Xu, W.; Yu, H.; Wu, H.; Liu, H. A mixed phase-field model for fracture propagation behavior in Gulong shale with complex wavy bedding. J. Rock. Mech. Geotech. Eng. 2025; in press. [Google Scholar]
  35. Hu, Y.; Hurst, A.; Gan, Q.; Elsworth, D. Hydraulic fracture propagation and interaction with natural fractures by coupled hydro-mechanical modeling. Geomech. Geophys. Geo-Energy Geo-Resour. 2021, 8, 4. [Google Scholar] [CrossRef]
  36. Dahi-Taleghani, A.; Olson, J. Numerical Modeling of Multistranded-Hydraulic-Fracture Propagation: Accounting for the Interaction Between Induced and Natural Fractures. SPE J. 2009, 16, 575–581. [Google Scholar] [CrossRef]
  37. Sun, P.; Ge, L.; Liu, Y.; Li, B.; Nie, X. Modeling of multi-mineral-component digital core based on Res-Unet. J. Geophys. Eng. 2023, 20, 483–493. [Google Scholar] [CrossRef]
  38. Wang, C.; Yao, J.; Huang, Z.; Liu, F.; Yang, Y. Digital core reconstruction based on discrete element and Markov chain-Monte Carlo methods. Geoenergy Sci. Eng. 2024, 236, 212422. [Google Scholar] [CrossRef]
  39. Yasin, Q.; Liu, B.; Sun, M.; Sohail, G.M.; Ismail, A.; Wood, D.A.; Yang, Z. Digital core modeling for multimineral segmentation of lacustrine shale oil using FE-SEM and KiU-Net. Fuel 2025, 398, 135474. [Google Scholar] [CrossRef]
  40. Aslannezhad, M.; Sayyafzadeh, M.; Tang, D.; Iglauer, S.; Keshavarz, A. Application of digital core analysis to improve reservoir characterisation and modelling: The Otway formation as a case study. Int. J. Greenh. Gas. Control 2025, 141, 104316. [Google Scholar] [CrossRef]
  41. Fu, Y.; Zhai, Q.; Yuan, G.; Wang, Z.; Cheng, Y.; Wang, M.; Wu, W.; Ni, G. Multi-scale nonlinear reservoir flow simulation based on digital core reconstruction. Geoenergy Sci. Eng. 2024, 242, 213218. [Google Scholar] [CrossRef]
  42. Lin, R.; Ren, L.; Zhao, J.; Tan, X.; Rasouli, V.; Wang, X.; Wu, J.; Song, Y.; Shen, C. Stress and pressure dependent permeability of shale rock: Discrete element method (DEM) simulation on digital core. J. Pet. Sci. Eng. 2022, 208, 109797. [Google Scholar] [CrossRef]
  43. Kazak, A.; Chugunov, S.; Chashkov, A. Integration of Large-Area Scanning-Electron-Microscopy Imaging and Automated Mineralogy/Petrography Data for Selection of Nanoscale Pore-Space Characterization Sites. SPE Reserv. Eval. Eng. 2018, 21, 821–836. [Google Scholar] [CrossRef]
  44. Yan, W.; Chi, P.; Golsanami, N.; Sun, J.; Xing, H.; Li, S.-Z.; Dong, H. Analysis of reconstructed multi-source and multi-scale 3D digital rocks based on the cycle-consistent generative adversarial network method. Geophys. J. Int. 2023, 235, 736–749. [Google Scholar] [CrossRef]
  45. Wang, S.; Tan, M.; Wu, H.; Li, Y.; Xie, G.; Zhang, L. A Digital Rock Physics-Based Multiscale Multicomponent Model Construction of Hot-Dry Rocks and Microscopic Analysis of Acoustic Properties under High-Temperature Conditions. SPE J. 2022, 27, 3119–3135. [Google Scholar] [CrossRef]
  46. Ji, L.; Lin, M.; Cao, G.; Jiang, W. A multiscale reconstructing method for shale based on SEM image and experiment data. J. Pet. Sci. Eng. 2019, 179, 586–599. [Google Scholar] [CrossRef]
  47. Zou, Y.; Chen, B.; Zhang, S.; Ma, X.; Hao, L.; Zhang, S.; Shi, S.-Z. Parameter Sensitivity Analysis of the Hydraulic Fracture Growth Geometry in a Deep Shale Oil Formation: An Experimental Study. Geofluids 2022, 2022, 6878626. [Google Scholar] [CrossRef]
  48. Li, Z.; Li, L.; Huang, B.; Zhang, L.; Li, M.; Zuo, J.; Li, A.; Yu, Q. Numerical investigation on the propagation behavior of hydraulic fractures in shale reservoir based on the DIP technique. J. Pet. Sci. Eng. 2017, 154, 302–314. [Google Scholar] [CrossRef]
  49. Li, Z.; Li, L.; Li, M.; Zhang, L.; Zhang, Z.; Huang, B.; Tang, C.a. A numerical investigation on the effects of rock brittleness on the hydraulic fractures in the shale reservoir. J. Nat. Gas. Sci. Eng. 2018, 50, 22–32. [Google Scholar] [CrossRef]
  50. Zhao, H.; Zou, L.; Liu, Y.; Wang, J.; Xie, X.; Li, S.; Qin, L. A Dynamic Propagation Numerical Model of Hydraulic Fracture Interactions with Pre-Existing Complex Natural Fractures. Processes 2024, 12, 899. [Google Scholar] [CrossRef]
  51. Firoozabadi, A.; Wu, T. Fracture Toughness and Surface Energy Density of Kerogen by Molecular Dynamics Simulations in Tensile Failure. J. Phys. Chem. C 2020, 124, 15895–15901. [Google Scholar] [CrossRef]
  52. Zhang, Z.; Li, D.; Rui, Z.; Meng, S.; Tao, J.; Yang, L.; Liu, X. Study on dynamic fracture growth mechanism of continental shale under compression failure. Gas. Sci. Eng. 2023, 114, 204983. [Google Scholar] [CrossRef]
  53. Erhu, B.; Song, Y.; Lu, W.; He, C. Numerical Simulation of the Influence of Natural Fractures on Hydraulic Fracture Propagation. Geofluids 2020, 1, 8878548. [Google Scholar] [CrossRef]
  54. Hu, Y.; Gan, Q.; Hurst, A.; Elsworth, D. Investigation of coupled hydro-mechanical modelling of hydraulic fracture propagation and interaction with natural fractures. Int. J. Rock Mech. Min. Sci. 2023, 169, 105418. [Google Scholar] [CrossRef]
  55. Lee, Y.H.; Carr, J.R.; Barr, D.J.; Haas, C.J. The fractal dimension as a measure of the roughness of rock discontinuity profiles. Int. J. Rock. Mech. Min. Sci. Geomech. Abstr. 1990, 27, 453–464. [Google Scholar] [CrossRef]
  56. Magsipoc, E.; Zhao, Q.; Grasselli, G. 2D and 3D Roughness Characterization. Rock. Mech. Rock. Eng. 2020, 53, 1495–1519. [Google Scholar] [CrossRef]
  57. Yang, B.; Liu, Y. Application of Fractals to Evaluate Fractures of Rock Due to Mining. Fractal Fract. 2022, 6, 96. [Google Scholar] [CrossRef]
  58. Lv, W.; Yan, G.; Liu, Y.; Liu, X.; Du, D.; Wang, R. Effect of fractal fractures on permeability in three-dimensional digital rocks. Fractals 2019, 27, 1940015. [Google Scholar] [CrossRef]
  59. Zhao, J.; Chen, H.; Li, N. Pore Structure Characterization Using Fractal Theory and 3D Digital Core. In Springer Series in Geomechanics and Geoengineering, Proceedings of the International Field Exploration and Development Conference 2020. IFEDC 2020, Chengdu, China, 23–25 September 2020; Springer: Singapore, 2021. [Google Scholar] [CrossRef]
  60. Liu, H.; Xie, H.; Wu, F.; Li, C.; Gao, R. A novel box-counting method for quantitative fractal analysis of three-dimensional pore characteristics in sandstone. Int. J. Min. Sci. Technol. 2024, 34, 479–489. [Google Scholar] [CrossRef]
  61. Li, T.; Li, L.; Tang, C.A.; Zhang, Z.; Li, M.; Zhang, L.; Li, A. A coupled hydraulic-mechanical-damage geotechnical model for simulation of fracture propagation in geological media during hydraulic fracturing. J. Pet. Sci. Eng. 2019, 173, 1390–1416. [Google Scholar] [CrossRef]
  62. Dang-Trung, H.; Keilegavlen, E.; Berre, I. Numerical modeling of wing crack propagation accounting for fracture contact mechanics. Int. J. Solids Struct. 2020, 204–205, 233–247. [Google Scholar] [CrossRef]
  63. Wang, L.; Vuik, C.; Hajibeygi, H. A stabilized mixed-FE scheme for frictional contact and shear failure analyses in deformable fractured media. Eng. Fract. Mech. 2022, 267, 108427. [Google Scholar] [CrossRef]
  64. Tang, C.A.; Tham, L.G.; Lee, P.K.K.; Yang, T.H.; Li, L.C. Coupled analysis of flow, stress and damage (FSD) in rock failure. Int. J. Rock. Mech. 2002, 39, 477–489. [Google Scholar] [CrossRef]
  65. Liang, Z.Z.; Tang, C.A.; Li, H.X.; Xu, T.; Zhang, Y. Numerical simulation of 3-d failure process in heterogeneous rocks. Int. J. Rock. Mech. Min. Sci. 2004, 41, 323–328. [Google Scholar] [CrossRef]
  66. Zhou, L.; Hou, M.Z. A new numerical 3D-model for simulation of hydraulic fracturing in consideration of hydro-mechanical coupling effects. Int. J. Rock. Mech. Min. Sci. 2013, 60, 370–380. [Google Scholar] [CrossRef]
  67. Freeze, R.A.; Cherry, J.A. Groundwater; Prentice-Hall: Hoboken, NJ, USA, 1980; Volume 13, pp. 455–458. [Google Scholar]
  68. Li, L.; Meng, Q.; Wang, S.; Li, G.; Tang, C. A numerical investigation of the hydraulic fracturing behaviour of conglomerate in Glutenite formation. Acta Geotech. 2013, 8, 597–618. [Google Scholar] [CrossRef]
  69. Xia, Y.; Zhou, H.; Zhang, C.; He, S.; Gao, Y.; Wang, P. The evaluation of rock brittleness and its application: A review study. Eur. J. Environ. Civil. Eng. 2022, 26, 239–279. [Google Scholar] [CrossRef]
  70. Rickman, R.; Mullen, M.; Petre, E.; Grieser, B.; Kundert, D. A Practical Use of Shale Petrophysics for Stimulation Design Optimization: All Shale Plays Are Not Clones of the Barnett Shale. In Proceedings of the SPE Annual Technical Conference and Exhibition, Denver, CO, USA, 21 August–24 September 2008; p. SPE–115258-MS, ISBN 978-1-55563-147-5. [Google Scholar] [CrossRef]
  71. Jarvie, D.M.; Hill, R.J.; Ruble, T.E.; Pollastro, R.M. Unconventional shale-gas systems: The Mississippian Barnett Shale of north-central Texas as one model for thermogenic shale-gas assessment. AAPG Bull. 2007, 91, 475–499. [Google Scholar] [CrossRef]
  72. Zhou, C.; Sun, Z.; Xiao, Y.; Huang, G.; Kuang, D.; Li, M. Study on Brittleness Characteristics and Fracturing Crack Propagation Law of Deep Thin-Layer Tight Sandstone in Longdong, Changqing. Processes 2023, 11, 2636. [Google Scholar] [CrossRef]
  73. Zhao, Y.; Gou, X. A brittleness evaluation method based on breaking energy theory for tight reservoir in Dagang Oilfield. J. Pet. Explor. Prod. Technol. 2020, 10, 1689–1698. [Google Scholar] [CrossRef]
  74. Du, J.; Cai, J.; Long, S.; Gao, B.; Feng, D.; Peng, Z.; Zeng, X. The Control of Diagenesis and Mineral Assemblages on Brittleness of Mudstones. Front. Earth Sci. 2021, 9, 758046. [Google Scholar] [CrossRef]
  75. Lu, S.; Zhi, Q.; Lin, Z.; Wang, J.; Zhang, P.; Huang, H. Evaluation of Lacustrine Shale Brittleness and Its Controlling Factors: A Case Study from the Jurassic Lianggaoshan Formation, Sichuan Basin. Processes 2023, 11, 439. [Google Scholar] [CrossRef]
  76. Liu, B.; Wang, S.; Liu, X.; Fu, X.; Bai, Y.; Ke, X.; Pan, Z. Mechanical characteristics and factors controlling brittleness of organic-rich continental shales. J. Pet. Sci. Eng. 2020, 194, 107464. [Google Scholar] [CrossRef]
  77. Xiong, D.; Ma, X. Influence of natural fractures on hydraulic fracture propagation behaviour. Eng. Fract. Mech. 2022, 276, 108932. [Google Scholar] [CrossRef]
  78. Zhang, Y.; Zhou, F.; Qiao, Y.; Ren, D.; Liu, Y.; Bai, J. Study on Shear & Tensile Activation of Hydraulic Fracturing in Natural Fractured Reservoirs. In Proceedings of the SPE Asia Pacific Oil and Gas Conference and Exhibition, Jakarta, Indonesia, 10–12 October 2023; p. SPE-215378-MS. [Google Scholar] [CrossRef]
  79. Nagel, N.; Zhang, F.; Sanchez-Nagel, M.; Lee, B.; Garcia, X. Fracture Network Connectivity—A Key To Hydraulic Fracturing Effectiveness and Microseismicity Generation. In Effective and Sustainable Hydraulic Fracturing; Jeffrey, R.G., McLennan, J., Bunger, A., Eds.; IntechOpen: Rijeka, Croatia, 2013. [Google Scholar] [CrossRef]
  80. Wang, H. Hydraulic fracture propagation in naturally fractured reservoirs: Complex fracture or fracture networks. J. Nat. Gas. Sci. Eng. 2019, 68, 102911. [Google Scholar] [CrossRef]
  81. Wang, J.; Zhang, B.; Guo, T.; Wang, H.; Chen, M.; Li, W.; Qu, Z.; Zheng, H. Research on fracture propagation of hydraulic fracturing in a fractured shale reservoir using a novel CDEM-based coupled HM model. Comput. Geotech. 2024, 168, 106170. [Google Scholar] [CrossRef]
Figure 1. Constitutive laws: (a) Damage evolution under tensile failure. (b) Damage evolution under compression failure [10].
Fractalfract 09 00535 g001
Figure 2. Reconstruction process of the digital core-based numerical model.
Fractalfract 09 00535 g002
Figure 3. Workflow for determining the mechanical properties and heterogeneity distribution of individual mineral phases.
Fractalfract 09 00535 g003
Figure 4. Spatial and statistical representation of elastic modulus heterogeneity in mineral phases: (a) Synthetic mineral map showing the spatial distribution of clay minerals (Cl) and carbonate minerals (Cb), with color intensity indicating intra-phase variability. (b) Weibull probability density functions fitted to the elastic modulus of each mineral type, used for assigning element-wise properties in the simulation.
Fractalfract 09 00535 g004
Figure 5. Original and processed SEM images of shale samples with different BI values. (a) BI1, (b) BI2, (c) BI3, and (d) BI4. (The red box in each processed image indicates the selected modeling region used for digital core reconstruction.).
Fractalfract 09 00535 g005
Figure 6. Distribution of elastic modulus and boundary conditions for shale models with different BI values: (a) BI1 (64.94%), (b) BI2 (65.77%), (c) BI3 (70.25%), and (d) BI4 (73.61%).
Fractalfract 09 00535 g006
Figure 7. Original and processed SEM images of shale samples with different NFD values: (a) NFD1, (b) NFD2, (c) NFD3, (d) NFD4, (e) NFD5, and (f) NFD6. (The red box in each processed image indicates the selected modeling region used for digital core reconstruction.)
Fractalfract 09 00535 g007
Figure 8. Elastic modulus distributions and boundary conditions of shale models with varying NFD values: (a) NFD1 (7.97%), (b) NFD2 (8.23%), (c) NFD3 (10.03%), (d) NFD4 (11.13%), (e) NFD5 (11.36%), and (f) NFD6 (14.79%).
Fractalfract 09 00535 g008
Figure 9. Evolution of pore pressure and fracture morphology in BI4 specimen during hydraulic fracturing: (a) Pore pressure. (b) Fracture morphology.
Fractalfract 09 00535 g009
Figure 10. Hydraulic fracture morphology and pore pressure distribution under different BI values: (a) BI1 (64.94%), (b) BI2 (65.77%), (c) BI3 (70.25%), and (d) BI4 (73.61%).
Fractalfract 09 00535 g010
Figure 11. Extraction process of hydraulic fracture parameters based on simulation results: (a) Determination of the SRA. (b) Identification of hydraulic fractures. (c) Binary image of hydraulic fractures for fractal analysis.
Fractalfract 09 00535 g011
Figure 12. Effect of brittleness index on hydraulic fracture characteristic parameters: (a) SRA. (b) Fractal dimension and hydraulic fracture ratio.
Fractalfract 09 00535 g012
Figure 13. Relationship between normalized FEI and normalized BI.
Fractalfract 09 00535 g013
Figure 14. Polar coordinate partitioning method for directional statistical analysis of brittle minerals and hydraulic fractures: (a) Sector division of the mineralogical image into 12 regions (R1–R12) at 30° intervals. (b) Extraction and directional mapping of hydraulic fracture networks. (c) Directional statistical distribution of fractures within each sector.
Fractalfract 09 00535 g014
Figure 15. Influence of BI on directional propagation of hydraulic fractures: (a) BI1, (b) BI2, (c) BI3, and (d) BI4.
Fractalfract 09 00535 g015
Figure 16. Mineral damage characteristics under different BI values: (a) Damage ratios of organic matter (OM), clay minerals (Cl), carbonate grains (Cb), and silicate grains (Si). (b) Compressive and tensile damage ratios of organic matter at varying BI levels.
Fractalfract 09 00535 g016
Figure 17. Hydraulic fracture morphology and pore pressure distribution under different NFD values: (a) NFD1 (7.97%), (b) NFD2 (8.23%), (c) NFD3 (10.03%), (d) NFD4 (11.13%), (e) NFD5 (11.36%), and (f) NFD6 (14.79%).
Fractalfract 09 00535 g017
Figure 18. Effect of NFD on hydraulic fracture characteristics: (a) SRA. (b) Fractal dimension and hydraulic fracture ratio.
Fractalfract 09 00535 g018
Figure 19. Normalized relationship between NFD and FEI.
Fractalfract 09 00535 g019
Figure 20. Influence of natural fracture density on directional propagation of hydraulic fractures: (a) NFD1 (7.97%), (b) NFD2 (8.23%), (c) NFD3 (10.03%), (d) NFD4 (11.13%), (e) NFD5 (11.36%), and (f) NFD6 (14.79%).
Fractalfract 09 00535 g020
Figure 21. Effect of natural fracture density on mineral damage characteristics: (a) Damage ratios of OM, Cl, Cb, and Si under different NFD values. (b) Compressive and tensile damage ratios of OM under varying NFD values.
Fractalfract 09 00535 g021
Table 1. Physical parameters of typical mineral components used in numerical modeling.
Mineral TypeE0 (GPa) m E 0 σ 0 (MPa) m σ 0 ν k (mD)
Carbonate minerals58.456.38315.444.210.286.2 × 10−4
Silicate minerals95.499.43507.689.730.076.2 × 10−4
Clay matrix35.866.09143.851.730.346.2 × 10−3
Organic matter8.052.1594.482.090.146.2 × 10−2
Table 2. Mineralogical characteristics of shale with different BI values.
Model IDDOMVOM(%)DClVCl (%)DCbVCb(%)DSiVSi (%)BI(%)
BI11.030.381.7934.671.8264.131.090.8164.94
BI21.140.791.8134.611.8363.71.12.0765.77
BI31.050.431.7829.331.8269.381.090.8770.25
BI41.160.81.7625.61.873.031.020.5873.61
Note: VSi = VFsp + VQtz.
Table 3. Mineralogical characteristics of shale with varying NFD values.
Model IDDOMVOM (%)DClVCl (%)DCbVCb (%)DSiVSi (%)BI (%)
NFD11.557.971.880.611.68.341.33.0711.80
NFD21.68.231.7687.861.412.811.111.093.9
NFD31.5510.031.7969.021.6815.511.395.4421.50
NFD41.6611.131.8576.831.649.971.242.0712.13
NFD51.6511.361.8476.471.639.961.262.2112.63
NFD61.7114.791.8770.011.6711.491.333.715.49
Note: VOM represents the volume fraction of organic matter filling natural fractures, which is equivalent to the density of natural fractures (NFD).
Disclaimer/Publisher’s Note: The statements, opinions and data contained in all publications are solely those of the individual author(s) and contributor(s) and not of MDPI and/or the editor(s). MDPI and/or the editor(s) disclaim responsibility for any injury to people or property resulting from any ideas, methods, instructions or products referred to in the content.