Article

Pore Structure Characteristics and Controlling Factors of the Lower Cambrian Niutitang Formation Shale in Northern Guizhou: A Case Study of Well QX1

1
College of Resources and Environmental Engineering, Guizhou University, Guiyang 550025, China
2
Key Laboratory of Karst Georesources and Environment, Ministry of Education, Guizhou University, Guiyang 550025, China
3
Guizhou Provincial Key Laboratory for Palaeontology and Palaeoenvironment, Guizhou University, Guiyang 550025, China
4
Key Laboratory of Unconventional Natural Gas Evaluation and Development in Complex Tectonic Areas, Ministry of Natural Resources of the People’s Republic of China, Guiyang 550004, China
5
Guizhou Engineering Research Institute of Oil & Gas Exploration and Development, Guiyang 550004, China
*
Author to whom correspondence should be addressed.
Fractal Fract. 2025, 9(8), 524; https://doi.org/10.3390/fractalfract9080524
Submission received: 28 March 2025 / Revised: 16 May 2025 / Accepted: 20 May 2025 / Published: 13 August 2025
(This article belongs to the Special Issue Multiscale Fractal Analysis in Unconventional Reservoirs)

Abstract

Shale pore architecture governs gas storage capacity, permeability, and production potential in reservoirs. Therefore, this study systematically investigates the pore structure features and influencing factors of the Niutitang Formation shale from the QX1 well in northern Guizhou using field emission scanning electron microscopy (FE-SEM), high-pressure mercury intrusion (HPMI), low-temperature nitrogen adsorption (LTNA), and nuclear magnetic resonance (NMR) experiments. The results show that ① The pore size of the QX1 well’s Niutitang Formation shale is primarily in the nanometer range, with pore types including intragranular pores, intergranular pores, organic matter pores, and microfractures, with the former two types constituting the primary pore network. ② Pore shapes are plate-shaped intersecting conical microfractures or plate-shaped intersecting ink bottles, ellipsoidal, and beaded pores. ③ The pore size distribution showed a multi-peak distribution, predominantly mesopores, followed by micropores, with the fewest macropores. ④ The fractal dimension D1 > D2 indicates that the shale pore system is characterized by a rough surface and some connectivity of the pore network. ⑤ Carbonate mineral abundances are the main controlling factors affecting the pore structure of shales in the study area, and total organic carbon (TOC) content also has some influence, while clay mineral content shows negligible statistical correlation.

1. Introduction

Shale gas predominantly resides in micro-nanoscale pore networks of shale in both free and adsorbed forms [1,2,3,4], and these pore systems critically govern gas storage capacity, migration efficiency, and recoverability of shale gas. Among them, the pore structure is directly related to the amount of shale gas stored in shale pores and the difficulty of seepage, which can be studied to screen out shale gas areas with an extraction value [5,6,7]. The Lower Silurian Longmaxi Formation and the Lower Cambrian Niutitang Formation are the primary shale formations in Northern Guizhou, which is a strategic target for shale gas exploration and production in the Upper Yangtze Block [8,9,10]. According to the shale gas survey and evaluation results of Guizhou Province in 2013, the shale distribution range of the Lower Cambrian Niutitang Formation is more extensive than that of the Lower Silurian Longmaxi Formation, and this formation contributes to approximately 39% of Guizhou’s total shale gas resources [11].
In the past decade, research on the Lower Cambrian Niutitang Formation shales in Northern Guizhou has evolved along two principal axes. Macroscale investigations have predominantly addressed tectonic conditions, depositional environments, shale spreading, and organic matter enrichment mechanisms, which indicated that northern Guizhou has undergone multi-phase tectonic modifications resulting in complex structural configurations, but the depositional environment was relatively stable, primarily characterized by deep-water shelf sedimentation, and it is generally agreed that the shale distribution in the area is wide and the thickness is large [12,13]. Among them, the shales in the middle and lower sections of the Niutitang Formation are rich in organic matter and have a superior hydrocarbon generation potential [14]; microscale analyses have focused on reservoir characterization, revealing distinctive low-porosity, low-permeability systems with overmature organic matter [15,16,17,18]. Notably, pore architecture emerges as a critical reservoir property governing both storage capacity and fluid migration efficiency.
At present, methodologies for characterizing shale pore architectures can be broadly categorized into two classes. The first category is techniques that enable visualization of micropore morphology of shale through imaging. The main analytical methods include field-emission scanning electron microscopy (FE-SEM), argon ion polishing scanning electron microscopy (AIP-SEM), and focused ion beam scanning electron microscopy (FIB-SEM). While these imaging techniques provide high-resolution visualization of pore structures, they are constrained by inherent limitations. For instance, FE-SEM imaging results often fail to accurately represent the comprehensive pore architecture of shale formations due to the imaging’s limited field of view and potential sample deformation during preparation procedures.
The other category is techniques that obtain quantifiable critical parameters, including pore morphology, pore size distribution, porosity, pore specific surface area, and pore volume based on gas adsorption methods (N2/CO2), high-pressure mercury intrusion (HPMI), constant-pressure mercury intrusion (CPMI), and nuclear magnetic resonance (NMR) [5,19,20,21]. Notably, these indirect characterization approaches also exhibit inherent technical constraints. For instance, HPMI demonstrates limited resolution in micropore detection (<2 nm), while gas adsorption methodologies cannot identify isolated closed pores. Empirical studies confirm that it is not comprehensive to use only one method to characterize the pore structure characteristics of shale in a study area. Consequently, comprehensive characterization necessitates the integrated application of complementary methodologies [22,23,24].
In addition, fractal dimension analysis serves as a quantitative tool for characterizing shale pore structures, providing an effective metric to evaluate their heterogeneity and structural complexity [25]. Previous studies demonstrate significant correlations between fractal dimensions and key petrophysical parameters, including porosity and permeability. Specifically, lower fractal dimensions indicate more homogeneous pore networks that enhance gas diffusion and seepage dynamics, whereas elevated values suggest intricate pore architectures associated with enhanced gas adsorption capacity [26,27]. This analytical approach not only can provide more accurate pore structure information [28], which helps to assess shale oil and gas resource reserves and distribution more accurately, but it can also effectively predict the permeability and gas mobility of shale reservoirs so as to optimize fracturing and extraction strategies.
Therefore, this investigation concentrates on the Cambrian Niutitang Formation shale from Well QX1 in northern Guizhou. Employing a suite of analytical techniques, including FE-SEM, NMR, LTNA, HPMI, and fractal theory, to systematically investigate the pore network characteristics of the target formation. Furthermore, we examine the main geological factors that influence pore architecture. This investigation aims to establish foundational geological data and theoretical frameworks to advance shale gas exploration strategies in the Niutitang Formation of northern Guizhou.

2. Geological Setting

Guizhou occupies a tectonic junction between the Jiangnan Orogenic Belt and the Yangtze Block of the South China Plate (Figure 1a) [29], forming an uplifted crustal region between the Mesozoic East Asian Orogen and the Cenozoic Alpine–Tethys Orogen [30]. During the tectonic evolution, the region experienced several distinct orogenic movements, such as the Wuling Orogeny (Z) during the Neoproterozoic period, the Guangxi movement (S-D) during the Paleoproterozoic period, the Yanshan movement (J-K) during the Mesoproterozoic period, and the Himalayan movement (E-N) during the Cenozoic period [31]. As a result, a complex tectonic pattern has been shaped, particularly widespread Jurassic fold-thrust systems. Tectonically, the northern Guizhou region is classified within the Yangtze Block, situated in the complex tectonic zone external to the Sichuan Basin’s southeastern margin and the western extent of the Jiangnan orogenic belt [32]. The region is characterized by very well-developed rupture and fold structures, mainly N-S to NNW-trending, and the typical “trough-separation” folds are formed from east to west [33,34].
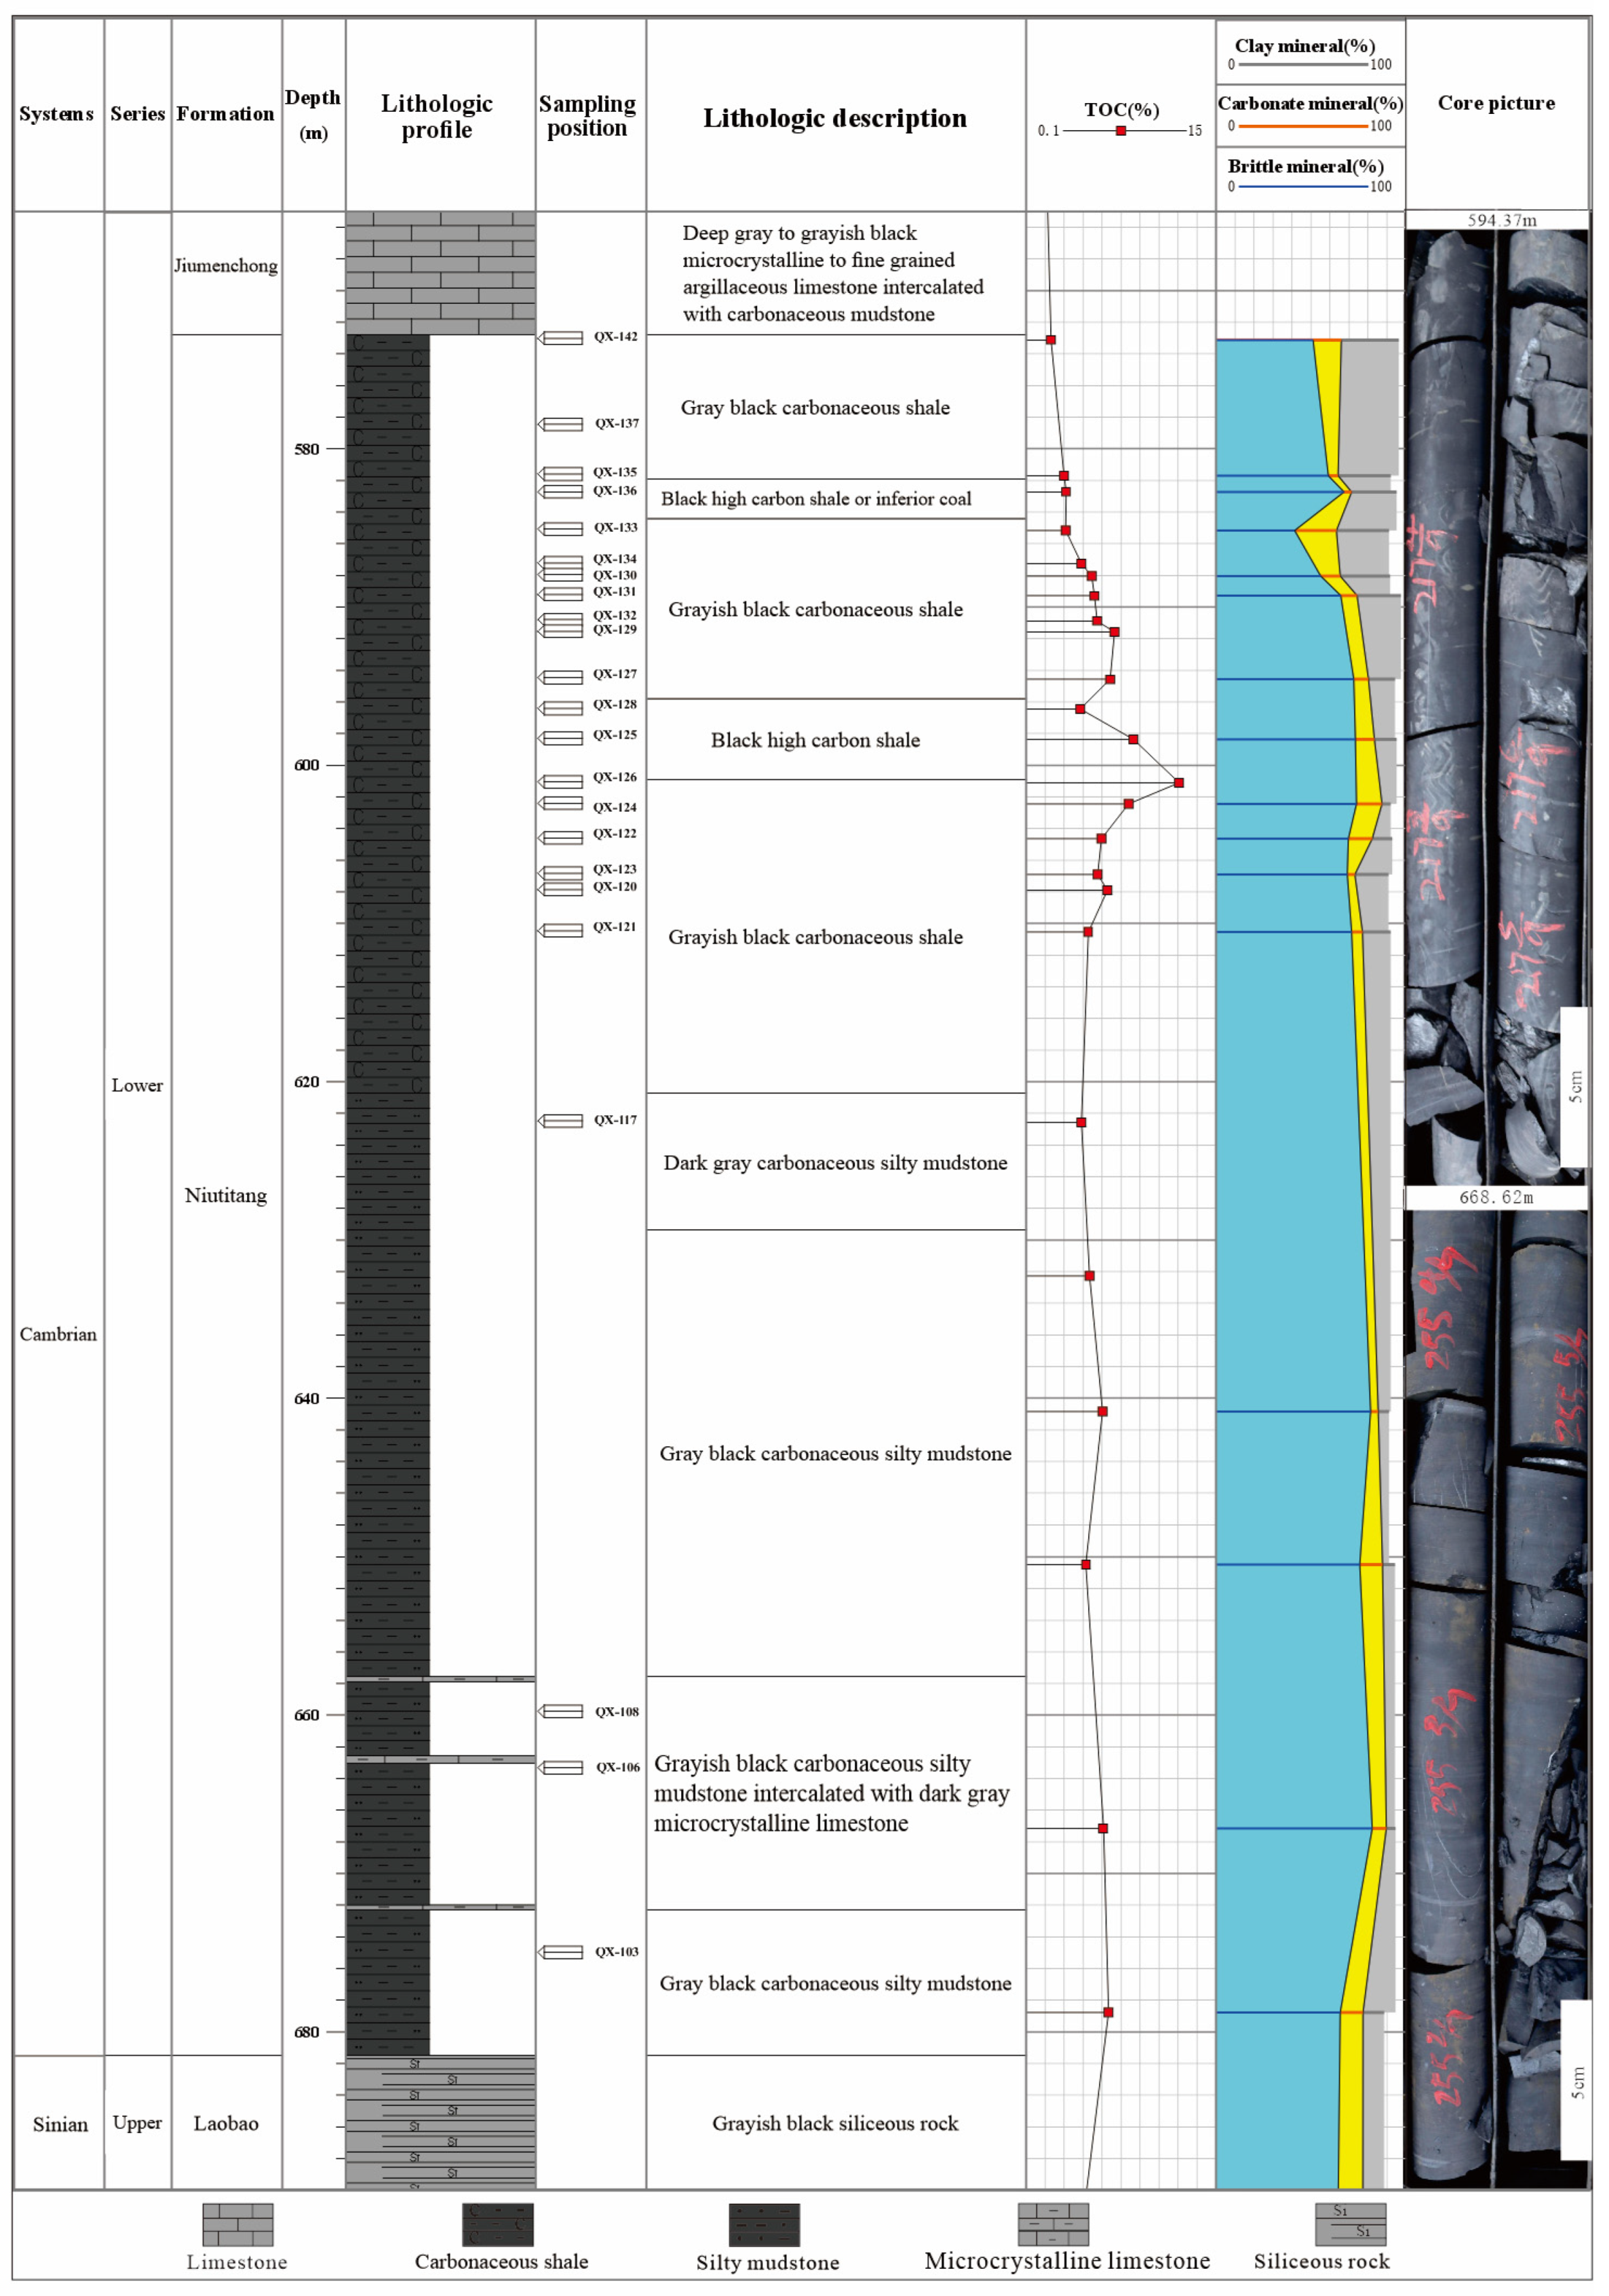
The QX1 well is situated within the Sansui syncline, located between the Tongren-Sandu Fault zone and the Guiyang-Zhenyuan fault zone, west of the Xuefeng Mountains (Figure 1b). This area represents a tectonic transition between the Xuefeng Uplift’s western margin and the Upper Yangtze Massif’s southeastern edge, characterized by intense NE- to NNE-trending fold-thrust systems with complex intersecting fault networks. Stratigraphy encountered in the QX1 well is, from top to bottom, Quaternary; Cambrian Palang Formation, Bianmachong Formation, Jiumenchong Formation, Niutitang Formation; Aurignacian Laobao Formation, Doushantuo Formation, and Nanhuasi Nantuo Formation (Figure 2) [29]. Among them, the Niutitang Formation in this well spans 572.81–681.48 m (108.67 m thick), predominantly comprising grayish-black, black carbonaceous shale and silty shale, interbedded with thin layers of dark gray argillaceous limestone. These strata exhibit elevated total organic carbon content (TOC), indicating favorable hydrocarbon source rock characteristics.

3. Experiment and Samples

This section may be divided by subheadings. It should provide a concise and precise description of the experimental results, their interpretation, as well as the experimental conclusions that can be drawn. This study investigated 23 shale samples collected from the Niutitang Formation in Well QX1, located in the eastern Sanshui Syncline of northern Guizhou, with burial depths spanning 573–675 m. Mineralogical analysis revealed a composition dominated by quartz, feldspar, and clay minerals, with subordinate carbonate minerals and pyrite. The shale samples exhibit TOC contents ranging from 2.06% to 12.1% and vitrinite reflectance (R0) values of 2.29–2.67%, collectively indicating overmature thermal evolution [29]. This study employed FE-SEM, HPMI, LTNA, and NMR experiments and the calculation of the fractal dimension on representative shale samples from the Niutitang Formation at varying burial depths. The experimental methodologies are detailed below:

3.1. FE-SEM Experiment

FE-SEM experiment analysis was performed using a Zeiss Merlin instrument manufactured by Carl Zeiss AG in Oberkochen, Germany. Sample preparation included machining shale into cylindrical geometries (10 mm in diameter and 2 mm in height), followed by argon ion beam polishing to achieve a relatively flat surface, a critical requirement for high-resolution imaging [35]. Subsequently, a 5–10 nm gold film was sputter-deposited onto the polished surface. Microscopic morphology and structure of the samples were observed using FE-SEM, coupled with energy-dispersive X-ray spectroscopy for elemental identification.

3.2. HPMI Experiment

The HPMI analysis was conducted using an AutoPore IV 9500 mercury porosimeter (Micromeritics Instrument Corporation, Norcross, GA, USA) with a maximum pressure capacity of 227.5 MPa, enabling pore size characterization down to 5 nm. Shale samples were mechanically crushed to 2–5 mm fragments, followed by degassing at 110 °C for 24 h to remove adsorbed moisture and volatiles, then immediately transferred to a desiccator to cool to room temperature. After vacuum stabilization, the samples were subjected to the experimental procedure.

3.3. LTNA Experiment

LTNA measurements were performed using a JW-TB400 analyzer manufactured by Beijing JWGB Sci & Tech Co., Ltd. in Beijing, China, with a detection range of 2–500 nm pore diameters, capable of resolving specific surface areas ≥0.0005 m2/g and pore volumes ≥0.0001 cm3/g. The sample preparation was carried out before the experiment; after crushing the samples to 60–80 mesh, the samples were pretreated by heating with a degasser, this process was carried out in a state of evacuation to remove the water in the pores of the shale samples. High-purity liquid nitrogen is then injected as the adsorbate, and the experiment is conducted at a liquid nitrogen temperature of −195.85 °C.

3.4. NMR Experiment

The NMR experiments were conducted using a MesoMR23-060H-I NMR instrument manufactured by Niumag Electronic Technology Corporation (Suzhou, China). The instrument operated at a resonance frequency of 11.897 MHz, with the magnet temperature maintained between 32.0 ± 0.1 °C and a probe coil diameter of 25 mm. The samples were machined into cylindrical geometries with dimensions of 2.5 cm in diameter and 4 cm in height. Surfaces were progressively polished using sandpaper to preserve pore edge integrity. Following vacuum saturation under controlled pressure conditions, NMR measurements were conducted in the fully water-saturated state to obtain porosity values and T2 relaxation distribution profiles. Subsequently, the samples underwent centrifugation at controlled rotational speeds before repeating NMR acquisition. This experimental sequence enabled systematic documentation of porosity variations and T2 spectrum alterations between pre- and post-centrifugation states, facilitating analysis of fluid redistribution characteristics.

3.5. Pore Fractal Theory

The fractal dimension quantitatively characterizes the structural complexity and spatial heterogeneity of porous media [36,37]. It typically exhibits values ranging from 2 to 3. A dimension approaching 2 correlates with smoother pore surfaces, simplified structural configurations, and enhanced material homogeneity. Conversely, values nearing 3 correspond to increased surface roughness, heightened structural complexity, and greater heterogeneity. In this study, the fractal dimension formula based on HPMI data is (1):
Lg(1 − Shg) = (D − 3)LgPc + (3 − D)LgPmin,
where Shg is the cumulative saturation, %; Pc is the capillary pressure, MPa; Pmin is the capillary pressure corresponding to the maximum pore size, MPa; D is the fractal dimension; and Lg denotes the base-10 logarithm.
The Frenkel-Halsey-Hill (FHH) model is used to calculate the fractal dimension from LTNA data with the Formula (2) [38]:
InV = (D − 3) In[In(P0/P)] + C,
where V is the gas adsorption volume at equilibrium pressure P, cm3/g; P0 is the saturation vapor pressure of the adsorbate gas, MPa; P is the system equilibrium pressure, MPa; C is a constant; D is the fractal dimension.

4. Result and Discussion

4.1. Pore Type

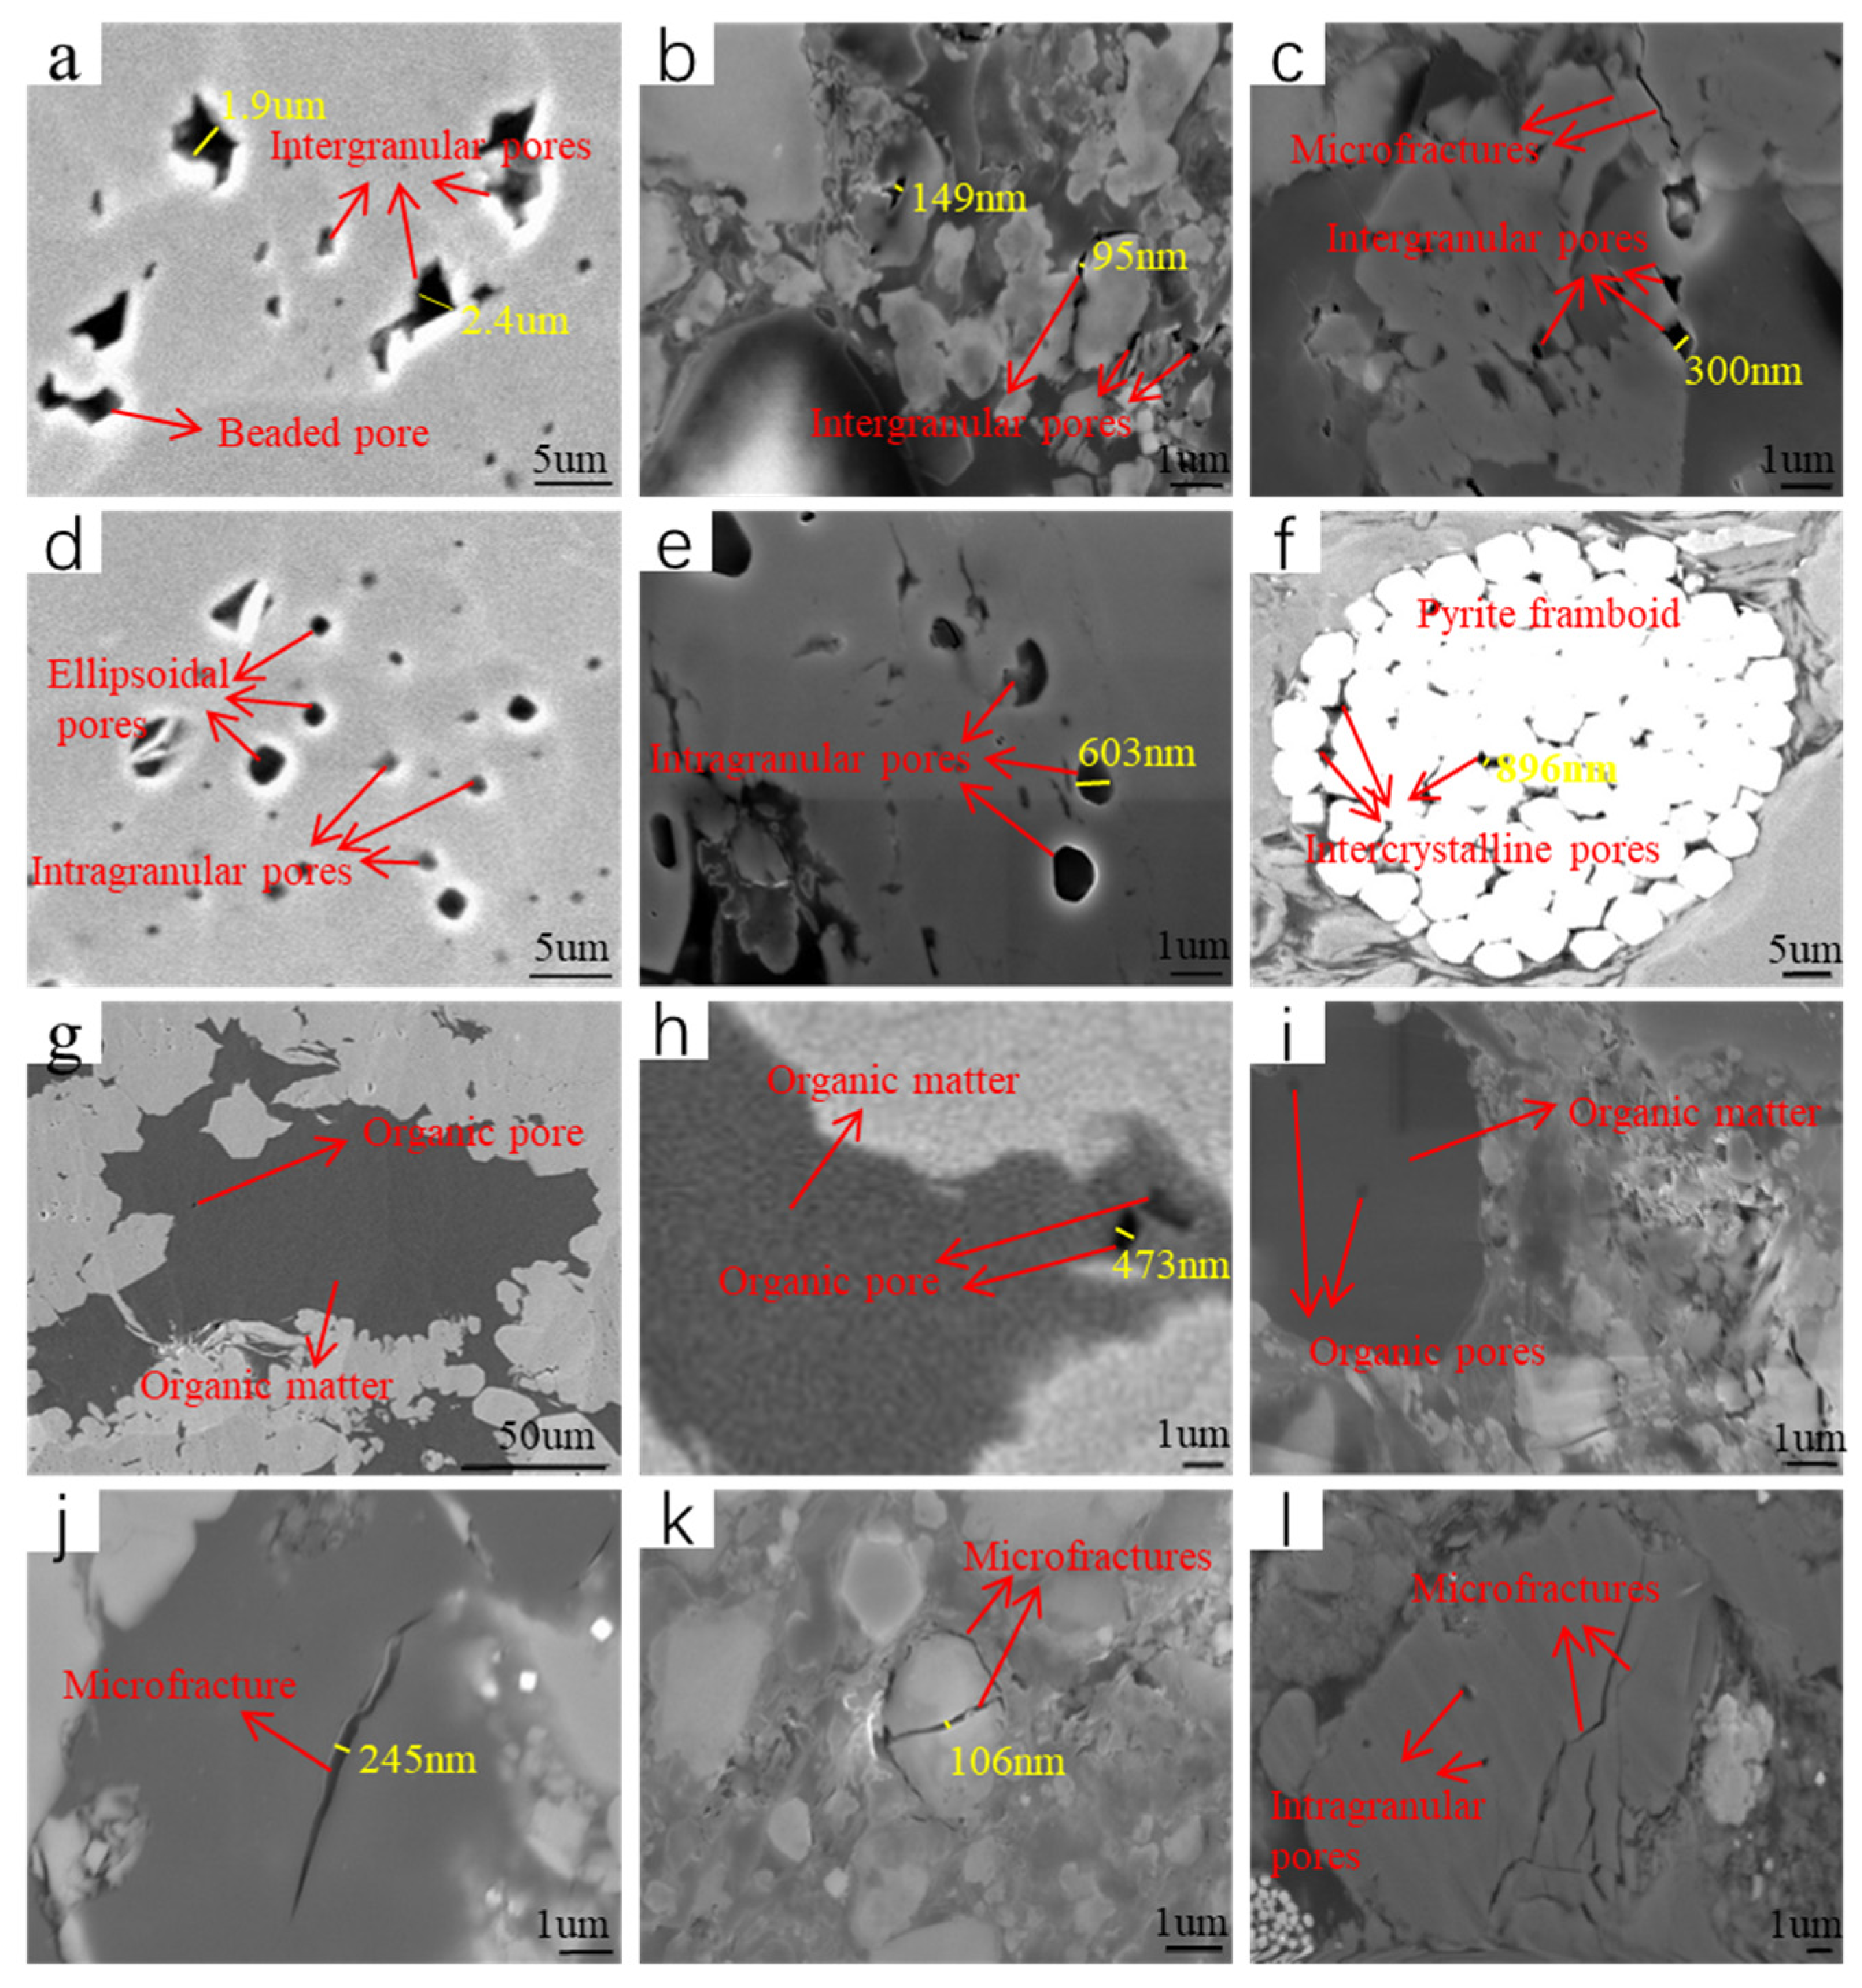
Pore type is a critical factor influencing shale reservoir quality. In this study, 12 representative shale samples were selected for experimental analysis. Nano- to micrometer-scale pores within the samples were characterized using FE-SEM to investigate pore morphology and distribution patterns. Following Loucks et al.’s [39] classification framework for shale pores, the analyzed samples from the Niutitang Formation in Well QX1 revealed four distinct pore types: intergranular pores, intragranular pores, organic matter pores, and microfractures. Among them, intergranular pores and intragranular pores are dominant, while organic matter pores are relatively few.
Intergranular pores, predominantly primary pores, form along mineral particle contact boundaries or interparticle spaces (Figure 3a–c). In QX1 Well Niutitang Formation shale samples, these pores predominantly exhibit triangular or slit-like morphologies, with some appearing as beaded structures (Figure 3a), primarily occurring adjacent to rigid mineral particles with high compressive resistance. Compared to intragranular pores, intergranular pores have a broader pore size distribution, spanning several orders of magnitude, mostly ranging from tens of nanometers to several micrometers. Their enhanced connectivity establishes effective percolation networks, significantly influencing shale gas storage and migration.
Intragranular pores predominantly form during diagenetic processes (Figure 3d–f). The formation of dissolution pores is associated with the dissolution of brittle minerals (e.g., feldspar, quartz) within the shale samples by organic acids. Due to differential dissolution rates, the edges of dissolution pores often exhibit irregular geometries, with elliptical morphologies occasionally observed (Figure 3d). These pores are predominantly nanopores, predominantly existing as isolated features within mineral grains. Framboidal pyrite aggregates contain localized intercrystalline pores (Figure 3f) formed through non-compact stacking of pyrite crystals during diagenesis. These submicron-scale pores demonstrate a certain interconnectivity and predominantly irregular shape, constituting a distinct nanopore system [40,41].
Organic matter pores predominantly occur in kerogen and solid bitumen [42] and are closely related to the hydrocarbon thermal maturation. These pores predominantly display irregular morphologies, with rare occurrences of circular or elliptical forms (Figure 3g–i). Zhou et al. and Zeng et al. [15,43] found in their study that the shales of the Niutitang Formation in northern Guizhou developed abundant organic matter pores, and a large amount of organic matter distribution can be seen in this experiment using FE-SEM (Figure 3g), but the organic matter pores are only sporadically distributed, with a relatively low degree of development, and make a small contribution to the total porosity of the shales of the Niutitang Formation. This may be due to the fact that the shale of the Niutitang Formation in Well QX1 is basically in the stage of high-over maturity evolution, and under the high-temperature and high-pressure geologic environment, the organic matter underwent excessive compaction that damaged the original pores, resulting in poorly developed organic matter pores with small pore diameters between a few nanometers and hundreds of nanometers and poor connectivity.
Microfracture formation predominantly originates from clay mineral desiccation shrinkage, dehydration reactions, mineral phase transformations, and thermal contraction. In Niutitang Formation shale samples, these fractures were relatively developed, primarily exhibiting irregular linear and striated morphologies (Figure 3j–l). Some microfractures even cut across several mineral grains (Figure 3k), establishing interconnectivity with adjacent pore systems. The fracture width is typically within hundreds of nanometers, while the fracture length can reach tens of micrometers. It shows good connectivity, which effectively improves the physical properties of the shale reservoir and establishes efficient migration pathways for shale gas.

4.2. Pore Structure

4.2.1. HPMI Characterization

HPMI was employed to characterize macropore structures (>50 nm) within the shale matrix. The experimental results (Figure 4) reveal a rapid increase in mercury intrusion volume with increasing pressure at the initial stage. The sharp increase in mercury intrusion volume at the high-pressure end of the intrusion curve suggests the presence of mesopores within the shale samples. Furthermore, the maximum mercury intrusion volume for all shale samples corresponds to a pressure near 33,000 psi, indicating a significant abundance of micropores, which require high pressure for mercury intrusion.
The cumulative mercury extrusion curves exhibited morphological variations among different shale samples, but all samples show a trend of increasing and then decreasing cumulative intrusion volume with decreasing pressure. Zeng et al. [44] noted that the increase in cumulative mercury volume during extrusion is attributed to the high pressure causing the transformation of some micropores into mesopores due to pore structure damage and the reopening of some closed pores during the extrusion process. In addition, the overall change in cumulative mercury volume is relatively small, indicating that micropores and mesopores are relatively well-developed in the Niutitang Formation shale samples from the QX1 well, while macropores are less developed, making it difficult for some mercury to escape from the pores and remain inside. The significant non-coincidence of the intrusion and extrusion curves indicates that substantial capillary forces hinder mercury extrusion. Overall, it shows that the shale pore throats are poorly sorted, with nanometer-sized pores predominating.
Other relevant data of the HPMI experiment are presented in Table 1. The shale samples exhibited the total pore volume ranging from 0.0060 to 0.0094 cm3/g, with a mean value of 0.0079 cm3/g; with a corresponding specific surface area ranging from 0.315 to 0.728 m2/g, with a mean value of 0.391 m2/g; the average pore diameter ranging from 46.6 to 246.9 nm, with a mean value of 102.0 nm; Notably, the porosity of North American shale systems (e.g., Barnett, Marcellus, and Eagle Ford formations) typically exhibits porosities of 4–10% [45,46]. The study area shows significantly lower porosity values, ranging from 1.4556 to 2.3373%, with a mean value of 1.9708%.

4.2.2. LTNA Characterization

LTNA experiments are principally used to characterize the pore structure of micropores (<2 nm) and mesopores (2–50 nm) in the shale matrix [47]. Quantitative analysis of pore morphology and structural complexity can be characterized based on experimental adsorption–desorption isotherms of shale [48,49,50].
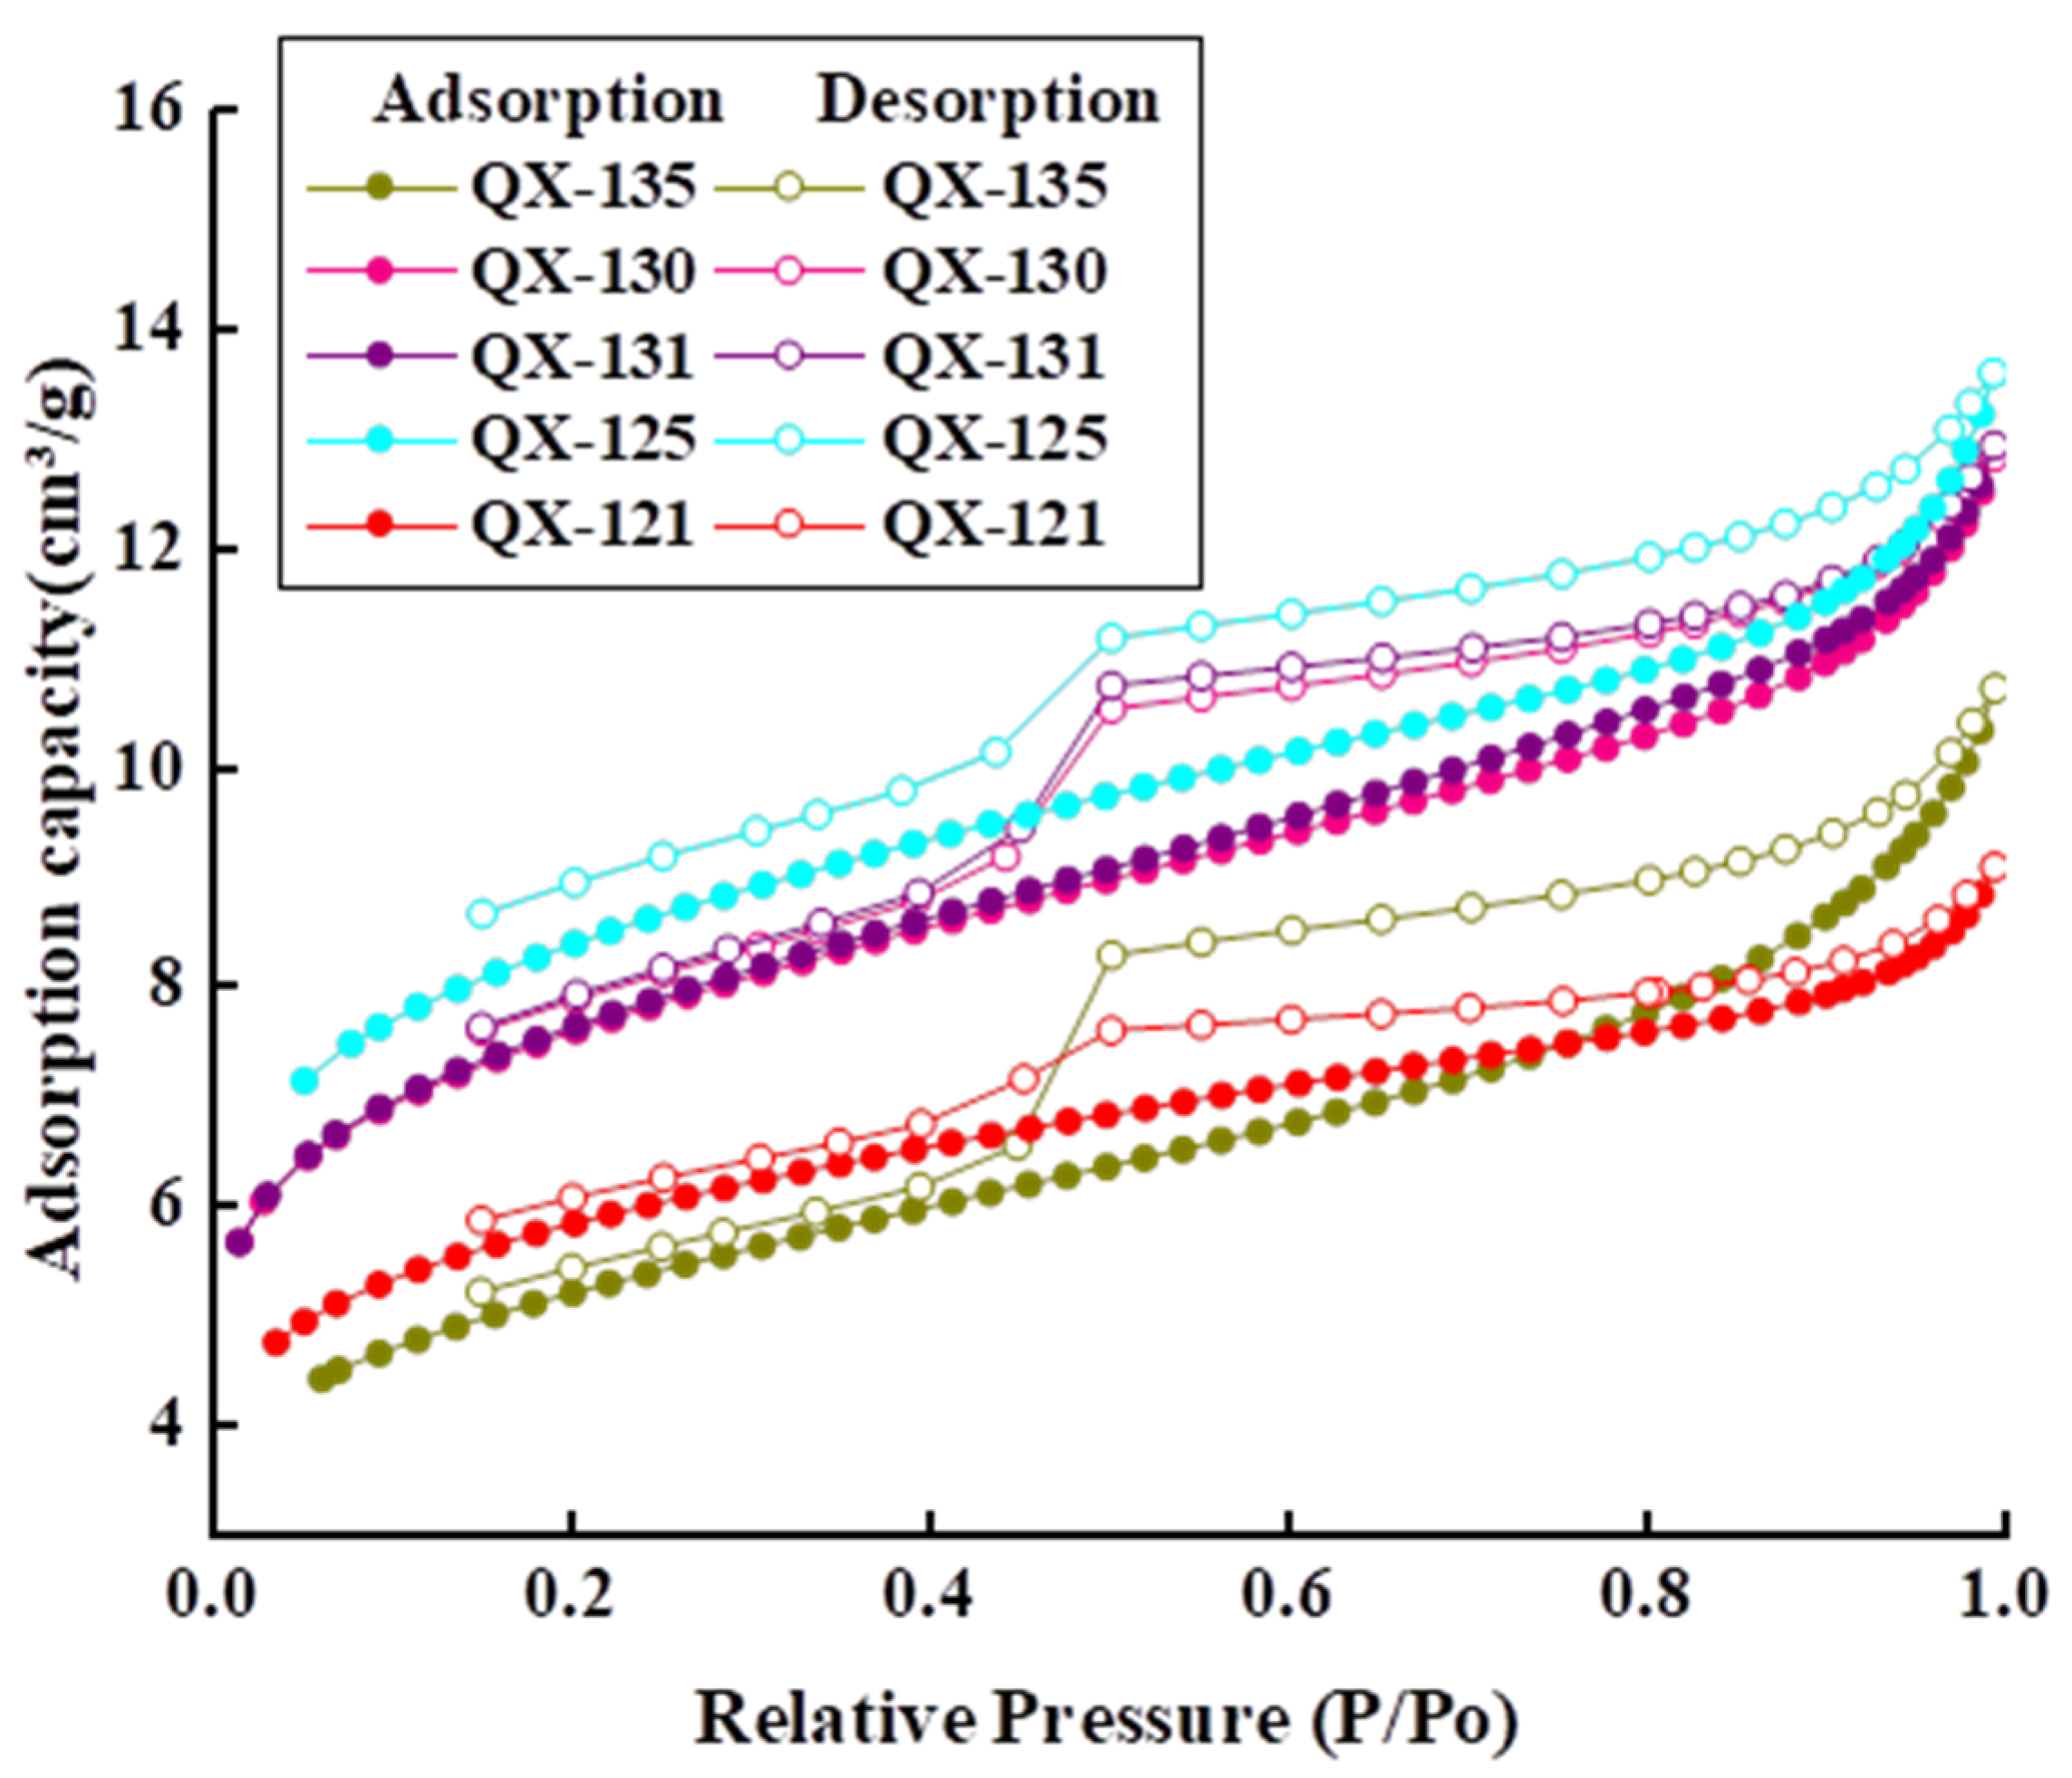
The nitrogen adsorption–desorption isotherms for Niutitang Formation shale samples from Well QX1 are presented in Figure 5. Following the International Union of Pure and Applied Chemistry (IUPAC) classification system [51], these isotherms exhibit Type IV characteristics, indicating a continuous and complete pore system in the shale of the study area, with a high proportion of mesopores [52]. The overall shape of the adsorption curve is an inverse-S morphology. In the low-pressure stage (P/P0 < 0.45), the adsorption curve is convex upward, with a small amount of adsorption, N2 molecules do not undergo irregular stacking in the micropores but fill the pores in a filling manner. When the relative pressure P/P0 approaches 0.45, an inflection point appears, and N2 molecules begin to undergo multilayer adsorption. Then, the curve approaches a linear change, and the adsorption amount increases with the increase in relative pressure. When 0.45 < P/P0 < 0.9, the adsorption curve is concave downward, and the adsorption amount begins to increase rapidly, indicating that the pores corresponding to this pressure range are more developed.
Regarding the desorption isotherm, the desorbed volume decreases rapidly at high relative pressures. As the relative pressure decreases to 0.9, the desorption curve decreases linearly and slowly. A distinct inflection point emerges around a relative pressure of 0.5, where the desorption volume transient acceleration occurs before stabilizing again. Desorption hysteresis is evident in all shale samples, forming a hysteresis loop with the adsorption branch, which suggests capillary condensation of N2 molecules within the mesopores. Based on the 2015 IUPAC classification of hysteresis loops [51], the hysteresis loops of the shale samples from the Niutitang Formation in the QX1 well are classified as H4 and H5 types, with pore shapes corresponding to plate-shaped intersecting conical microfractures or plate-shaped intersecting ink bottles, ellipsoidal, and beaded pores, which exhibit good connectivity, consistent with the observations from the FE-SEM experiment. Notably, sample QX-125 did not undergo significant pore closure, suggesting a higher abundance of micropores compared to other shale samples.

4.2.3. Integrated Characterization via HPMI and LTNA

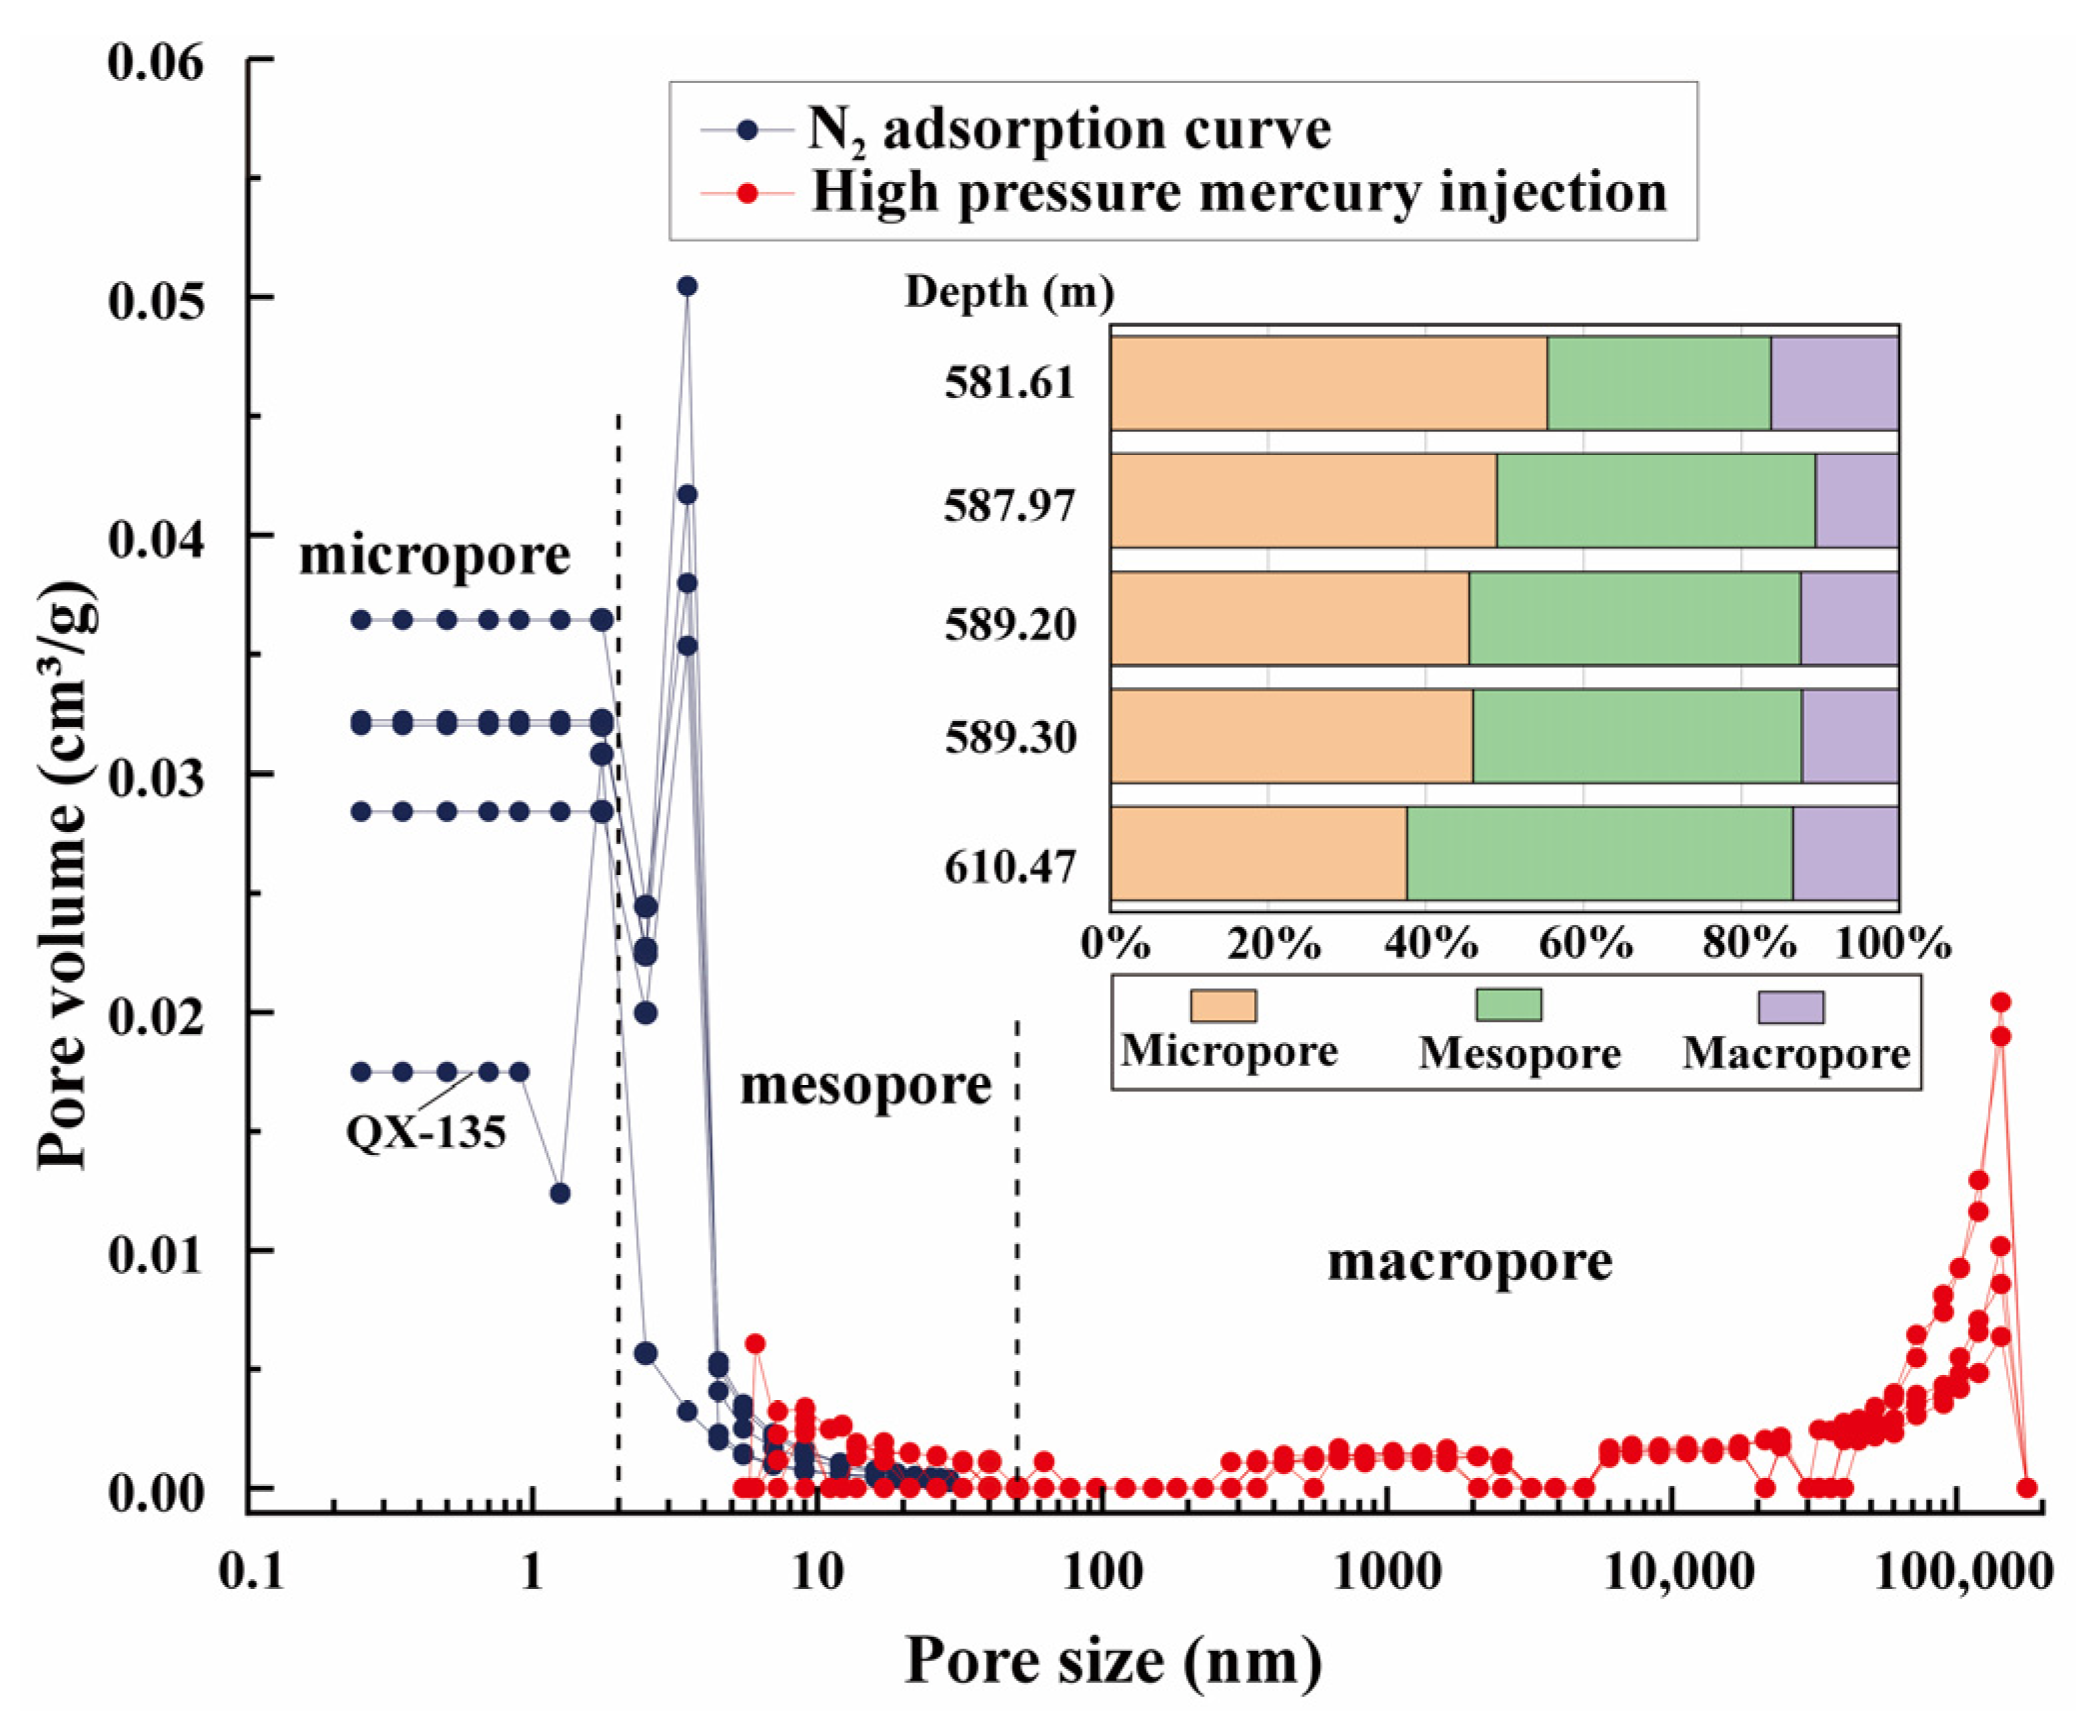
The pore size distribution characteristics of shale, determined through integrated analysis of LTNA and HPMI, are presented in Figure 6. Micropore distribution profiles were exclusively obtained from LTNA measurements, which is a conventional approach for characterizing microporosity in shale [53]. Mesopore size distribution data were obtained from both LTNA and partial HPMI experiments. As can be seen in Figure 6, all samples exhibited minimal inter-sample pore volume variation, with the highest pore volume observed in the 2.5–4.5 nm pore size range. Notable discrepancies exist between the data sets, attributed to the influence of surface energy on nitrogen adsorption and the direct pressure dependence of mercury intrusion, leading to differing filling behaviors in the two experimental methods; macroporous features were exclusively derived from HPMI measurements, which is a well-established technique for analyzing macroporosity [54,55].
Statistical analysis of full diameter pore structure parameters from Niutitang Formation shale samples in the QX1 well (Table 2) demonstrates a predominance of micropores and mesopores, with underdeveloped macropores, among others; sample of QX-135 has the smallest pore volume. The total pore volume ranges from 0.0141 to 0.0211 cm3/g, with an average of 0.0183 cm3/g. Micropore volume ranges from 0.0053 to 0.0097 cm3/g, with an average of 0.0086 cm3/g. Mesopore volume ranges from 0.0047 to 0.0088 cm3/g, with an average of 0.0074 cm3/g. Macropore volume ranges from 0.0019 to 0.0027 cm3/g, with an average of 0.0024 cm3/g. The corresponding specific surface area ranges from 18.0682 to 28.7736 m2/g, with an average of 23.9037 m2/g. Micropore specific surface area ranges from 7.8966 to 12.9752 m2/g, with an average of 10.7866 m2/g. Mesopore specific surface area ranges from 7.5975 to 14.9452 m2/g, with an average of 12.3879 m2/g. Macropore specific surface area ranges from 0.4966 to 0.8442 m2/g, with an average of 0.7274 m2/g. Notably, the average pore diameter of the shale decreases with increasing depth. This is attributed to the increasing overburden pressure with burial depth, which progressively compresses pores under increasing lithostatic pressure, leading to the reduction or closure of larger pores.

4.2.4. NMR Characterization

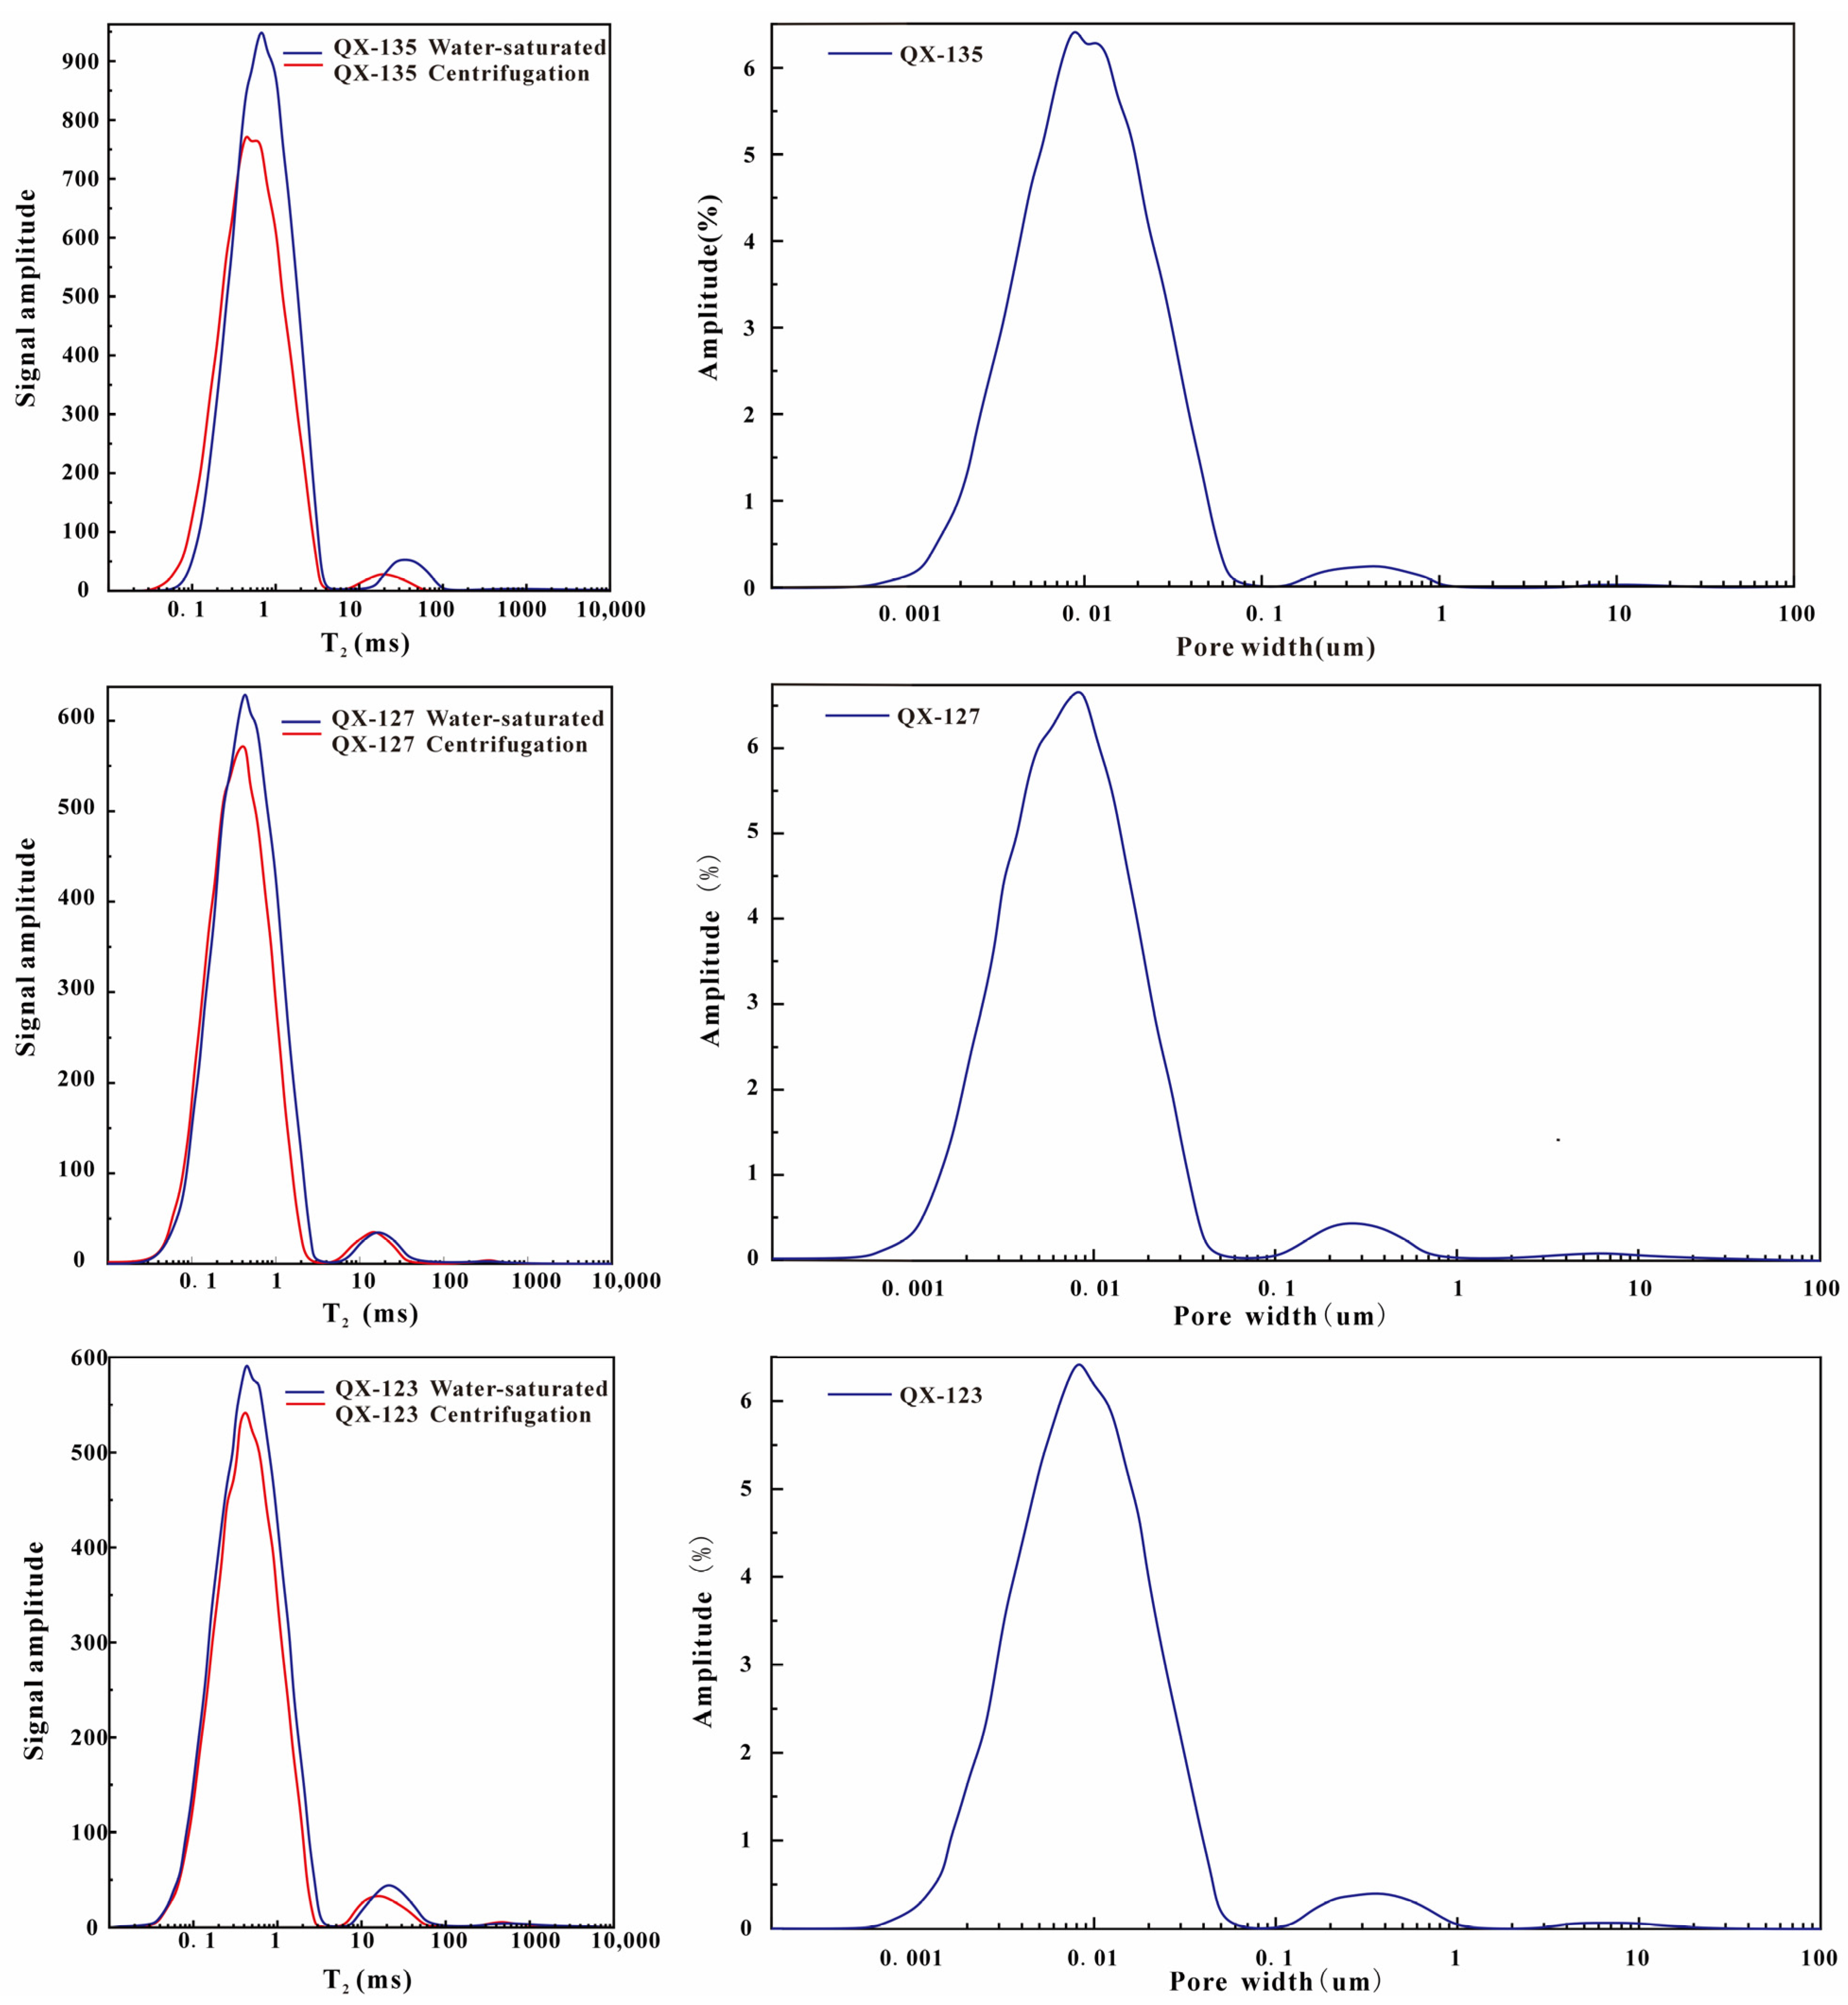
NMR experiments are conducted to measure and analyze the relaxation process of H nuclei in rock pore fluids to obtain pore structure parameters such as pore size distribution, porosity, saturation, and fluid flow conditions on a multiscale scale [19]. The samples were subjected to water saturation and compared with the results under centrifugal conditions. The T2 spectrum distribution curves of the NMR experimental results for samples QX135, QX127, and QX123 all generally exhibit a “three-peak” characteristic (Figure 7). To a certain extent, this reflects the complexity of the pore structure of the shale samples, but the NMR signals of different shale samples are different. The first peak (left peak) after water saturation is mainly distributed in the range of 0.01–4.04 ms, which corresponds to micro-mesopores (0.1–40.4 nm) after the relaxation time is transformed by using the theoretical model, and the signal amplitude is the maximum, which indicates that the corresponding pores are the most developed in this stage. The second peak (middle peak) is mainly distributed in the range of 5.337–100 ms, with a secondary signal amplitude, corresponding to macropores to microfractures (53.37–1000 nm), and the third peak (right peak) is mainly distributed in the range of 132.194–1873.817 ms, with the smallest signal amplitude corresponding to pore sizes of 1321.94–18,738.17 nm. The T2 spectrum confirms nanoscale pore dominance with subordinate microscale pores, consistent with FE-SEM observations.
The NMR signal measured from the water-saturated cores can be scaled using standard scale samples, which enable porosity quantification through signal conversion, and then the saturation of bound fluid and free fluid can be calculated from the test results after saturation and centrifugation. Analytical results demonstrate that Niutitang Formation shale samples from the QX1 well exhibit low porosity (Table 3), which is consistent with the results of HPMI experiments. In addition, the study also found that the cracks of QX135 samples increased significantly after being saturated with water, which is presumed to be due to the high content of clay minerals in the sample, and the expansion of the water when it enters into the clay interlayer leads to an increase in the original microfractures and even the generation of new cracks.
The water content of the shale samples generally decreases after centrifugation, and the sum of the peak areas of the T2 spectrum decreases to varying degrees (Figure 7). which is due to the loss of water during centrifugation and the effect of the magnetic field gradient so that the flowable signals were removed, leaving behind only the values of the bound-fluid signals, and these NMR signals were pore signals that were essentially ineffective in the transport and storage of shale gas [56]. Comparing before and after centrifugation, the degree of decline of the left peak in the T2 spectrum is significantly higher than that of the other two peaks, and the saturation of the sample’s flowability is inversely correlated to the saturation of bound fluid, reflecting that a large number of micropores and mesopores have been developed in the pores of shale samples, whereas macropores and microfractures are relatively few, which is consistent with the experimental results of the LTNA, and that the micropores and mesopores provide the main contribution to the pore space of shales.

4.3. Fractal Characteristics

4.3.1. Fractal Dimension Calculation Based on HPMI Data

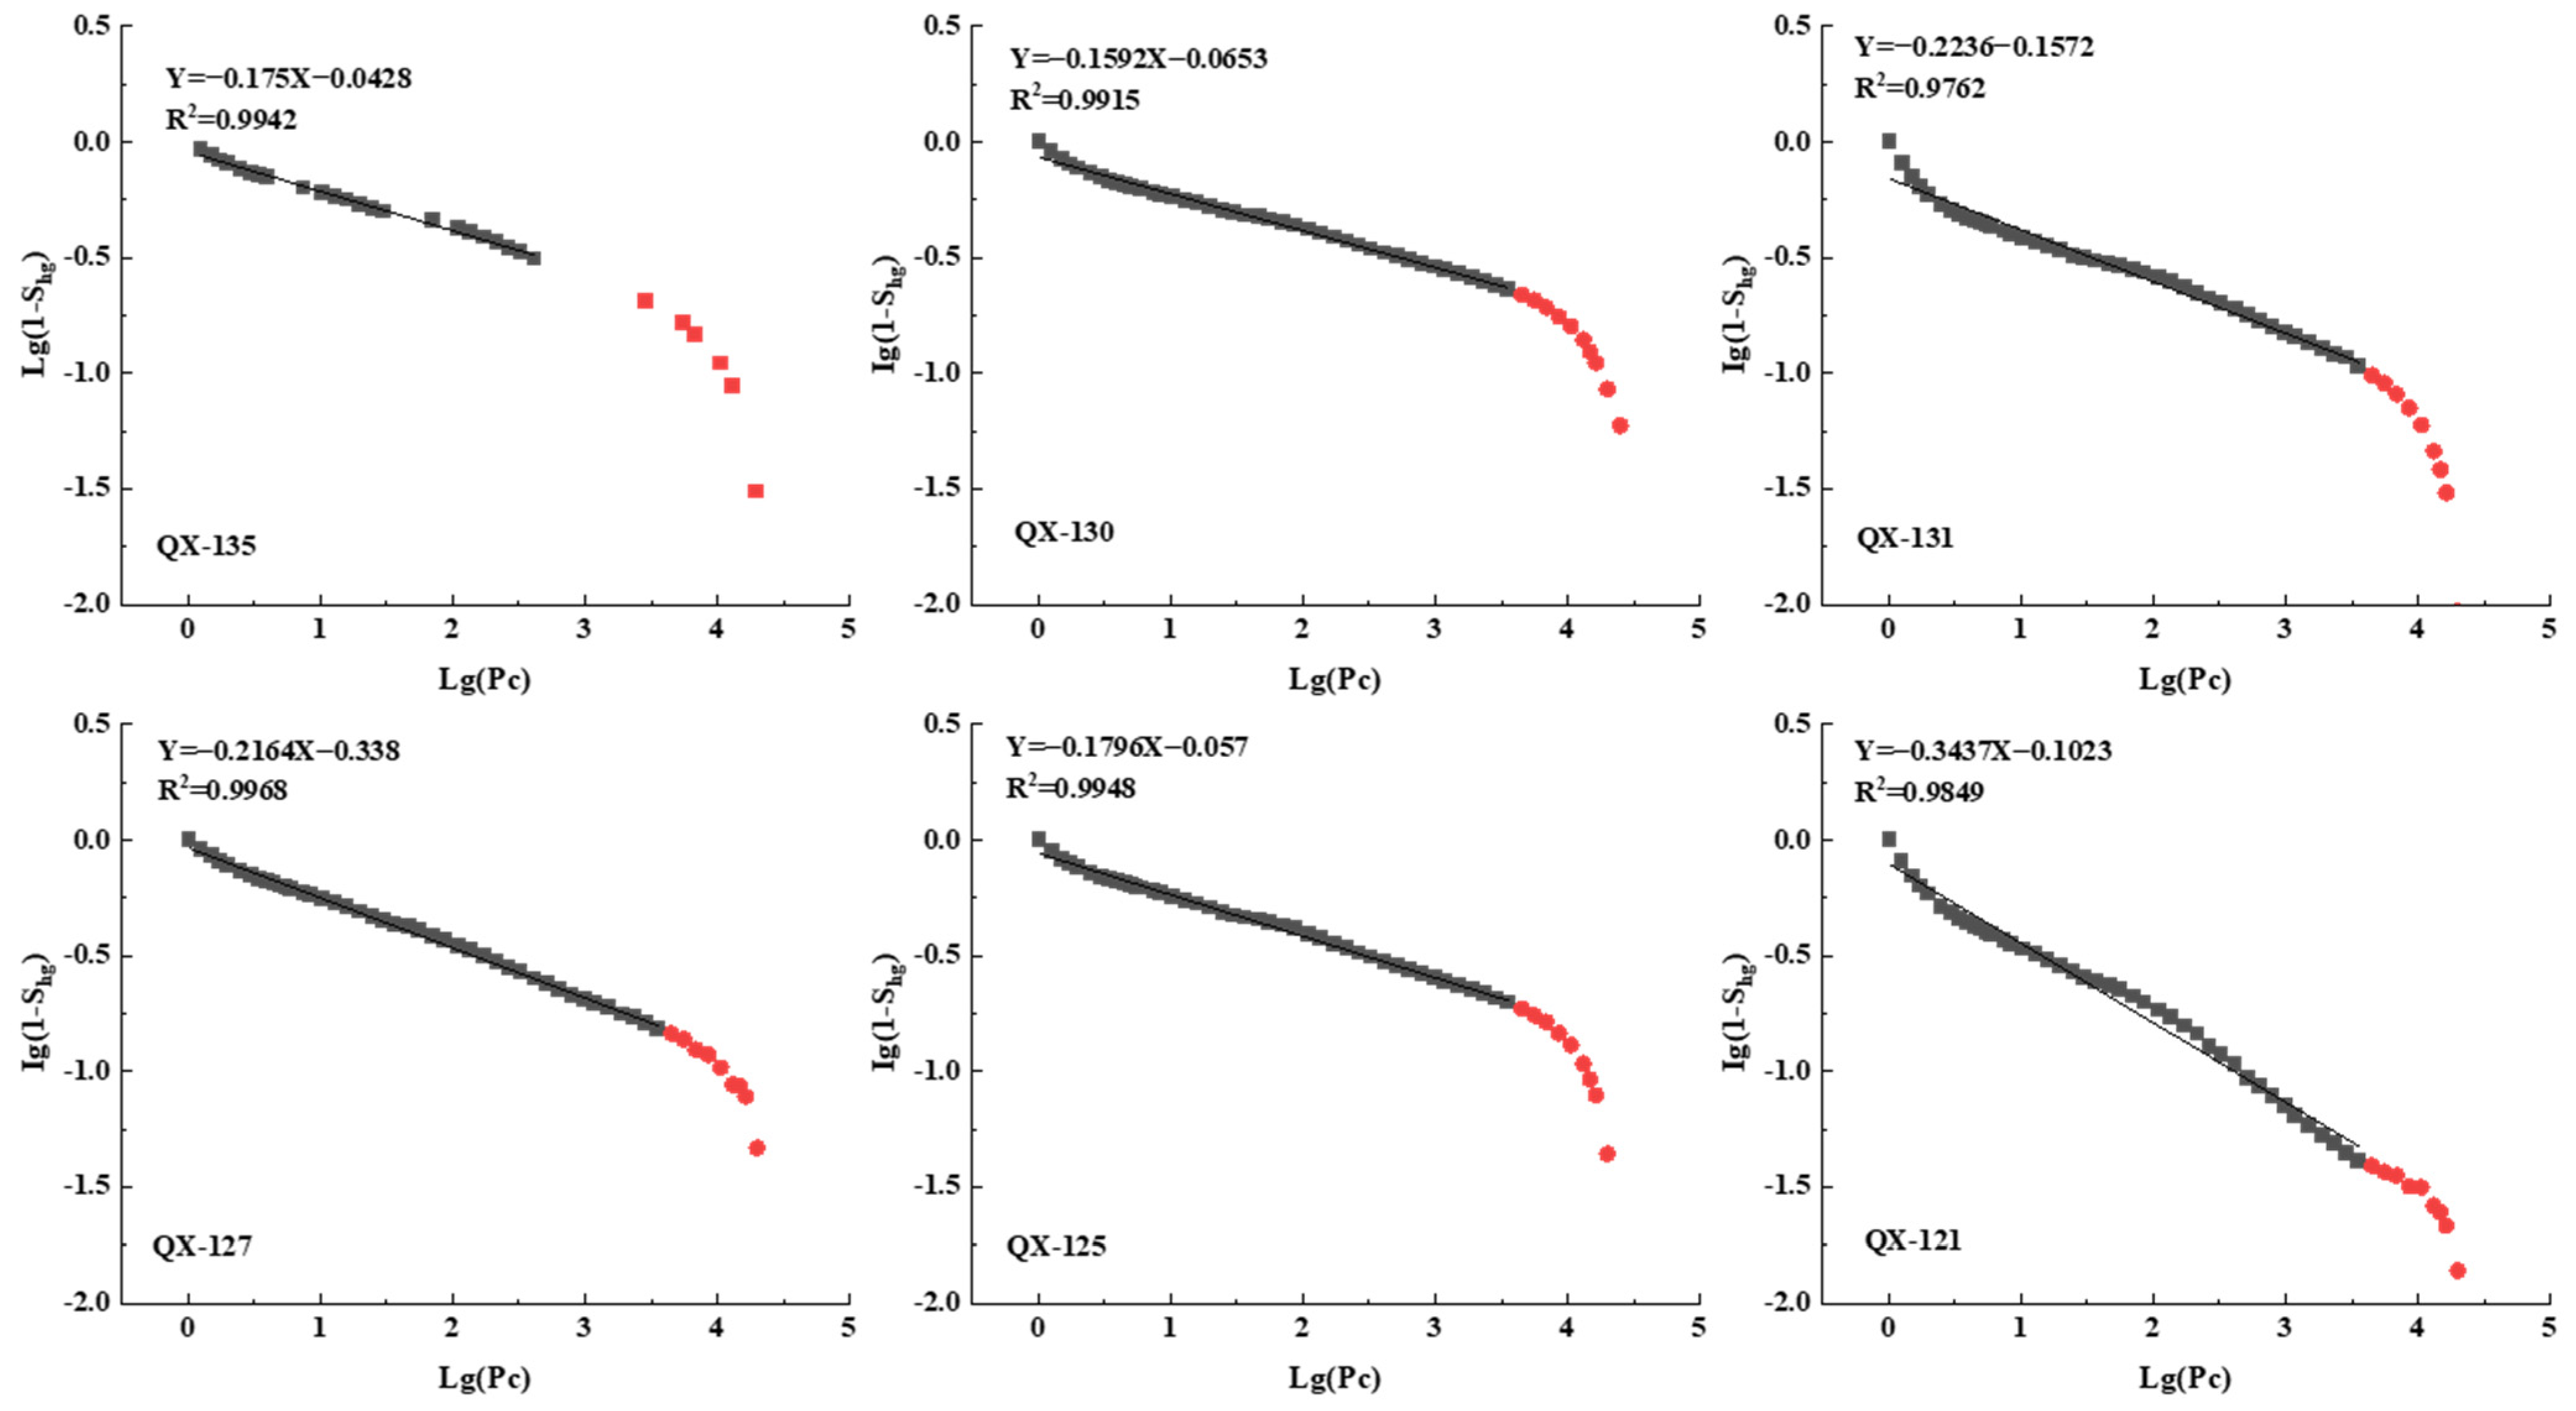
Based on the HPMI data, a cross-plot is generated using LgPC as the abscissa and Lg(1 − Shg) as the ordinate, according to Equation (1). Subsequent linear regression yields the fractal dimension (D = k + 3), where k is the slope of the fitted curve. The calculation results are shown in Table 4.
Quantitative analysis of Figure 8 reveals the relationship between Lg(1 − Shg) and LgPC exhibits two distinct stages, representing the macropore stage (>50 nm) and the mesopore stage (<50 nm), respectively. Table 4 indicates that the macropore fractal dimensions (D1) range from 2.6563 to 2.8408, with a mean value of 2.7782, while mesopore fractal dimensions (D2) range from 0.8091 to 2.1088, with a mean value of 1.4398. This suggests that the macropore structure of the shale is more complex and displays pronounced heterogeneity. Notably, D2 values predominantly below 2 fall outside conventional fractal theory parameters. Potential explanations include (1) inherent limitations of HPMI in characterizing small pores with reduced measurement accuracy; (2) the possibility that under high-pressure conditions, the clay minerals or organic matter pores in the shale may be compressed or even closed, and the relationship between intrusion volume and pressure no longer follows fractal theory.

4.3.2. Fractal Dimension Calculation Based on LTNA Data

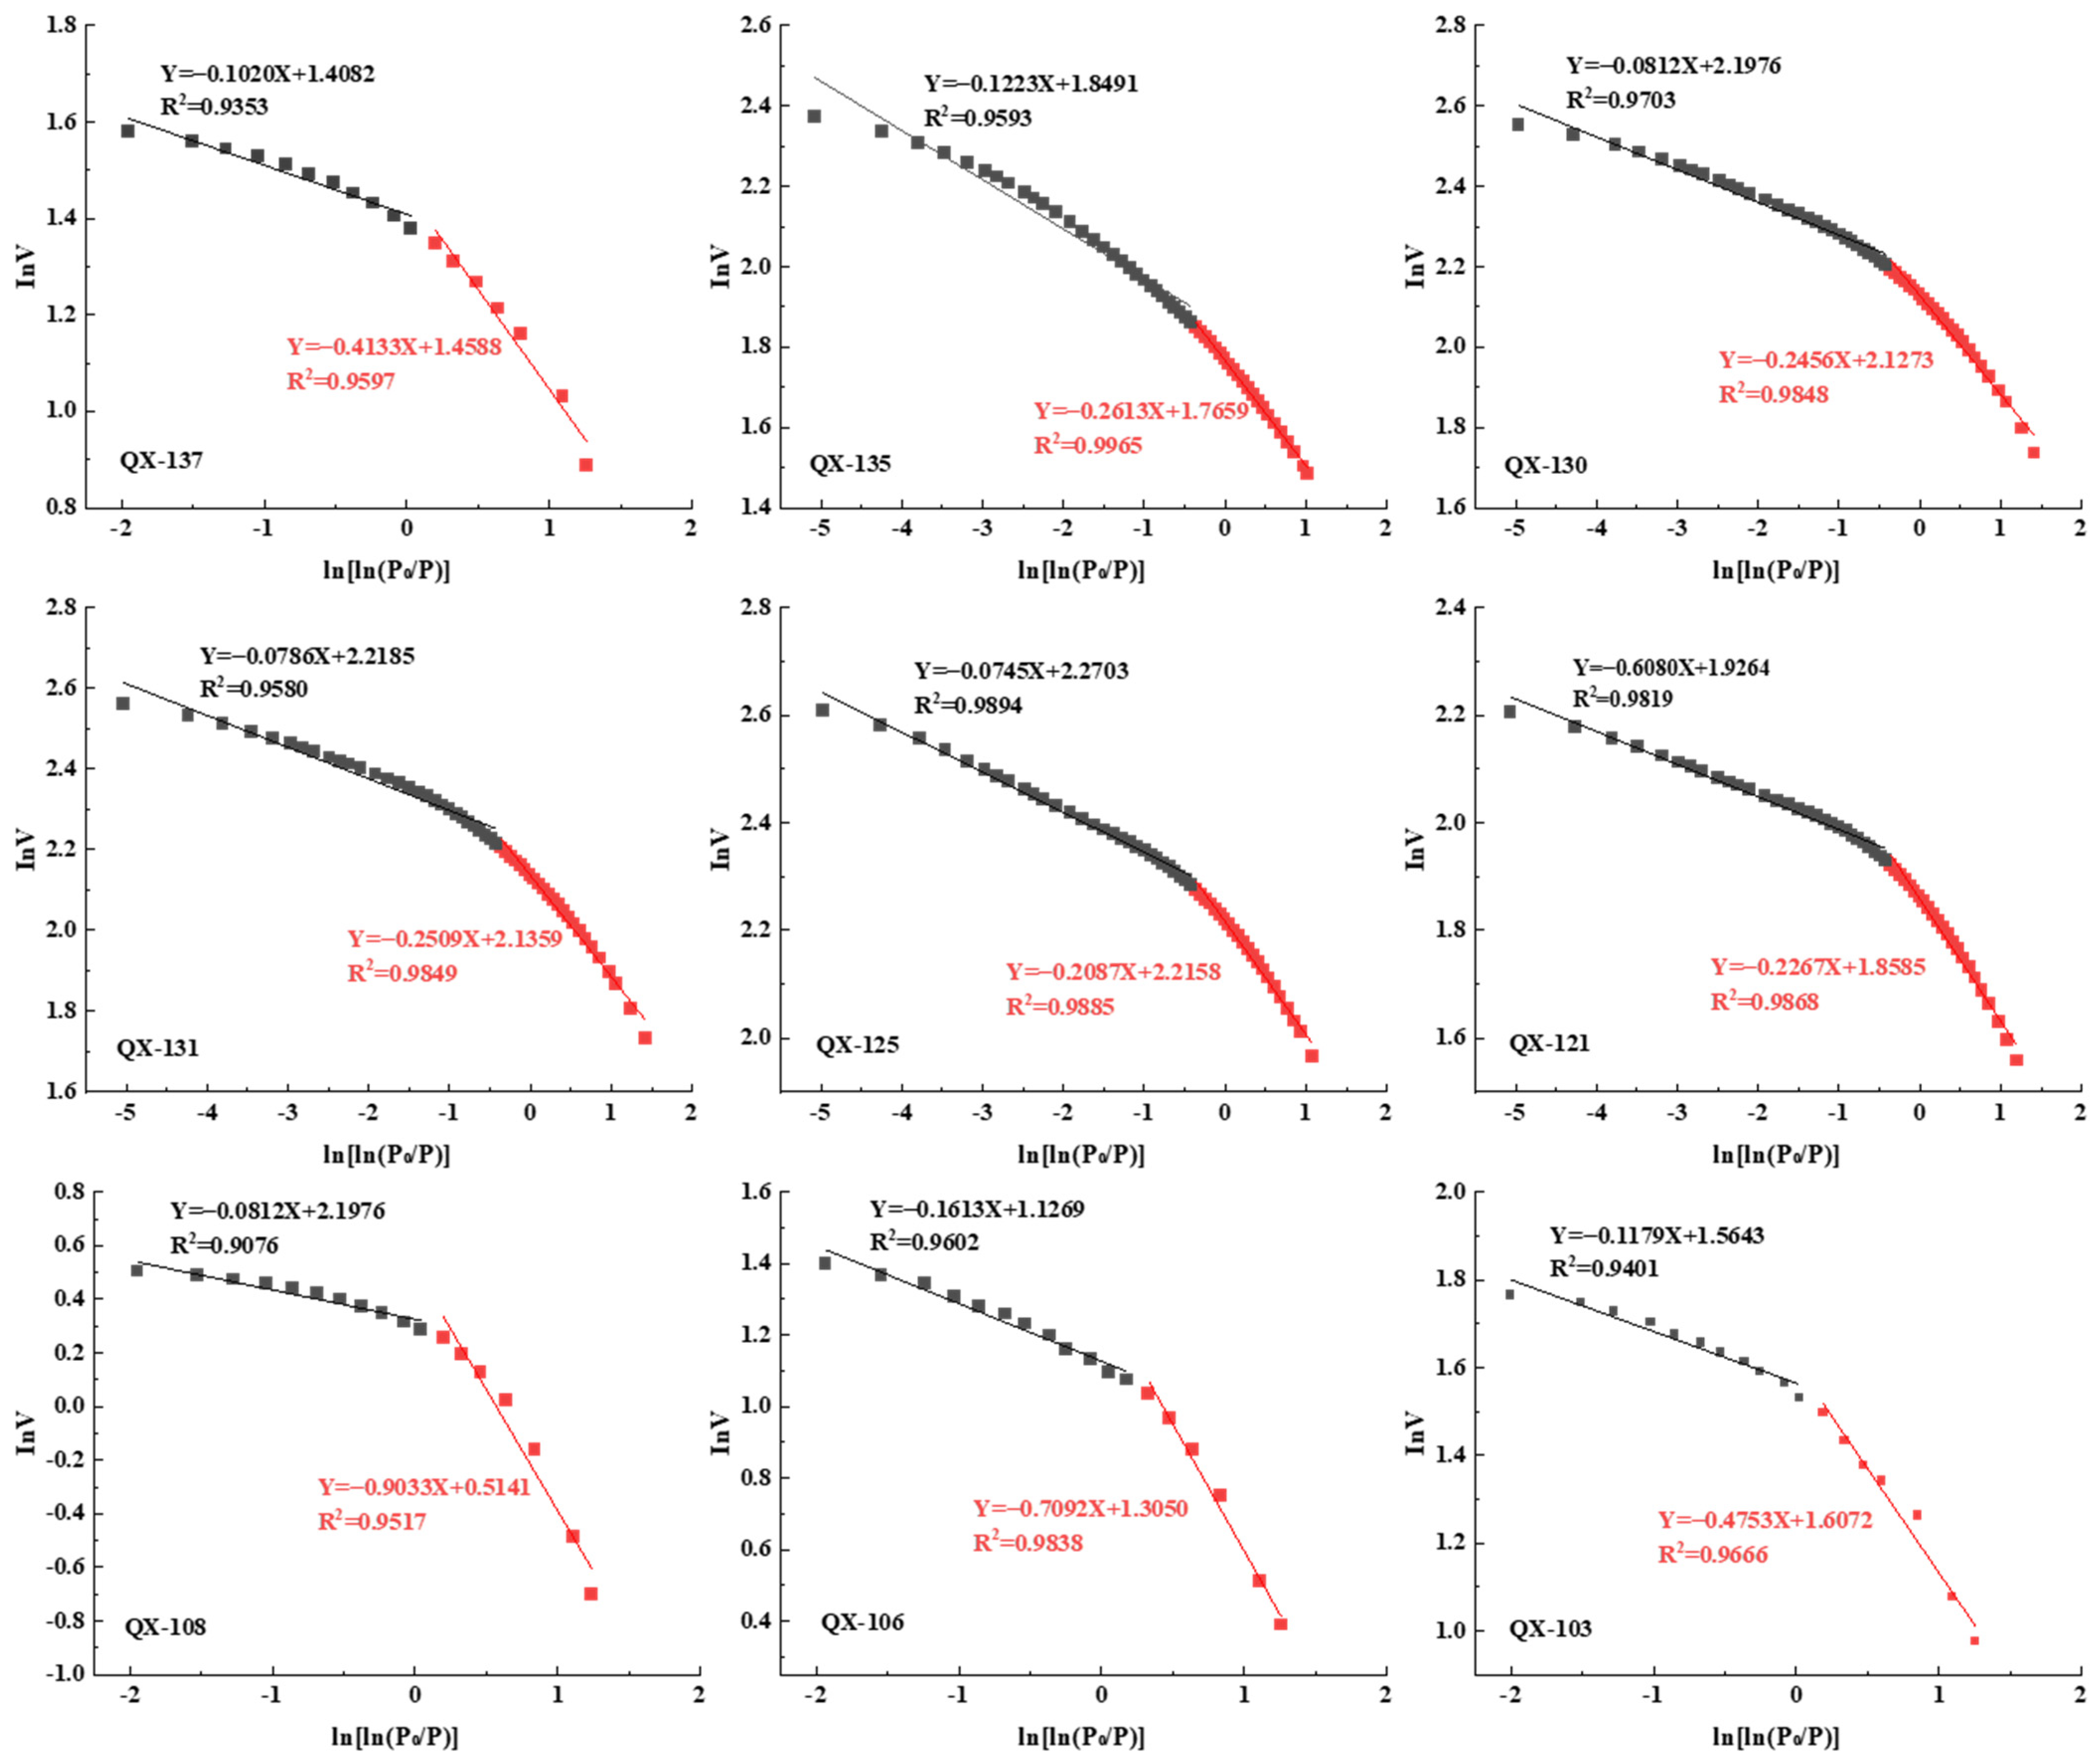
The analytical protocol involved constructing logarithmic plots of lnV versus ln[ln(P0/P)] from LTNA data following Equation (2), which were subsequently subjected to linear regression analysis. The fractal dimension value is calculated as K + 3, where K is the slope of the fitted curve. Previous studies have shown that nitrogen molecules exhibit different adsorption mechanisms at different pressure ranges. In the low-pressure region (0 < P/P0 < 0.5), nitrogen molecules primarily undergo monolayer adsorption, governed by van der Waals interactions [38], and the fractal dimension D1 reflects the irregularity of the pore surface. In the high-pressure region (0.5 < P/P0 < 1), nitrogen molecules undergo multilayer adsorption or capillary condensation phenomena, and the fractal dimension D2 reflects the pore distribution and connectivity. This mechanistic differentiation necessitated segmented curve fitting (Figure 9). As tabulated in Table 5, D1 values range from 2.8777 to 2.9392, with a mean value of 2.8991, approaching the theoretical maximum of 3, indicating that the shale pore surface is relatively rough and highly irregular, providing a larger specific surface area, which is beneficial for shale gas adsorption. The fractal dimension D2 has a wider range, varying from 2.0967 to 2.7913, with a mean value of 2.5945. Overall, the fractal dimensions of the shales in the study area are relatively high, and the fractal dimensions are D1 > D2, indicating that the shale pore system is characterized by a rough surface and the pore network has a certain degree of connectivity.
In summary, this study employs HPMI and LTNA techniques to reveal the heterogeneity and connectivity of pore structures in the Niutitang Formation shale. These findings not only provide quantitative indicators for evaluating pore complexity in shale gas reservoirs within the study area but also enable preliminary estimation of their methane adsorption capacity. Future research could further integrate geological dynamic processes (including burial history, thermal maturation, and pressure regimes) with multi-scale numerical simulations to elucidate the spatiotemporal evolution mechanisms of shale pore structures. Such interdisciplinary investigations would establish a scientific foundation for decision-making in the efficient development of complex hydrocarbon reservoirs.

5. Influencing Factors on Pore Structure

Previous research results have shown that the pore development of shale is affected by multifactorial constraints, which are usually controlled by a variety of conditions coupled with interactions, and it is generally believed that the mineral composition, thermal maturity, organic matter composition, and tectonic modification are the key factors affecting pore development [1,57]. Furthermore, the influence of the same factor on pore structure exhibits certain variations across different time periods. This study primarily analyzes the influencing factors on the pore structure of the Niutitang Formation shale in northern Guizhou, integrating data from TOC content and whole-rock mineral composition analyses.

5.1. Influence of TOC on Pore Structure

During the diagenetic evolution of shale, organic matter undergoes pyrolysis and other reactions to generate substantial hydrocarbon gases, which leave numerous pores in the shale when they are expelled [58,59,60]. Previous studies have found that the TOC content of shale in different regions has varying impacts on pore structure parameters. For instance, Ross et al. [5] found in the study of Jurassic and Devonian–Mississippian shales that TOC content had a positive correlation with the microporosity development of shales; whereas Borjigin et al. [42] discovered through experimental analysis that the influence of TOC content on pore structure is staged: when TOC > 6%, TOC content is negatively correlated with porosity; when TOC < 6%, TOC content is positively correlated with porosity. This is because excessively high TOC content leads to a decrease in the overall compressive strength of the shale as brittleness decreases, consequently reducing porosity. Milliken et al. [61] also found in their study of Marcellus shale that the relationship between TOC content and porosity is complex; when TOC content reaches a certain threshold, the increase in porosity tends to plateau, and pore size significantly decreases.
The Niutitang Formation shales in northern Guizhou exhibit TOC contents ranging from 2.06% to 12.10%, with an average value of 5.64% [29]. Experimental data indicate a positive correlation between TOC and specific surface area (R2 = 0.645) (Figure 10a), but only a weak association with total pore volume (R2 = 0.362) (Figure 10b), which suggests that the TOC has an effect on the pore structure of shale in the Niutitang Formation. As TOC content increases, both the total pore volume and specific surface area of the shale correspondingly increase, but there was no obvious correlation between TOC content and porosity (Figure 10c). This may be attributed to the dominant role of inorganic pores, such as intergranular pores and dissolution pores, in controlling the porosity of the Niutitang Formation shale, thus weakening the relationship between TOC content and porosity, and it also further illustrates that the organic particles in the Niutitang Formation shale host a certain number of micro- and nanopores, but the organic matter pores are undeveloped.

5.2. Influence of Mineral Content on Pore Structure

5.2.1. Clay Mineral Content

Clay mineral content has been widely recognized as a critical determinant of shale pore architecture. However, clay minerals typically exhibit intricate physicochemical characteristics [62]. For instance, they undergo hydration-induced expansion, potentially leading to pore blockage, while the platy structure and arrangement of illite affect pore size and connectivity. Consequently, the impact of clay minerals on shale pore structure becomes intricate and variable. In the Lower Sha-4 Member of Damintun Sag, Wang et al. [63] observed an inverse correlation between clay content and total pore volume, yet a positive association with specific surface area. This is attributed to the increased clay mineral content leading to a lack of brittle framework in the reservoir, and the mechanical compaction collapses macropores, resulting in a decrease in pore volume. Contrastingly, Liu et al. [64] found a negative correlation between clay mineral content and pore specific surface area, suggesting that this is due to the excessive clay mineral content in the study area, which results in the blockage of small pores in the shale. Niutitang Formation shales in northern Guizhou exhibit relatively low clay content, with a wide range of variation from 4.44% to 30.15%, and an average of 16.20%. The composition is mainly illite and absent smectite [29]. This suggests that as burial depth increases, the increase in temperature and pressure causes the transformation of smectite into illite, and many secondary pores are formed during this transformation, which is conducive to the increase in porosity. However, Figure 11 shows that the clay mineral content has no significant correlation with pore volume and pore specific surface area, indicating that clay minerals do not directly control the development of pores. The reason for this phenomenon may be that the shale of the Niutitang Formation has undergone tectonic overprints, which have transformed the clay mineral-related pore system. These superimposed effects create non-unique correlations between clay abundance and pore parameters.

5.2.2. Carbonate Minerals Content

Carbonate minerals are usually considered to be closely related to the degree of shale pore development. However, most scholars’ consensus generally emphasizes their pore-inhibiting effects. For example, Chen et al. [65] found that in the early diagenetic stage, carbonate minerals can fill primary pores and fractures through calcium cementation, thus inhibiting the development of shale pores and microfractures. Bai et al. [66] also found in the study of deep shale that cementation increases with the increase of carbonate content, which reduces the number of shale pores and destroys both organic and intergranular pores. However, our analysis of Niutitang Formation shales in northern Guizhou reveals distinct positive correlations between carbonate content and both specific surface area (R2 = 0.905) and total pore volume (R2 = 0.729) (Figure 12a,b), contradicting conventional understanding [57,65,66,67]. This positive correlation phenomenon may occur for the following two reasons: on the one hand, it can be seen in Figure 12c that there is a certain positive correlation between the carbonate mineral content and TOC content, which may suggest carbonate minerals enhanced organic preservation during deposition, facilitating subsequent organic pore generation through thermal maturation; On the other hand, the generation of organic acids or CO2 from hydrocarbon generation can lead to the partial dissolution of carbonate minerals, such as calcite and dolomite, forming secondary dissolution pores, which will directly increase the volume of shale pores and increase the specific surface area due to the roughness of dissolution pore walls. In addition, carbonate rock minerals predominantly exist as microcrystalline or dispersed particles rather than dense cements, and their micropores contribute to a certain specific surface area.

6. Conclusions

This study integrates multifaceted characterization techniques—including FE-SEM, HPMI, LTNA, NMR, and fractal theory—to systematically analyze the pore structure and the effect of pore system complexity and heterogeneity, and mineral components on pore structure and fractal characteristics were studied in the Niutitang Formation in Well QX1, northern Guizhou. The key conclusions are as follows:
(1)
The mineral composition of the shale of the Niutitang Formation in Well QX1 is dominated by quartz and feldspar, and the pore types are mainly intergranular pores, intragranular pores, organic matter pores, and microfractures. Among them, the intergranular pores and intragranular pores are the most developed, while the organic matter pores are relatively few.
(2)
The N2 adsorption–desorption isotherms belong to type IV, and the types of hysteresis loops are H4 and H5, which correspond to plate-shaped intersecting conical microfractures or plate-shaped intersecting ink bottles, ellipsoidal, and beaded pores.
(3)
The pore size distribution showed a multi-peak distribution, with the most developed mesopores, followed by micropores and the least macropores.
(4)
The fractal dimension D1 > D2, indicates that the shale pore system is characterized by a rough surface and some connectivity of the pore network.
(5)
Mineral content is the main factor controlling the pore structure of the shale of the Niutitang Formation in northern Guizhou. Carbonate minerals enhance pore development by increasing brittleness, providing rigid support, and forming dissolution pores. The main controlling effect of the clay minerals on the pore volume and pore specific surface area of the shale is not obvious, possibly because the shale in the study area has undergone tectonic compression, which has modified the pore system associated with clay minerals, making the relationship between them complex. In addition, there is some effect of TOC on the pore structure of shale in the study area.

Author Contributions

Conceptualization, N.Z., D.Z. and Y.Y.; methodology, Y.Y. and N.Z.; software, Y.Y. and Y.C.; validation, X.F.; formal analysis, Y.Y., Z.Y. and N.Z.; investigation, Y.Y., W.D., Z.Y. and Y.C.; resources, D.Z. and Y.C.; data curation, N.Z.; writing—original draft preparation, Y.Y.; writing—review and editing, Y.Y. and N.Z.; supervision, N.Z.; funding acquisition, X.F. All authors have read and agreed to the published version of the manuscript.

Funding

This research was supported by the Guizhou Geological Exploration Fund Project (No. 520000024P0048BH10174M), and the Guizhou Science and Technology Projects (No. ZK[2023]192 and No. Gui. Sci. Plat. ZSYS[2024]002).

Data Availability Statement

Data are contained within the article.

Conflicts of Interest

All authors declare that there is no conflict of interest.

Abbreviations

The following abbreviations are used in this manuscript:
FE-SEMfield emission scanning electron microscopy
HPMIhigh-pressure mercury intrusion
LTNAlow-temperature nitrogen adsorption
NMRnuclear magnetic resonance
TOCTotal organic carbon

References

  1. Shang, F.; Miao, K.; Zhu, Y.; Wang, M.; Tang, X.; Wang, Y.; Gao, H.; Feng, G.; Mi, W. Pore structure, adsorption capacity and their controlling factors of shale in complex structural area. Coal Sci. Technol. 2023, 51, 269–282. [Google Scholar]
  2. Curtis, J.B. Fractured shale-gas systems. AAPG Bull. 2002, 86, 1921–1938. [Google Scholar]
  3. Loucks, R.G.; Ruppel, S.C.; Wang, X.; Ko, L.; Peng, S.; Zhang, T.; Rowe, H.D.; Smith, P. Pore types, pore-network analysis, and pore quantification of the lacustrine shale-hydrocarbon system in the Late Triassic Yanchang Formation in the southeastern Ordos Basin, China. Interpretation 2017, 5, SF63–SF79. [Google Scholar] [CrossRef]
  4. Zhang, L.; Li, Y.; Li, J.; Jin, Y. Accumulation conditions for shale gas and It′s future exploration of Silurian the Central-Upper Yangtze region. Dizhi Keji Tongbao 2011, 30, 90–93. [Google Scholar]
  5. Ross, D.J.K.; Bustin, R.M. The importance of shale composition and pore structure upon gas storage potential of shale gas reservoirs. Mar. Pet. Geol. 2009, 26, 916–927. [Google Scholar] [CrossRef]
  6. Guo, P.; Wang, D.; Wang, Z.; Huang, K.; Zhang, X.; Liu, Z. Investigation on the characteristics and development mechanism of shale gas reservoir. Dizhi Keji Tongbao 2012, 31, 118–123. [Google Scholar]
  7. Yang, R.; He, S.; Hu, D.; Zhang, H.; Zhang, J. Characteristics and the main controlling factors of micro-pore Structure the shale in Wufeng Formation-Longmaxi Formation in Jiaoshiba Area. Dizhi Keji Tongbao 2015, 34, 105–113. [Google Scholar]
  8. Xia, W.; Yu, B.; Wang, Y.; Sun, M. Study on the depositional environment and organic accumulation mechanism in the Niutitang and Longmaxi Formation, north Guizhou province:A case study of well Renye 1 and well Xiye 1. Mineral. Petrol. 2017, 37, 77–89. [Google Scholar]
  9. Zhang, P.; Huang, Y.; Zhang, J.; Wei, X.; Yang, J.; He, R.; Hu, Y. Difference analysis of hydrocarbon generation and reservoir capacity between the Cambrian Niutitang Formation and the Silurian Longmaxi Formation in Northwest Guizhou. Mar. Orig. Pet. Geol. 2019, 24, 83–90. [Google Scholar]
  10. He, H.; Xiao, J.; Yang, H.; Lan, Q.; Huang, M. Sedimentary environment and shale gas exploration potential of Lower Cambrian Niutitang Formation in northern Guizhou. Chenji Yu Tetisi Dizhi 2024, 44, 267–277. [Google Scholar]
  11. Zhang, D.; Zou, N.; Du, W.; Zhao, F.; Chen, Y.; Shi, F.; Wang, Y.; Lin, R. Geological features and evaluation of Niutitang Formation shale gas in Fenggang block, northern Guizhou. Tianranqi Diqiu Kexue 2022, 33, 886–898. [Google Scholar]
  12. Shen, Z.; Li, X.; Zhang, S.; Zhou, L.; Lai, H. Composition characterictic and nitrogen-rich of shale gas in Niutitang Formation, northern Guizhou area. Acta Geol. Sin. 2024, 98, 1867–1879. [Google Scholar]
  13. Yang, C.; Xie, H.; Gao, Z.; Luo, T.; Tian, J. Analysis of shale gas exploration potential in Zunyi area. Meitan Jishu 2022, 41, 97–100. [Google Scholar]
  14. Wu, C.; Liu, X.; Wei, Z.; Tuo, J. Mechanism of organic matter enrichment and organic pore development in the Lower Cambrian Niutitang shales in northern Guizhou. Earth Sci. Front. 2023, 30, 101–109. [Google Scholar]
  15. Zhou, F.; Zhao, L.; Wu, Z.; Xia, P.; Wang, K.; Ning, S.; Shi, H. Organic matter pore and its influencing factors in over-mature shale of the Niutitang Formation, northern Guizhou area. Tianranqi Diqiu Kexue 2025, 36, 240–256. [Google Scholar]
  16. Sun, W.; Zuo, Y.; Wu, Z.; Liu, H.; Zheng, L.; Shui, Y.; Xi, S.; Lou, Y.; Luo, X. The distribution characteristics of brittle minerals in the Lower Cambrian Niutitang Formation in northern Guizhou. J. Nat. Gas Sci. Eng. 2021, 86, 103752. [Google Scholar] [CrossRef]
  17. Ning, F.; Zou, N.; Zhang, D.; Wang, G.; Mu, Y. Shale characterization of the Lower Cambrian Niutitang Formation in northern Guizhou. Tezhong Youqicang 2020, 27, 62–67. [Google Scholar]
  18. Qin, C.; Yu, Q.; Liu, W.; Yan, J.; Zhang, H. Reservoir characteristics of organic-rich mudstone of Niutitang Formation in northern Guizhou. Xinan Shiyou Daxue Xuebao Ziran Kexueban 2017, 39, 13–24. [Google Scholar]
  19. Cao, Y.; Jin, Z.; Zhu, R.; Liu, K.; Liang, X. Progress and prospects in the research on pore structures of organic-rich mud shales. Chenji Yu Tetisi Dizhi 2024, 44, 231–252. [Google Scholar]
  20. Wu, S.; Zhu, R.; Cui, J.; Mao, Z.; Liu, K.; Wang, X. Ideas and prospect of porous structure characterization in unconventional reservoirs. Dizhi Lunping 2020, 66, 151–154. [Google Scholar]
  21. Ge, M.; Bao, S.; Shi, D.; Ma, Y.; Zhang, J.; Zhang, Q.; Zhang, L.; Lin, Y.; Wang, T. Multi−scale characterization of shale pore structure of Niutitang Formation in southeastern Guizhou and its influence on shale gas enrichment. Geol. China 2024, 51, 57–72. [Google Scholar]
  22. Zhu, H.; Jia, A.; Wei, Y.; Jia, C.; Jin, Y. Application of low-pressure gas adsorption experiment to characterizing pore structure of the shale. Dongbei Shiyou Daxue Xuebao 2017, 41, 36–45. [Google Scholar]
  23. Zhao, X.; Yang, Z.; Lin, W.; Xiong, S.; Xia, D. Fractal study on pore structure of tight sandstone based on full-scale map. Int. J. Oil Gas Coal Technol. 2019, 22, 123. [Google Scholar] [CrossRef]
  24. Lin, W.; Zhao, X.; Li, M.; Zhuang, Y. Pore Structure Characterization and Fractal Characteristics of Tight Limestone Based on Low-Temperature Nitrogen Adsorption and Nuclear Magnetic Resonance. Fractal Fract. 2024, 8, 8070371. [Google Scholar] [CrossRef]
  25. Han, C.; Li, G.; Dan, S.; Yang, Y.; He, X.; Qi, M.; Liu, G. Study of Fractal and Multifractal Features of Pore Structure in Tight Sandstone Reservoirs of the Permian Lucaogou Formation, Jimsar Sag, Junggar Basin, Northwest China. ACS Omega 2022, 7, 31352–31366. [Google Scholar] [CrossRef] [PubMed]
  26. Zhang, C.; Guan, P.; Zhang, J.; Liang, X.; Ding, X.; You, Y. A Review of the Progress on Fractal Theory to Characterize the Pore Structure of Unconventional Oil and Gas Reservoirs. Acta Sci. Nat. Univ. Pekin. 2023, 59, 897–908. [Google Scholar]
  27. Jiang, W.; Zhang, Y.; Ma, T.; Chen, S.; Hu, Y.; Wei, Q.; Zhuang, D. Pore Structure and Its Fractal Dimension: A Case Study of the Marine Shales of the Niutitang Formation in Northwest Hunan, South China. Fractal Fract. 2025, 9, 49. [Google Scholar] [CrossRef]
  28. Liu, K.; Ostadhassan, M.; Zou, J.; Gentzis, T.; Rezaee, R.; Bubach, B.; Carvajal-Ortiz, H. Multifractal analysis of gas adsorption isotherms for pore structure characterization of the Bakken Shale. Fuel 2018, 219, 296–311. [Google Scholar] [CrossRef]
  29. Yang, C.; Zou, N.; Zhang, D.; Chen, Y.; Du, W.; Zhu, B. Reservoir Characteristics and Exploration Potential Evaluation of Lower Cambrian Niutitang Shale in Northern Guizhou: A Case Study of Well QX1. Energies 2024, 17, 1166. [Google Scholar] [CrossRef]
  30. Dai, C.; Hu, M.; Chen, J.; Wang, M.; Wang, X. The important geologic events of Guizhou province and its geologic significance. Guizhou Geol. 2015, 32, 1–9. [Google Scholar]
  31. Zhao, S. The Structural Features and Lower Paleozoic of Black Shale Fracture Characteristics and Distribution in Qianbei Area. Master’s Thesis, China University of Geosciences, Beijing, China, 2013. [Google Scholar]
  32. Lin, R.; Wang, Y.; Shi, F.; Liu, D.; Zhang, D.; Feng, X.; Zhou, Z.; Chen, Y.; Zhao, F.; Zhang, Z.; et al. Breakthrough and revelation of ultra-shallow shale gas exploration in complex structural area of northern Guizhou: Taking Well RX1 as an example. Geol. China 2023, 50, 1–25. [Google Scholar] [CrossRef]
  33. Shu, L. An analysis of principal features of tectonic evolution in South China Block. Dizhi Tongbao 2012, 31, 1035–1053. [Google Scholar]
  34. Xie, G.; Jia, D.; Zhang, Q.; Wu, X.; Shen, L.; Lu, Y.; Zou, X. Physical modeling of the Jura-type folds in eastern Sichuan. Acta Geol. Sin. 2013, 87, 773–788. [Google Scholar]
  35. Loucks, R.G.; Reed, R.M.; Ruppel, S.C.; And, D.M.; Jarvie. Morphology, Genesis, and Distribution of Nanometer-Scale Pores in Siliceous Mudstones of the Mississippian Barnett Shale. J. Sediment. Res. 2009, 79, 848–861. [Google Scholar] [CrossRef]
  36. Guo, R.; Xie, Q.; Qu, X.; Chu, M.; Li, S.; Ma, D.; Ma, X. Fractal characteristics of pore-throat structure and permeability estimation of tight sandstone reservoirs: A case study of Chang 7 of the Upper Triassic Yanchang Formation in Longdong area, Ordos Basin, China. J. Pet. Sci. Eng. 2020, 184, 106555. [Google Scholar] [CrossRef]
  37. Jin, L.; Guiwen, W.; Zhuoying, F.; Zhenglong, Z.; Jing, C.; Shuchen, W. Fractal analysis of tight shaly sandstones using nuclear magnetic resonance measurements. AAPG Bull. 2018, 102, 175–193. [Google Scholar]
  38. Shi, D.; Xu, Q.; Guo, R.; Liu, E.; Zhu, D.; Wang, Y.; Wang, B.; Ouyang, Z. Pore structure characteristics and main controlling factors of Permian organic-rich shale in Lower Yangtze Region. Tianranqi Diqiu Kexue 2022, 33, 1911–1925. [Google Scholar]
  39. Loucks, R.G.; Reed, R.M.; Ruppel, S.C.; Hammes, U. Spectrum of pore types and networks in mudrocks and a descriptive classification for matrix-related mudrock pores. AAPG Bull. 2012, 96, 1071–1098. [Google Scholar] [CrossRef]
  40. Xue, B.; Zhang, J.; Tang, X.; Yang, C.; Chen, Q.; Man, X.; Dang, W. Characteristics of microscopic pore and gas accumulation on shale in Longmaxi Formation, northwest Guizhou. Acta Pet. Sin. 2015, 36, 138–149. [Google Scholar]
  41. Li, Y.; Hu, Z.; Liu, X.; Cai, C.; Mu, Y.; Zhang, Q.; Zeng, S.; Guo, J. The pore structure characteristics of deep shale in Longmaxi Formation of Luzhou area. Duankuai Youqitian 2022, 29, 584–590. [Google Scholar]
  42. Borjigin, T.; Lu, L.; Yu, L.; Zhang, W.; Pan, A.; Shen, B.; Wang, Y.; Yang, Y.; Gao, Z. Formation, preservation and connectivity control of organic pores in shale. Pet. Explor. Dev. 2021, 48, 687–699. [Google Scholar] [CrossRef]
  43. Zeng, W.; Ding, W.; Zhang, J.; Li, Y.; Wang, R.; Jiu, K. Analyses of the characteristics and main controlling factors for the micro/nanopores in Niutitang shale from China’s southeastern Chongqin and northern Cuizhou regions. Earth Sci. Front. 2019, 26, 220–235. [Google Scholar]
  44. Zeng, T.; Fang, Y.; Nan, Y.; Yao, Y. Study on pore structure characteristics of the typical shale of Yanchang Formation and Longmaxi Formation. J. Eng. Geol. 2024, 32, 1176–1185. [Google Scholar]
  45. Wang, F.P.; Reed, R.M.; John, A.; Katherine, G. Pore Networks and Fluid Flow in Gas Shales. In Proceedings of the SPE Annual Technical Conference and Exhibition, New Orleans, LA, USA, 4–7 October 2009; Society of Petroleum Engineers: Richardson, TX, USA, 2009. SPE-124253-MS. [Google Scholar]
  46. Smyer, K.; Hamlin, H.; Eastwood, R.; Mcdaid, G. Variability of geologic properties of shale gas and tight oil plays. Trans. Gulf Coast Assoc. Geol. Soc. 2019, 69, 191–209. [Google Scholar]
  47. Wang, Y.; Zhu, Y.; Chen, S.; Li, W. Characteristics of the Nanoscale Pore Structure in Northwestern Hunan Shale Gas Reservoirs Using Field Emission Scanning Electron Microscopy, High-Pressure Mercury Intrusion, and Gas Adsorption. Energy Fuels 2014, 28, 945–955. [Google Scholar] [CrossRef]
  48. Yang, K.; Lu, X.; Xu, J.; Yin, H.; Hu, W. Preliminary verification of common calculation methods of pore size distribution of shale based on gas adsorption isotherm. Meitan Xuebao 2013, 38, 817–821. [Google Scholar]
  49. Yang, F.; Ning, Z.; Wang, Q.; Kong, D.; Peng, K.; Xiao, L. Fractal characteristics of nanopore in shale. Tianranqi Diqiu Kexue 2014, 25, 618–623. [Google Scholar]
  50. Zhao, D.; Guo, Y.; Xie, D.; Su, C.; Yang, Y.; Yu, Y. Fractal characteristics of shale reservoir pores based on nitrogen adsorption. Dongbei Shiyou Daxue Xuebao 2014, 38, 100–108. [Google Scholar]
  51. Thommes, M. Physisorption of gases, with special reference to the evaluation of surface area and pore size distribution (IUPAC Technical Report). Pure Appl. Chem. 2016, 87, 1051–1069. [Google Scholar] [CrossRef]
  52. Zhao, L. Pore-Fissures Characteristics of the Shale/Mudstone Reservoirs and Their Influence on Shale Gas Enrichment in Jiangxi Province. Master’s Thesis, China University of Mining and Technology, Beijing, China, 2015. [Google Scholar]
  53. Kuila, U.; Prasad, M. Specific surface area and pore-size distribution in clays and shales. Geophys. Prospect. 2013, 61, 341–362. [Google Scholar] [CrossRef]
  54. Rouquerol, J.; Baron, G.; Denoyel, R.; Giesche, H.; Groen, J.; Klobes, P.; Levitz, P.; Neimark, A.V.; Rigby, S.; Skudas, R. Liquid intrusion and alternative methods for the characterization of macroporous materials (IUPAC Technical Report). Pure Appl. Chem. 2011, 84, 107–136. [Google Scholar] [CrossRef]
  55. Fu, S.; Fang, Q.; Li, A.; Li, Z.; Han, J.; Dang, X.; Han, W. Accurate characterization of full pore size distribution of tight sandstones by low-temperature nitrogen gas adsorption and high-pressure mercury intrusion combination method. Energy Sci. Eng. 2020, 8, 80–100. [Google Scholar] [CrossRef]
  56. Zhang, Y.; Li, X.; Chen, Y.; Wang, Y.; Xu, R. Research on pore structure and fractal characteristics of shale based on Nuclear Magnetic Resonance experiments-taking the Wufeng Formation-Longmaxi Formation of Well YT2 in Jingmen area as an example. Coal Geol. China 2023, 35, 26–33. [Google Scholar]
  57. Ye, Y.; Chen, W.; Wang, H.; Song, J.; Ming, Y.; Dai, X.; Li, Z.; Sun, H.; Ma, X.; Liu, T.; et al. Characteristics and determinants of shale reservoirs in the Upper Permian Dalong Formation, Sichuan Basin. Shiyou Yu Tianranqi Dizhi 2024, 45, 979–991. [Google Scholar]
  58. He, W.; Wang, M.; Wang, X.; Meng, Q.A.; Wu, Y.; Lin, T.; Li, J.; Zhang, J. Pore Structure Characteristics and Affecting Factors of Shale in the First Member of the Qingshankou Formation in the Gulong Sag, Songliao Basin. ACS Omega 2022, 7, 35755–35773. [Google Scholar] [CrossRef]
  59. Wu, S.; Zhu, R.; Cui, J.; Cui, J.; Bai, B.; Zhang, X.; Jin, X.; Zhu, D.; You, J.; Li, X. Characteristics of lacustrine shale porosity evolution, Triassic Chang 7 Member, Ordos Basin, NW China. Petroleum Explor. Dev. 2015, 42, 185–195. [Google Scholar] [CrossRef]
  60. Li, X.; Zhu, H.; Zhang, K.; Li, Z.; Wang, Z. Pore characteristics and pore structure deformation evolution of ductile deformed shales in the Wufeng-Longmaxi Formation, southern China. Mar. Pet. Geol. 2021, 127, 104992. [Google Scholar] [CrossRef]
  61. Milliken, K.L.; Rudnicki, M.; Awwiller, D.N.; Zhang, T. Organic matter–hosted pore system, Marcellus Formation (Devonian), Pennsylvania. AAPG Bull. 2013, 97, 177–200. [Google Scholar] [CrossRef]
  62. Ji, L.; Zhang, T.; Milliken, K.; Qu, J.; Zhang, X. Experimental investigation of main controls to methane adsorption in clay-rich rocks. Appl. Geochem. 2012, 27, 2533–2545. [Google Scholar] [CrossRef]
  63. Wang, D. Study on Micro Pore Structure Characteristics and Controlling Factors of Shale Reservoir in Lower Sha4 Member of Damintun Sag. Master’s Thesis, Northeast Petroleum University, Daqing, China, 2022. [Google Scholar]
  64. Liu, W.; Li, S.; Liu, C.; Liu, J.; Xu, L.; Li, Y.; Zhong, K.; Wu, Q.; He, Y. Pore structure characteristics and influencing factors of deep shale gas reservoir in the Longyi 1 subsection of northern part of western Chongqing region, Sichuan Basin. China Sciencepap. 2025, 20, 1–14. [Google Scholar]
  65. Chen, X.; Yuan, K.; Qin, Y.; Lin, T.; Jin, C.; Pan, W.; Guo, J.; Cao, S. Shale lithofacies characteristics and its influence on pore structure of the Carboniferous Dawuba Formation in Liupanshui area, Guizhou Province. Mar. Orig. Pet. Geol. 2021, 26, 335–344. [Google Scholar]
  66. Bai, L.; Gao, Z.; Wei, W.; Yang, B. A comparative study of the pore structure of deep–medium shale in the Longmaxi Formation of the southern Sichuan basin. Tezhong Youqicang 2023, 30, 54–62. [Google Scholar]
  67. Zhang, M.; Hu, M.; Wei, S.; Cai, Q.; Fu, W.; Shi, F.; Zhang, L.; Ding, H. Factors Controlling the Pore Development of Low-Mature Marine–Continental Transitional Shale: A Case Study of the Upper Permian Longtan Shale, Western Guizhou, South China. J. Mar. Sci. Eng. 2023, 11, 1862. [Google Scholar] [CrossRef]
Figure 1. Geological background of the study area [29]. (a) Location and regional geological map of the study area. (b) Location of the QX1 well.
Fractalfract 09 00524 g001
Figure 2. Composite histogram of the Niutitang Formation in Well QX1 [29].
Fractalfract 09 00524 g002
Figure 3. Electron microscopic images of different pore types in Niutitang Formation shale from Well QX1. (a) QX-108, 659.75 m, beaded quartz mineral intergranular pores. (b) QX-121, 610.47 m, intergranular pores at the edge of brittle minerals. (c) QX-135, 581.61 m, intergranular pores between quartz and calcite grains. (d) QX-117, 622.49 m, pores caused by groundwater erosion. (e) QX-123, 606.84 m, pores caused by groundwater erosion. (f) QX-137, 578.47 m, pyrite intergranular pores. (g) QX-103, 674.99 m, organic matter. (h) QX-106, 663.32, organic matter pores. (i) QX-127, 594.46 m, organic matter pores. (j) QX-125, 598.30 m, microfractures. (k) QX-131, 589.20 m, intergranular microfractures. (l) QX-130, 587.97 m, intergranular microfractures.
Fractalfract 09 00524 g003
Figure 4. High-pressure mercury compression curves of shale samples from the Niutitang Formation.
Fractalfract 09 00524 g004
Figure 5. Nitrogen adsorption–desorption isotherms for shale samples from the Niutitang Formation in Well QX1. Notes: The horizontal axis represents relative pressure (P/P0), where P is the equilibrium pressure in MPa, and P0 is the saturation pressure of nitrogen in MPa; the vertical axis indicates the volume of adsorbed nitrogen in cm3/g.
Fractalfract 09 00524 g005
Figure 6. The joint characterization of the pore structure of shale samples from the Niutitang Formation in Well QX1. Notes: The inset shows the percentage of pore content for samples of corresponding depths.
Fractalfract 09 00524 g006
Figure 7. Nuclear magnetic resonance (NMR) T2 distribution and pore size distribution.
Fractalfract 09 00524 g007
Figure 8. Fractal curve of high-pressure pressed mercury.
Fractalfract 09 00524 g008
Figure 9. Nitrogen adsorption fractal curve.
Fractalfract 09 00524 g009
Figure 10. Relationship between pore structure parameters and TOC content. (a) The relationship between specific surface area and TOC content. (b) The relationship between pore volume and TOC content. (c) The relationship between porosity and TOC content.
Fractalfract 09 00524 g010
Figure 11. Relationship between pore structure parameters and content of clay minerals. (a) The relationship between specific surface area and content of clay minerals. (b) The relationship between pore volume and content of clay minerals.
Fractalfract 09 00524 g011
Figure 12. Relationship between pore structure parameters and carbonate minerals content. (a) The relationship between specific surface area and carbonate minerals content. (b) The relationship between pore volume and carbonate minerals content. (c) The relationship between TOC and carbonate minerals content.
Fractalfract 09 00524 g012
Table 1. Pore-structure parameters of shale core samples measured by high-pressure mercury intrusion (HPMI).
SampleDepth (m)Total Pore Volume (cm3/g)Specific Surface Area (m2/g)Average Pore Diameter (nm)Porosity (%)
QX135581.690.00730.43566.81.8692
QX130588.050.00850.72846.62.2052
QX131589.300.00940.317119.22.3373
QX127594.570.00600.31576.01.4556
QX125598.380.00830.51164.61.9635
QX123606.900.00680.28794.21.6823
QX121610.550.00910.147246.92.2825
Table 2. Pore structure parameters of microporous, mesoporous, and macroporous shale samples from the Niutitang Formation in Well QX1.
SampleDepthPore Volume (cm3/g)Total Pore Volume (cm3/g)Specific Surface Area (m2/g)Total Specific Surface Area (m2/g)Average Pore Diameter (LTNA) (nm)
MicroporeMesoporeMacroporeMicroporeMesoporeMacropore
QX-135581.690.00920.00470.00270.01669.65217.59750.818618.06823.6690
QX-130588.050.00970.00800.00210.019811.857113.56450.752126.17373.0307
QX-131589.030.00910.00840.00250.020011.552114.08280.725326.36033.0346
QX-125598.380.00970.00880.00260.021112.975214.94520.844228.77362.9223
QX-121610.550.00530.00690.00190.01417.896611.74960.496620.14282.7904
Mean593.540.00860.00740.00240.018310.786612.38790.727423.90373.0894
Table 3. Porosity and saturation results of shale core samples measured by nuclear magnetic resonance (NMR).
SampleVolume (cm3)Water-Saturated Porosity (%)Post-Centrifugation Porosity (%)Bound Fluid Saturation (%)Free Fluid Saturation (%)
QX-13512.0043.6282.78186.05113.949
QX-12712.0041.7991.61795.1544.846
QX-12314.3821.7351.45288.15111.849
Table 4. High-pressure mercury fractal fitting equations and fractal dimension.
SampleFractal Fitting Equations for High-Pressure Pressurized MercuryFractal Dimension
>50 nm<50 nmD1D2
QX-135y = −0.1705x − 0.0428y = −0.8912x + 2.51552.82752.1088
QX-130y = −0.1592x − 0.0653y = −2.1035x + 7.46932.84080.8965
QX-131y = −0.2236x − 0.1572y = −1.2588x + 3.72152.77641.7412
QX-127y = −0.2164x − 0.0338y = −2.1909x + 7.60742.78360.8091
QX-125y = −0.1796x − 0.0570y = −1.9646x + 6.8092.82041.0354
QX-121y = −0.3437x − 0.1023y = −1.2526x + 3.38412.65631.7474
Table 5. Nitrogen adsorption fractal fitting equations and fractal dimensions.
SampleNitrogen Adsorption Fractal Fitting EquationFractal Dimension
P/P0 < 0.5P/P0 > 0.5D1D2
QX-137y = −0.1020x + 1.1082y = −0.4133x + 1.45882.87772.7387
QX-135y = −0.1223x + 1.8491y = −0.2613x + 1.76592.89042.0967
QX-130y = −0.0812x + 2.1976y = −0.2456x + 2.12732.91882.7544
QX-131y = −0.0786x + 2.2185y = −0.2509x + 2.13592.92142.7491
QX-125y = −0.0745x + 2.2703y = 0.2087x + 2.21582.92552.7913
QX-121y = −0.0608x + 1.9264y = −0.2267x + 1.85852.93922.7733
QX-108y = −0.1096x + 0.3256y = −0.9033x + 0.51412.89802.5867
QX-106y = −0.1613x + 1.1269y = −0.7092x + 1.30502.83872.2908
QX-103y = −0.1179x + 1.5643y = −0.4753x + 1.60722.88212.5247
Disclaimer/Publisher’s Note: The statements, opinions and data contained in all publications are solely those of the individual author(s) and contributor(s) and not of MDPI and/or the editor(s). MDPI and/or the editor(s) disclaim responsibility for any injury to people or property resulting from any ideas, methods, instructions or products referred to in the content.