Abstract
The heterogeneity of shale pore systems, which is controlled by thermal maturation, fundamentally governs hydrocarbon storage and migration. Artificial sequence maturity samples of Xiamaling shale were obtained through a temperature–pressure simulation experiment (350–680 °C, 15–41 MPa). In combination with low-pressure CO2/N2 adsorption experiments, mercury intrusion porosimetry experiments and fractal theory, the heterogeneity of the pore size distribution of micropores, mesopores and macropores in shale of different maturities was quantitatively characterized. The results reveal that the total porosity follows a four-stage evolution with thermal maturity (Ro = 0.62–3.62%), peaking at 600 °C (Ro = 3.12%). Multifractal parameters indicate that areas with a low probability density are dominant in terms of pore size heterogeneity, while monofractal parameters reflect enhanced uniform development in ultra-over maturity (Ro > 3.2%). A novel Fractal Quality Index (FQI) was proposed to integrate porosity, heterogeneity, and connectivity, effectively classifying reservoirs into low-quality, medium-quality, and high-quality sweet-spot types. The findings contribute to the mechanistic understanding of pore evolution and offer a fractal-based framework for shale gas reservoir evaluation, with significant implications for hydrocarbon exploration in unconventional resources.
1. Introduction
Organic-rich shale is a source rock and reservoir for unconventional hydrocarbons, which is characterized by anisotropy, high heterogeneity, compositional complexity, and nanopore characteristics [1,2,3]. Shale pore systems, which are characterized by their intricate multi-scale architectures spanning from nanometers to micrometers, play a pivotal role in controlling hydrocarbon generation, storage, and migration [4,5]. The heterogeneity of pore structures—particularly in organic-rich shales—is intrinsically linked to thermal maturation processes, where organic matter pyrolysis and mineral diagenesis dynamically reshape pore networks [6,7,8]. However, quantifying such heterogeneity remains a formidable challenge due to the limitations of conventional petrophysical approaches in capturing the hierarchical complexity of nanopores.
Fractal theory has emerged as a powerful tool for describing the irregularity and self-similarity of pore structures, providing quantitative indices (e.g., the fractal dimension and multifractal spectrum width) for evaluating pore heterogeneity [9,10,11,12]. In recent years, monofractal theory has been extensively applied to characterize the petrophysical properties of unconventional reservoirs such as tight sandstones, coals, and shales [13,14,15,16]. The accompanying models include the Brunauer–Emmett–Teller (BET) model, Frenkel–Halsey–Hill (FHH) model, Menger model, capillary pressure model, and thermodynamic models [17,18,19,20,21]. While the monofractal dimension effectively quantifies the overall structural complexity and connectivity within macroporous domains, its utility becomes constrained when characterizing localized petrophysical features in complex nanoscale reservoir systems. This limitation primarily stems from the inability of single-scale fractal parameters to adequately capture the multi-scale heterogeneity inherent to nanoporous shale matrices. Multifractal theory is an extension of single-fractal theory. By partitioning complex fractal results into subintervals with identical singularity strengths, and conducting singularity strength and generalized fractal dimension analyses, it effectively captures the local complexity and heterogeneity of nanopore structures [22,23,24]. While contemporary research efforts have made significant strides in applying fractal-based analytical frameworks to the interpretation of adsorption isotherms and mercury intrusion porosimetry (MIP) datasets, prevailing investigations predominantly focus on monofractal behavior under static reservoir conditions [25,26]. A critical knowledge gap persists regarding how fractal features evolve across multiple pore scales (0.3 nm–100 μm) during thermal maturation. Understanding this multiscale evolution is essential for predicting shale reservoir quality over geological timeframes.
The generation of organic pores occurs throughout the hydrocarbon generation process, which is governed by the type of organic matter, thermal maturity, and diagenetic alterations [8,27]. Thermal simulation experiments establish a controlled methodological framework for replicating subsurface thermal stress and tracking pore structure evolution within laboratory settings. Wang et al. [28] conducted thermal simulation experiments (200–650 °C) on terrestrial shale from the Ordos Basin. Their study demonstrated that the primary factors influencing pore evolution are the hydrocarbon generation in organic matter, the transformation of minerals, and compaction effects. Song et al. [29] utilized semi-closed pyrolysis experiments and found that 350 °C and 450 °C represent threshold temperatures for the formation and evolution of nanopores. Xu et al. [30] further proposed the division of the diagenetic evolution of shale into four stages, and suggested that the increase in simulation temperature promoted the evolution of skeleton mineral pores, while it accelerated the development of internal pores and caused the marginal shrinkage of pores in organic matter. While previous works have investigated porosity changes with maturity [31,32,33,34], few have integrated mono-multifractal theory to decipher the dynamic interplay between the thermal evolution of organic matter thermal evolution and pore heterogeneity. Additionally, the Xiamaling Formation, a prospective shale gas target in North China, lacks systematic studies correlating its pore architecture with thermal maturity gradients.
Therefore, the study aims to reveal the law of evolution of the heterogeneity of multiscale pore structures in the process of gradual maturation of source rocks through fractal theory. Through an artificial thermal simulation, the porosity, specific surface area, pore volume distribution, and fractal dimension of Xiamaling shale were studied. The data on the MIP and LP-CO2/N2 GA were analyzed using a capillary pressure model and multifractal model, respectively, and the characteristics of the heterogeneity of shale pores in different stages of maturity were systematically evaluated. By correlating a variety of fractal parameters, this provides a new perspective for understanding the evolution of pore structures in the process of hydrocarbon generation and the evolution of source rocks. In addition, a new fractal quality index is proposed to contribute to the exploration and development, and evaluation of shale reservoirs and provide valuable insights for the exploration of unconventional resources.
2. Methodology
2.1. Samples
The hydrocarbon source rock samples used in this study were collected from fresh shale outcrops of the Xiamaling Formation (~1.37 Ga), which is part of the Upper Mesoproterozoic Qingbaikou System, and is located in the Yanshan region of North China. The sampling site is situated in the Xiahuayuan area of Zhangjiakou City, Hebei Province, China. While shale from the Lower Paleozoic Longmaxi Formation shale currently serves as a primary target for shale gas exploration, its organic matter has reached a high to over-mature thermal stage, rendering it unsuitable for acquiring natural maturity gradients. In contrast, the black shale of the Xiamaling Formation contains low-maturity organic matter and is widely regarded as a promising hydrocarbon source rock, as well as an ideal candidate for thermal simulation studies [35,36].
Thus, low-maturity shale from the Xiamaling Formation was selected for thermal simulation experiments, with a focus on the structural evolution of nanopores during thermal maturation. This strategy offers both methodological feasibility and scientific value. Fresh, large, and intact rock samples that were minimally affected by geological disturbances were obtained from the 3rd member of the Xiamaling Formation to minimize heterogeneity. Eight pre-experiment subsamples were uniformly cored from these bulk samples. The original sample (TS-Ori) was classified as Type I kerogen, with a vitrinite reflectance (maturity, Ro) of 0.62% and a total organic carbon (TOC) content of 4.25%, and it exhibited excellent hydrocarbon generation potential, making it an optimal candidate for hydrocarbon source rock research.
2.2. Experiments
2.2.1. Thermal Simulation
Thermal simulations of hydrocarbon generation were performed using a high-pressure reactor system developed by the Wuxi Petroleum Geology Research Institute of PetroChina Exploration and Development Research Institute. The experimental apparatus, illustrated in Figure 1, comprises five main components: a high-temperature and high-pressure reaction unit, a bidirectional hydraulic control system, an automated hydrocarbon product collection and fluid replenishment system, a centralized control platform, and auxiliary peripheral equipment. The system is capable of reaching temperatures up to 800 °C and fluid pressures up to 100 MPa. To simulate the complete thermal evolution of shale from low-maturity to over-mature stages, experiments were conducted at seven temperature intervals: 350 °C, 400 °C, 450 °C, 500 °C, 550 °C, 600 °C, and 680 °C, corresponding to samples TS-350 through TS-680. Heating was applied at a constant rate of 15 °C per hour, with each target temperature being maintained for 36 h. A closed aqueous system was employed to better replicate the subsurface geological conditions during hydrocarbon generation.
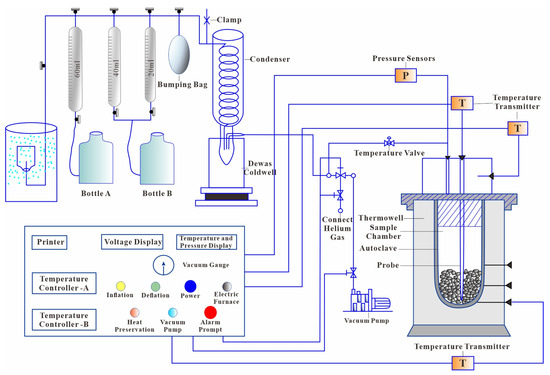
Figure 1.
Structural diagram of the device for the thermal simulation of hydrocarbon generation.
2.2.2. Multiscale Aperture Experiment
Fluid injection experiments are currently the most widely employed techniques for determining pore volume, specific surface area, and pore size distribution (PSD) parameters in shale [37,38,39]. MIP, LP-N2 GA, and LP-CO2 GA experiments each possess distinct advantageous testing ranges [40,41]. The combination of these three methods provides a more comprehensive and effective analysis of the multiscale nanopore characteristics of shale. An MIP experiment was conducted using an Autopore 9510 automatic mercury porosimeter (Micromeritics Instruments, Norcross, GA, USA), which allows a maximum intrusion pressure of 413 MPa. Pore structure parameters were calculated using the Washburn equation, which is suitable for characterizing pores with diameters greater than 50 nm. Both LP-N2 GA and LP-CO2 GA experiments were performed using an Autosorb-iQ automatic specific surface area and PSD analyzer from Quantachrome, Boynton Beach, FL, USA. The LP-N2 GA technique was conducted to characterize pores in the size range of 1.5 nm to 50 nm, while the LP-CO2 GA method focused on characterizing micropores smaller than 1.5 nm.
2.3. Fractal Theory
Fractal theory has been widely recognized as an effective tool for quantifying the pore surface roughness and heterogeneity of porous media [42]. Considering the differences in sample specifications between mercury intrusion experiments (which use bulk samples) and gas adsorption experiments (which use powder samples), as well as the significant differences in pore size calculation principles, different fractal models were applied for each. In this study, the capillary pressure fractal model was applied to the MIP data to characterize the fractal features of macropores (50 nm–10 μm). For mesopores (2–50 nm) and micropores (<2 nm), a multifractal approach was adopted using combined data from the LP-N2 GA and LP-CO2 GA experiments. This methodology enables a more nuanced and scale-sensitive assessment of the complexity of shale’s pore structure.
2.3.1. Monofractal Model of MIP
The essence of the capillary model lies in the relationship between pore size and capillary pressure. By applying geometric principles, the fractal dimension is determined through the relationship with the remaining mercury saturation. The calculation formula is as follows [26]:
where represents the cumulative mercury volume percentage in the pores with radii exceeding r, the mercury saturation (%); r is the pore radius (μm); rmax is the maximum pore radius (μm); is the fractal dimension, which is dimensionless. The can be calculated from the slope k between and , with the formula = 3 − k.
2.3.2. Multifractal Model of LP-CO2 GA and LP-N2 GA
The box-counting method is the foundation of multifractal analysis. For adsorbed gases, a pore size curve smaller than 50 nm can be treated as the “signal interval”. A set of boxes with different sizes, denoted by ε, are used to cover the signal interval and gather information. Each box is indexed with i, where N(ε) represents the total number of boxes of size ε required to cover the signal interval to be studied. The probability mass function of the i-th box can be calculated using the following equation [43]:
where is the volume of adsorbed gas in the i-th box (mL/g); is the total adsorption gas volume (mL/g).
The singular spectrum and dimension spectrum describing multifractal behavior are typically calculated using the Chhabra and Jensen equation [44]:
where q is an index representing the fractal characteristics of objects at different scales; is the probability cluster. The mass scaling function τ(q) is also an important parameter of multifractal behavior characterization, and it can be defined as follows:
Thus, the generalized dimension , which varies with the exponent q, can be expressed as follows:
It is worth noting that, when q = 1, is calculated using L‘Hospital’s rule, as follows:
The capacity dimension (D0), generalized dimension (D1), and correlation dimension (D2) correspond to the dimension values when q = 0, 1, and 2, respectively. The Hurst exponent (H) can be obtained from the correlation dimension with the formula H = (D2 + 1)/2, and it typically ranges between 0.5 and 1. Detailed steps for calculating the multifractal parameters can be found in our previous research [12].
3. Results
3.1. Pore Structure and Type
A suite of samples from the Xiamaling Formation spanning a range of thermal maturity levels was systematically prepared through controlled thermal simulation experiments under precisely regulated fluid pressure and temperature regimes. The experimental parameters of the samples are presented in Table 1. Following established maturity classification criteria [45,46], the samples were categorized into four distinct thermal evolution stages: low-maturity (0.5% < Ro < 0.7%), mature (0.7% < Ro < 1.3%), high-maturity (1.3% < Ro < 2.0%), and over-mature (Ro > 2.0%). The untreated original sample (TS-Ori) exhibited low-maturity characteristics with a measured Ro value of 0.62%. Progressive thermal simulation experiments demonstrated systematic maturation advancement, as evidenced by Ro values increasing from 1.04% at 350 °C to 3.62% at 680 °C, spanning the mature to over-mature domains. At 350 °C, sample TS-350 reached an Ro value of 1.04%, corresponding to the main oil generation window, where organic matter undergoes thermal decomposition to produce liquid hydrocarbons. Samples TS-400 and TS-450 reached Ro values of 1.83% and 2.04%, respectively, marking the high-maturity stage, which was dominated by the production of wet and condensate gases. In the over-mature stage, the Ro values of TS-500, TS-550, TS-600, and TS-680 gradually increased from 2.46% to 3.62%, representing a 47.2% increase, with organic matter entering the dry gas period. As shown in Figure 2, the maturity increase was initially gradual at 350 °C, but accelerated sharply at 400 °C. Beyond 450 °C, the maturity continued to increase steadily with further temperature elevation, reflecting the progressive transformation of organic matter through thermal maturation.

Table 1.
Evolution parameters of the pore structure while undergoing thermal maturation.
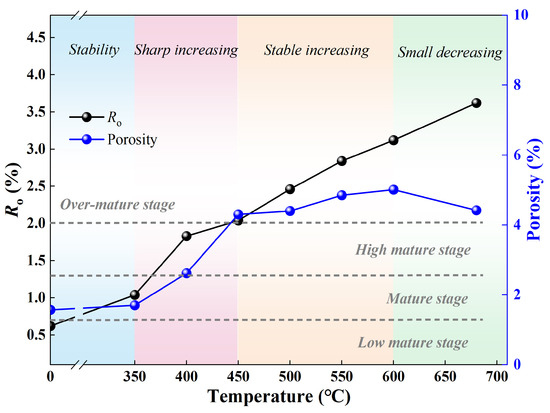
Figure 2.
The variation characteristics of the maturity and porosity of samples with temperature.
The porosity of both the original and thermally matured shale samples ranges from 1.57% to 5.01%, representing a maximum variation of 219.1%. The evolution of the porosity with the increase in the experimental temperature can be divided into four distinct stages, as illustrated in Figure 2. In the first stage, prior to heating at 350 °C, the porosity remains relatively stable. The second stage, spanning 350–450 °C, is marked by a sharp increase in porosity, with a growth of approximately 152.9%. The third stage (450–600 °C) shows a slower but continuous increase in porosity. In the fourth stage, at temperatures exceeding 600 °C, the porosity begins to decline gradually with further increases in thermal maturity. Notably, the peak porosity shifts toward approximately 600 °C as the simulation temperature rises. The trend of porosity variation with temperature is consistent with the findings of Xu et al. [30]. During the thermal evolution process, changes in porosity result from the synergistic effects of organic matter transformation, the development of organic pores, and the compaction and shrinkage of inorganic pores. Among these factors, hydrocarbon generation, hydrocarbon expulsion, and bitumen formation play key roles in influencing the pore structure [47,48].
3.2. Multiscale PSD Characteristics
The occurrence of multiphase shale oil and gas is closely governed by the multiscale pore architecture of the shale reservoir [49,50]. Source rocks typically develop a complex network of pores and fractures spanning from the nanoscale to the microscale. By integrating the strengths of LP-CO2 GA, LP-N2 GA, and MIP, a comprehensive and quantitative characterization of micropores, mesopores, and macropores can be achieved across distinct pore size ranges. As thermal maturity increases, pores within the source rock exhibit segment-specific evolutionary behaviors. Figure 3 presents the full-scale distribution of pore sizes ranging from 0.3 nm to 100 µm. The results indicate that larger pores contribute more substantially to the overall pore volume, with macropores accounting for the dominant share. Within the micropore domain, the average pore volume peaks in the 0.45–0.50 nm range. For pores smaller than 15 nm, the thermal maturity sample TS-550 consistently shows the highest pore volume across these size segments. In the 15–100 nm range, the pore volume peak shifts to the most mature sample, TS-680. However, for pore sizes exceeding 100 nm, the peak pore volume begins to migrate toward samples with lower maturity levels.
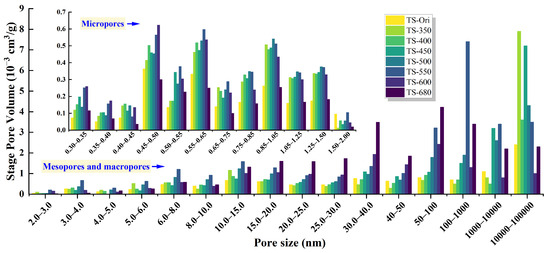
Figure 3.
The multi-scale PSD of the combined MIP, LP-N2 GA and LP-CO2 GA experiments.
The hysteresis loop formed by nitrogen adsorption and desorption isotherms is a characteristic marker for pore type characterization [20]. Figure 4a,b show the hysteresis loop curves for samples at the low- to high-maturity and over-maturity stages, respectively. With increasing thermal simulation temperature (T), a pronounced rise in adsorption is observed near the relative pressure (P/P0) of approximately 0.5. The total nitrogen adsorption capacity increases progressively with temperature, with sample TS-680 exhibiting the highest adsorption volume and the largest hysteresis loop area. This trend is likely attributed to a substantial increase in mesopore development, which enhances capillary condensation effects. Interestingly, the total nitrogen adsorption of sample TS-350 is lower than that of the original sample, TS-Ori. This reduction may result from the initial onset of hydrocarbon generation, during which large quantities of liquid hydrocarbons and bitumen are produced, potentially clogging mesopores and macropore throats. According to the IUPAC classification system, the pore types observed in both the original and thermally matured samples were predominantly of the H2 and H3 types, which are indicative of ink-bottle-shaped and slit-like (plate-like) pores. No consistent correlation between pore type and simulation temperature was identified, suggesting that pore geometry is influenced by additional factors beyond thermal evolution alone.
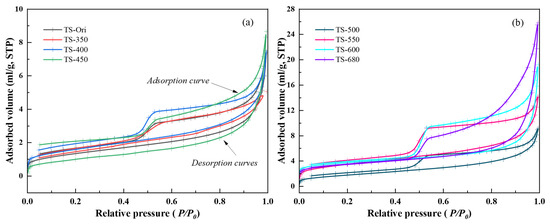
Figure 4.
Characteristics of the liquid nitrogen adsorption–desorption curve. (a) The samples in the low-maturity to high-maturity stages exhibited a lower adsorption volume. (b) The samples in the over-mature stage showed a high adsorption volume.
3.3. Monofractal Characterization of Macropores
Table 2 presents the fractal parameter calculation results for both the original and thermally simulated samples. From the fitting relationship between logr and log(1 − VHg) (Figure 5), it is evident that the fractal behavior of the macropore section exhibits a clear two-stage pattern. Based on a comprehensive analysis, the boundary point was set at a pore diameter of 1000 nm. In the single-fractal model, the fractal dimension D serves as a critical indicator of pore surface roughness, where higher values of D indicate greater structural complexity and heterogeneity. The parameters DT and DM, derived from capillary model calculations, represent the fractal dimensions for the 50–1000 nm and >1000 nm pore size ranges, respectively. The global fractal dimension DHg, reflecting the overall fractal characteristics of the macroporous domain, was determined by averaging DT and DM. The fractal calculation of the mercury intrusion data (pore size > 50 nm) yields a DHg value between 2.835 and 2.984 (with an average of 2.91), showing an incremental rate of 5.2%. The elevated fractal dimensions and low incremental rates suggest that macroporous surfaces exhibit high roughness and limited sensitivity of self-organized criticality to temperature–pressure perturbations.
Table 2.
Characteristics of the generalized dimension from all of the samples from CO2 and N2 adsorption.
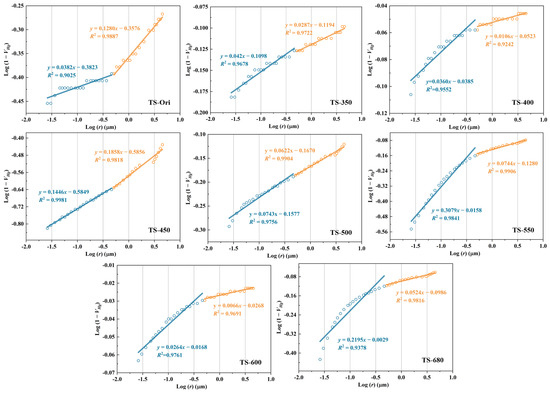
Figure 5.
The relationship between logr and log(1 − VHg) in the context of the MIP pore structure.
3.4. Multifractal Characterization of Micro- and Mesopores
Reasonable box sizes ε (2.5, 1.2, 1, 0.7, 0.3, and 0.2) were selected to calculate the multifractal behavior of the LP-CO2 GA and LP-N2 GA test results. Figure 6a shows the double logarithmic relationship between the partition function X(q, ε) and ε. In practice, the significant linear fitting relationship in the log-log plot of the partition function (the lowest R2 value is above 0.887) is for q > 0 and q < 0. The partition function with continuous q conforms to the power-law scaling, indicating that the PSD of the samples has a multifractal nature and can be further normalized through probability distribution parameter analysis. The parabolic-shaped singular spectrum and monotonically decreasing generalized dimension spectrum further confirm that both the original and artificially matured samples possess multifractal behavior (Figure 6b,c). A series of parameters related to the multifractal spectrum are listed in Table 2.

Figure 6.
Spectrum diagram of the multifractal characteristics. (a) Double logarithmic plot of X(q, ε) vs. ε for the PSD of sample TS-Ori. (b) The singular fractal spectra of the original sample and the samples used for the thermal simulation. (c) Generalized dimension spectra of the original sample and the samples used for the thermal simulation.
The singularity index α0 and the spectrum width αw are key fractal parameters in the singularity spectrum [12,51]. The spectrum width αw, calculated as the difference in α values between q = −10 and q = 10, was used to quantitatively characterize the heterogeneity of the pore structure. Sample TS-680 exhibited the highest α0 and αw values, indicating a markedly heterogeneous pore structure. The parameters D1 and D2 represent the information dimension and correlation dimension, respectively, with values ranging from 0.604 to 0.758 and 0.657 to 0.915. The Hurst exponent (H), calculated from D2, serves as an important metric for evaluating pore connectivity. Except for TS-680, all samples show H values above 0.89, reflecting the generally good pore connectivity of the Xiamaling source rock. The left and right widths of the generalized dimension spectrum, denoted as DL and DR, correspond to regions of low and high probability density in the pore volume distribution, respectively. The calculation results show that the DL for the samples (with an average value of 1.065) is significantly higher than the DR (with an average value of 0.199), indicating that the low-probability-density regions dominate the PSD heterogeneity. The high-dimensional values when q < 0 suggest that adsorption pores exhibit certain advantages in positive development. Both the original and thermally simulated sequence samples show varying degrees of increase and decrease in their multifractal parameters, with the nonlinear monotonic relationship reflecting the specificity of maturity at different stages.
4. Discussion
4.1. Analysis of the Porosity Evolution
The changes in pore structure, as indicated by the multiscale pore volume distribution and porosity characteristics, suggest that the pore structure evolution of the source rock occurs in multiple stages with increasing maturity. This progression is primarily driven by thermal transformation and hydrocarbon generation processes associated with organic matter. Figure 7a,b show the relationship between the specific surface area and pore volume of the samples at different scales as a function of maturity. A comparison of the specific surface area and pore volume among micropores, mesopores, and macropores reveals that the micropore section contributes the majority of the specific surface area, while the macropores predominantly determine the pore volume. The total porosity shows a quadratic parabolic relationship with increasing maturity, exhibiting a high degree of fit (R2 = 0.877) (Figure 8). By coupling the organic matter maturity with the temperature gradient, the evolution of the apparent pore parameters can be explained from the perspective of organic matter hydrocarbon generation.

Figure 7.
The variation characteristics of the pore structure with the evolution of maturity at the macropore, mesopore, and micropore scales. (a) Change curves of the pore specific surface area at different scales. (b) Change curves of the pore volume at different scales.

Figure 8.
Curve of the relationship between porosity and maturity.
During the initial hydrocarbon generation stage (Ro = 0.5–1.1%, temperature < 350 °C), the organic matter reaches the hydrocarbon generation threshold. A significant number of organic pores are formed, leading to a rapid increase in micropore volume and a sharp rise in specific surface area. Mesopores and macropores are subjected to mechanical compaction, which results in both compression and the sealing of pores, leading to increased fracture connectivity [30]. However, the large-scale generation of liquid hydrocarbons and asphaltenes can obstruct pore throats, complicating the evolution of the pore structure. As a result, despite significant internal changes, the overall variation in pore abundance during this stage is relatively limited.
In the rapid porosity development stage (Ro = 1.1–2.0%, temperature = 350–450 °C), a large number of organic matter pores accumulate. The generation of wet gas and condensate gas, along with the cracking of previously formed liquid hydrocarbons and asphaltenes, unblocks macropores and significantly enhances the total porosity.
In the synergistic pore growth stage (Ro = 2.0–3.0%, temperature = 450–600 °C), the maturity of organic matter reaches the threshold of over-maturity. The organic matter pores continue to form in large quantities as the sample enters the dry gas stage, while liquid hydrocarbons and asphaltenes undergo extensive cracking, reaching the peak of cracking. Micropores, mesopores, and macropores develop synergistically, each approaching relative peak values and contributing to a steady rise in total porosity.
In the porosity redistribution stage (Ro > 3.0%, temperature > 600 °C), mesopores and macropores continue to expand, whereas micropores exhibit a significant reduction. This decline may result from excessive temperature and pressure, which intensify the aromaticization of organic matter, rendering its molecular structure denser and more thermally stable. Such changes promote the shrinkage of the organic matrix and merging of micropore walls, leading to a reduction in micropore quantity and an increase in average pore size. This transformation facilitates moderate growth in mesopores and macropores. Additionally, pyrolytic degradation and thermal compaction contribute to the collapse and closure of micropores [52], representing a key factor in the observed decline in total porosity.
4.2. Fractal Evolution Analysis of Pore Structure
4.2.1. Monofractal Analysis of the Macropore Scale
The application of the capillary pressure fractal model to explain the macroscopic pore mechanisms of the samples helps to understand the relationship between the development of macropores and maturity changes during the hydrocarbon generation process in source rocks (Figure 9). As shown in Figure 9a, the fractal dimension (DT) of macropores in the 50–1000 nm range exhibits a strong negative correlation with the maximum macropore volume (R2 = 0.660). In contrast, the fractal dimension (DM) of pores and fractures larger than 1000 nm shows that there is no significant relationship correlation with macropore volume. This finding indicates that the maximum macropore volume was predominantly contributed by pores in the 50–1000 nm range. On the other hand, it could be attributed to the self-organizing criticality strength of the larger pore–fracture segments within the shale pore system. The fractal dimension indicates the self-organized criticality and heterogeneity of the pore size distribution. The overall negative correlation suggested that an increase in macropore volume favored the homogenization of macropore segment PSD, which was consistent with previous findings regarding the pore structure of Wufeng-Longmaxi shale [20].

Figure 9.
Evolution characteristics of the monofractal dimension. (a) The relationship between the fractal dimension and macropore volume. (b) The relationship between the fractal dimension DM and maturity.
Compared with DT and DHg, DM was significantly driven by thermal maturation processes and follows a two-stage fitting relationship. Prior to reaching the over-maturity threshold, DM increased linearly with thermal maturity, indicating that the PSD became increasingly complex (Figure 9b). This trend also suggested that larger macropores were highly sensitive to the effects of thermal maturity. Once over-maturity was attained, DM exhibited a parabolic regression relationship with thermal maturity (R2 = 0.871). Initially, as thermal maturity increased (Ro > 2%), the heterogeneity rose sharply. However, when Ro exceeded 3.2%, the heterogeneity gradually declined, indicating that excessively high maturity favored the uniform development of PSD. The sharp drop in DM around Ro = 2.0% was closely associated with the rapid increase in macropore volume at this critical stage. As organic matter entered the dry gas generation phase, the cracking and transformation of liquid hydrocarbons and asphaltenes further promoted the homogenization of the expanding macropore volume, which was consistent with earlier observations regarding pore evolution. Therefore, the critical over-maturity threshold (Ro = 2.0%) could be considered a critical boundary for the evolution of PSD heterogeneity in source rocks. The trends observed before and after this boundary often exhibited significant differences or even opposing developments, thus holding important implications for shale gas reservoir evaluation.
4.2.2. Multifractal Analysis of Micro- and Mesopore Scales
Pores in the micropore and mesopore segments smaller than 50 nm were considered the primary storage spaces for adsorbed and free gas [53]. By establishing a nonlinear regression relationship between multifractal parameters and maturity changes, this study investigated the response of PSD heterogeneity during thermal evolution (Figure 10). Except for DL and DR, all other multifractal parameters exhibited strong polynomial fitting relationship with thermal maturity (R2 > 0.86). The key parameters, α0 and αw, which characterize PSD complexity and heterogeneity intensity, demonstrated similar trends, each displaying a distinct peak and trough. A critical transition occurred near Ro = 2.0%, which was consistent with the fractal evolution characteristics observed in macropores.

Figure 10.
The relationship between multifractal parameters and maturity. (a) Polynomial fitting of the singular index α0 and maturity. (b) Polynomial fitting of the singular spectrum width αw and maturity. (c) Polynomial fitting of the Hurst index H and maturity. (d) Polynomial fitting of the left spectral width DL of the dimension spectrum and maturity. (e) Polynomial fitting of the dimension spectrum’s right spectral width DR and maturity.
Compared with the original sample, when thermal maturity reached approximately 1.0% (temperature approximately 350 °C), both α0 and αw increased slightly, while the Hurst exponent (H) decreased marginally. This behavior suggested that during the transition from low maturity to maturity, the heterogeneity of the micropore structural PSD increased, accompanied by the development of more complex pore surfaces, while the connectivity decreased, likely due to the blockage of pore throats caused by the generation of liquid hydrocarbons. At the same time, DL, representing the low-probability-density region, increased, while DR, representing the high-probability-density region, decreased. Changes in the multifractal dimension for q > 0 were attributed to the PSD of seepage pores, while those for q < 0 corresponded to adsorption pores. The variations in DL and DR indicated that the heterogeneity of adsorption pores was enhanced, while the distribution uniformity of seepage pores improved.
After entering the over-maturity stage (Ro > 2%), α0 and αw decreased slightly, followed by a rapid increase, while H exhibited a sharp decline after a relatively stable period. This phenomenon indicated that in the range of Ro = 2.0% to 2.7%, the development of organic matter pores and the synergistic formation of fractures from liquid hydrocarbons and asphaltenes peaked, resulting in higher pore volumes and greater PSD homogenization, a characteristic feature of sweet-spot reservoirs. However, once the thermal maturity exceeded 2.7%, significant differences in compaction led to the collapse and destruction of organic matter pores, causing a marked increase in heterogeneity and a pronounced decline in connectivity, ultimately detracting from the reservoir’s flow capacity.
4.3. Construction of the Fractal Quality Index and Its Geological Discussion
Porosity, pore heterogeneity, and connectivity were identified as key factors in the evaluation of shale gas reservoirs. Porosity determined the size of the storage space, while pore heterogeneity reflected the complexity of PSD, influencing both the uniformity of gas adsorption site distribution and local migration efficiency. Pore connectivity characterized the conductivity of the pore network, controlling gas seepage and pressure transmission, which mainly depended on the development of macropores and microfractures. The synergistic interactions among these three factors governed the gas occurrence states (adsorbed and free gas) and ultimately controlled reservoir productivity. Accordingly, by integrating multiscale fractal theory with dynamic pore evolution parameters, this study proposes the following Fractal Quality Index (FQI):
where φ represents porosity (%); the product of the Hurst exponent (H) and the macropore fractal dimension (DHg) indicates pore connectivity (dimensionless).
Porosity provides the fundamental basis for storage space, heterogeneity regulates gas distribution and adsorption efficiency, and connectivity governs gas mobility. An ideal reservoir requires a dynamic balance among these three factors. Therefore, the FQI is preliminarily proposed as a quantitative tool for evaluating reservoir quality. Reservoirs characterized by high porosity, high heterogeneity, and low connectivity corresponded to adsorption-dominated systems. In contrast, reservoirs exhibiting medium porosity, low heterogeneity, and high connectivity reflect seepage-dominated systems. The optimal sweet-spot reservoirs are characterized by high porosity, moderate heterogeneity, and high connectivity, offering a favorable balance between storage capacity and flow performance.
To investigate the evolution of the FQI with changes in thermal simulation maturity (or thermal simulation temperature), the fractal quality type patterns of different reservoirs and a regression relationship graph between the FQI and maturity were constructed (Figure 11). Based on the previous analyses of porosity evolution stages and the single-/multifractal characteristics of the PSD, three reservoir quality types were classified according to the FQI. Samples with an FQI greater than 8 were categorized as high-quality sweet-spot reservoirs; those with FQI values between 5 and 8 were classified as medium-quality reservoirs; samples with FQI values less than 5 were designated as low-quality reservoirs.
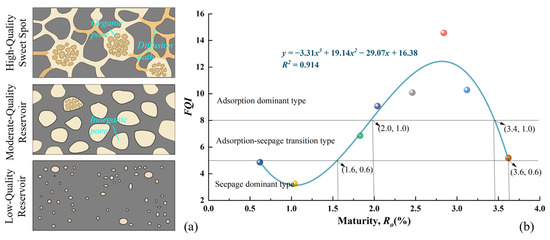
Figure 11.
The heterogeneous structural evolution model for shale pores. (a) Pore structure pattern maps of different reservoir types (high-quality desert reservoirs, medium-quality reservoirs, and low-quality reservoirs). (b) Evolution of the Fractal Quality Index (FQI) with maturity and reservoir type classification.
The intersection threshold between the partition lines and the sample regression fitting curve indicated that, during the low-maturity stage (Ro < 1.6%), organic matter primarily remained within the oil window. During this stage, organic pores were generated, pore size diversity increased, and macropores developed, resulting in adsorption gas domination and the classification of low-quality reservoirs. These reservoirs were characterized by adsorption-dominated systems, and CO2 injection could be considered to enhance desorption efficiency or for carbon sequestration during field development.
In the high-maturity and overmature stages (Ro ranges of 1.6–2.0% and 3.4–3.6%), the reservoirs were classified as medium quality. During the earlier phase (Ro = 1.6–2.0%), organic matter pores developed further and generated wet gas, while the heterogeneity slightly decreased, leading to an increase in the FQI and the emergence of seepage-dominated reservoir characteristics. In the latter high-maturity and over-mature stages (Ro = 3.4–3.6%), organic pores underwent compression and collapse, and the connectivity declined sharply; however, the heterogeneity remained low, resulting in an overall medium FQI classification. By contrast, source rocks entering the overmature dry gas stage (Ro = 2.0–3.4%) were considered high-quality sweet-spot reservoirs, primarily due to their high porosity, moderate heterogeneity, and medium to high connectivity.
Shale gas reservoir evaluation remains a significant challenge for industrial-scale development, particularly concerning the need for universal evaluation methods that are applicable across different thermal maturity stages. The FQI is preliminarily proposed to integrate porosity, heterogeneity, and connectivity, and it may guide future reservoir quality assessments pending broader validation.
5. Conclusions
In this study, the heterogeneity evolution characteristics of the pore structure of the Xiamaling Formation shale at different thermal maturities were systematically investigated through high-temperature and high-pressure thermal simulation experiments. The integration of fractal theory with the evolution of hydrocarbon generation in organic matter in source rocks provides a novel perspective on the quantitative characterization of thermal maturity and pore structure development. The main conclusions are as follows:
- The pore structure of Xiamaling shale exhibits a four-stage evolution with thermal maturity, primarily driven by organic matter transformation and hydrocarbon generation. The total porosity peaks at T = 600 °C, correlating with the synergistic development of organic and inorganic pores. The larger pore sizes contributed a greater proportion to the pore volume, with macropores contributing the most to the pore volume.
- The macropore surface exhibited high roughness and low sensitivity to temperature and pressure changes. Analysis of monofractal parameters indicated that ultra-overmaturity (Ro > 3.2%) was conducive to the uniform development of larger pore sizes. The singular spectrum and generalized dimension spectrum indicate that the PSD of the original sample and the thermal simulation sample have multifractal behavior. Multifractal analysis revealed that the low-probability-density regions dominated the PSD heterogeneity, and the adsorption pores exhibited a positive development advantage with increasing maturity. The development of organic matter pores and the synergy of liquid hydrocarbons and asphalt cracks reached the peak value at Ro = 2–2.7%, resulting in high homogenization of PSD in the case of high pore volume.
- The FQI is preliminarily proposed as a quantitative tool for evaluating reservoir quality. Classification based on FQI distinguishes high-quality sweet spots (FQI > 8), medium-quality reservoirs (5 < FQI ≤ 8), and low-quality reservoirs (FQI ≤ 5), providing valuable guidance for optimizing resource development strategies. High-quality sweet spot reservoirs (FQI > 8) are identified during the dry gas stage (Ro = 2.0–3.4%), which is characterized by optimal storage capacity and flow performance.
Author Contributions
Y.W.: Methodology, Writing—original draft, Funding acquisition. B.Z.: Conceptualization, Writing—review and editing. L.Y.: Investigation, Methodology. Y.Z.: Investigation, Formal analysis. J.X.: Software, Data curation. T.Z.: Data curation. H.Z.: Formal analysis. All authors have read and agreed to the published version of the manuscript.
Funding
This work was jointly supported by the National Natural Science Foundation of China (No. 42172156 and 42472222), the Fundamental Research Funds for the Central Universities (No. 2022YCPY0201), and Xuzhou Science and Technology Plan Project, Basic Science and Technology Project (KC22032).
Data Availability Statement
All of the data and models generated or used in this study are available from the corresponding author upon request.
Conflicts of Interest
The authors declare that they have no known competing financial interests or personal relationships that could have appeared to influence the work reported in this paper.
References
- Chalmers, G.R.; Bustin, R.M.; Power, I.M. Characterization of gas shale pore systems by porosimetry, pycnometry, surface area, and field emission scanning electron microscopy/transmission electron microscopy image analyses: Examples from the Barnett, Woodford, Haynesville, Marcellus, and Doig units. AAPG Bull. 2012, 96, 1099–1119. [Google Scholar]
- Ilgen, A.G.; Heath, J.E.; Akkutlu, I.Y.; Bryndzia, L.T.; Cole, D.R.; Kharaka, Y.K.; Kneafsey, T.J.; Milliken, K.L.; Pyrak-Nolte, L.J.; Suarez-Rivera, R. Shales at all scales: Exploring coupled processes in mudrocks. Earth-Sci. Rev. 2017, 166, 132–152. [Google Scholar] [CrossRef]
- Fu, J.; Wang, L.; Chen, X.; Liu, J.; Hui, X.; Cheng, D. Progress and prospects of shale oil exploration and development in the seventh member of Yanchang Formation in Ordos Basin. China Pet. Explor. 2023, 28, 1. [Google Scholar]
- Loucks, R.G.; Reed, R.M.; Ruppel, S.C.; Jarvie, D.M. Morphology, genesis, and distribution of nanometer-scale pores in siliceous mudstones of the Mississippian Barnett Shale. J. Sediment. Res. 2009, 79, 848–861. [Google Scholar] [CrossRef]
- Garum, M.; Glover, P.W.; Lorinczi, P.; Micklethwaite, S.; Hassanpour, A. Integration of multiscale imaging of nanoscale pore microstructures in gas shales. Energy Fuels 2021, 35, 10721–10732. [Google Scholar] [CrossRef]
- Jarvie, D.M.; Hill, R.J.; Ruble, T.E.; Pollastro, R.M. Unconventional shale-gas systems: The Mississippian Barnett Shale of north-central Texas as one model for thermogenic shale-gas assessment. AAPG Bull. 2007, 91, 475–499. [Google Scholar] [CrossRef]
- Hu, G.; Pang, Q.; Jiao, K.; Hu, C.; Liao, Z. Development of organic pores in the Longmaxi Formation overmature shales: Combined effects of thermal maturity and organic matter composition. Mar. Pet. Geol. 2020, 116, 104314. [Google Scholar] [CrossRef]
- Borjigin, T.; Lu, L.; Yu, L.; Zhang, W.; Pan, A.; Shen, B.; Wang, Y.; Yang, Y.; Gao, Z. Formation, preservation and connectivity control of organic pores in shale. Petro. Explor. Dev. 2021, 48, 798–812. [Google Scholar] [CrossRef]
- Hutchinson, J.E. Fractals and self similarity. J. Math. Mech. 1981, 30, 713–747. [Google Scholar]
- Yang, R.; Liu, W.; Meng, L. Multifractal analysis of the structure of organic and inorganic shale pores using nuclear magnetic resonance (NMR) measurement. J. Mar. Sci. Eng. 2023, 11, 752. [Google Scholar] [CrossRef]
- Zhang, N.; Wang, X.; Wang, S.; Wang, R.; Wu, J.; Li, Z.; Song, Y. Multifractal characteristics on pore structure of Longmaxi shale using nuclear magnetic resonance (NMR). Geoenergy Sci. Eng. 2024, 241, 213176. [Google Scholar] [CrossRef]
- Zhong, B.; Zhu, Y.; Feng, G.; Xiang, J.; Wang, Y. Matrix Compression and Pore Heterogeneity in the Coal-Measure Shale Reservoirs of the Qinshui Basin: A Multifractal Analysis. Fractal Fract. 2024, 8, 580. [Google Scholar] [CrossRef]
- Zhou, N.; Lu, S.; Wang, M.; Liu, W.; Guan, Y.; Tan, H.; Wang, Z. Applicability of fractal capillary pressure models to sandstones. J. Pet. Sci. Eng. 2020, 185, 106626. [Google Scholar] [CrossRef]
- Xie, W.; Yin, Q.; Zeng, J.; Wang, G.; Feng, C.; Zhang, P. Fractal-based approaches to pore structure investigation and water saturation prediction from NMR measurements: A case study of the gas-bearing tight sandstone reservoir in Nanpu Sag. Fractal Fract. 2023, 7, 273. [Google Scholar] [CrossRef]
- Cai, F.; Zhang, Q.; Yang, L. Fractal Characteristics and Microstructure of Coal with Impact of Starch-Polymerized Aluminum Sulfate Fracturing Fluids. Fractal Fract. 2024, 8, 228. [Google Scholar] [CrossRef]
- Chen, S.; Liu, D.; Wang, Y.; Zhang, W.; Zheng, Q.; Yin, X. A comparative analysis of mercury intrusion and nitrogen adsorption methods for multifractal characterization of shale reservoirs in northern Songliao Basin. Sci. Rep. 2025, 15, 7866. [Google Scholar] [CrossRef] [PubMed]
- Xu, L.; Zhang, D.; Xian, X. Fractal dimensions of coals and cokes. J. Colloid Interface Sci. 1997, 190, 357–359. [Google Scholar] [CrossRef]
- Gauden, P.A.; Terzyk, A.P.; Rychlicki, G. The new correlation between microporosity of strictly microporous activated carbons and fractal dimension on the basis of the Polanyi–Dubinin theory of adsorption. Carbon 2001, 39, 267–278. [Google Scholar] [CrossRef]
- Han, W.; Zhou, G.; Gao, D.; Zhang, Z.; Wei, Z.; Wang, H.; Yang, H. Experimental analysis of the pore structure and fractal characteristics of different metamorphic coal based on mercury intrusion-nitrogen adsorption porosimetry. Powder Technol. 2020, 362, 386–398. [Google Scholar] [CrossRef]
- Wang, Y.; Zhong, B.; Zhang, Y.; Zhu, Y.; Wang, M. Analysis of Nanostructures and Wettability of Marine Shale in Southern China, Based on Different Fractal Models. Fractal Fract. 2024, 9, 12. [Google Scholar] [CrossRef]
- Xie, H.; Li, X.; Sui, H.; Cai, J.; Xu, E.; Zhao, J. Acidification-Induced Micronano Mechanical properties and microscopic permeability enhancement mechanism of coal. Langmuir 2024, 40, 4496–4513. [Google Scholar] [CrossRef] [PubMed]
- Li, R.; Hou, X.; Chen, L.; Fang, H.; Zheng, C. Multifractal investigation on multi-scale pore structure heterogeneity of high rank coal reservoirs. Nat. Resour. Res. 2022, 31, 1665–1685. [Google Scholar] [CrossRef]
- Wang, Y.; Cheng, H.; Hu, Q.; Liu, L.; Jia, L.; Gao, S.; Wang, Y. Pore structure heterogeneity of Wufeng-Longmaxi shale, Sichuan Basin, China: Evidence from gas physisorption and multifractal geometries. J. Pet. Sci. Eng. 2022, 208, 109313. [Google Scholar] [CrossRef]
- Guo, R.; Liang, X.; Zhou, X.; Fan, Z.; Zhao, J.; Bai, Y.; Wu, W.; Cao, L.; Liu, P. Effect of extractable organic matter on nanopore structure and heterogeneity in Triassic Yanchang lacustrine shale of the Ordos basin, China. J. Asian Earth Sci. 2025, 287, 106577. [Google Scholar] [CrossRef]
- Liu, J.; Lu, D.; Li, P. Nano-scale dual-pore-shape structure and fractal characteristics of transitional facies shale matrix. Nat. Gas Sci. Eng. 2019, 68, 102907. [Google Scholar] [CrossRef]
- Lu, C.; Wang, X.; Ma, S.; Li, S.; Xue, T.; Li, Q. The Classification and Evaluation of an Interlayer Shale Oil Reservoir Based on the Fractal Characteristics of Pore Systems: A Case Study in the HSN Area, China. Fractal Fract. 2024, 8, 167. [Google Scholar] [CrossRef]
- Liu, B.; Wang, Y.; Tian, S.; Guo, Y.; Wang, L.; Yasin, Q.; Yang, J. Impact of thermal maturity on the diagenesis and porosity of lacustrine oil-prone shales: Insights from natural shale samples with thermal maturation in the oil generation window. Int. J. Coal Geol. 2022, 261, 104079. [Google Scholar] [CrossRef]
- Wang, F.; Guo, S. Influential factors and model of shale pore evolution: A case study of a continental shale from the Ordos Basin. Mar. Pet. Geol. 2019, 102, 271–282. [Google Scholar] [CrossRef]
- Song, D.; Tuo, J.; Zhang, M.; Wu, C.; Su, L.; Li, J.; Zhang, Y.; Zhang, D. Hydrocarbon generation potential and evolution of pore characteristics of Mesoproterozoic shales in north China: Results from semi-closed pyrolysis experiments. Nat. Gas Sci. Eng. 2019, 62, 171–183. [Google Scholar] [CrossRef]
- Xu, L.; Yang, K.; Wei, H.; Liu, L.; Li, X.; Chen, L.; Xu, T.; Wang, X. Diagenetic evolution sequence and pore evolution model of Mesoproterozoic Xiamaling organic-rich shale in Zhangjiakou, Hebei, based on pyrolysis simulation experiments. Mar. Pet. Geol. 2021, 132, 105233. [Google Scholar] [CrossRef]
- Song, L.; Martin, K.; Carr, T.R.; Ghahfarokhi, P.K. Porosity and storage capacity of Middle Devonian shale: A function of thermal maturity, total organic carbon, and clay content. Fuel 2019, 241, 1036–1044. [Google Scholar] [CrossRef]
- Valentine, B.J.; Hackley, P.C.; Hatcherian, J.J. Hydrous pyrolysis of New Albany Shale: A study examining maturation changes and porosity development. Mar. Pet. Geol. 2021, 134, 105368. [Google Scholar] [CrossRef]
- Zhao, X.; Yao, G.; Chen, X.; Zhang, R.; Lan, Z.; Wang, G. Diagenetic facies classification and characterization of a high-temperature and high-pressure tight gas sandstone reservoir: A case study in the Ledong area, Yinggehai Basin. Mar. Pet. Geol. 2022, 140, 105665. [Google Scholar] [CrossRef]
- Yan, Y.; Wang, M.; Misch, D.; Sachsenhofer, R.F.; Wu, Y.; Li, J. Mineral diagenesis in lacustrine organic-rich shales: Evolution pathways and implications for reservoir characteristics. J. Asian Earth Sci. 2024, 263, 106026. [Google Scholar] [CrossRef]
- Wang, Y.; Liu, L.; Hu, Q.; Hao, L.; Wang, X.; Sheng, Y. Nanoscale pore network evolution of Xiamaling marine shale during organic matter maturation by hydrous pyrolysis. Energy Fuels 2020, 34, 1548–1563. [Google Scholar] [CrossRef]
- Wu, W.; Liang, Z.; Xu, L.; Liu, Y.; Li, Y.; Tang, X.; Yin, Y.; Chen, Y. The Effect of Thermal Maturity on the Pore Structure Heterogeneity of Xiamaling Shale by Multifractal Analysis Theory: A Case from Pyrolysis Simulation Experiments. Minerals 2023, 13, 1340. [Google Scholar] [CrossRef]
- Leon, C.A.L.Y. New perspectives in mercury porosimetry. Adv. Colloid Interface Sci. 1998, 76, 341–372. [Google Scholar] [CrossRef]
- Yuan, Y.; Rezaee, R. Fractal analysis of the pore structure for clay bound water and potential gas storage in shales based on NMR and N2 gas adsorption. J. Pet. Sci. Eng. 2019, 177, 756–765. [Google Scholar] [CrossRef]
- Liu, K.; Ostadhassan, M.; Cai, J. Characterizing pore size distributions of shale. In Petrophysical Characterization and Fluids Transport in Unconventional Reservoirs; Elsevier: Amsterdam, The Netherlands, 2019; pp. 3–20. [Google Scholar]
- Li, Y.; Zhang, Y.; Zhang, L.; Hou, J. Characterization on pore structure of tectonic coals based on the method of mercury intrusion, carbon dioxide adsorption and nitrogen adsorption. China Coal Soc. 2019, 44, 1188–1196. [Google Scholar]
- Mazumder, M.; Tripathy, A.; Singh, T.N. Quantitative Evaluation of Sub-Bituminous Coal from Jharia Basin, India: Investigation Using Low Pressure N2 and CO2 Adsorption; Springer: Berlin/Heidelberg, Germany, 2024. [Google Scholar]
- Xiang, J.; Zhu, Y.; Wang, Y.; Chen, S.; Jiang, Z. Structural deformation and its pore-fracture system response of the Wufeng-Longmaxi shale in the Northeast Chongqing area, using FE-SEM, gas adsorption, and SAXS. J. Pet. Sci. Eng. 2022, 209, 109877. [Google Scholar] [CrossRef]
- Crownover, R.M. Introduction to Fractals and Chaos; Jones & Bartlett Pub.: Burlington, MA, USA, 1995. [Google Scholar]
- Chhabra, A.; Jensen, R.V. Direct determination of the f (α) singularity spectrum. Phys. Rev. Lett. 1989, 62, 1327. [Google Scholar] [CrossRef] [PubMed]
- Zhao, W.; Zhang, B.; Wang, X.; Wu, S.; Zhang, S.; Liu, W.; Wang, K.; Zhao, X. Differences in source kitchens for lacustrine in-source and out-of-source hydrocarbon accumulations. Petro. Explor. Dev. 2021, 48, 541–554. [Google Scholar] [CrossRef]
- Cao, T.; Liu, H.; Pan, A.; Fu, Y.; Deng, M.; Cao, Q.; Huang, Y.; Yu, Y. Pore evolution in siliceous shales and its influence on shale gas-bearing capacity in eastern Sichuan-western Hubei, China. J. Pet. Sci. Eng. 2022, 208, 109597. [Google Scholar] [CrossRef]
- Mastalerz, M.; Drobniak, A.; Stankiewicz, A.B. Origin, properties, and implications of solid bitumen in source-rock reservoirs: A review. Int. J. Coal Geol 2018, 195, 14–36. [Google Scholar] [CrossRef]
- Guan, M.; Liu, X.; Jin, Z.; Lai, J.; Sun, B.; Zhang, P.; Chen, K. The evolution of pore structure heterogeneity during thermal maturation in lacustrine shale pyrolysis. Anal. Appl. Pyrolysis 2022, 163, 105501. [Google Scholar] [CrossRef]
- Zhao, Y.; Jin, Z. Hydrocarbon mixture phase behavior in multi-scale systems in relation to shale oil recovery: The effect of pore size distributions. Fuel 2021, 291, 120141. [Google Scholar] [CrossRef]
- Song, Y.; Song, Z.; Meng, Y.; Chen, Z.; Han, X.; Feng, D. Multi-phase behavior and pore-scale flow in medium-high maturity continental shale reservoirs with Oil, CO2, and water. Chem. Eng. J. 2024, 484, 149679. [Google Scholar] [CrossRef]
- Li, W.; Liu, H.; Song, X. Multifractal analysis of Hg pore size distributions of tectonically deformed coals. Int. J. Coal Geol. 2015, 144, 138–152. [Google Scholar] [CrossRef]
- Wei, Z.; Sheng, J.J. Study of thermally-induced enhancement in nanopores, microcracks, porosity and permeability of rocks from different ultra-low permeability reservoirs. J. Pet. Sci. Eng. 2022, 209, 109896. [Google Scholar] [CrossRef]
- Zhou, S.; Zhang, D. Adsorbed and free gas occurrence characteristics and controlling factors of deep shales in the southern Sichuan Basin, China. Pet. Sci. 2023, 20, 1301–1311. [Google Scholar] [CrossRef]
Disclaimer/Publisher’s Note: The statements, opinions and data contained in all publications are solely those of the individual author(s) and contributor(s) and not of MDPI and/or the editor(s). MDPI and/or the editor(s) disclaim responsibility for any injury to people or property resulting from any ideas, methods, instructions or products referred to in the content. |
© 2025 by the authors. Licensee MDPI, Basel, Switzerland. This article is an open access article distributed under the terms and conditions of the Creative Commons Attribution (CC BY) license (https://creativecommons.org/licenses/by/4.0/).