Article

Rapid Estimation of Soil Copper Content Using a Novel Fractional Derivative Three-Band Index and Spaceborne Hyperspectral Data

1
College of Resources and Environment, Xinjiang Agricultural University, Urumqi 830052, China
2
Xinjiang Planting Industry Green Production Engineering Technology Research Center, Urumqi 830052, China
3
Xinjiang Engineering Technology Research Center of Soil Big Data, Urumqi 830052, China
4
State Key Laboratory of Desert and Oasis Ecology, Xinjiang Institute of Ecology and Geography, Chinese Academy of Sciences, Urumqi 830011, China
5
Key Laboratory of Ecological Safety and Sustainable Development in Arid Lands, Xinjiang Institute of Ecology and Geography, Chinese Academy of Sciences, Urumqi 830011, China
6
Xinjiang Key Laboratory of Mineral Resources and Digital Geology, Urumqi 830011, China
*
Authors to whom correspondence should be addressed.
Fractal Fract. 2025, 9(8), 523; https://doi.org/10.3390/fractalfract9080523
Submission received: 9 July 2025 / Revised: 6 August 2025 / Accepted: 8 August 2025 / Published: 12 August 2025

Abstract

Rapid and large-scale monitoring of soil copper levels enables the quick identification of areas where copper concentrations significantly exceed safe thresholds. It allows for selecting regions that require treatment and protection and is essential for safeguarding environmental and human health. Widely adopted monitoring models that utilize ground- and uncrewed-aerial-vehicle-based spectral data are superior to labor-intensive and time-consuming traditional methods that rely on point sampling, chemical analysis, and spatial interpolation. However, these methods are unsuitable for large-scale observations. Therefore, this study investigates the potential of utilizing spaceborne GF-5 hyperspectral data for monitoring soil copper content. Ninety-five soil samples were collected from the Kalatage mining area in Xinjiang, China. Three-band indices were constructed using fractional derivative spectra, and estimation models were developed using spectral indices highly correlated with the copper content. The results show that the proposed three-band spectral index accurately identifies subtle spectral characteristics associated with the copper content. Although the model is relatively simple, selecting the correct fractional order is critical in constructing spectral indices. The three-band spectral index based on fractional derivatives with orders of less than 0.6 provides higher accuracy than higher-order fractional derivatives. The index with spectral wavelengths of 426.796 nm, 512.275 nm, and 974.245 nm with 0.35-order derivatives exhibits the optimal performance (R2 = 0.51, RPD = 1.46). Additionally, we proposed a novel approach that identifies the three-band indices exhibiting a strong correlation with the copper content. Subsequently, the selected indices were used as independent variables to develop new spectral indices for model development. This approach provides higher performance than models that use spectral indices derived from individual band values. The model utilizing the proposed spectral index achieved the best performance (R2 = 0.56, RPD = 1.52). These results indicate that utilizing GF-5 hyperspectral data for large-scale monitoring of soil copper content is feasible and practical.

1. Introduction

The soil is a dynamic, complex system crucial to plant growth, supplying essential nutrients, water, and structural support [1]. It regulates the water cycle and maintains an ecological balance by filtering and retaining moisture. Additionally, soil is vital for carbon sequestration, combating climate change, and reducing greenhouse gas emissions [2]. Consequently, soil health is essential for agricultural productivity, ecosystem resilience, and human survival. However, due to the current focus on rapid and efficient mineral exploration, the importance of soil health has been disregarded. Researchers are increasingly proposing innovative prospecting methods utilizing advanced technologies, such as remote sensing [3,4,5], geophysics [6,7,8], and geochemistry [9,10,11], but the environmental damage caused by mineral extraction is often overlooked. Mineral mining and smelting expose minerals to the surface environment, resulting in heavy metal pollution [12]. Heavy metal pollutants enter the geochemical cycle through surface runoff, polluting the groundwater and atmosphere [13]. They have low mobility and are not leached by water or degraded by microorganisms [14]. Therefore, they pollute agricultural products and groundwater, endangering human health through the food chain [15]. Since most heavy metals are relatively stable in the soil, they have significant adverse effects on soil physical, chemical, and biological properties (especially soil microorganisms and microbial community structure), affecting the soil’s structure and function [16]. Therefore, it is essential to monitor the soil in mining areas to identify metal contamination and ensure environmental safety.
Conventional approaches for monitoring soil metal pollution include field point sampling followed by interpolation. Sample points are selected based on the terrain. Soil samples are collected, and the metal content is determined using chemical analysis, such as atomic absorption spectrometry (AAS), inductively coupled plasma–mass spectrometry (ICP-MS), and inductively coupled plasma–optical emission spectrometry (ICP-OES/ICP-AES). Spatial interpolation methods, such as inverse distance weighting, the spline method, and kriging, are utilized to determine the spatial distribution of the soil metal content [17,18,19]. The soil metal pollution risk is commonly assessed using indices, e.g., the Nemerow or geo-accumulation index [20,21,22]. Although this method has high accuracy, the interpolation results depend on the number of sampling points and their spatial distribution. An inappropriate sample size or spatial distribution can reduce the accuracy of the interpolation results and the reliability of evaluating soil heavy metal pollution [23,24]. Due to the high costs, human resources, complex operations, and lengthy analysis cycles, this method is only suitable for small-scale monitoring of soil heavy metal pollution. Thus, a method is required for large-scale, rapid, real-time, and continuous monitoring.
Hyperspectral remote sensing has the advantage of high spectral resolution. Hyperspectral data include dozens to hundreds of narrow and contiguous bands in the visible, near-infrared, and mid-infrared spectral ranges. The high spectral resolution allows for extracting spectral features related to soil biochemical parameters. Due to their unique spectral absorption features, iron oxide, manganese oxide, and organic matter in soil can be detected using hyperspectral data [25,26]. Although the heavy metal content in soil is relatively low, the relationship between heavy metals and iron oxide, manganese oxide, and organic matter can be used to estimate the heavy metal content using hyperspectral remote sensing [27,28]. Researchers have employed various methods, such as multiple linear regression (MLR) [29], backpropagation neural networks (BPNNs) [30], partial least squares regression (PLSR) [31,32,33,34,35,36], random forest (RF) [26,37,38], support vector machines (SVMs) [39,40,41], convolutional neural networks (CNNs) [42], and geographically weighted regression (GWR) [43,44], to analyze the relationship between spectral features (e.g., standard normal variables (SNVs)) [41], multiplicative scatter correction (MSC) [29,30], integer order derivative (IOD) [36,39,42], and fractional order derivative (FOD) [32,44]) and soil heavy metal content (e.g., Cu, Zn, Pb, As, Fe, Hg, Cr, and Ni).
In these studies, hyperspectral quantitative models were developed to evaluate the heavy metal level rapidly using a non-invasive approach. Although these studies have demonstrated the effectiveness and viability of hyperspectral remote sensing for estimating the quantity of heavy metals in the soils, most researchers measured soil spectra in the laboratory to establish estimation models. This technique is non-destructive, fast, and highly accurate to determine soil’s heavy metal content, addressing the shortcomings of traditional monitoring methods. However, this approach cannot be used for large-scale, rapid, real-time, and long-term monitoring. Airborne and spaceborne hyperspectral imaging systems (e.g., HyMap, GF-5, and ZY1-02D) overcome the spatial limitations of ground-based methods by providing broader area coverage. Nevertheless, airborne systems like HyMap, despite their high spatial (2–5 m) and spectral resolution (10–20 nm), exhibit significant constraints for large-scale, dynamic soil copper monitoring due to limited coverage, high costs, and unpredictable acquisition schedules. In contrast, spaceborne hyperspectral data, particularly from satellites like GF-5 and ZY1-02D, present compelling advantages. They offer extensive coverage, free data access, and regular revisit capabilities—features essential for large-scale and dynamic monitoring. GF-5 has significant advantages for detecting subtle soil spectral features related to the copper content. Due to the sensor’s higher number of spectral bands (330 vs. ZY1-02D’s 166), finer spectral resolution (≤10 nm), and superior signal-to-noise ratio (SNR), GF-5 data enables more sensitive identification of the diagnostic absorption characteristics crucial for inversion modeling. Therefore, based on its superior spectral capabilities and operational advantages for large-scale monitoring, GF-5 hyperspectral data were selected as the primary data source for this study.
One-dimensional spectral data, such as raw or transformed spectra, are commonly used for modeling. This method provides simple models but does not consider the interactions between different spectral bands and utilizes insufficient spectral information. Spectral indices derived from multiple narrow or wide wavelength bands using mathematical transformations can address these limitations [45,46]. They account for the interactions among wavelength bands and have higher sensitivity [47]. Using three bands to create spectral indices is more effective than using two bands to reduce the interference of light scattering and molecular non-characteristic absorption caused by other soil substances [48,49]. Due to the above advantages, many researchers have recently used three-band spectral indices to estimate the biochemical parameters in the soil. For instance, Geng et al. (2024) [50] found that the three-band spectral index using the 0.6th order fractional derivative of soil spectra could be used to estimate the organic carbon content in black soil with high accuracy (R2 = 0.66), outperforming the model based on a two-band spectral index. Zhu et al. (2020) [51] found that combining a three-band index based on soil’s first-order derivative spectra with extreme learning machine learning algorithms resulted in an accurate estimate of the soil’s organic matter content (R2 = 0.87). Model accuracy followed the order three-band index > two-band index > one-dimensional spectrum. Feng et al. (2024) [52] observed that using a successive projection algorithm (SPA) to screen sensitive spectral bands and using these bands to establish a three-band spectral index with a random forest machine learning algorithm provided high-precision estimation of the soil’s arsenic content (R2 = 0.75). Fu et al. (2022) [53] also found that a three-band index using the first derivative spectra of the soil exhibited a higher correlation with the arsenic content than the original spectra, continuum removal spectra, and log spectra. Thus, the proposed index enabled the rapid inversion of the soil’s arsenic content. These studies indicate that the three-band index has shown good performance in estimating various soil parameters; however, few studies have used it to estimate soil copper content.
The purpose of this study is to utilize the rich spectral information of hyperspectral data acquired by the GF-5 satellite and the superior three-band spectral index to improve the information content of the target and reduce background noise. An optimized spectral index is used to estimate the soil’s copper content. The aim is to assess the possibility and accuracy of the proposed quantitative estimation of the regional copper content in the soil using fused indices. The objectives are to (1) apply the fractional derivative method to investigate sensitive spectral features related to the soil’s copper content using GF-5 hyperspectral data, (2) develop a three-band copper content index with a simple structure and clear physical meaning, and (3) assess the accuracy, stability, and reliability of the proposed inversion model using the copper content obtained from field-measured soil samples. This research contributes a novel technological procedure and scientific foundation to enable the effective and precise estimation of copper contamination of large areas using GF-5 satellite data.

2. Materials and Methods

2.1. Study Area

The Kalatage copper-poly-metallic ore district is located in the eastern Tianshan–Dananhu–Tousuquan island arc belt on the southern margin of the Central Asian orogenic belt (Figure 1). The area has favorable geological conditions for ore formation. Copper and gold deposits have been discovered in Hongshan, Hongshi, and Meiling. They are volcanic hydrothermal vein deposits. Soil pollution occurs commonly during mineral extraction in the region. Therefore, improving pollution monitoring and establishing effective pollution control measures is imperative.

2.2. Soil Sample Collection and Copper Content Measurements

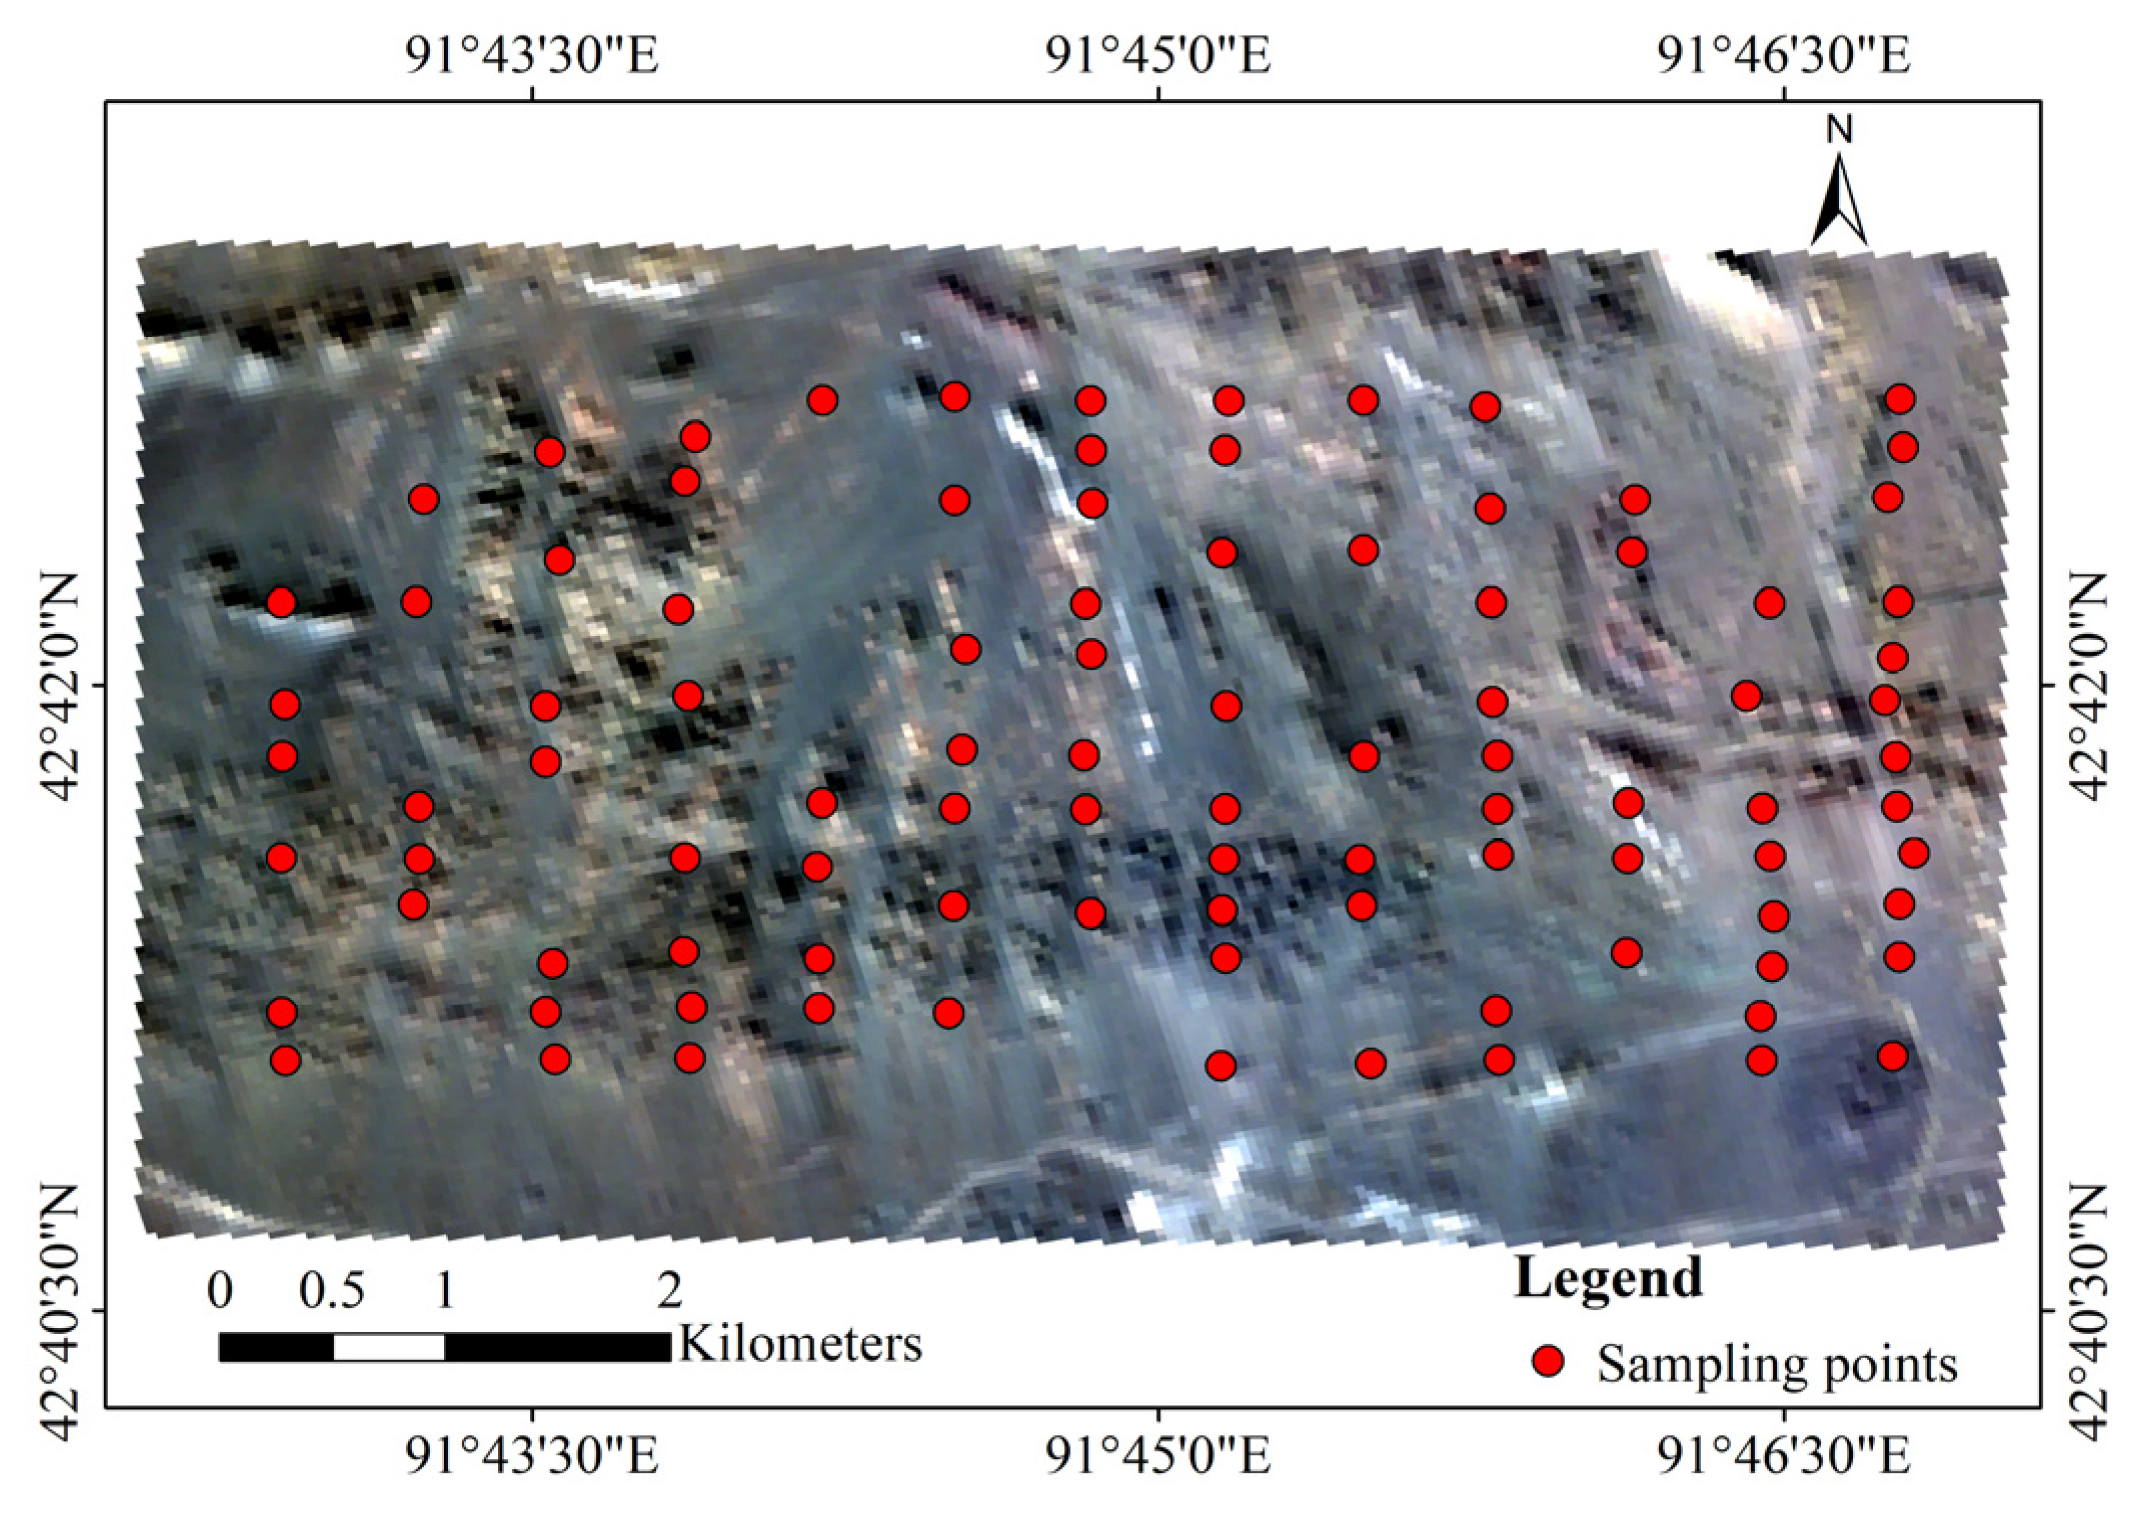
Surface soil samples (0–20 cm depth; 0.5 kg) were collected near 95 uniformly distributed sampling points (Figure 2). The soil was classified as Brown Desert Soil (Type), subtype Gypsum-Salt Crust Brown Desert Soil. The coordinates were recorded using a handheld GPS device. The soil samples were transported to the laboratory for processing, including drying, grinding, sieving, and digestion. The copper content in the soil was quantified utilizing the ICP-MS method.

2.3. GF-5 Hyperspectral Data Acquisition and Preprocessing

We used hyperspectral data acquired by the spaceborne GF-5 satellite. The images contain 330 spectral bands in the visible, near-infrared, and shortwave infrared ranges. They include 150 5 nm resolution bands (390 to 1029 nm) and 180 10 nm resolution bands (1004 to 2513 nm). The data have a spatial resolution of 30 m and a swath width of 60 km.
Preprocessing included radiometric calibration, atmospheric correction, and orthorectification. The GPS coordinates were used to extract the spectral data for the sampling points. Spectral bands below 400 nm were excluded to reduce instrument noise and improve the signal-to-noise ratio. Spectral bands from 1350.58 to 1418.17 nm and 1797.02 to 1940.15 nm were eliminated to mitigate the impact of atmospheric water vapor. Four adjacent bands were consolidated into a single band by computing the average value to address data redundancy and multicollinearity among adjacent spectral bands. This process reduced the number of bands from 300 to 75.
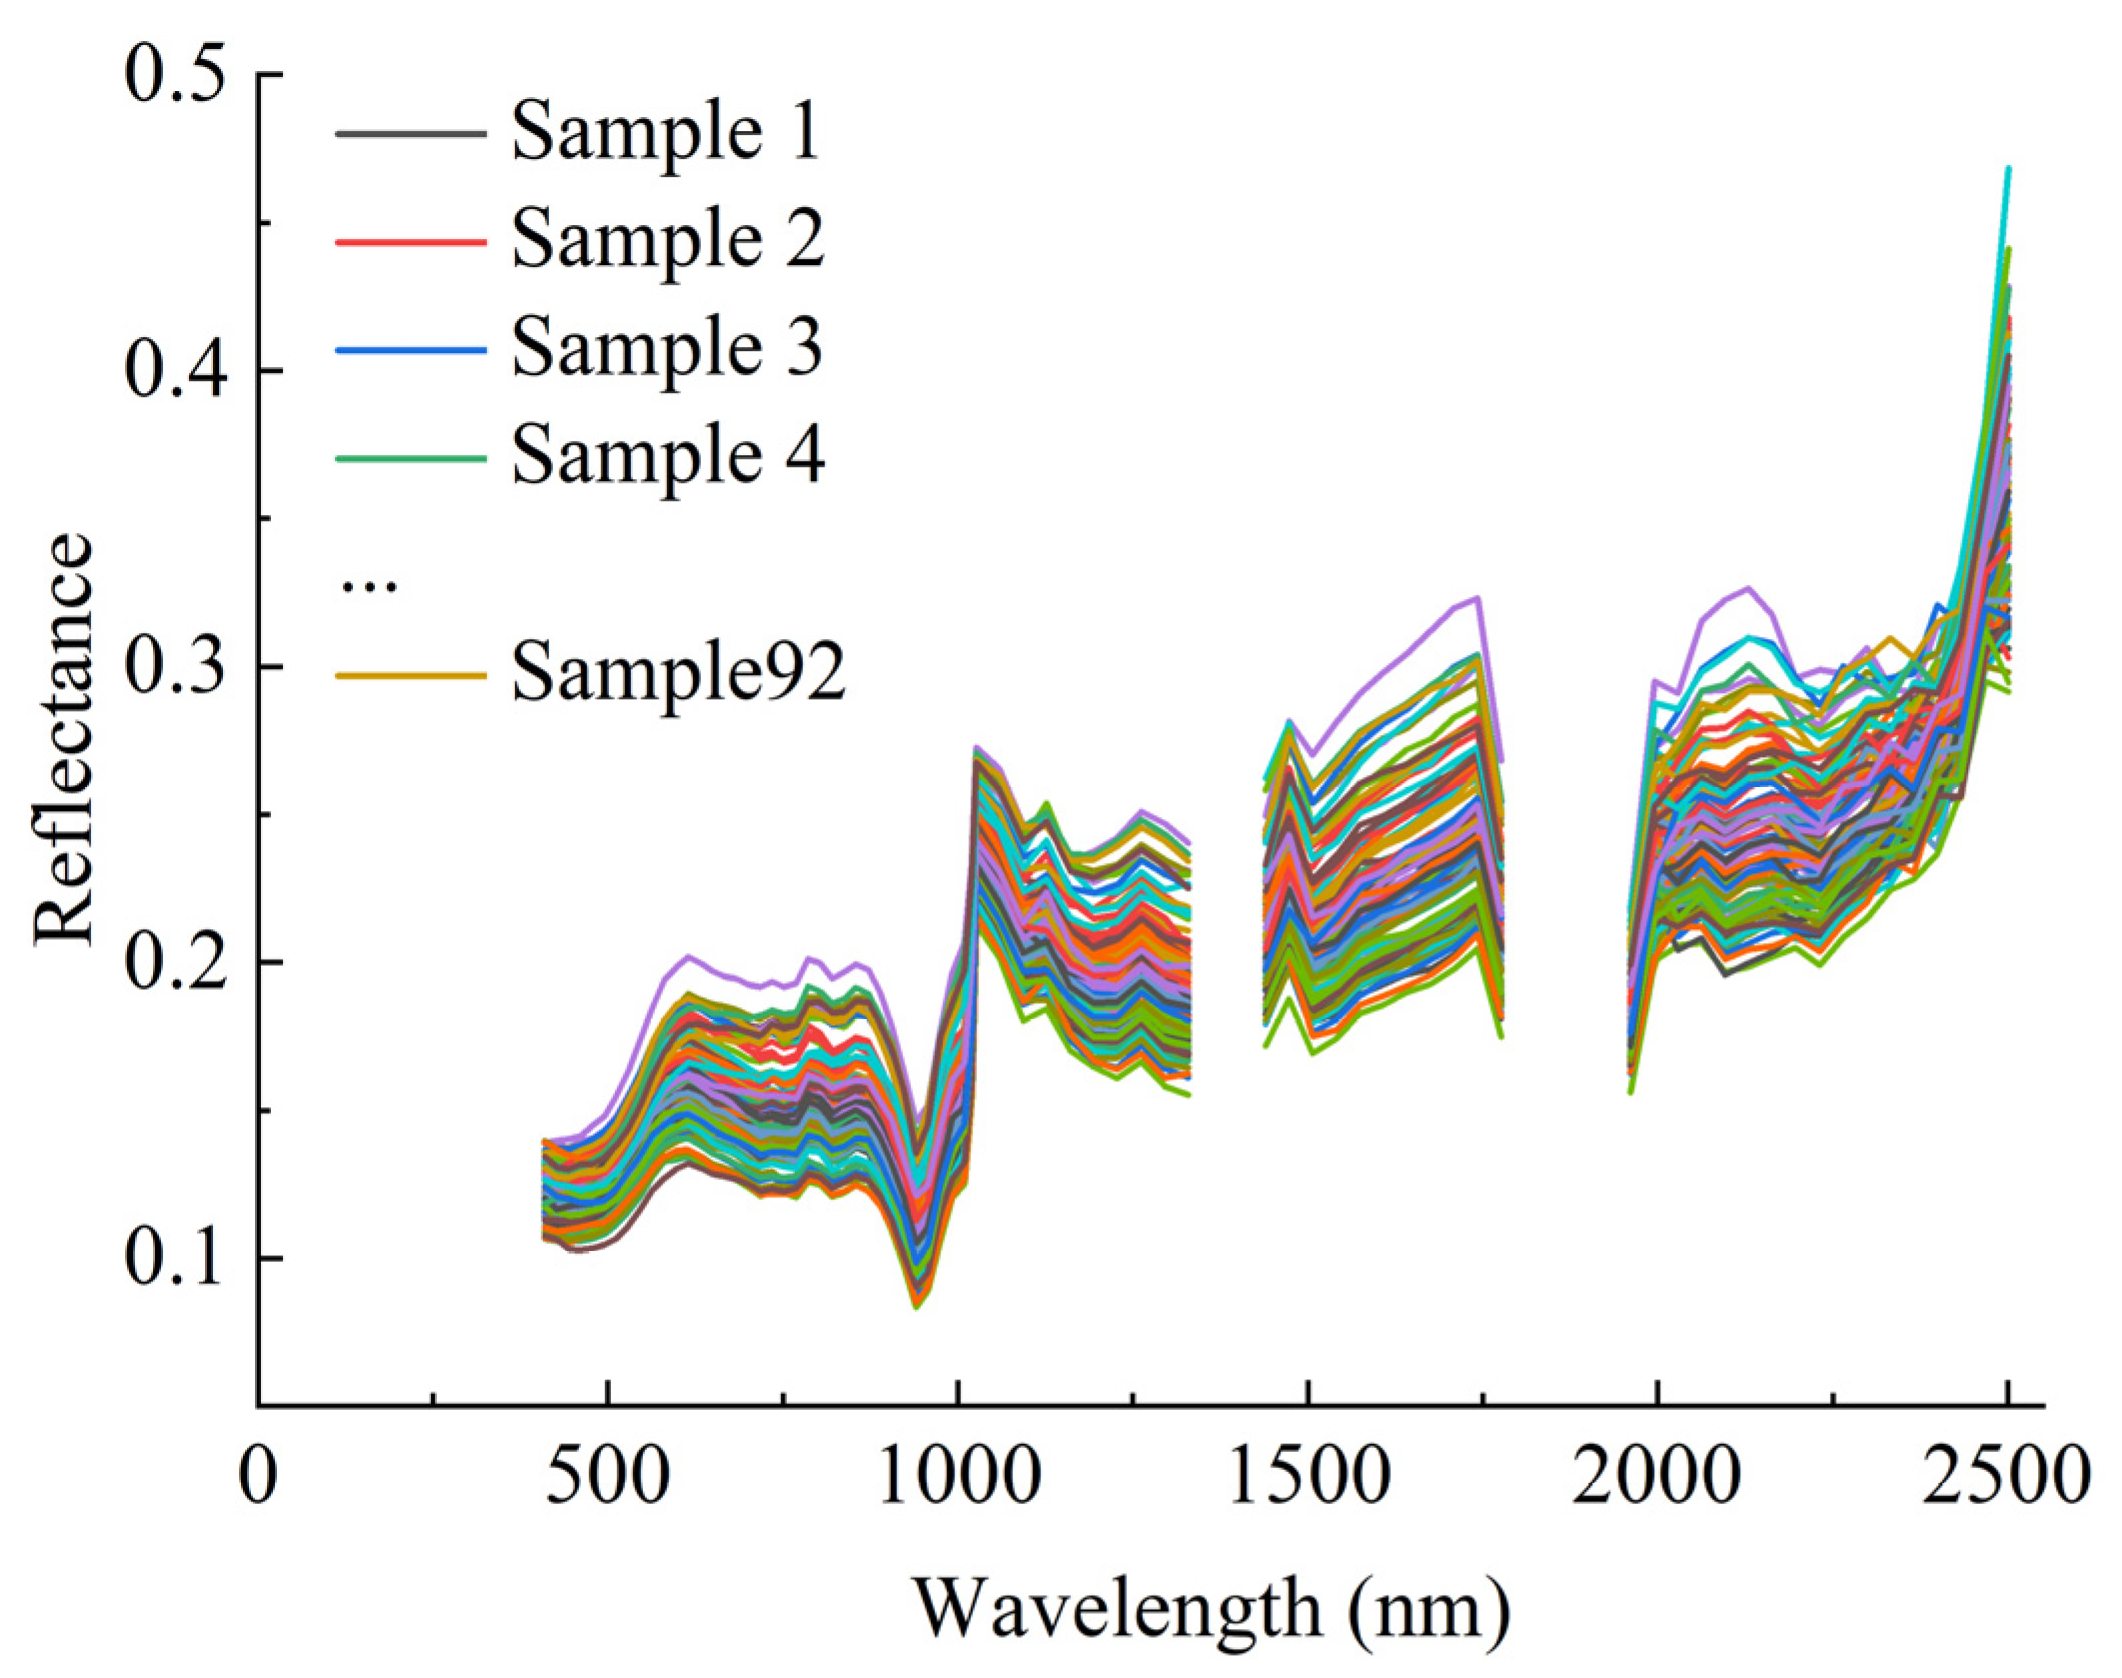
Outliers were removed before utilizing spectral data for modeling and analysis. The Monte Carlo outlier detection (MOCD) method was employed to generate a two-dimensional scatter plot with the average prediction error on the X-axis and the standard deviation (SD) of the prediction error on the Y-axis. The outliers, which are points that deviate significantly from the majority of data points, were identified and removed. Three outliers were identified. The reflectance spectrum of the remaining 92 samples is displayed in Figure 3.

2.4. Fractional-Order Derivative

The fractional-order derivative is a generalization of the standard derivative. It has been used in various fields, including rheology, electrical engineering, biology, signal processing, and control engineering. Three methods exist to calculate fractional derivatives: the Grünwald–Letnikov (G-L), Riemann–Liouville, and Caputo methods [47,54]. The G-L method is more straightforward than the other methods because it does not use complex Cauchy formulas [55]. We used the G-L method (Equation (1)) to calculate 20 fractional order derivatives ranging from 0.05 to 1.95 with intervals of 0.1.
d V f λ d λ V f λ + V f λ 1 + V V + 1 2 f λ 2 + Γ V + 1 n ! Γ V + n + 1 f λ n  
where V represents the fractional derivative order, λ represents the wavelength of the spectral band, n represents the difference between the upper and lower limits of the differential, and Γ represents the gamma function.

2.5. Establishing the Three-Band Spectral Index

The three-band spectral index provides more spectral information than the two-band spectral index, improves model accuracy, and reduces the effects of noise and saturation [49]. It has been widely used in agriculture, environmental monitoring, and other fields.
We calculated the correlation coefficients between the soil’s copper content and the three-band spectral indices for different-order fractional derivatives to determine the optimal spectral band combination. The equations for the five three-band indices are listed in Table 1. In addition to considering correlation coefficients, priority should be given to selecting the characteristic absorption bands of minerals, such as soil organic matter (SOM), clay minerals, and iron manganese oxides, when selecting bands for a three-band spectral index. These minerals absorb copper and have precise spectral characteristics. Therefore, the models containing the indices have physical meaning.

2.6. Model Establishment and Evaluation

After the outlier detection, the remaining 92 soil samples were split into training and test sets using a 2:1 ratio, resulting in 60 samples in the training set and 32 samples in the test set.
We used the training set to identify the optimal three-band combination for different-order fractional derivatives. We established estimation models using the selected three-band indices. The testing set was used to assess model accuracy and select the optimum model.
The model accuracy was evaluated using the coefficient of determination (R2) and the root mean squared error (RMSE). The higher the R2 and the lower the RMSE value, the higher the model’s accuracy. The model’s predictive ability was evaluated using the residual predictive deviation (RPD). The larger the RPD value, the stronger the model’s predictive ability. A value smaller than 1.4 indicates its low predictive ability.

3. Results

3.1. Soil Copper Content

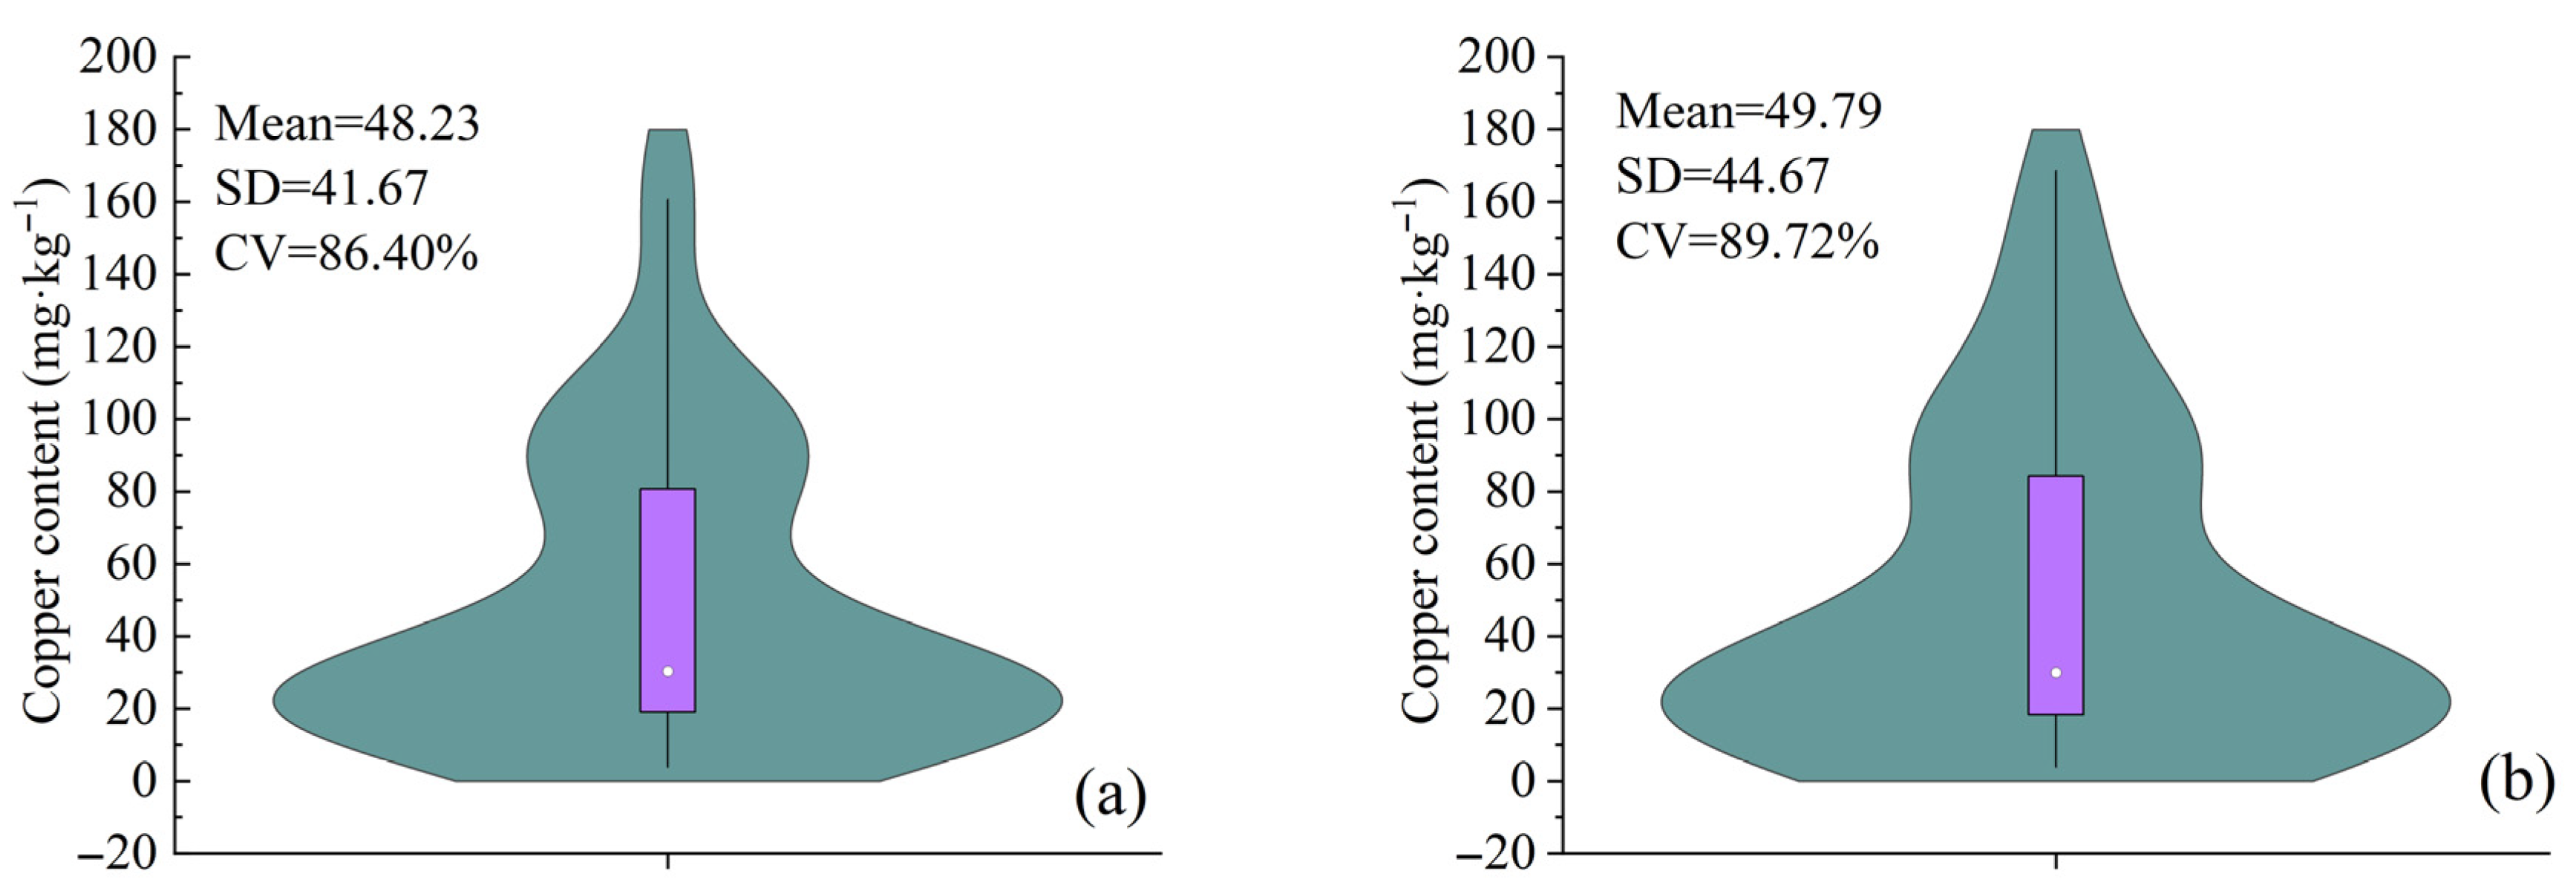
Figure 4 shows the descriptive statistics of the copper content in the soil samples obtained from the training and testing sets, including the mean, SD, and coefficient of variation (CV). The average copper content is 48.23 mg·kg1 for the training set and 49.79 mg·kg1 for the testing set, with SDs of 41.67 mg·kg1 and 44.67 mg·kg1. The results indicate a high level of consistency between the two sets, suggesting that the testing set data can be used to evaluate the accuracy and predictive performance of models developed using the training set. The CV of the copper content exceeds 85% in the training and test sets, indicating an uneven spatial distribution of soil copper content. These spatial variations may be attributed to different effects of mining activities in different regions.

3.2. Spectral Characteristics

Figure 5 presents the mean and SDs of the different-order fractional derivatives for the soil samples in the training set. Similar to previous research findings [32,56], the change in the soil’s original reflectance is relatively gentle, with an increasing trend as the wavelength increases. However, our results show a reflectance peak around 600 nm, which can be attributed to extensive weathering in the study area, resulting in rock fragments in the soil. Consequently, the soil spectrum is a mixture of soil and rock spectra. Secondary minerals prevalent in soil and weathered rocks, such as hematite and goethite, possess strong absorption features in the visible light range (especially 400–700 nm). The absorption features of these minerals (e.g., hematite near ~550 nm) cause a relative increase in reflectance at adjacent wavelengths, resulting in the observed peak at approximately 600 nm.
Figure 5 indicates that extracting meaningful information from the original reflectance spectra is challenging due to the broad and overlapping spectral absorption bands. As the fractional order rises, the spectral values fluctuate significantly, resulting in sharper spectral peaks and a trend to converge toward zero. For instance, an absorption valley is observed around 940 nm, and a peak occurs around 1030 nm. Using fractional derivatives eliminates overlapping peaks and baseline drifts, facilitating the extraction of spectral information reflecting the copper content.

3.3. Optimal Three-Band Spectral Index

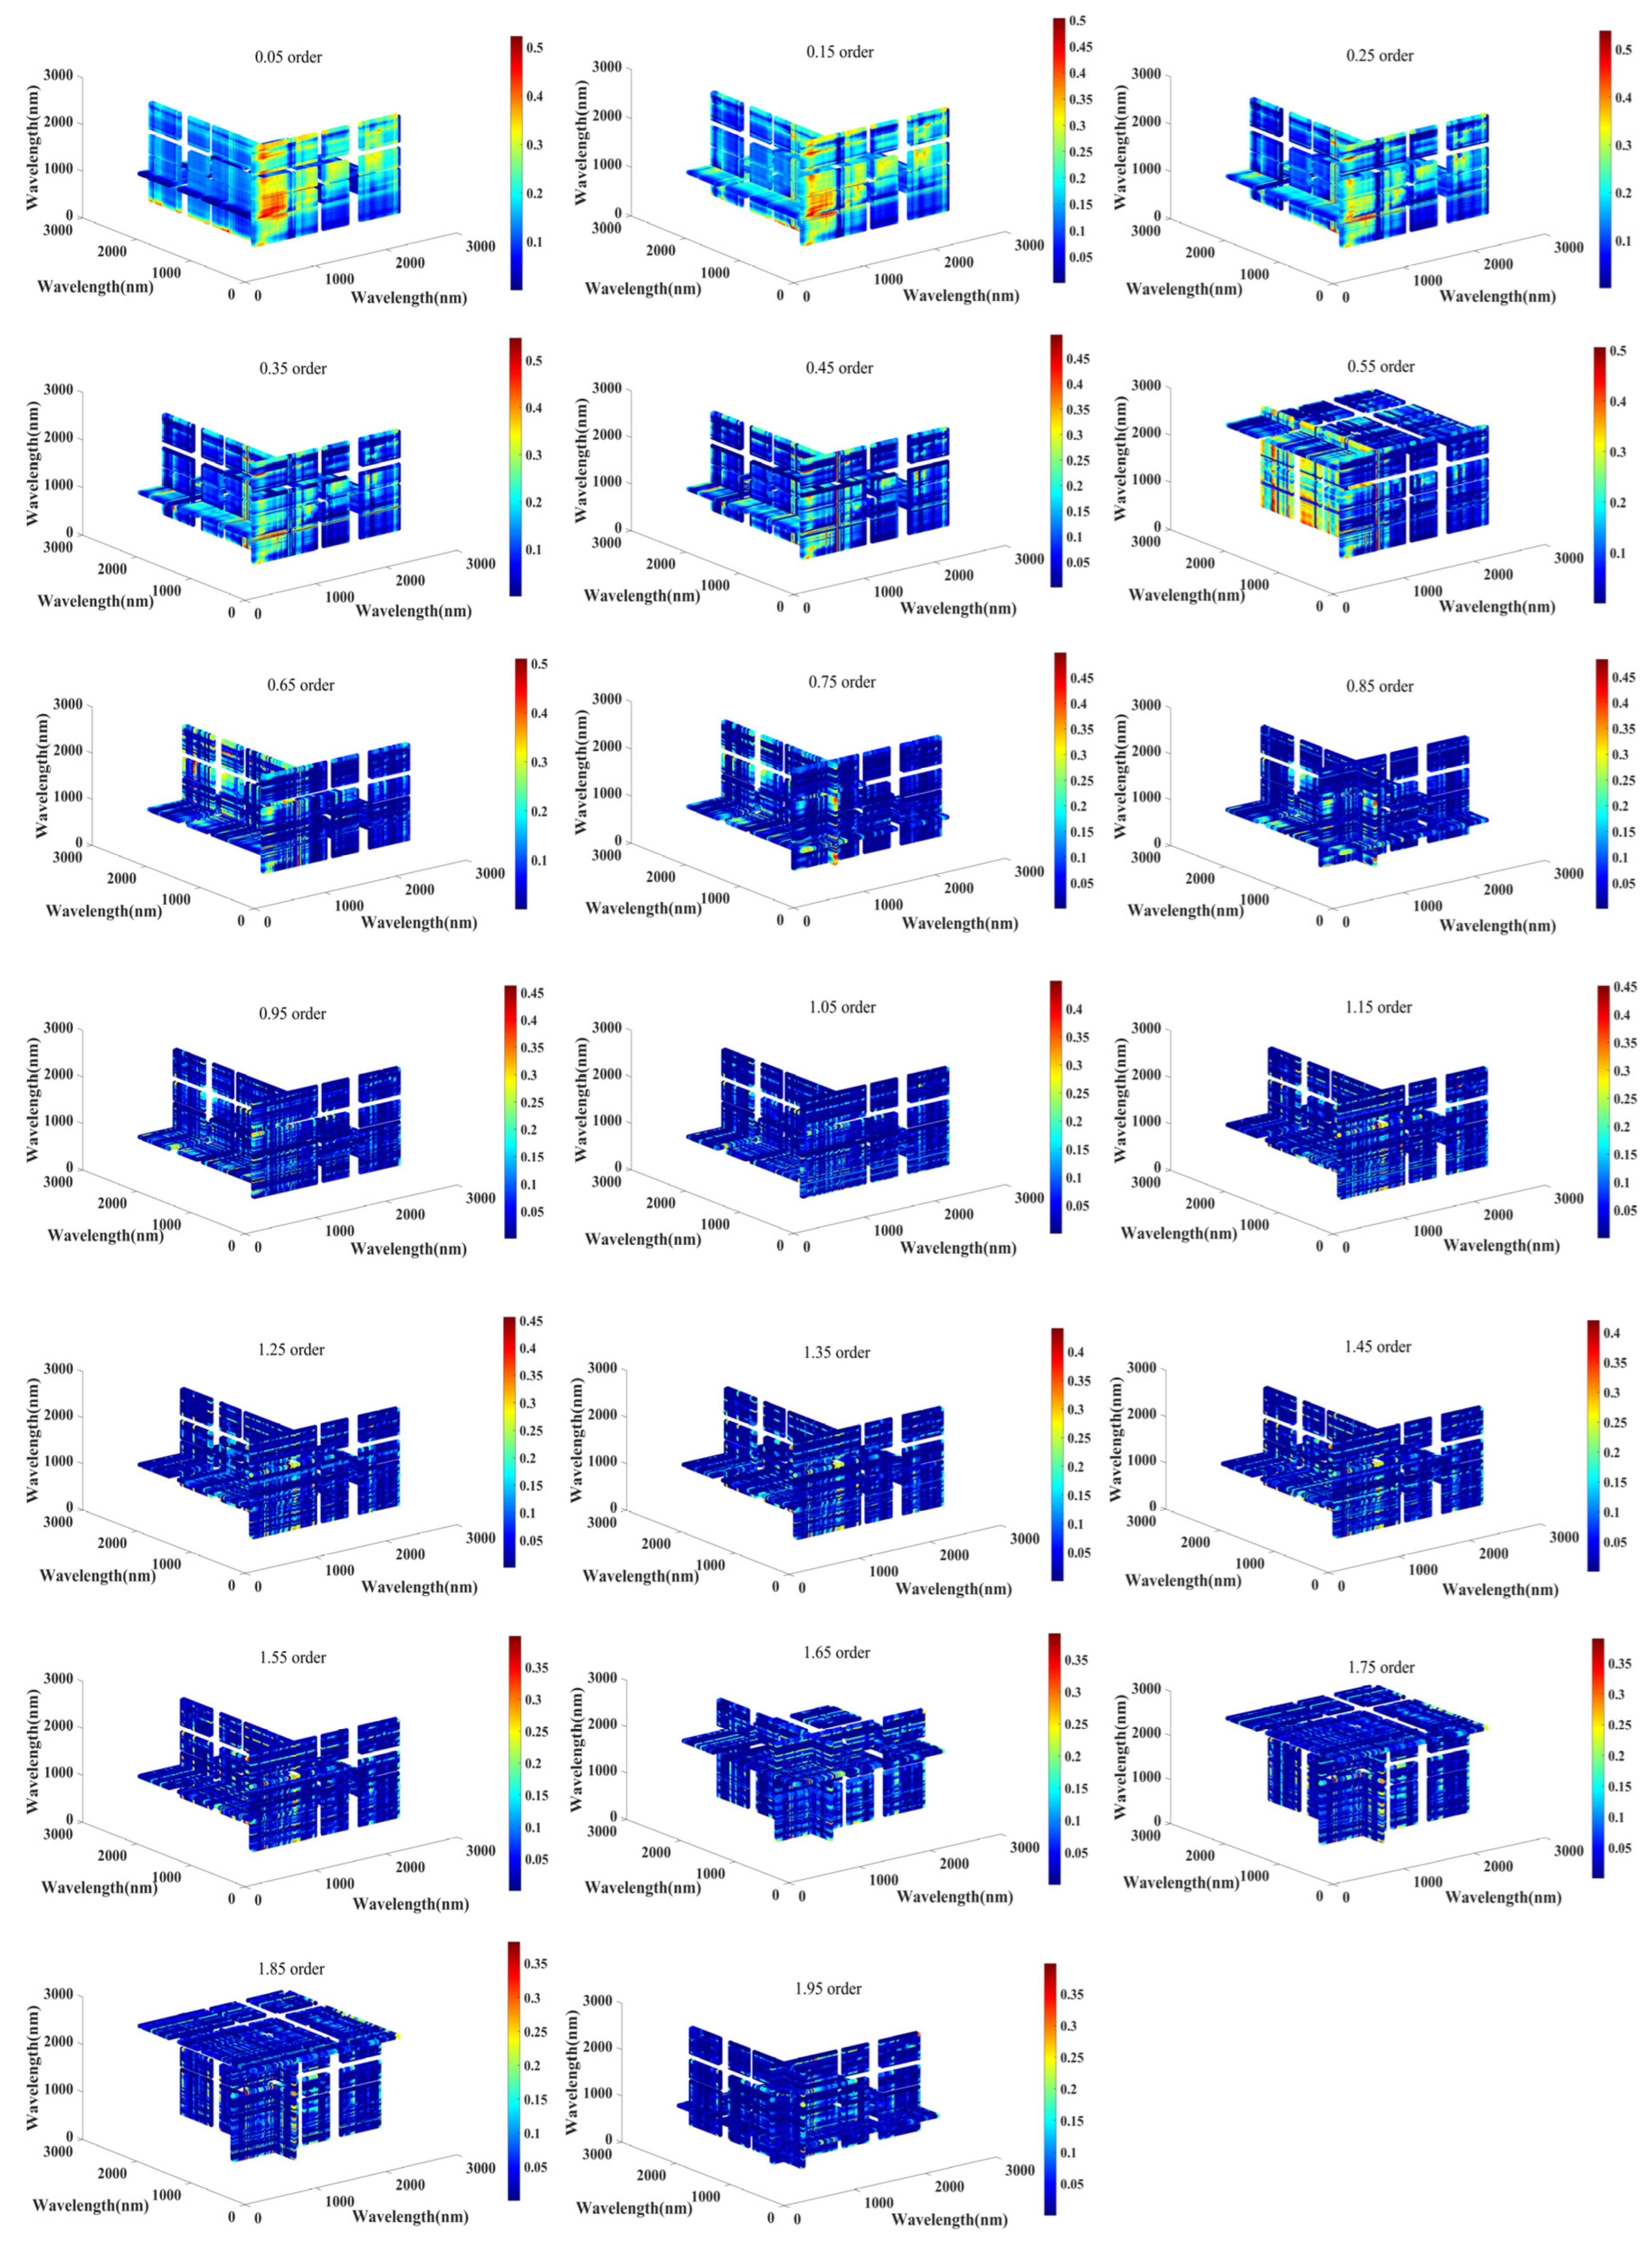
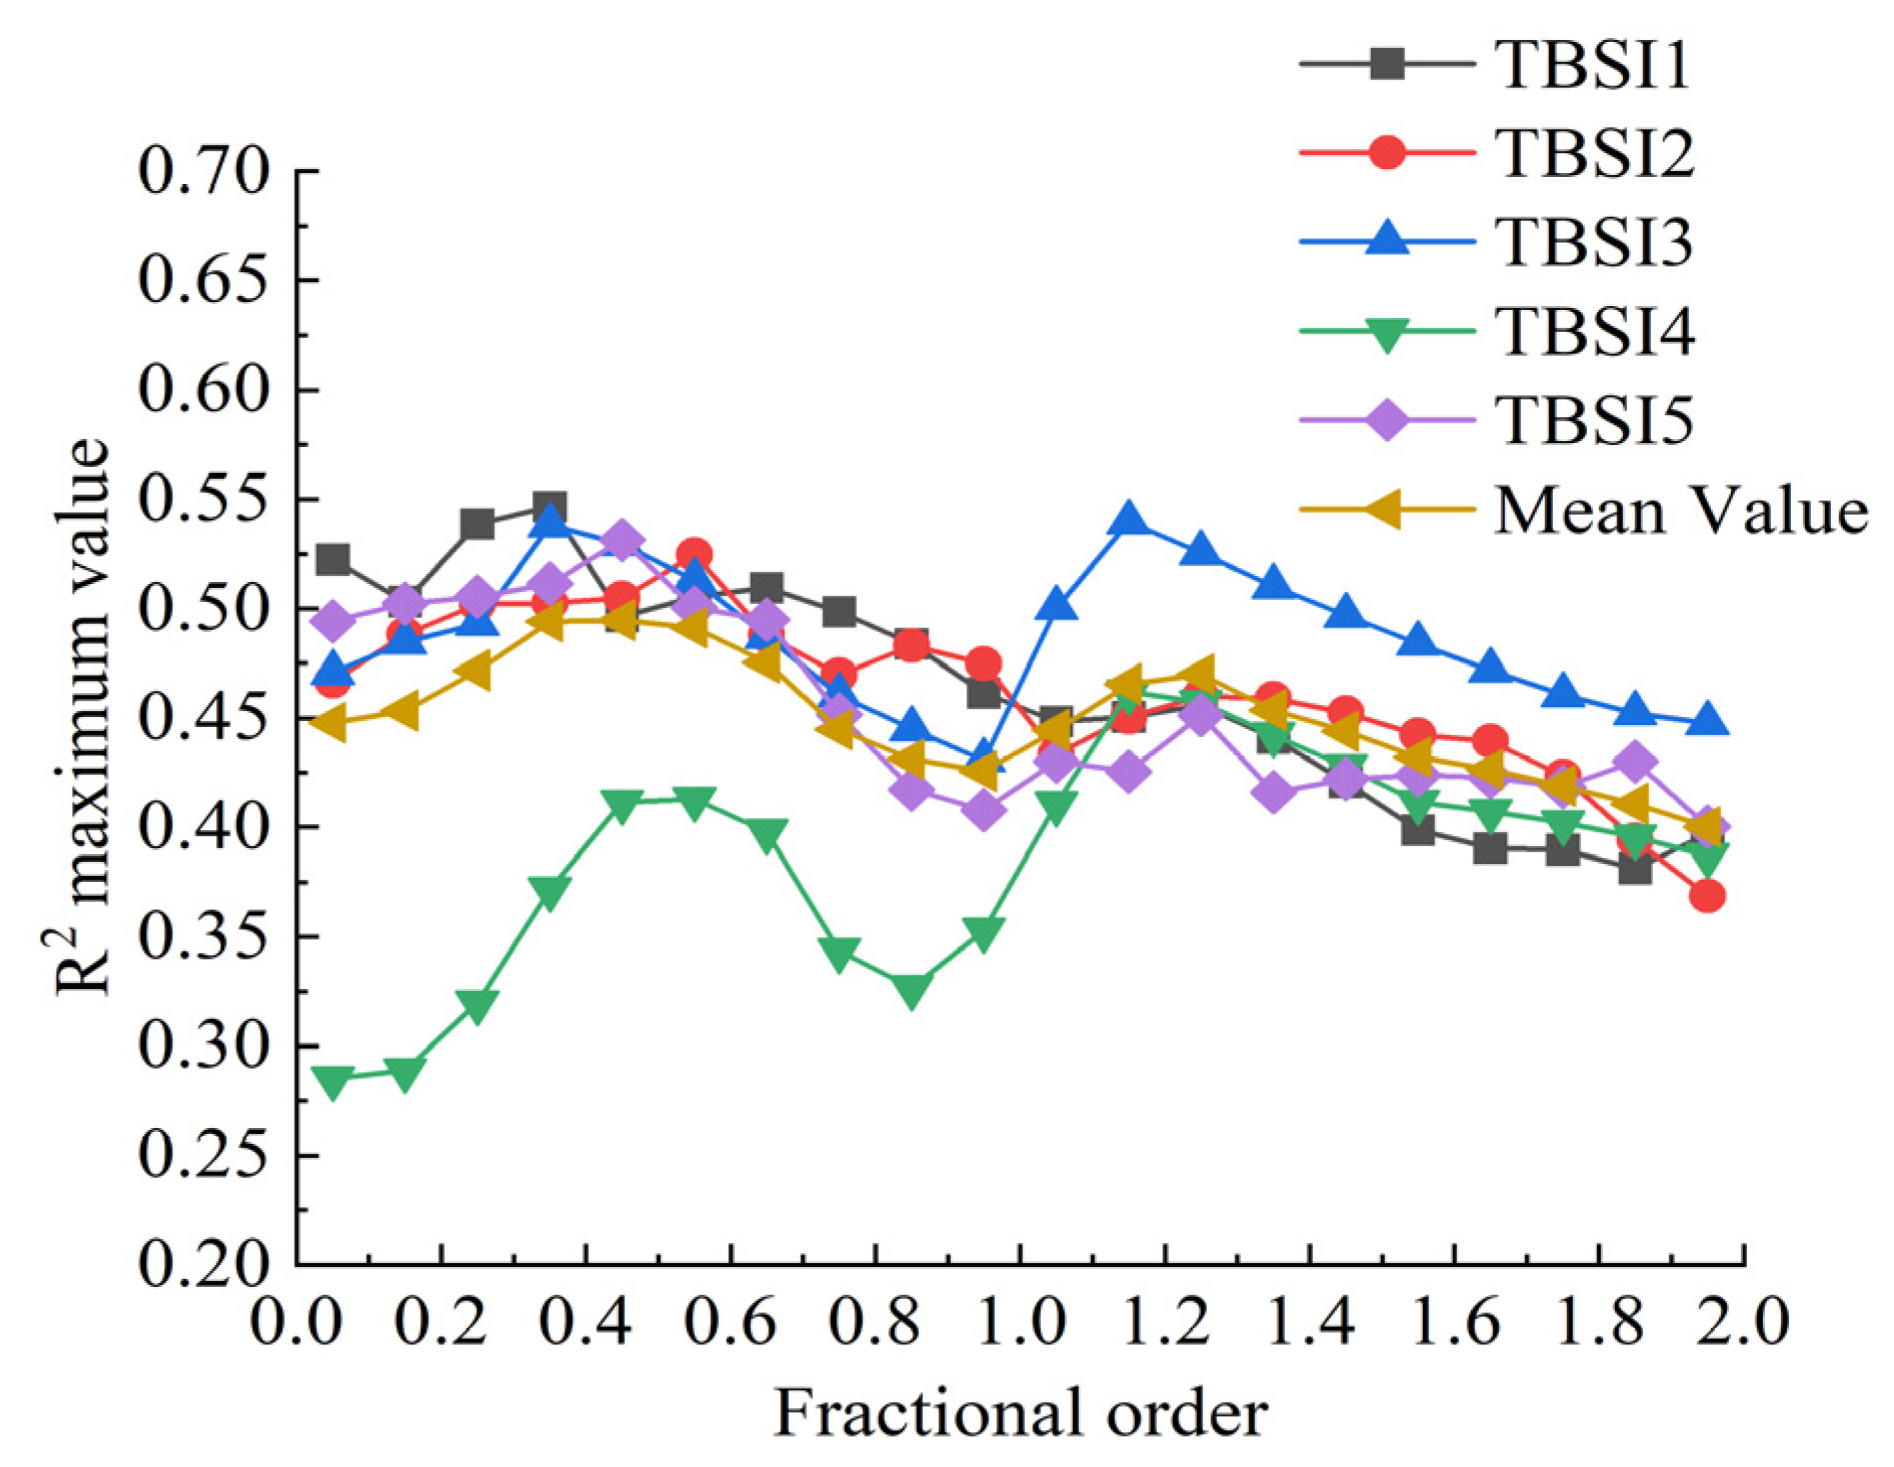
The R2 values for the relationship between the copper content and the three-band spectral indices (TBSI1) for different fractional derivatives in the 400–2400 nm range are presented in Figure 6. The deeper the shade of red, the stronger the correlation. The same color scheme is used for the other three-band spectral indices (TBSI2, TBSI3, TBSI4, and TBSI5). Figure 7 shows similar patterns of the TBSI1, TBSI2, TBSI3, TBSI4, and TBSI5. As the fractional order increases, the correlation increases and decreases, which may be attributed to more meaningful information. All indices except TBSI4 use low-order (<0.6) derivatives to maximize the R2 value. As the order of the fractional derivative increases, more detailed information is revealed. However, when the order is very high, it introduces excessive noise, impacting the correlation. Thus, selecting the appropriate order of the fractional derivative is vital to maintaining a balance between information and noise. The optimal three-band combinations in TBSI1, TBSI2, TBSI3, TBSI4, and TBSI5 were statistically analyzed, as shown in Table 2. The analysis reveals that the optimal band combination for the three-band index TBSI1 consists of spectral values from the 768.904 nm, 426.696 nm, and 974.245 nm wavelength bands with a 0.35-order derivative (denoted as TBSI1 (768.904, 426.696, 974.245, and 0.35 order)), resulting in an R2 of 0.55. For TBSI2, the optimal band combination includes spectral values from the 768.904 nm, 632.170 nm, and 922.910 nm wavelength bands with a 0.55-order derivative (denoted as TBSI2 (768.904, 632.170, 922.910, and 0.55 order)), yielding an R2 of 0.52. For TBSI3, the optimal combination includes spectral values from the 426.696 nm, 512.275 nm, and 974.245 nm wavelength bands with a 0.35-order derivative (denoted as TBSI3 (426.696, 512.275, 974.245, and 0.35 order)) and from the 443.812 nm, 786.016 nm, and 460.927 nm wavelength bands with a 1.15-order derivative (denoted as TBSI3 (443.812, 786.016, 460.927, and 1.15 order)), resulting in an R2 value of 0.54. For TBSI4, the optimal band combination includes spectral values from the 443.812 nm, 786.016 nm, and 460.927 nm wavelength bands with a 1.15-order derivative (denoted as TBSI4 (443.812,786.016, 460.927, and 1.15 order)), resulting in an R2 of 0.46. For TBSI5, the optimal combination features spectral values from the 632.170 nm, 922.910 nm, and 768.904 nm wavelength bands with a 0.45-order derivative (denoted as TBSI5 (632.170, 922.910, 768.904, and 0.45 order)), yielding an R2 of 0.53. Based on an analysis of 60 samples in the training set, six three-band spectral indices showed significantly higher correlations (p < 0.001) with the copper content than the other band combinations. Therefore, they were utilized in developing a quantitative estimation model of the copper content.

3.4. Performance of Copper Content Estimation Model

The six three-band spectral indices, namely TBSI1(768.904, 426.696, 974.245, 0.35 order), TBSI2(768.904, 632.170, 922.910, 0.55 order), TBSI3 (426.696, 512.275, 974.245, 0.35 order), TBSI3 (443.812, 786.016, 460.927, 1.15 order), TBSI4(443.812,786.016, 460.927, 1.15 order) and TBSI5 (632.170, 922.910, 768.904, 0.45 order) were used to construct estimation models. The testing set was used to evaluate the accuracy and predictive capability. The evaluation results are summarized in Table 3, indicating low prediction accuracy. The model with TBSI3 (426.696 nm, 512.275 nm, 974.245 nm, and 0.35 order) has the highest accuracy, but the R2 for the test set is only 0.51. This model has an RPD of 1.46, whereas the other five models have RPD values lower than 1.4; thus, they are unsuitable for prediction.
To optimize the utilization of spectral information. Initially, six spectral indices were utilized as independent variables to create a three-band index, followed by developing an estimation model using this index. The model was validated on the test set data to assess its accuracy and predictive capability. The evaluation results in Table 4 indicate a significant improvement in model accuracy and predictive capability due to the improved spectral indices. The model with TBSI1 [TBSI5 (632.170 nm, 922.910 nm, 768.904 nm, and 0.45 order), TBSI2 (768.904 nm, 632.170 nm, 922.910 nm, and 0.55 order), and TBSI3 (426.696 nm, 512.275 nm, 974.245 nm, and 0.35 order)] exhibits the best performance. It achieves an R2 of 0.56 and an RPD of 1.52 on the test data. The comparison with the previous optimal model using TBSI3 (426.696 nm, 512.275 nm, 974.245 nm, and 0.35 order) indicates a lower performance, with R2 and RPD values of 0.51 and 1.46. This result demonstrates the superior accuracy and predictive ability of the model with the new spectral indices. The scatter plot in Figure 8 displays the relationship between the predicted and measured values for the test set. The predicted values are uniformly distributed on either side of the 1:1 line (black line), not completely biased to one side, indicating that the predicted values are not systematically biased above (overestimated) or below (underestimated) the measured values.

4. Discussion

The GF-5 hyperspectral instrument provides high spectral resolution and large coverage, surpassing drones and ground remote sensing capabilities. However, the high altitude and atmospheric interference affect spaceborne hyperspectral remote sensing data, leading to increased noise levels. Influencing factors include atmospheric disturbances, cloud cover, periodic sensor drift, electromagnetic interference between payload components, and noise generated by interactions between spectral bands. Noise can introduce errors into models for estimating the copper content using spectral data. Additionally, the low copper content in the soil results in a weak spectral response. The spectral features of other soil components may mask the spectral response of copper, complicating the establishment of an accurate copper content estimation model. Therefore, the primary focus in utilizing soil spectra to construct a hyperspectral quantitative estimation model is enhancing the spectral response of copper while mitigating the effects of background noise. Several studies have shown that using the derivative of the reflectance spectrum can eliminate background noise [57,58,59]. Derivative spectra are classified into fractional and integer derivative spectra. A critical issue in preprocessing soil spectra using integer-order derivative transformations, such as first-order and second-order derivatives, is the significant difference in the shapes of consecutive differential curves caused by large derivative intervals [60,61]. This discrepancy makes it challenging to capture the subtle variations in the slope or curvature of the spectral curve, which are essential for extracting soil biochemical information. In contrast, fractional derivatives utilize smaller derivative intervals, enabling the capture of detailed spectral information without introducing excessive high-frequency noise. Therefore, many researchers have employed fractional derivative spectroscopy to develop quantitative estimation models for soil biochemical parameters, yielding satisfactory results [62,63,64,65,66,67,68]. Therefore, we used fractional derivatives.
Hyperspectral data have high spectral resolution, providing rich information to detect subtle features in soil spectra. However, spectral data redundancy and multicollinearity have to be considered because they increase complexity, computational requirements, and processing times, and unnecessary spectral information is incorporated into soil spectra-based estimation models. It may result in overfitting, diminishing the model’s robustness and generalization capability. An indicator of this is high accuracy on the training dataset but low accuracy on the test dataset. Reducing redundancy and multicollinearity in hyperspectral data is crucial to obtaining a quantitative estimation model for biochemical parameters using soil spectra. Researchers have utilized various band selection techniques, such as genetic algorithms, competitive weighted resampling, eliminating non-informative variables, continuous projection algorithms, and stepwise regression analysis [69,70,71]. These methods reduce model complexity and improve accuracy, providing a practical approach to dimensionality reduction. However, they do not consider the interactions and correlations between different wavelengths and may not be suitable for nonlinear relationships. Spectral indices have been increasingly used to address the above issues and construct quantitative estimation models for soil biochemical parameters [72,73,74]. However, most studies used two-band spectral indices, whereas three-band indices were rarely used. Since three-band spectral indices utilize more spectral information than two-band indices, the resulting models have higher accuracy [56,75]. Therefore, this study also uses a three-band index to construct the model. Table 5 compares the accuracy of models with three-band spectral indices and those using ratios, differences, and normalized two-band spectral indices. The models with three-band spectral indices have significantly higher accuracy, which is consistent with previous research findings [46]. This study used three-band spectral indices as independent variables to establish spectral models, which is an innovative aspect of this research. The TBSI1 [TBSI5 (632.170 nm, 922.910 nm, 768.904 nm, and 0.45 order), TBSI2 (768.904 nm, 632.170 nm, 922.910 nm, and 0.55 order), TBSI3 (426.696 nm, 512.275 nm, 974.245 nm, and 0.35 order)] is the optimal three-band spectral index for estimating soil copper content. The proposed spectral index incorporates six characteristic bands: three in the visible range (426.696 nm, 512.275 nm, and 632.170 nm) and three in the near-infrared range (768.904 nm, 922.910 nm, and 974.245 nm). The visible bands (426.696 nm, 512.275 nm, and 632.170 nm) are predominantly distributed in the 400–630 nm region. The spectral features in this range primarily reflect the absorption characteristics of SOM and iron oxides. Copper ions (Cu2+) readily form stable complexes with SOM, altering its spectral absorption properties. Concurrently, copper frequently undergoes co-precipitation with iron oxides or adsorbs onto their surfaces. Since the content and form of iron oxides significantly influence their spectral signatures, these alterations are critical. The near-infrared bands (768.904 nm, 922.910 nm, and 974.245 nm) are primarily employed to characterize and correct for two significant background factors that strongly affect the spectrum and are closely linked to the copper’s behavior: soil moisture and clay minerals (including hydroxyl-bearing minerals). This spectral index was designed using specific band combinations to amplify the signals related to copper-induced changes in SOM/iron oxides, while effectively suppressing interference from background factors, such as moisture and clay minerals. The analysis indicates that the proposed index is highly correlated with soil mineral components and possesses clear physical significance. The three-band index uses spectral values from only nine bands, resulting in a straightforward model, which is its significant advantage. This index and the GF-5 images can be used to determine the soil copper content in large areas. Regions with very high copper pollution can be extracted, and effective remediation measures can be implemented.

5. Conclusions

We proposed a novel method for estimating soil copper content using a three-band spectral index model based on the fractional derivatives of the reflectance spectrum derived from GF-5 hyperspectral data. This straightforward approach captures subtle spectral characteristics related to the copper content. However, the accuracy of the model depends significantly on the fractional order, band position, and spectral index. Notably, models with fractional order spectra below 0.6 exhibited high accuracy and strong predictive capabilities. The three-band index TBSI3 R [ 0.35   order ] 426.696 R [ 0.35   order ] 512.275 × R [ 0.35   order ] 974.245 , which uses spectral values from the 426.696, 512.275, and 974.245 nm wavelengths with 0.35-order derivatives, had the best performance. The model with this index had an R2 value of 0.51 and an RPD value of 1.46. We proposed a novel approach that identifies three-band indices with a strong correlation with the copper content. Subsequently, these indices were used as independent variables to develop new spectral indices for model development. The model with the new spectral index TBSI1 R [ 0.45   order ] 632.170     R [ 0.45   order ] 922.910   +   R [ 0.45   order ] 768.904 R [ 0.45   order ] 632.170   +   R [ 0.45   order ] 922.910     R [ 0.45   order ] 768.904 R [ 0.55   order ] 768.904 R [ 0.55   order ] 922.910 + R [ 0.55   order ] 632.170 × R [ 0.35   order ] 426.696 2 × R [ 0.35   order ] 512.275 + R [ 0.35   order ] 974.245 exhibited the optimum performance, outperforming models using the spectral values of individual bands. The R2 value increased from 0.51 to 0.56, and the RPD value increased from 1.46 to 1.52. Owing to its simplicity, this model has significant application potential. It can utilize GF-5 satellite data to generate large-scale soil copper distribution maps, rapidly identify heavy metal pollution hotspots, and provide critical support for environmental risk assessment and pollution surveys. Furthermore, leveraging the satellite’s revisit capability enables dynamic monitoring of copper content changes in key areas (e.g., mining zones, wastewater-irrigated areas), facilitates evaluation of effectiveness, and informs soil protection and restoration decisions. Future work should validate the model’s generalizability across broader regions and soil types and assess the integration of multi-source data or advanced algorithms to enhance accuracy. These improvements will support the model’s integration into operational monitoring networks, providing tangible support for soil pollution prevention and control.

Author Contributions

Conceptualization, S.C.; methodology, S.C.; software, S.C.; validation, G.J.; formal analysis, S.C.; investigation, J.L.; resources, G.J.; data curation, G.J.; writing—original draft preparation, S.C.; writing—review and editing, G.J.; visualization, G.J.; supervision, G.J.; project administration, S.C.; funding acquisition, S.C. All authors have read and agreed to the published version of the manuscript.

Funding

This research was funded by the Xinjiang Uygur Autonomous Region Tianchi talented young doctor program, the Shanxi Province Key Laboratory of Metallogeny and Assessment of Strategic Mineral Resources (ZLPJ-JC-2024-07), the Natural Science Foundation of Xinjiang Uygur Autonomous Region (2023D01B04), the Strategic Priority Research Program of Chinese Academy of Sciences (XDA0430103).

Institutional Review Board Statement

Not applicable.

Informed Consent Statement

Not applicable.

Data Availability Statement

The original contributions presented in this study are included in the article; further inquiries can be directed to the corresponding author.

Conflicts of Interest

The authors declare that they have no known competing financial interests or personal relationships that could have influenced the work reported in this study.

References

  1. Shi, T.Z.; Chen, Y.Y.; Liu, Y.L.; Wu, G.F. Visible and Near-Infrared Reflectance Spectroscopy—An Alternative for Monitoring Soil Contamination by Heavy Metals. J. Hazard. Mater. 2014, 265, 166–176. [Google Scholar] [CrossRef] [PubMed]
  2. Torres-Sallan, G.; Schulte, R.P.O.; Lanigan, G.; Byrne, K.A.; Reidy, B.; Simo, I.; Six, J.; Creamer, R.E. Clay Illuviation Provides a Long-Term Sink for C Sequestration in Subsoils. Sci. Rep. 2017, 7, 45635. [Google Scholar] [CrossRef] [PubMed]
  3. Habashi, J.; Moghadam, H.J.; Oskouei, M.M.; Pour, A.B.; Hashim, M. PRISMA Hyperspectral Remote Sensing Data for Mapping Alteration Minerals in Sar-e-Châh-e-Shur Region, Birjand, Iran. Remote Sens. 2024, 16, 1277. [Google Scholar] [CrossRef]
  4. Mahboob, M.A.; Celik, T.; Genc, B. Predictive Modelling of Mineral Prospectivity Using Satellite Remote Sensing and Machine Learning Algorithms. Remote Sens. Appl. Soc. Environ. 2024, 36, 101316. [Google Scholar] [CrossRef]
  5. Santos, D.; Azzalini, A.; Mendes, A.; Cardoso-Fernandes, J.; Lima, A.; Müller, A.C.; Teodoro, A. Optimizing Exploration: Synergistic Approaches to Minimize False Positives in Pegmatite Prospecting. Ore Geol. Rev. 2024, 175, 106347. [Google Scholar] [CrossRef]
  6. Ahmed, I.; Liu, H.F.; Chen, R.J.; Ahmad, J.; Shah, S.A.; Fahad, S.; Rahim, O.A.; Ullah, F.; Rui, L. Geothermal Resource Exploration in Reshi Town by Integrated Geophysical Methods. Energies 2024, 17, 856. [Google Scholar] [CrossRef]
  7. Halford, D.T.; Karolyte, R.; Dellenbach, J.T.; Cathey, B.; Cathey, M.; Balentine, D.; Andreason, M.W.; Rice, G.K. Applications in Utilizing Soil Gas Geochemistry Along with Geological and Geophysical Data to Construct Helium Exploration Statistical Models. Front. Earth Sci. 2024, 12, 1434785. [Google Scholar] [CrossRef]
  8. Sumanovac, F.; Kapuralic, J.; Pavicic, I.; Perkovic, L. Assessment of Near-Surface Geophysical Methods Used to Discover Karst Bauxite Deposits in the Dinarides Using the Example of Posušje Area, Bosnia and Herzegovina. Minerals 2024, 14, 378. [Google Scholar] [CrossRef]
  9. Henne, A.; Noble, R.R.P.; Williams, M. Multi-Element Geochemical Analyses on Ultrafine Soils in Western Australia—Towards Establishing Abundance Ranges in Mineral Exploration Settings. J. Geochem. Explor. 2024, 24, geochem2023-043. [Google Scholar] [CrossRef]
  10. Puchhammer, P.; Kalubowila, C.; Braus, L.; Pospiech, S.; Sarala, P.; Filzmoser, P. A Performance Study of Local Outlier Detection Methods for Mineral Exploration with Geochemical Compositional Data. J. Geochem. Explor. 2024, 258, 107392. [Google Scholar] [CrossRef]
  11. Sadeghi, B.; Molayemat, H.; Pawlowsky-Glahn, V. How to Choose a Proper Representation of Compositional Data for Mineral Exploration? J. Geochem. Explor. 2024, 259, 107425. [Google Scholar] [CrossRef]
  12. Cheng, Y.Y.; Zhou, K.F.; Wang, J.L.; Cui, S.C.; Yan, J.N.; De Maeyer, P.; Van de Voorde, T. Regional Metal Pollution Risk Assessment Based on a Long Short-Term Memory Model: A Case Study of the South Altai Mountain Mining Area, China. J. Clean. Prod. 2022, 379, 134755. [Google Scholar] [CrossRef]
  13. Buaisha, M.; Balku, S.; Özalp-Yaman, S. Heavy Metal Removal Investigation in Conventional Activated Sludge Systems. Civ. Eng. J. 2020, 6, 470–477. [Google Scholar] [CrossRef]
  14. Cheng, Y.Y.; Zhou, K.F.; Wang, J.L.; Cui, S.C.; Yan, J.N.; De Maeyer, P.; Van de Voorde, T. Regional Metal Pollution Risk Assessment Based on a Big Data Framework: A Case Study of the Eastern Tianshan Mining Area, China. Ecol. Indic. 2022, 145, 109585. [Google Scholar] [CrossRef]
  15. Liu, X.M.; Song, Q.J.; Tang, Y.; Li, W.L.; Xu, J.M.; Wu, J.J.; Wang, F.; Brookes, P.C. Human Health Risk Assessment of Heavy Metals in Soil-Vegetable System: A Multi-Medium Analysis. Sci. Total. Environ. 2013, 463, 530–540. [Google Scholar] [CrossRef]
  16. Mwesigye, A.R.; Young, S.D.; Bailey, E.H.; Tumwebaze, S.B. Population Exposure to Trace Elements in the Kilembe Copper Mine Area, Western Uganda: A Pilot Study. Sci. Total. Environ. 2016, 573, 366–375. [Google Scholar] [CrossRef]
  17. Hofer, C.; Borer, F.; Bono, R.; Kayser, A.; Papritz, A. Predicting Topsoil Heavy Metal Content of Parcels of Land: An Empirical Validation of Customary and Constrained Lognormal Block Kriging and Conditional Simulations. Geoderma 2013, 193, 200–212. [Google Scholar] [CrossRef]
  18. Francos, N.; Gholizadeh, A.; Ben Dor, E. Spatial Distribution of Lead (Pb) in Soil: A Case Study in a Contaminated Area of the Czech Republic. Geomat. Nat. Hazards Risk 2022, 13, 610–620. [Google Scholar] [CrossRef]
  19. Duru, S.C.; Echiegu, E.A.; Anyadike, C.C.; Alaneme, G.U.; Okechukwu, M.E. Spatial Variability of Heavy Metals Concentrations in Soil of Auto-Mechanic Workshop Clusters in Nsukka, Nigeria. Sci. Rep. 2024, 14, 9681. [Google Scholar] [CrossRef] [PubMed]
  20. Chandra, K.; Proshad, R.; Islam, M.; Idris, A.M. An Integrated Overview of Metals Contamination, Source-Specific Risks Investigation in Coal Mining Vicinity Soils. Environ. Geochem. Health 2023, 45, 7425–7458. [Google Scholar] [CrossRef] [PubMed]
  21. Islam, A.M.T.; Varol, M.; Habib, M.A.; Khan, R. Risk Assessment and Source Apportionment for Metals in Sediments of Kaptai Lake in Bangladesh Using Individual and Synergistic Indices and a Receptor Model. Mar. Pollut. Bull. 2023, 190, 114845. [Google Scholar] [CrossRef]
  22. Kurochkin, I.N.; Trifonova, T.A.; Kurbatov, Y.N. Heavy Metals in Soils of Various Functional Zones of Urbanized Territories: Assessment of the Content and Environmental Risk. Theor. Appl. Ecol. 2023, 2, 38–46. [Google Scholar] [CrossRef]
  23. Li, J.; Heap, A.D. A review of comparative studies of spatial interpolation methods in environmental sciences: Performance and impact factors. Ecol. Inform. 2011, 6, 228–241. [Google Scholar] [CrossRef]
  24. Wu, J.; Norvell, W.A.; Welch, R.M. Kriging on highly skewed data for DTPA-extractable soil Zn with auxiliary information for pH and organic carbon. Geoderma 2006, 134, 187–199. [Google Scholar] [CrossRef]
  25. Xia, K.; Wu, T.X.; Zhang, S.W.; Wang, S.D.; Li, X.T.; Shen, Q.; Li, T. A New Method for High-Precision Estimation of Soil Organic Matter Using Two-Dimensional Correlation Spectroscopy to Support Collaborative Use of Global Open Soil Spectral Libraries. Geoderma 2024, 445, 116877. [Google Scholar] [CrossRef]
  26. Zhou, W.; Yang, H.; Xie, L.J.; Li, H.R.; Huang, L.; Zhao, Y.P. Hyperspectral Inversion of Soil Heavy Metals in Three-River Source Region Based on Random Forest Model. Catena 2021, 202, 105222. [Google Scholar] [CrossRef]
  27. Jordanova, D.; Goddu, S.R.; Kotsev, T.; Jordanova, N. Industrial Contamination of Alluvial Soils Near Fe-Pb Mining Site Revealed by Magnetic and Geochemical Studies. Geoderma 2013, 192, 237–248. [Google Scholar] [CrossRef]
  28. Zhang, X.; Sun, Y.X.; Shang, K.; Ding, S.T.; Sun, W.C. Soil Cd Content Retrieval from Hyperspectral Remote Sensing Data Based on Organic Matter Characteristic Spectral Bands. Trans. Chin. Soc. Agric. Mach. 2024, 55, 186–195, (In Chinese with English Abstract). [Google Scholar] [CrossRef]
  29. Abrantes, G.; Almeida, V.; Maia, A.J.; Nascimento, R.; Nascimento, C.; Silva, Y.; Silva, Y.; Veras, G. Comparison between Variable-Selection Algorithms in PLS Regression with Near-Infrared Spectroscopy to Predict Selected Metals in Soil. Molecules 2023, 28, 6959. [Google Scholar] [CrossRef]
  30. Wang, X.; An, S.; Xu, Y.Q.; Hou, H.P.; Chen, F.Y.; Yang, Y.J.; Zhang, S.; Liu, R. A Back Propagation Neural Network Model Optimized by Mind Evolutionary Algorithm for Estimating Cd, Cr, and Pb Concentrations in Soils Using Vis-NIR Diffuse Reflectance Spectroscopy. Appl. Sci. 2020, 10, 51. [Google Scholar] [CrossRef]
  31. Kaestner, F.; Sut-Lohmann, M.; Ramezany, S.; Raab, T.; Feilhauer, H.; Chabrillat, S. Estimating Heavy Metal Concentrations in Technosols with Reflectance Spectroscopy. Geoderma 2022, 406, 115512. [Google Scholar] [CrossRef]
  32. Cui, S.C.; Zhou, K.F.; Ding, R.F.; Cheng, Y.Y.; Jiang, G. Estimation of soil copper content based on fractional-order derivative spectroscopy and spectral characteristic band selection. Spectrochim. Acta A Mol. Biomol. Spectrosc. 2022, 275, 121190. [Google Scholar] [CrossRef] [PubMed]
  33. Nawar, S.; Mohamed, E.S.; Sayed, S.E.E.; Mohamed, W.S.; Rebouh, N.Y.; Hammam, A.A. Estimation of Key Potentially Toxic Elements in Arid Agricultural Soils Using Vis-NIR Spectroscopy with Variable Selection and PLSR Algorithms. Front. Environ. Sci. 2023, 12, 1222871. [Google Scholar] [CrossRef]
  34. Tepanosyan, G.; Muradyan, V.; Tepanosyan, G.; Avetisyan, R.; Asmaryan, S.; Sahakyan, L.; Denk, M.; Glasser, C. Exploring Relationship of Soil PTE Geochemical and VIS-NIR Spectroscopy Patterns Near Cu-Mo Mine, Armenia. Environ. Pollut. 2023, 323, 121180. [Google Scholar] [CrossRef] [PubMed]
  35. Zhang, Z.L.; Wang, Z.; Luo, Y.; Zhang, J.Q.; Tian, D.; Zhang, Y.D. Rapid Estimation of Soil Pb Concentration Based on Spectral Feature Screening and Multi-Strategy Spectral Fusion. Sensors 2023, 23, 7707. [Google Scholar] [CrossRef]
  36. Subi, X.; Eziz, M.; Zhong, Q.; Li, X.G. Estimating the Chromium Concentration of Farmland Soils in an Arid Zone from Hyperspectral Reflectance Using Partial Least Squares Regression Methods. Ecol. Indic. 2023, 161, 111987. [Google Scholar] [CrossRef]
  37. Azizi, K.; Ayoubi, S.; Nabiollahi, K.; Garosi, Y.; Gislum, R. Predicting Heavy Metal Contents by Applying Machine Learning Approaches and Environmental Covariates in West Iran. J. Geochem. Explor. 2022, 233, 106921. [Google Scholar] [CrossRef]
  38. Tasan, M.; Demir, Y.; Tasan, S.; Ozturk, E. Comparative Analysis of Different Machine Learning Algorithms for Predicting Trace Metal Concentrations in Soils Under Intensive Paddy Cultivation. Comput. Electron. Agric. 2024, 219, 108772. [Google Scholar] [CrossRef]
  39. Xu, X.B.; Ren, M.Y.; Gao, J.F.; Wu, Q.Y.; Liu, P.Y.; Lv, J.S. Spectroscopic diagnosis of zinc contaminated soils based on competitive adaptive reweighted sampling algorithm and an improved support vector machine. Spectrosc. Lett. 2020, 53, 86–99. [Google Scholar] [CrossRef]
  40. Mouazen, A.M.; Nyarko, F.; Qaswar, M.; Tóth, G.; Gobin, A.; Moshou, D. Spatiotemporal Prediction and Mapping of Heavy Metals at Regional Scale Using Regression Methods and Landsat 7. Remote Sens. 2021, 13, 4615. [Google Scholar] [CrossRef]
  41. Guo, H.Y.; Yang, K.; Wu, F.; Chen, Y.; Shen, J.X. Regional Inversion of Soil Heavy Metal Cr Content in Agricultural Land Using Zhuhai-1 Hyperspectral Images. Sensors 2023, 23, 8756. [Google Scholar] [CrossRef]
  42. Wang, Y.; Abliz, A.; Ma, H.B.; Liu, L.; Kurban, A.; Halik, Ü.; Pietikainen, M.; Wang, W. Hyperspectral Estimation of Soil Copper Concentration Based on Improved TabNet Model in the Eastern Junggar Coalfield. IEEE Trans. Geosci. Remote Sens. 2022, 60, 5534020. [Google Scholar] [CrossRef]
  43. Sawut, R.; Kasim, N.; Abliz, A.; Li, H.; Yalkun, A.; Maihemuti, B. Investigation of Optimized Indices for Assessing Heavy Metal Levels in Soils Surrounding an Open Pit Coal Mine. Int. J. Appl. Earth Observ. Geoinf. 2018, 73, 14–25. [Google Scholar] [CrossRef]
  44. Lin, X.; Su, Y.C.; Shang, J.L.; Sha, J.M.; Li, X.M.; Sun, Y.Y. Hyperspectral Modeling of Soil Zinc Levels Using Geographically Weighted Regression: The Impact of Fractional-Order Differential. Remote Sens. 2019, 11, 636. [Google Scholar] [CrossRef]
  45. Vina, A.; Gitelson, A.A.; Nguy-Robertson, A.L.; Peng, Y. Comparative Analysis of Various Vegetation Indices for the Remote Evaluation of Green Leaf Area Index in Crops. Remote Sens. Environ. 2011, 115, 3468–3478. [Google Scholar] [CrossRef]
  46. Zhang, Z.P.; Ding, J.L.; Wang, J.Z.; Ge, X.Y.; Li, Z.S. Quantitative Assessment of Soil Organic Matter Content Using a Three-Dimensional Spectral Index: A Case Study in Ebinur Lake Basin, Xinjiang. Spectrosc. Spect. Anal. 2020, 40, 1514–1522. [Google Scholar] [CrossRef]
  47. Hong, Y.S.; Guo, L.; Chen, S.C.; Linderman, M.; Mouazen, A.M.; Yu, L.; Chen, Y.; Liu, Y.; Liu, Y.; Cheng, H.; et al. Evaluating the Capacity of Airborne Hyperspectral Imagery for Estimating Topsoil Organic Carbon: The Influence of Fractional-Order Derivative and Optimal Band Combination Algorithms. Geoderma 2020, 365, 114228. [Google Scholar] [CrossRef]
  48. Song, Y.X.; Ji, J.F.; Mao, C.P.; Ayoko, G.A.; Frost, R.L.; Yang, Z.; Yuan, X. Utilizing Visible-NIR Reflectance Spectroscopy to Predict Seasonal Variations of Trace Metals in Suspended Solids of the Yangtze River. Catena 2013, 109, 217–224. [Google Scholar] [CrossRef]
  49. Ge, X.Y.; Ding, J.L.; Jin, X.L.; Wang, J.Z.; Chen, X.Y.; Li, X.H.; Liu, J.; Xie, B. Estimating Soil Moisture Content in Agricultural Lands through UAV-Based Hyperspectral Imagery in Arid Regions. Remote Sens. 2021, 13, 1562. [Google Scholar] [CrossRef]
  50. Geng, J.; Lv, J.W.; Liao, C.H.; Tan, Q.Y.; Qang, T.X.; Fang, H.J.; Wang, L. Prediction of soil organic carbon in black soil based on a synergistic scheme from hyperspectral data: Combining fractional-order derivatives and three-dimensional spectral indices. Comput. Electron. Agric. 2024, 220, 108905. [Google Scholar] [CrossRef]
  51. Zhu, C.M.; Wang, H.W.; Xia, X.; Ma, L.G.; Tong, Y.J.; Quan, L.Z.R. Retrieval of Soil Organic Matter Content Based on Spectral Index and Machine Learning. Jiangsu Agric. Sci. 2020, 48, 233–241. (In Chinese) [Google Scholar] [CrossRef]
  52. Feng, Y.; Wang, J.L.; Tang, Y.L. Estimation and inversion of soil heavy metal arsenic (As) based on UAV hyperspectral platform. Microchem. J. 2024, 207, 112027. [Google Scholar] [CrossRef]
  53. Fu, P.J.; Yang, K.M.; Meng, F.; Zhang, W.; Cui, Y.; Feng, F.S.; Yao, G.B. A Novel Three-Band Spectral and Metal Element Index for Estimating Soil Arsenic Levels in Mining Areas. Process Saf. Environ. Prot. 2022, 157, 22–36. [Google Scholar] [CrossRef]
  54. Fu, C.B.; Xiong, H.G.; Tian, A.H. Investigating the Effect of Fractional Derivative on Hyperspectral Data for Soil Organic Matter Content in Arid Regions. J. Spectrosc. 2019, 2019, 7159317. [Google Scholar] [CrossRef]
  55. Hong, Y.S.; Chen, S.C.; Liu, Y.L.; Zhang, Y.; Yu, L.; Chen, Y.Y. Enhancement of Soil Organic Matter Estimation Accuracy via Combining Fractional Order Derivative Techniques and Memory-Based Learning Algorithms Using Visible and Near-Infrared Spectroscopy. Catena 2019, 174, 104–116. [Google Scholar] [CrossRef]
  56. Meng, C.; Hong, M.; Hu, Y.C.; Li, F. Assessment of Soil Copper Concentration in Mining Areas Using Optimized Spectral Indices and Machine Learning Algorithms. Sensors 2024, 16, 4153. [Google Scholar] [CrossRef]
  57. Demetriadesshah, T.H.; Steven, M.D.; Clark, J.A. High-Resolution Derivative Spectra in Remote Sensing Applications. Remote Sens. Environ. 1990, 33, 55–64. [Google Scholar] [CrossRef]
  58. Tsai, F.; Philpot, W. Analyzing Derivatives of Hyperspectral Data. Remote Sens. Environ. 1998, 66, 41–51. [Google Scholar] [CrossRef]
  59. Shi, T.Z.; Yang, C.; Liu, H.Z.; Wu, C.; Wang, Z.H.; Li, H.; Zhang, H.; Guo, L.; Wu, G.; Su, F. Mapping Lead Concentrations in Urban Topsoil Utilizing Proximal and Remote Sensing Techniques Coupled with Hybrid Statistical Approaches. Environ. Pollut. 2020, 272, 116041. [Google Scholar] [CrossRef]
  60. Hong, Y.S.; Shen, R.L.; Cheng, H.; Chen, Y.Y.; Zhang, Y.; Liu, Y.; Zhou, M.; Yu, L.; Liu, Y.; Liu, Y. Predicting Lead and Zinc Levels in Agricultural Soils in Peri-Urban Regions Using Reflectance Spectroscopy: The Role of Fractional-Order Derivative and Random Forest Techniques. Sci. Total Environ. 2019, 651, 1969–1982. [Google Scholar] [CrossRef] [PubMed]
  61. Hong, Y.S.; Liu, Y.L.; Chen, Y.Y.; Liu, Y.F.; Yu, L.; Liu, Y. Implementing Fractional-Order Derivative Methods for the Quantitative Estimation of Soil Organic Matter Content Using Visible and Near-Infrared Reflectance Spectroscopy. Geoderma 2019, 337, 758–769. [Google Scholar] [CrossRef]
  62. Bhadra, S.; Sagan, V.; Maimaitijiang, M.; Maimaitiyiming, M.; Newcomb, M.; Shakoor, N.; Mockler, T.C. Hyperspectral Data-Driven Estimation of Leaf Chlorophyll Concentration in Sorghum Using Derivative Calculus and Machine Learning Techniques. Remote Sens. 2020, 12, 2082. [Google Scholar] [CrossRef]
  63. Chen, L.H.; Lai, J.; Tan, K.; Wang, X.; Chen, Y.; Ding, J.W. A New Method for Estimating Soil Heavy Metals Based on Spectral Indices: Integrating Fractional-Order Derivative Pretreatment with Absorption Mechanism Understanding. Sci. Total Environ. 2022, 813, 151882. [Google Scholar] [CrossRef]
  64. Tang, R.N.; Li, X.W.; Li, C.; Jiang, K.X.; Hu, W.F.; Wu, J.J. Evaluating Total Nitrogen Content in Rubber Plantation Soil Utilizing Hyperspectral Data and Fractional Order Derivative Methods. Electronics 2022, 11, 1956. [Google Scholar] [CrossRef]
  65. Xiao, D.; Huang, J.; Li, J.; Fu, Y.H.; Li, Z.N. Inversion Analysis of Cadmium Content in Soil Using Reflection Spectroscopy Coupled with MSC-ELM Model. Spectrochim. Acta A 2022, 283, 121696. [Google Scholar] [CrossRef]
  66. Fu, C.B.; Gan, S.; Xiong, H.G.; Tian, A.H. An Innovative Method for Estimating Soil Organic Matter via a Combination Model Incorporating Short Memory Fractional Order Derivative and Machine Learning Techniques. Infrared Phys. Technol. 2023, 134, 104922. [Google Scholar] [CrossRef]
  67. Liu, Y.; Lu, Y.Y.; Chen, D.Y.; Zheng, W.; Ma, Y.X.; Pan, X.Z. Simultaneously Estimating Diverse Soil Properties Under Moist Conditions Using Fractional-Order Derivative of Vis-NIR Spectra Coupled with Deep Learning Approaches. Geoderma 2023, 438, 116653. [Google Scholar] [CrossRef]
  68. Song, G.M.; Wang, Q.; Jin, J. Enhancing Partial Least Squares Regression Estimation of Photosynthetic Capacity Using Fractional-Order Derivative Spectral Transformations from Hyperspectral Data. IEEE Trans. Geosci. Remote 2023, 61, 5510110. [Google Scholar] [CrossRef]
  69. Galvão, R.K.H.; Araújo, M.C.U.; Fragoso, W.D.; Silva, E.C.; José, G.E.; Soares, S.F.C. A Variable Elimination Approach to Enhance the Parsimony of MLR Models via the Successive Projections Algorithm. Chemom. Intell. Lab. 2008, 92, 83–91. [Google Scholar] [CrossRef]
  70. Vohland, M.; Ludwig, M.; Thiele-Bruhn, S.; Ludwig, B. Assessing Soil Properties through Visible to Near- and Mid-Infrared Spectroscopy: The Impact of Spectral Variable Selection Methods. Geoderma 2014, 223, 88–96. [Google Scholar] [CrossRef]
  71. Zhang, X.L.; Xue, J.; Xiao, Y.; Shi, Z.; Chen, S.C. Optimizing Variable Selection Methods for Predicting Soil Properties through a Regional Soil Vis-NIR Spectral Library. Remote Sens. 2023, 15, 465. [Google Scholar] [CrossRef]
  72. Wang, X.P.; Zhang, F.; Kung, H.T.; Johnson, V.C. Innovative Approaches for Enhancing Remote Sensing Estimates of Soil Organic Matter Content in the Ebinur Lake Wetland National Nature Reserve, Northwest China. Remote Sens. Environ. 2018, 218, 104–118. [Google Scholar] [CrossRef]
  73. Kahaer, Y.; Sawut, R.; Kasim, N.; Tashpolati, N.; Zhang, F.; Abliz, A. Estimation of Heavy Metal Levels in Soil Near Open Pit Coal Mines Utilizing Optimized Spectral Indices. Spectrosc. Spect. Anal. 2019, 39, 2486–2494. [Google Scholar] [CrossRef]
  74. Xia, K.; Xia, S.S.; Shen, Q.; Zhang, S.W.; Li, C.; Cheng, Q.; Zhou, J. Optimizing a Soil Particle Content Prediction Model Based on Combined Spectral Indices and the Successive Projections Algorithm Using Vis-NIR Spectroscopy. Spectroscopy 2021, 35, 24–34. [Google Scholar]
  75. Fu, P.J.; Zhang, J.W.; Yuan, Z.X.; Feng, J.F.; Zhang, Y.X.; Meng, F. Estimating Heavy Metal Levels in Entisols from a Mining Area Using Enhanced Spectral Indices and CatBoost. Sensors 2024, 24, 1492. [Google Scholar] [CrossRef] [PubMed]
Figure 1. Location of the study area; (a): Xinjiang, China(GS (2024) 0650); (b): geological map of the study area.
Fractalfract 09 00523 g001
Figure 2. Spatial distribution of sampling points. The base image is a GF5 image.
Fractalfract 09 00523 g002
Figure 3. Reflectance spectrum of soil samples.
Fractalfract 09 00523 g003
Figure 4. Descriptive statistics of the copper content in soil derived from the (a) training set and (b) testing set.
Fractalfract 09 00523 g004
Figure 5. The fractional derivative spectra of soil in the training sample set within the range of 0.05 to 1.95 orders. Among them, the black solid line represents the average spectral values of different bands, and the pink shaded area represents the standard deviation of spectral values of different samples.
Fractalfract 09 00523 g005aFractalfract 09 00523 g005b
Figure 6. The distribution of the determination coefficient (R2) between the three-band spectral index TBS1 and the copper content based on the 0.05–1.95 fractional derivative. The X-axis, Y-axis, and Z-axis represent the slice positions of Band 1, Band 2, and Band 3, respectively. The intersection point of the three axes indicates the optimal band combination corresponding to TBS1, which is also the location with the highest R2.
Fractalfract 09 00523 g006
Figure 7. Comparison of maximum correlation coefficients (R2) between soil copper content and spectral indices constructed using various fractional-order derivatives.
Fractalfract 09 00523 g007
Figure 8. Scatter plot of predicted versus measured copper content, with the fitted regression line (black) and the 1:1 reference line (red).
Fractalfract 09 00523 g008
Table 1. Equations for the three-band spectral indices.
Three-Band Spectral IndexCalculation Formula
TBSI1 R λ 1 / ( R λ 2 × R λ 3 )
TBSI2 R λ 1 / ( R λ 2 + R λ 3 )
TBSI3 R λ 1 2 × R λ 2 + R λ 3
TBSI4 R λ 1 × R λ 2 × R λ 3
TBSI5 ( R λ 1 R λ 2 + R λ 3 ) / ( R λ 1 + R λ 2 R λ 3 )
where R λ 1 , R λ 2 , and R λ 3 represent the spectral values in wavelengths λ 1 , λ 2 , and λ 3 , respectively.
Table 2. The three-band spectral index with the highest correlation with the copper content of the soil using five calculation types.
Spectral Index Calculation MethodSpectral Band Position (nm)Derivative OrderDetermination Coefficient R2p Value
TBSI1768.904, 426.696, 974.2450.350.55<0.001
TBSI2768.904, 632.170, 922.9100.550.52<0.001
TBSI3426.696, 512.275, 974.2450.350.54<0.001
TBSI3443.812, 786.016, 460.9271.150.54<0.001
TBSI4443.812,786.016, 460.9271.150.46<0.001
TBSI5632.170, 922.910, 768.9040.450.53<0.001
Table 3. Performance of models with different three-band spectral indices.
Three-Band Spectral IndexTraining SetTesting Set
R2Fitting Relationship FormulaR2RMSE
(mg·kg−1)
RPD
TBSI1 (768.904, 426.696, 974.245, 0.35 order)0.55Y = 39.188X − 270.690.4632.961.36
TBSI2 (768.904, 632.170, 922.910, 0.55 order)0.52Y = 200.12X − 136.380.2837.421.19
TBSI3 (426.696, 512.275, 974.245, 0.35 order)0.54Y = 289.7 − 4746.7X0.5130.901.46
TBSI3 (443.812, 786.016, 460.927, 1.15 order)0.54Y = 8229.3X + 355.170.4632.411.39
TBSI4 (443.812,786.016, 460.927, 1.15 order))0.46Y = 138.53 − 10,000,000X0.4236.421.23
TBSI5 (632.170, 922.910, 768.904, 0.45 order)0.53Y = 21.276X − 63.2780.2538.211.17
Table 4. Performance of models with five newly constructed spectral indices.
Newly Constructed Spectral IndexTraining SetTesting Set
R2R2RMSE (mg·kg−1)RPD
TBSI1 [TBSI5 (632.170, 922.910, 768.904, 0.45 order), TBSI2 (768.904, 632.170, 922.910, 0.55 order), TBSI3 (426.696, 512.275, 974.245, 0.35 order)]0.650.5629.401.52
TBSI2 [TBSI2 (768.904, 632.170, 922.910, 0.55 order), TBSI4 (443.812,786.016, 460.927, 1.15 order)), TBSI3 (426.696, 512.275, 974.245, 0.35 order)]0.630.5330.51.46
TBSI3 [TBSI1 (768.904, 426.696, 974.245, 0.35 order), TBSI2 (768.904, 632.170, 922.910, 0.55 order), TBSI5 (632.170, 922.910, 768.904, 0.45 order)]0.590.3834.861.28
TBSI4 [TBSI1 (768.904, 426.696, 974.245, 0.35 order), TBSI2 (768.904, 632.170, 922.910, 0.55 order), TBSI5 (632.170, 922.910, 768.904, 0.45 order)]0.550.2937.081.20
TBSI5 [TBSI2 (768.904, 632.170, 922.910, 0.55 order),TBSI3 (426.696, 512.275, 974.245, 0.35 order), TBSI3 (443.812, 786.016, 460.927, 1.15 order)]0.600.4931.631.41
Table 5. Comparison of three-band index and two-band index for estimating the copper content.
Spectral Index FormR2 Maximum Value
Two-band: ratio spectral index0.44
Two-band: difference spectral index0.47
Two-band: normalized spectral index0.45
Three-band: TBSI10.55
Three-band: TBSI20.52
Three-band: TBSI30.54
Three-band: TBSI40.46
Three-band: TBSI50.53
Disclaimer/Publisher’s Note: The statements, opinions and data contained in all publications are solely those of the individual author(s) and contributor(s) and not of MDPI and/or the editor(s). MDPI and/or the editor(s) disclaim responsibility for any injury to people or property resulting from any ideas, methods, instructions or products referred to in the content.