Article

Effects of Organic Matter Volume Fraction and Fractal Dimension on Tensile Crack Evolution in Shale Using Digital Core Numerical Models

1
State Key Laboratory of Coastal and Offshore Engineering, Dalian University of Technology, Dalian 116024, China
2
Information Research Institute of the Department of Emergency Management, Beijing 100029, China
3
PetroChina Research Institute of Petroleum Exploration & Development, Beijing 100083, China
4
Sanying Precision Instruments Co., Ltd., Tianjin 300399, China
5
School of Civil Engineering, Tianjin University, Tianjin 300354, China
*
Author to whom correspondence should be addressed.
Fractal Fract. 2025, 9(8), 518; https://doi.org/10.3390/fractalfract9080518
Submission received: 20 June 2025 / Revised: 29 July 2025 / Accepted: 4 August 2025 / Published: 8 August 2025
(This article belongs to the Special Issue Applications of Fractal Dimensions in Rock Mechanics and Geomechanics)

Abstract

Organic matter plays a vital role in shale reservoirs as both a hydrocarbon storage medium and migration pathway. However, the quantitative relationship between the microstructural features of organic matter and the macroscopic mechanical and failure behaviors of shale remains unclear due to rock heterogeneity and opacity. In this study, high-resolution three-dimensional digital core models of shale were reconstructed using Focused Ion Beam Scanning Electron Microscopy (FIB-SEM) imaging. The digital models captured the spatial distribution of silicate minerals, clay minerals, and organic matter. Numerical simulations of uniaxial tensile failure were performed on these models, considering variations in the organic matter volume fraction and fractal dimension. The results indicate that an increased organic matter volume fraction and fractal dimension are associated with lower tensile strength, simpler fracture geometry, and reduced acoustic emission activity. Tensile cracks preferentially initiate at interfaces between minerals with contrasting elastic moduli, especially between organic matter and clay, and then propagate and coalesce under loading. These findings reveal that both the volume fraction and fractal structure of organic matter are reliable predictors of tensile strength and damage evolution in shale. This study provides new microscale insights into shale failure mechanisms and offers guidance for optimizing hydraulic fracturing in organic-rich formations.

1. Introduction

Unconventional reservoir shales are fine-grained sedimentary rocks composed of rigid silicate and carbonate minerals, ductile clay minerals, and organic matter [1]. Each mineral exhibits distinctive mechanical properties (e.g., strength, elastic modulus, Poisson’s ratio) and geometric features (e.g., particle size, shape, and spatial distribution), resulting in pronounced heterogeneity and anisotropy [2]. Notably, organic matter—characterized by low mechanical strength—tends to occupy microfractures between mineral grains, exerting a significant influence on the mechanical behavior and fracture propagation of shale specimens [3]. Therefore, understanding the impact of organic matter on shale’s mechanical performance and crack evolution is of critical importance for unconventional reservoir exploration, production, and carbon dioxide sequestration.
However, due to the opacity and inherent randomness of rocks, establishing quantitative relationships between their microstructural features and macroscopic mechanical and failure behaviors remains challenging through experimental approaches. In recent years, numerical methods such as finite element and discrete element approaches have been widely used as general tools to study the microscale mechanical behavior and fracture evolution of various materials, including rocks and metals [4,5,6,7], thus providing an important means for analyzing the mechanical properties of heterogeneous rocks. Simulation results have consistently demonstrated that heterogeneity significantly affects both the mechanical properties and failure behavior of rocks. Rock heterogeneity can generally be categorized into material property heterogeneity and microscale geometric heterogeneity of mineral grains [8]. In numerical simulations, material heterogeneity is typically implemented by assigning different mechanical properties to grid elements corresponding to various mineral constituents. For example, in Tang’s studies [9,10,11,12,13], the mechanical properties were assumed to follow a Weibull distribution, which was incorporated into finite element models to analyze the influence of heterogeneity on the progressive failure of rocks under compression. Moreover, Shimizu et al. [14] adopted a discrete element model, in which each discrete particle represented a mineral grain. Mechanical parameters were assigned based on particle size distribution, effectively capturing the heterogeneity of the rock model.
A widely adopted approach for incorporating geometric heterogeneity in numerical simulations involves generating synthetic specimens with varying microstructures by employing different computational grid elements, enabling evaluation of its influence on mechanical responses [8]. For instance, Pan et al. [15] introduced a statistically based discrete element model in UDEC to simulate rocks with varying grain size distributions and investigated how microstructural heterogeneity affects macroscopic mechanical behavior. Liu et al. [16] employed a particle-based modeling framework and proposed a heterogeneity index to quantify microscale geometric heterogeneity, analyzing its impact on the mechanical response of rocks. Gao et al. [17] incorporated crushable particles into the UDEC-GBM model to fully capture geometric and mechanical heterogeneity at the grain scale, thereby simulating microscale mechanical behavior and fracture propagation in brittle rocks. Notably, most of these numerical studies primarily focus on mineral grain size variation and random spatial distribution, while often neglecting the actual morphological features and statistical distribution characteristics of real mineral structures, thus limiting their physical realism and representativeness.
Furthermore, the determination of input parameters in indirect approaches for characterizing rock heterogeneity often exhibits significant uncertainty, being highly dependent on assumed statistical distributions [18]. The assumption that rock heterogeneity follows predefined statistical laws not only neglects the influence of actual mineralogical distributions [19] but also fails to capture the true microstructural features and constitutive behavior of real rocks. Such uncertainties reduce the reliability of numerical simulations and hinder the establishment of robust quantitative relationships between microstructure and macroscopic mechanical or failure behavior.
To accurately simulate the mechanical behavior and fracture propagation in rocks, especially in highly heterogeneous shale reservoirs, it is essential to select appropriate numerical models and to incorporate both the actual microstructure and material heterogeneity. In recent years, advancements in scanning technologies have enabled digital rock physics to become an effective tool for investigating the influence of three-dimensional rock structures on fracture behavior. Several studies have employed computed tomography (CT) to construct digital rock models for analyzing the effects of microstructural features on rock mechanics and fracture evolution. For example, Wang et al. [20] reconstructed numerical models of coal samples based on CT imaging to study the relationship between pore structure and permeability, and found that the fractal dimension effectively characterizes coal permeability, while porosity shows a weaker correlation. Chen et al. [21,22] developed CT-based models that reflect the true microstructure of sandstone and revealed the failure mechanisms of porous sandstone from a microscale perspective. Zhao et al. [23] used X-ray CT scanning to construct 3D models and simulated the mechanical behavior and crack propagation of sandstone. Although these CT-based modeling approaches consider geometric heterogeneity, few studies have simultaneously incorporated both structural and mineralogical heterogeneity, limiting the realism and predictive capability of the simulations.
Notably, due to the highly compacted nature of unconventional tight shale reservoirs and the limited resolution of CT imaging, it remains difficult to accurately identify and extract their microstructural characteristics [24]. This limitation hinders detailed investigation into the microscale mechanisms that govern fracture propagation [25,26].
With the advancement of Focused Ion Beam Scanning Electron Microscopy (FIB-SEM), a powerful tool has emerged for the high-resolution three-dimensional characterization of tight reservoir shales [27,28,29,30,31]. Compared to other imaging techniques, FIB-SEM offers superior resolution—down to 0.7 nanometers—enabling precise identification of the microstructural features of reservoir shale. Numerous studies have employed FIB-SEM to distinguish between mineral grains, pores, and microfractures in unconventional shale reservoirs, thereby shedding light on their sedimentary processes and formation mechanisms from a microscale perspective [30,31,32,33,34,35]. However, the integration of FIB-SEM imaging into digital core-based numerical modeling for simulating rock mechanical behavior remains limited in current research.
The FIB-SEM technique provides a technical foundation for constructing microscale digital core numerical models of shale and serves as an essential tool for micromechanical simulations. In this study, shale samples with varying organic matter volume fractions were selected as research objects. Digital core numerical models that accurately reflect the true microscale structural characteristics of the rock were constructed using FIB-SEM imaging. Uniaxial tensile numerical simulations were then conducted to analyze the effects of organic matter volume fraction and distribution on the mechanical properties and fracture development characteristics of the rock, and to elucidate the microscale failure mechanisms of the shale specimens.

2. Methods and Models

2.1. Elastic–Brittle Damage Constitutive Model Considering Heterogeneity of Mineral Materials

Nanoindentation tests on shale have shown that the mechanical parameters of mineral phases of the same type at the microscale follow a Weibull probability density function [36]. Consequently, in numerical models, it is assumed that the mechanical parameters of mineral elements within the numerical model conform to the probability density function of a Weibull distribution [37]:
f ( x ) = m x 0 ( x x 0 ) m 1 exp ( x x 0 ) m
where f ( x ) represents the statistical probability density function of a given mechanical property, and x represents the mechanical property parameters (such as elastic modulus and strength) of the element. x0 denotes the mean value of the mechanical properties of the elements. m is the shape parameter of the probability density function. Physically, the parameter m reflects the degree of homogeneity in the mechanical properties of the rock medium. A larger m value indicates greater material homogeneity.

2.1.1. Damage Evolution

In the numerical model, the elements are regarded as isotropic elastic–brittle materials with residual strength, wherein mechanical parameters decrease with the increase in damage variables [38]. Based on the strain equivalence hypothesis proposed by J. Lemaitre [39], the elastic modulus of an element is expressed as follows:
E d = ( 1 d ) E 0
The damage variable of an element failing in tensile mode can be expressed as [40]
d = 0 ε ¯ > ε t 0 1 σ r t ε E 0 ε t u < ε ¯ ε t 0 1 ε ¯ ε t u
ε t u = ξ ε t 0
Here, ε ¯ is the equivalent principal strain, which is defined as follows [41]:
ε ¯ = ε 1 2 + ε 2 2 + ε 3 2
Here ε 1 , ε 2 , and ε 3 are the three main strains. 〈 〉 is defined as follows:
x = x x 0   0 x < 0
The damage variable of the element failing in compression/shear mode can be expressed as [40]
d = 0 ε 1 > ε c 0 1 σ r c ε 1 E 0 ε c 0 ε 1
where σrc and σrt represent the residual compressive strength and residual tensile strength, respectively. εc0 and εt0 correspond to the compressive strain and the tensile strain at the elastic limit, respectively. ε1 represents the maximum principal strain, while εtu denotes the ultimate tensile strain, and ξ stands for the ultimate strain coefficient. Depending on the values of the damage variable, there are three distinct damage states: elastic damage (d = 0), partial damage (0 < d < 1), and complete failure damage (d = 1).

2.1.2. Failure Criterion

The evaluation of element damage is performed using the Mohr–Coulomb criterion and the maximum tensile stress criterion [11,12]. It is assumed that elastic–brittle elements with residual strength experience only one failure mode. During the loading process, when the minimum principal strain exceeds the uniaxial tensile strain threshold, or when the minimum principal stress surpasses the uniaxial tensile strength threshold, the element is deemed to have failed in tensile mode. Shear failure is considered to occur when the shear stress satisfies the Mohr–Coulomb failure criterion [42]. The criteria are as follows:
ε 3 σ t 0 E σ 3 σ t 0 σ 1 σ 3 1 + sin ϕ 1 sin ϕ σ c 0
where ϕ is the internal friction angle; ε 3 is the minimum principal strain; σ 1 and σ 3 are the maximum and minimum principal stresses, respectively; and σ c 0 and σ t 0 represent the uniaxial compressive strength and uniaxial tensile strength (Pa), respectively.
When the state of an element meets any of the aforementioned criteria, the element begins to undergo damage, and this damage accumulates continuously.

2.2. Construction of Digital Core Numerical Model

2.2.1. Scanning

The imaging principle of FIB-SEM technology primarily involves milling the sample surface using a focused ion beam (FIB), followed by layer-by-layer scanning of the exposed cross-sectional areas with a scanning electron beam (SEM) to obtain a series of continuous two-dimensional slice images. By reconstructing these slices, high-resolution three-dimensional images can be generated, allowing accurate depiction of the microscale structure of tight reservoir shale. This technique is of paramount importance for detailed investigations into the spatial structural characteristics of tight reservoirs. It is worth noting that the incident angle between the FIB and SEM beams typically ranges from 52° to 54°, as illustrated in Figure 1. Currently, the imaging resolution of modern FIB systems can reach as fine as 3 nm, enabling highly accurate representation of surface morphological features.

2.2.2. Median Filtering

The acquired FIB-SEM images are affected by various factors, including the scanning environment and the performance of the FIB-SEM system, often resulting in non-uniform grayscale distributions. To address this issue, the rectangular partitioning method proposed by Liu et al. [43] was employed. In addition to grayscale non-uniformity, random salt-and-pepper noise is frequently present in the images. To eliminate this type of noise, median filtering was applied. The fundamental principle of median filtering is to replace the value of each pixel with the median of the intensities within its local neighborhood window. This approach brings surrounding pixel values closer to their true intensities, thereby effectively removing isolated noise points.
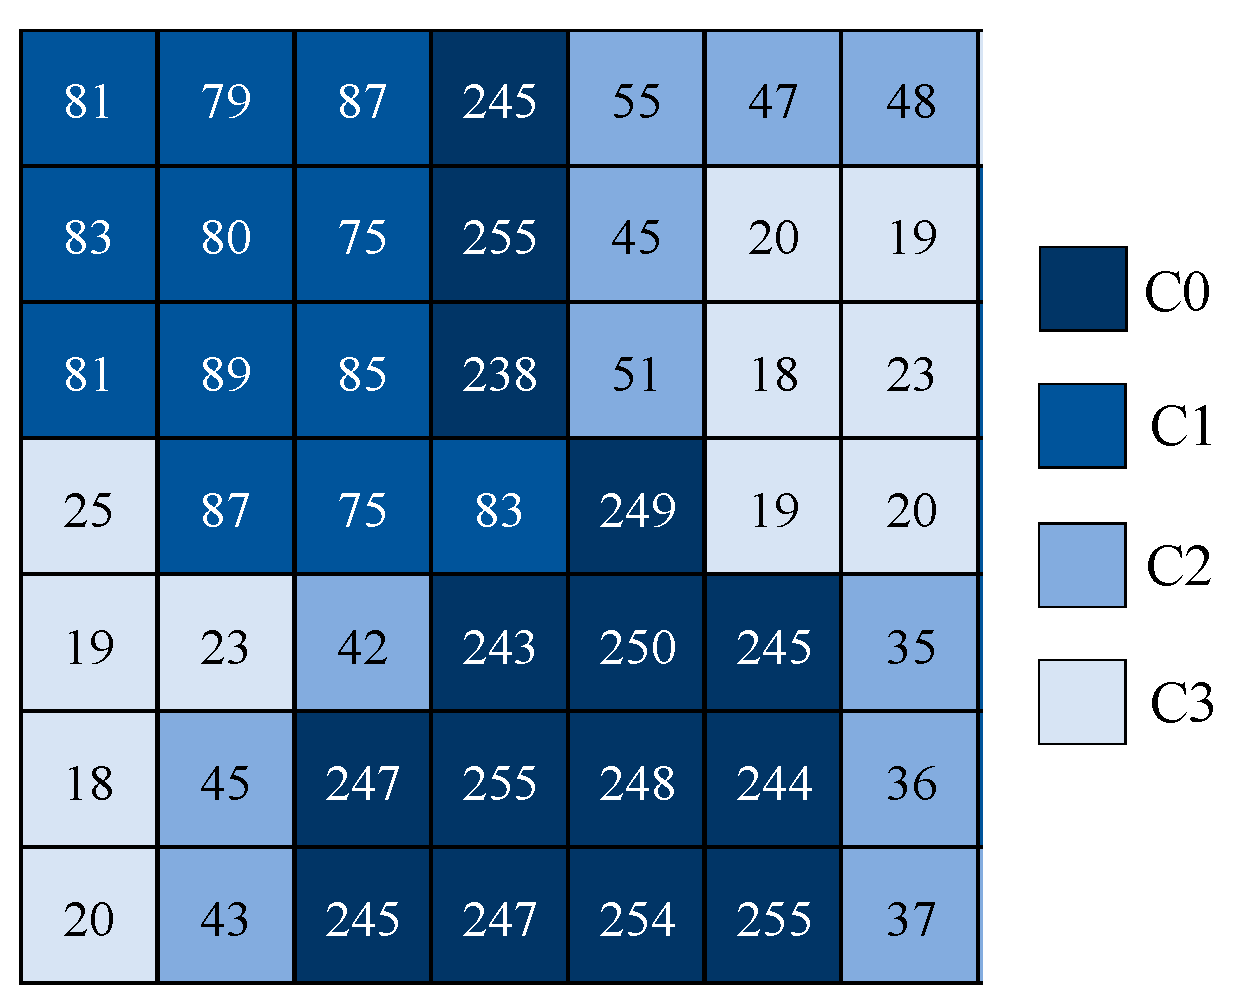
The effectiveness of median filtering is significantly affected by the size of the filtering window, which presents a trade-off between noise suppression and the preservation of image details. Smaller windows better retain fine structural features but are less effective at removing noise. In contrast, larger windows provide stronger noise reduction at the expense of introducing image blurring. Typically, the window size is defined as (2N + 1) × (2N + 1), where N is a positive integer. For example, as shown in Figure 2, selecting N = 2 yields a 5 × 5 pixel window containing 25 elements. These values are sorted, and the median is selected to replace the central pixel. In the case of RGB color images, this filtering process is applied independently to each of the red, green, and blue channels.

2.2.3. Threshold Segmentation

The threshold segmentation method is a region-based image segmentation technique that categorizes image pixels into distinct classes. In the context of rock materials, it is employed to distinguish between different mineral constituents within rock images. To facilitate automated processing and segmentation of a large number of images, this study adopts the multi-threshold Otsu method [44], which is derived from the classical Otsu algorithm [45]. Assuming the image has L grayscale levels ranging from 0 to L − 1, and given a set of n − 1 threshold values T 1 , T 2 , T n 1 , the image can be partitioned into n distinct categories (as shown in Figure 3), denoted as C 0 = 0 , 1 , , T 1 , , C i = T i + 1 , T i + 2 , , T i + 1 , , C n 1 = T n 1 + 1 , T n 1 + 2 , , L 1 . In this paper, n = 4 was set, meaning that the mineral components are segmented into four classes: C0, C1, C2, and C3. The probability and mean grayscale value of each class are represented by P 0 , P 1 , P n 1 , and μ 0 , μ 1 , μ n 1 , respectively. The multi-threshold Otsu segmentation formula is expressed as follows:
T 1 * , T 2 * , , T n 1 * = arg max 1 T 1 < T n 1 < L i = 0 n 1 P i ( μ i μ ) 2
Digital image processing techniques are employed to accurately extract microscale structural information from rock samples. Each pixel in a digital image corresponds uniquely to a specific material phase, allowing the mechanical properties of the corresponding material to be determined accordingly. Grayscale image data are represented numerically in the form of a matrix P ( m , n ) , as shown in Equation (10). Each array element p ( i , j ) indicates the grayscale value of a pixel, where i and j, respectively, denote the row and column positions of the pixel within the image, totaling n rows and m columns of pixels. The data type is uint8 (an 8-bit unsigned integer), with grayscale values ranging from 0 to 255.
P ( m , n ) = p ( 1 , 1 ) p ( 1 , 2 ) p ( 1 , j ) p ( 1 , m ) p ( 2 , 1 ) p ( 2 , 2 ) p ( 2 , j ) p ( 2 , m ) p ( i , 1 ) p ( i , 2 ) p ( i , j ) p ( i , m ) p ( n , 1 ) p ( n , 2 ) p ( n , j ) p ( n , m )

2.2.4. Reconstruction Principle of Digital Core Model

Digital images are composed of a grid of pixels, each corresponding to a square element. Then, based on the color or grayscale characteristics of each pixel, appropriate mechanical properties are assigned to the corresponding elements. To balance simulation accuracy and computational efficiency, the pixel resolution and the number of image layers should be proportionally adjusted prior to modeling, based on the performance of the computational hardware.
The heterogeneity characteristics of the digital rock core model, as shown in Figure 4, incorporate both geometric heterogeneity and material property heterogeneity. (1) Geometric heterogeneity (explicit representation): This is manifested through digital imagery. Segmentation thresholds are determined based on the pixel color or grayscale information, grouping pixels with similar grayscale values into the same material category. The resulting discretized finite elements are classified according to different material types, enabling the construction of a numerical model that accurately represents the actual microstructural geometry of the shale. (2) Mineral material heterogeneity (implicit representation): Nanoindentation tests have revealed that even within the same mineral phase, mechanical properties at the microscale are heterogeneous and follow a Weibull distribution [34]. Accordingly, the material heterogeneity in the numerical model is also implemented using the Weibull distribution. Mechanical parameters derived from nanoindentation experiments are assigned to each material group, with each group of elements representing a specific mineral phase and endowed with the corresponding mechanical properties.

2.2.5. Digital Core Numerical Model

To obtain the microscale structure of the target reservoir layer, the following procedure was adopted. First, regions of interest (ROIs) within the target area were identified using scanning electron microscopy (SEM). Then, focused ion beam (FIB) technology was employed to conduct three-dimensional imaging and sectioning of the selected regions. The resulting 3D microscale shale samples, as shown in Figure 5, have dimensions of 7 μm × 7 μm × 14 μm. Based on the FIB-SEM image analysis, samples WM1 to WM4 consist of three distinct mineral phases: silicate minerals (light gray areas), clay minerals (gray areas), and organic matter (black areas).
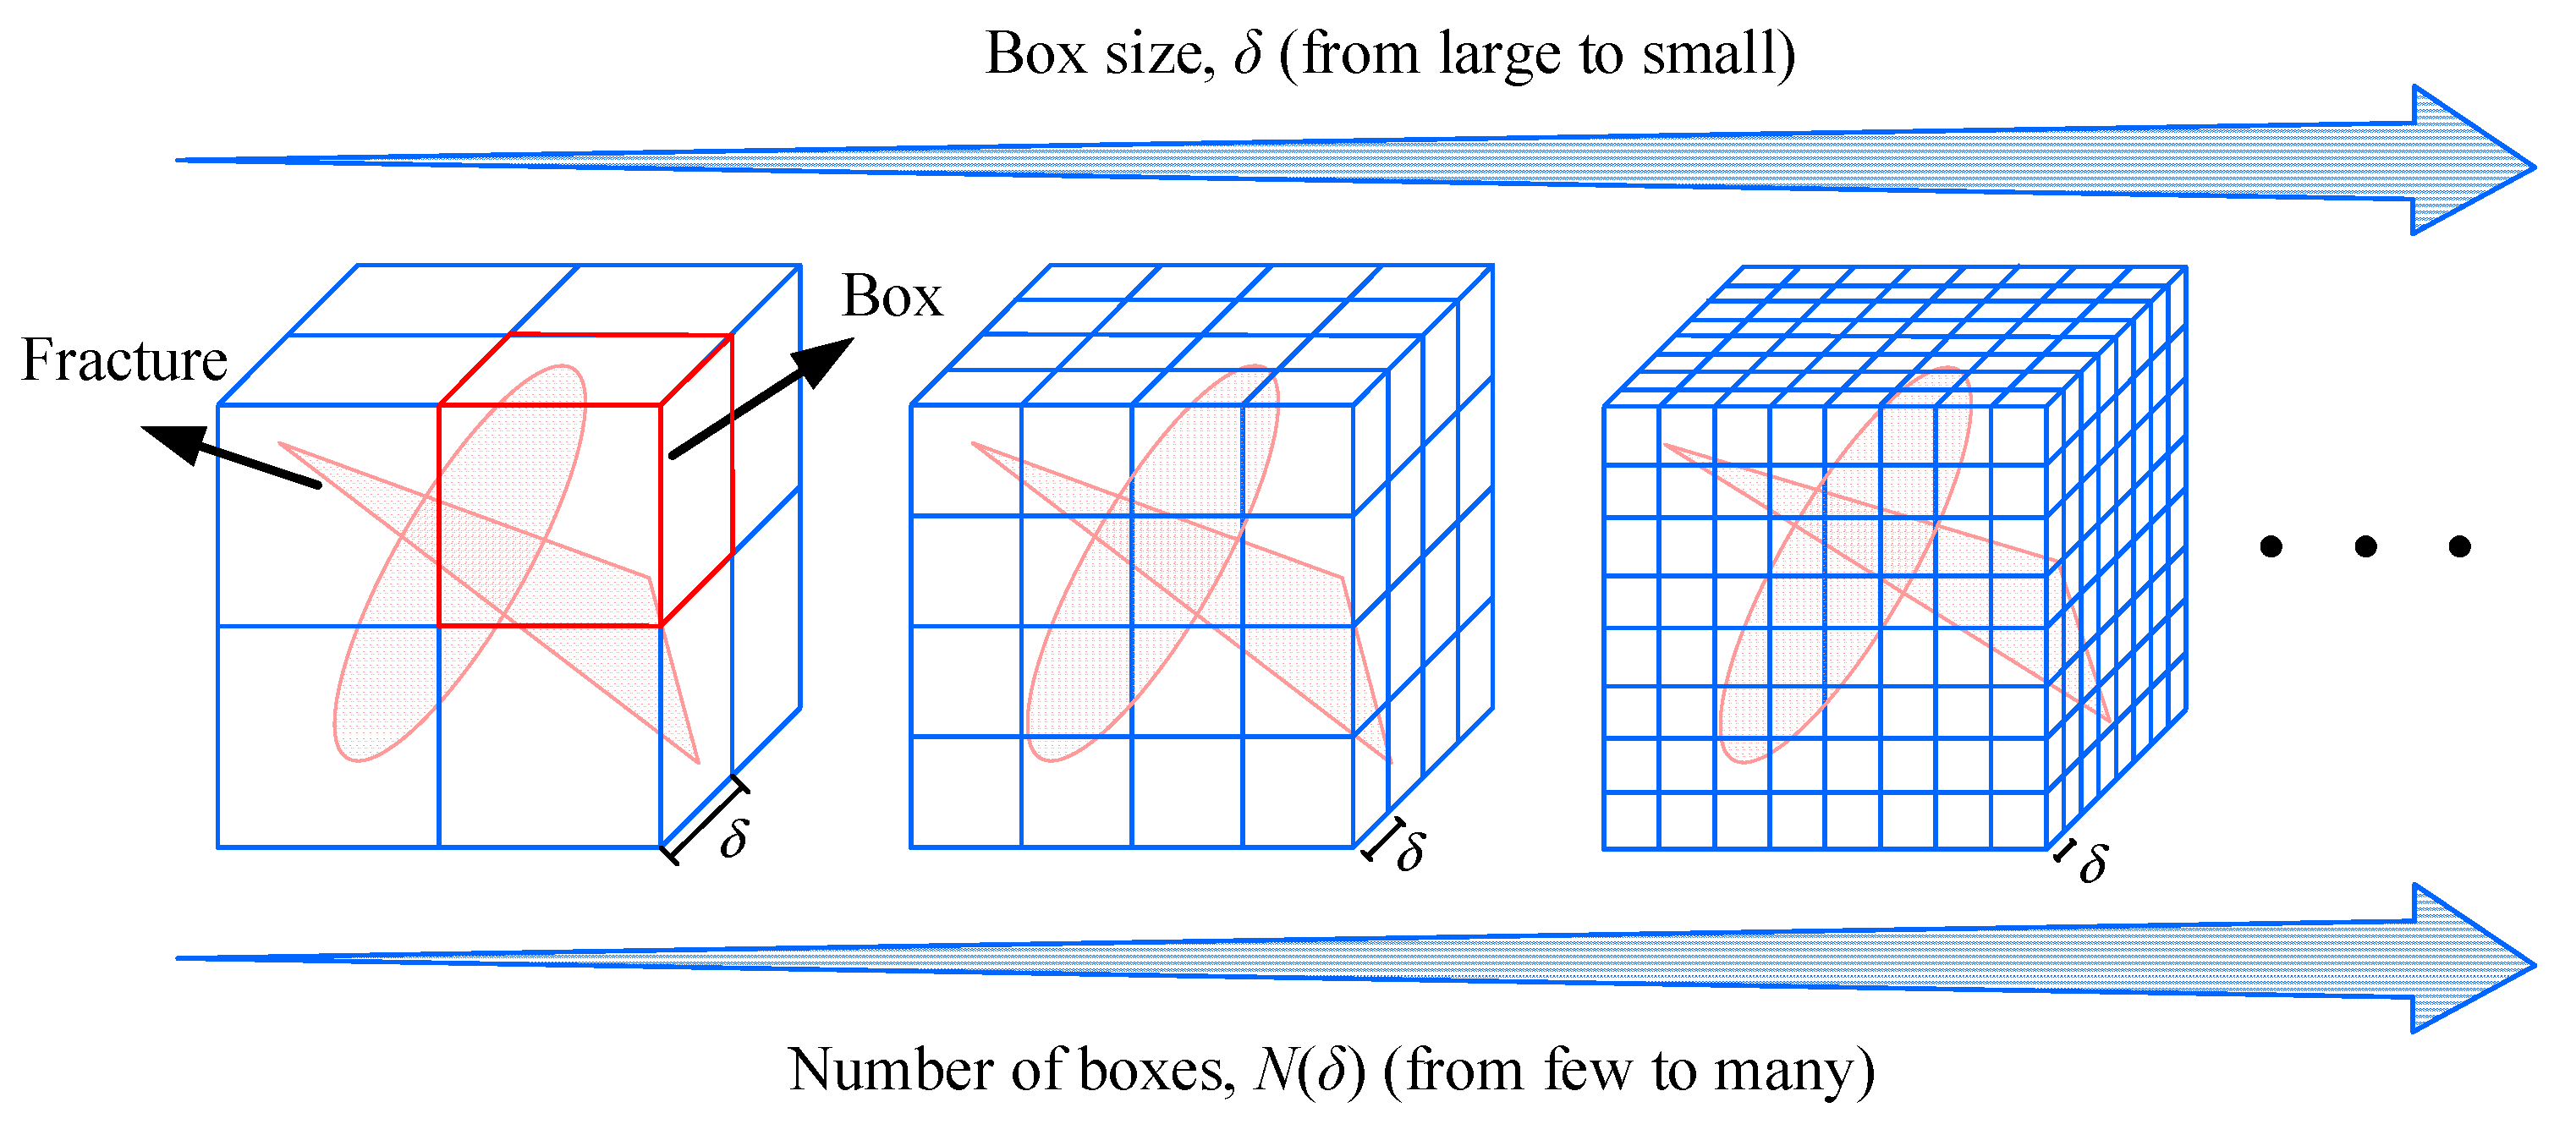
To further quantify the spatial complexity and distribution of fracture networks and mineral grains in the digital core model, this study applied the three-dimensional box-counting method to calculate their fractal dimensions. As shown in Figure 6, the target structure was sequentially covered with cubic boxes of different side lengths δ. The box size was gradually reduced in each step. For each box size, the number of boxes N(δ) containing any part of the fracture or target phase was counted. All values of N(δ) were recorded as the box size decreased. The logarithm of N(δ) was plotted against the logarithm of the reciprocal of δ. The slope of the linear section of this plot was determined by regression. The fractal dimension D was calculated as follows [46,47]:
D = lim δ 0 log N ( δ ) log δ
Table 1 provides a detailed summary of the volume fractions and fractal dimensions of the mineral components in each sample. In this table, V denotes the volume fraction of mineral particles, and D represents their fractal dimension. Specifically, OM refers to organic matter, Si denotes silicate mineral particles, and Cl represents the clay matrix. Across this sample set, the volume fraction of silicate minerals ranges from 0.83% to 12.24%, with corresponding fractal dimensions between 1.83 and 2.27. The clay matrix exhibits volume fractions ranging from 42.87% to 94.05% and fractal dimensions between 1.92 and 2.59. The volume fraction of organic matter varies from 5.22% to 44.80%, with fractal dimensions ranging from 2.22 to 2.56, showing a gradual increase from WM1 to WM4. It is noteworthy that, except for sample WM2, the fractal dimension of organic matter shows a general positive correlation with its volume fraction. Conversely, for the predominant mineral component, the clay matrix, its fractal dimension was also generally positively correlated with its volume fraction.
The FIB-SEM images were processed using the aforementioned digital image processing techniques. To strike a balance between model accuracy and computational efficiency, 175 FIB-SEM images were selected for numerical model construction. The original FIB-SEM images had a resolution of 20 nm × 20 nm, with an inter-slice spacing of 40 nm. The resolution of the original images was reduced by a factor of 2.5, resulting in downscaled dimensions of 140 × 280 pixels. Each finite element was assigned dimensions of 40 nm × 50 nm × 50 nm, yielding approximately 6.86 million elements in the shale domain. High-strength steel plates were added at both ends of the model, bringing the total element count to approximately 7.35 million (including the plates).
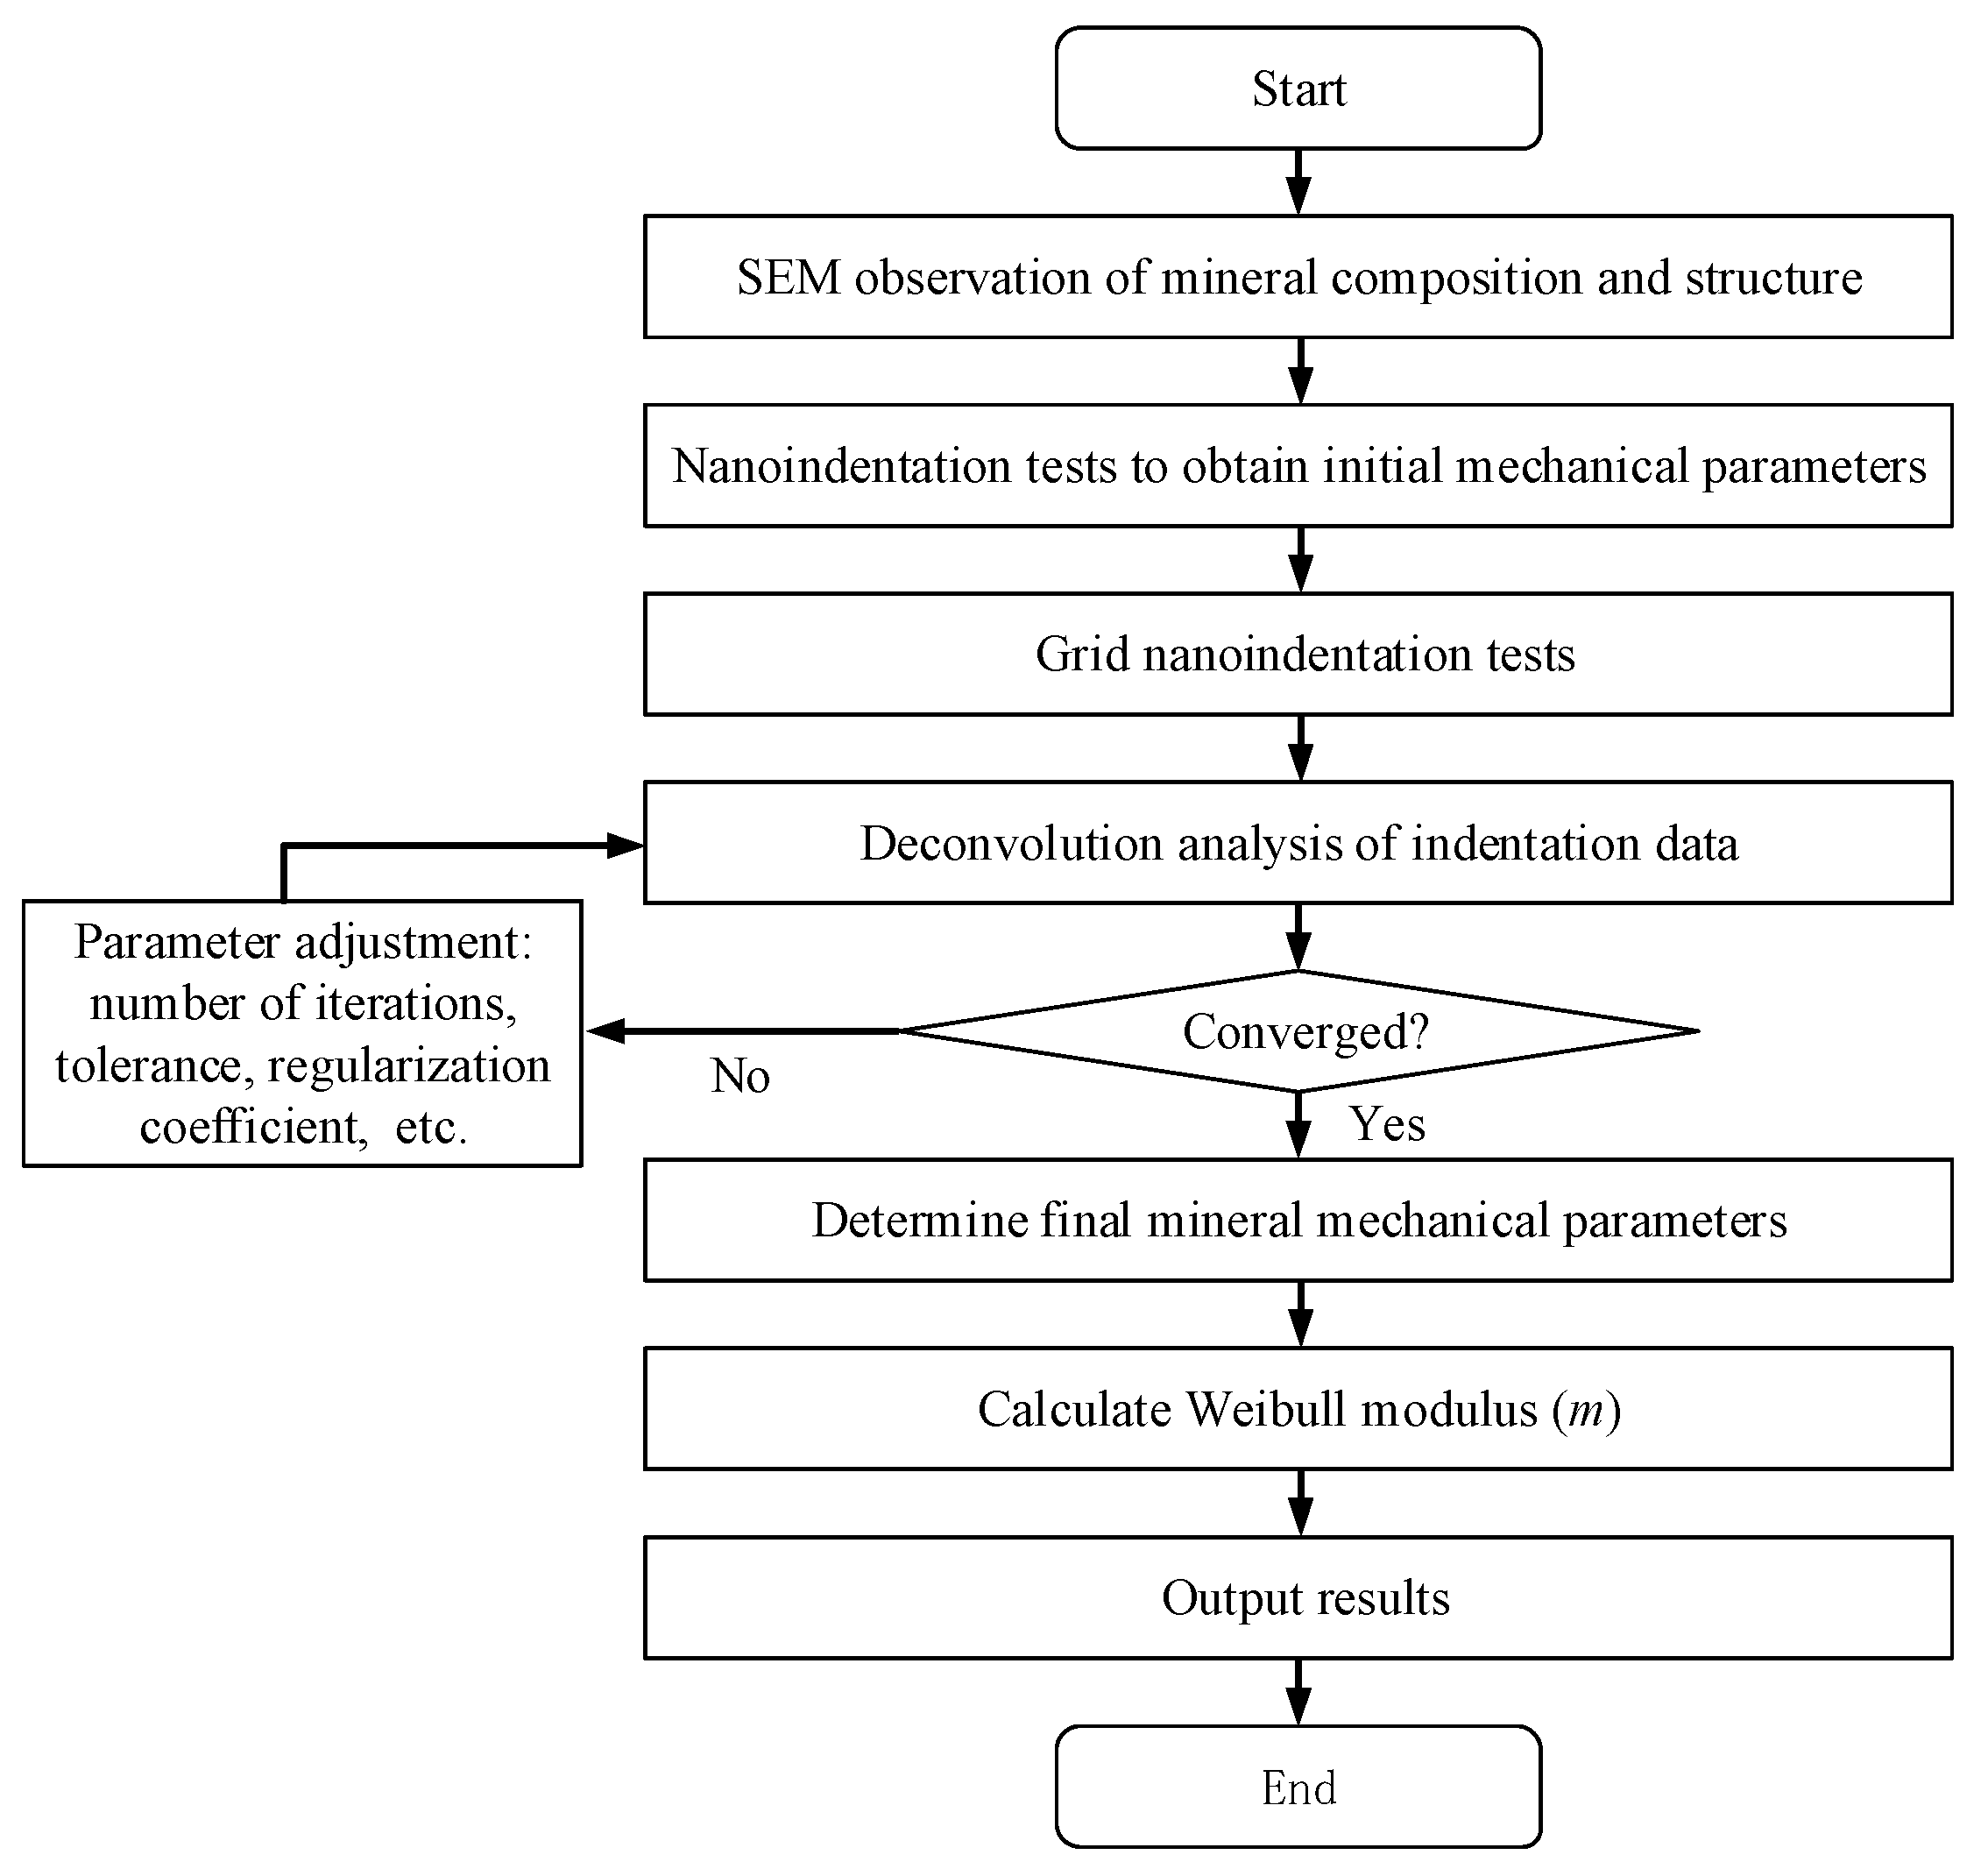
The initial mechanical parameters of each mineral phase were obtained through scanning electron microscopy (SEM) observation and nanoindentation experiments. Based on these results, further grid nanoindentation tests were conducted. Deconvolution analysis of the indentation data was performed to determine the final mechanical parameters and the Weibull modulus (m) for each mineral phase (see Figure 7 for the procedure and Table 2 for experimental data; the tensile-to-compressive strength ratio for each mineral ranged from 1/12 to 1/15). These parameters were then assigned to the corresponding materials in the model for subsequent uniaxial tensile simulations.
During the modeling process, the rock was treated as a heterogeneous material composed of numerous finite elements. Each element was assigned a mineral type based on segmentation of high-resolution FIB-SEM images (with a resolution of 20 nm). At this resolution, the interfaces between mineral grains can be clearly identified and directly represented as elements. Therefore, without the need for explicit interface elements, the model can effectively simulate interface-controlled fracture mechanisms and mechanical responses.
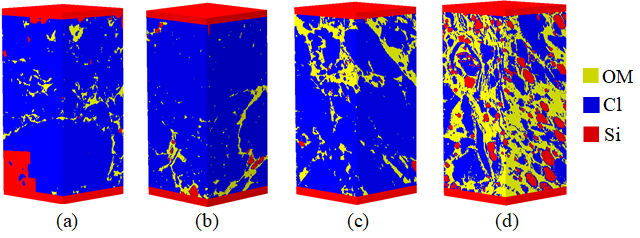
Figure 8 presents the reconstructed three-dimensional digital rock core numerical model. In this figure, red represents silicate mineral particles, blue represents clay matrix, and yellow represents organic matter. A comparison between the numerical model (Figure 8) and the original shale FIB-SEM images (Figure 5) reveals that the numerical model accurately depicts the three-dimensional spatial distribution of various mineral components. The mineral volume fractions and distribution characteristics in each model match those of the original model. During tensile numerical simulation, a load was applied to the lower steel platen’s bottom surface, while the upper platen was fixed in the loading direction. The displacement increment was set at 1.4 × 10⁻⁵ μm/step until the specimen reached its load-bearing capacity, at which point loading was terminated.

3. Uniaxial Tensile Simulations of Digital Core Numerical Model

3.1. Evolution Process of Tensile Cracks

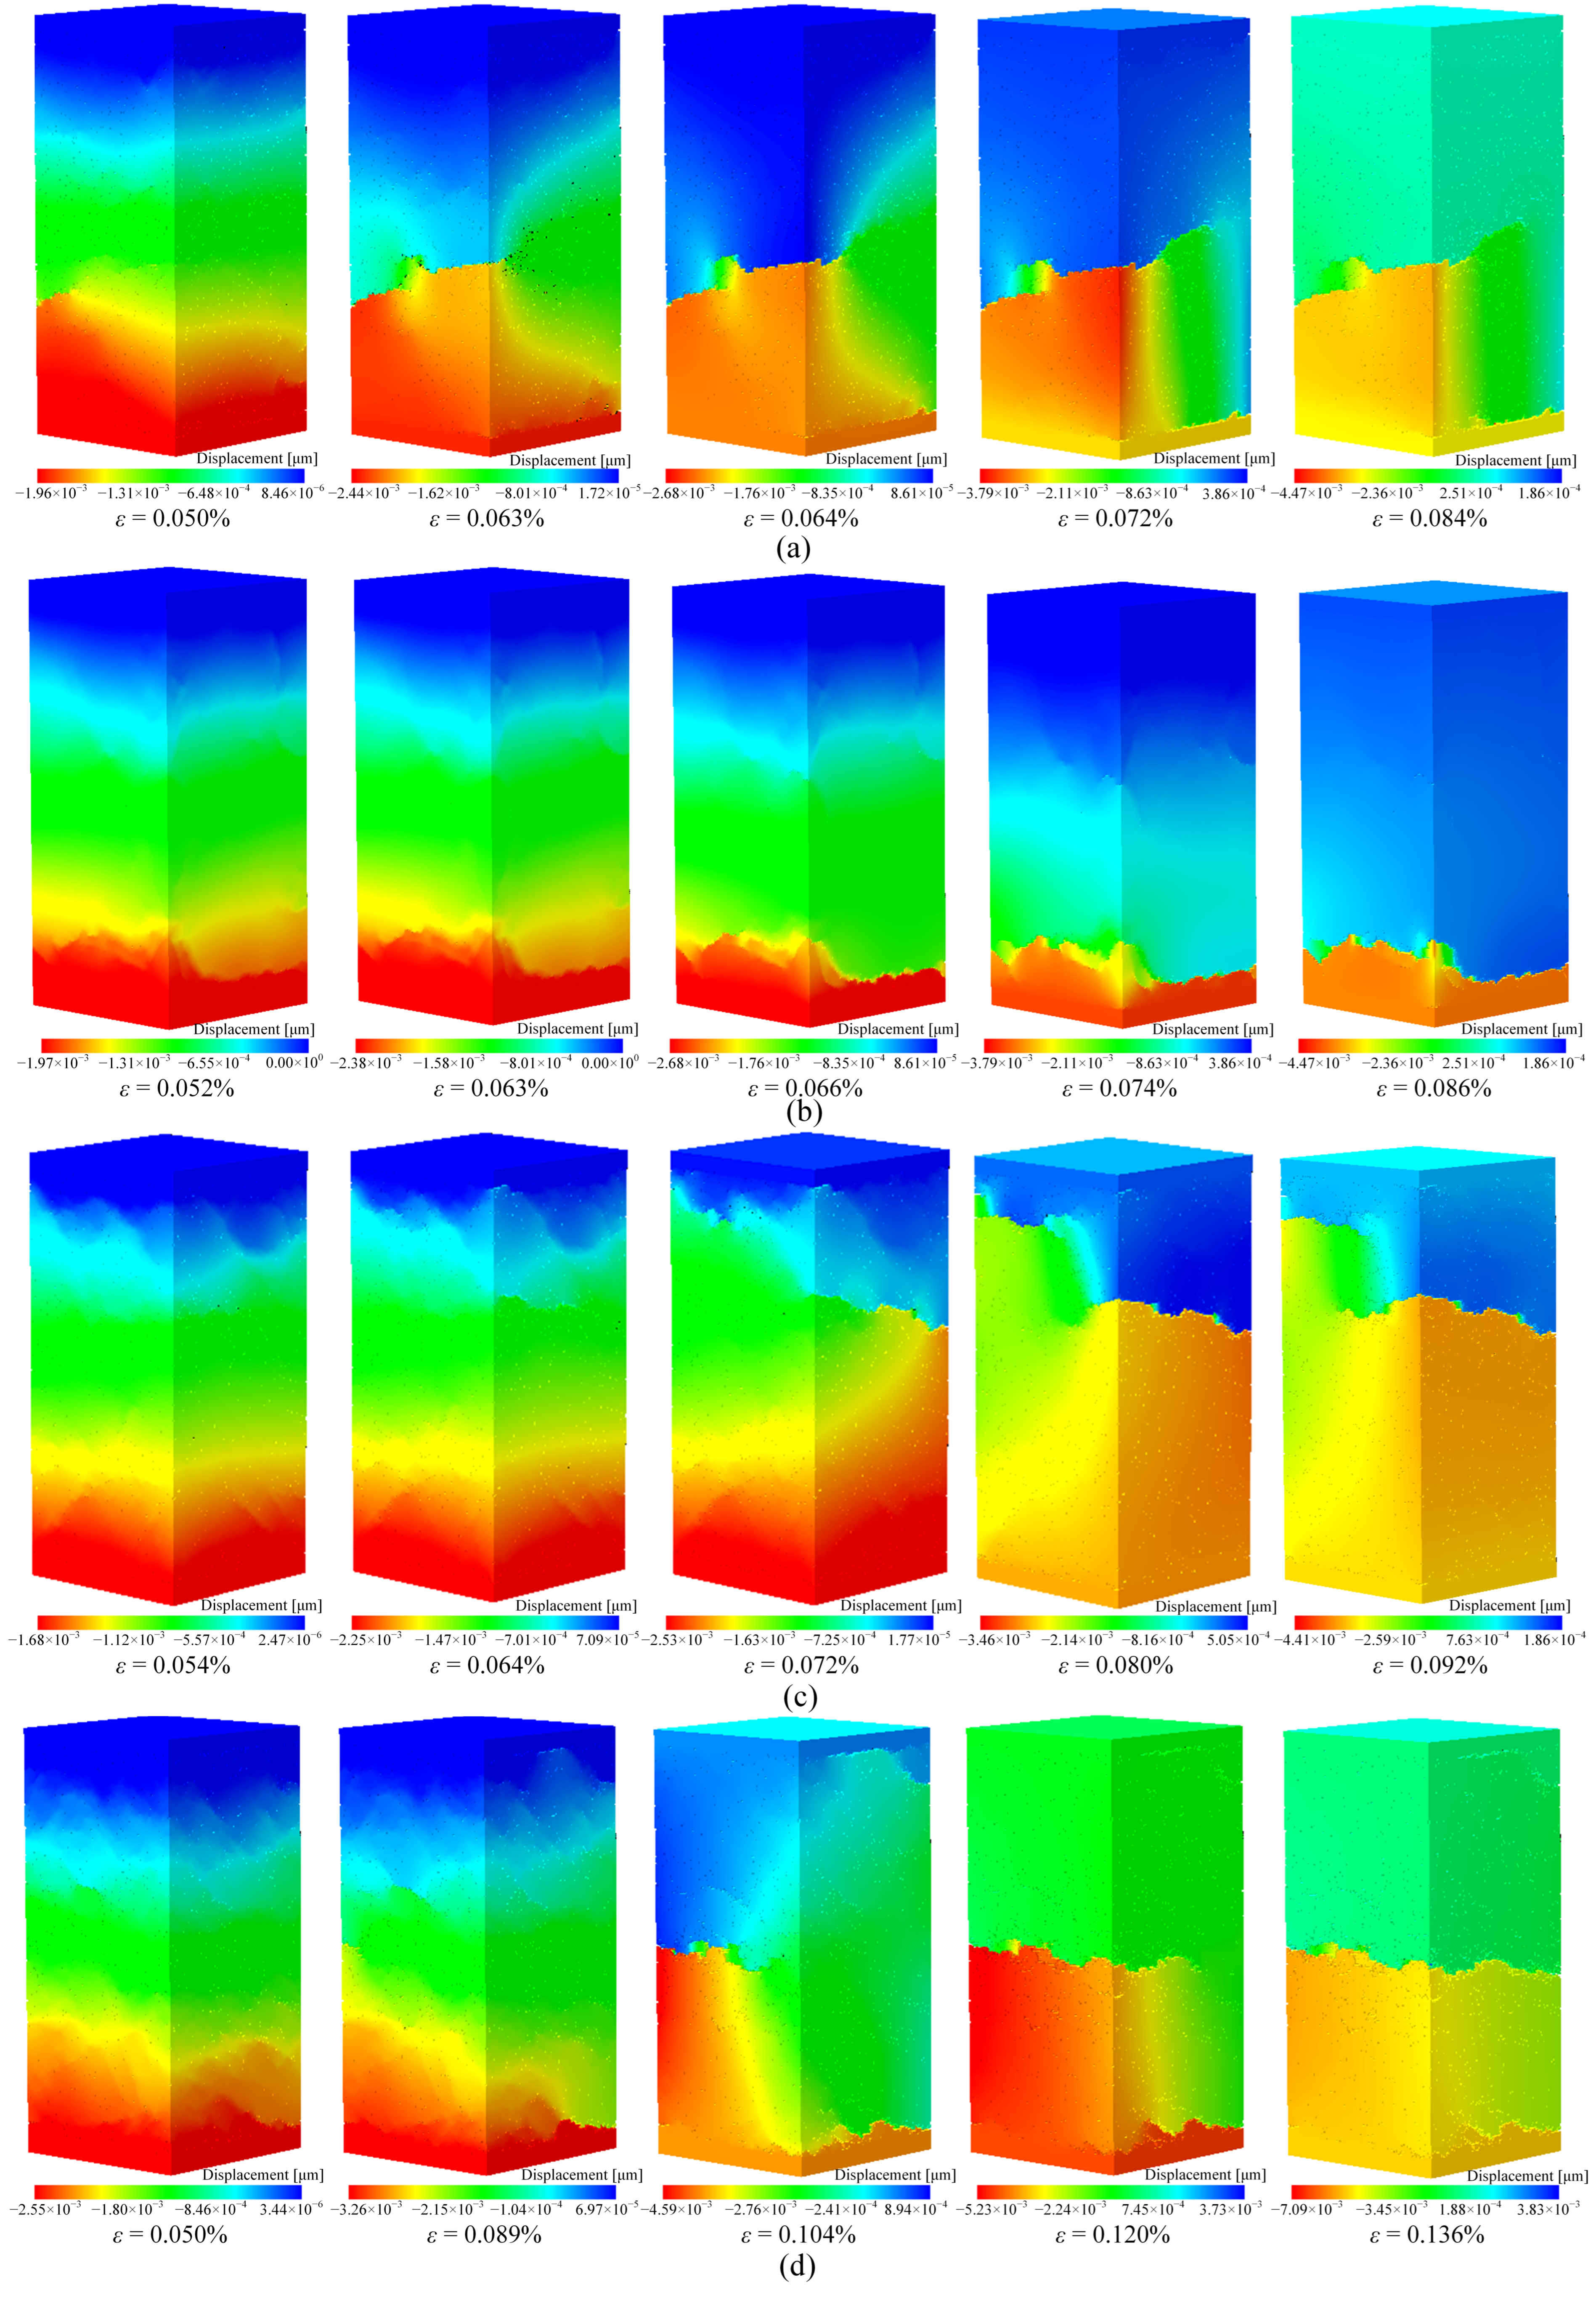
Figure 9 illustrates the surface crack formation process under tensile loading for four specimens. In WM1 (Figure 9a), displacement discontinuities first appear at a natural organic-matter-filled crack near the center of the specimen, oriented approximately perpendicular to the loading direction. As loading continues, these discontinuities become increasingly pronounced, eventually evolving into newly initiated tensile cracks along the natural interface. This process culminates in the formation of a macroscopic primary crack. For WM2 (Figure 9b), no significant displacement discontinuity is observed in the early stages of loading. However, as the loading progresses, the first signs of displacement discontinuity appear near the bottom of the specimen at a location approximately perpendicular to the tensile direction. With continued loading, this discontinuity intensifies, and the specimen begins to separate along the natural organic-matter-filled crack, forming a rough and non-planar fracture surface. The macroscopic crack continues to propagate until complete tensile failure occurs.
In WM3 (Figure 9c), displacement discontinuities are not apparent initially. As loading advances, discontinuities emerge in the upper region of the specimen, at an angle of approximately 60° to the tensile axis. These discontinuities grow in intensity, ultimately resulting in separation along the pre-existing organic-matter-filled crack and the formation of a relatively rough macroscopic fracture surface. For WM4 (Figure 9d), in addition to organic matter, the specimen contains a considerable amount of silicate mineral particles, with a relatively uniform microstructural distribution. During early loading, displacement discontinuities are minimal. As the load increases, discontinuities become evident along the edges of silicate particles in the central region. These continue to develop, leading to crack initiation, propagation, and the eventual formation of a primary tensile fracture surface.
In summary, tensile cracks preferentially initiate at the interfaces between organic matter and clay minerals, i.e., at boundaries between mechanically soft and hard phases, and propagate along these interfaces. Furthermore, the smaller the angle between the normal to a natural organic-matter-filled crack and the tensile loading direction, the more likely it is that tensile cracks will initiate and extend along that interface.

3.2. Dynamic Evolution Characteristics of Tensile Stress and Damage Variable

Figure 10 presents the evolution of stress and damage variables with strain during the uniaxial tensile numerical tests. It is evident that the organic matter volume fraction and microstructural differences significantly influence the mechanical behavior and damage characteristics of shale. Before reaching peak stress, WM1 exhibits the fastest increase in stress, followed by WM2, WM3, and WM4. After the peak, WM1 also shows the most rapid reduction in stress, with WM2, WM3, and WM4 following in order. The rate of damage variable growth follows the same sequence: WM1, WM2, WM3, and WM4. These results suggest that a higher organic matter volume fraction leads to a slower stress accumulation rate, a more gradual post-peak stress drop, and slower damage development. Additionally, higher organic matter content corresponds to lower tensile strength and smaller damage variables at failure. Therefore, it can be concluded that specimens with higher organic matter volume fractions are more susceptible to tensile failure but less likely to form complex tensile cracks. This conclusion provides meaningful guidance for predicting crack behavior during the failure of rock materials.

3.3. Acoustic Emission Analysis

Figure 11 illustrates the variation in acoustic emission (AE) counts with strain during the uniaxial numerical tensile tests. It can be observed that specimens with varying volume fractions of naturally filled organic matter exhibit a similar trend in AE evolution. Specifically, noticeable AE activity begins in the early loading stage, around a strain level of 0.002%. As the loading continues, AE counts steadily increase, followed by a sharp spike after reaching peak stress, and then gradually decrease until the specimen undergoes complete failure.
Notably, throughout the loading process and particularly near the stress peak, specimens with higher organic matter volume fractions consistently exhibit significantly lower AE counts compared to those with lower organic content. Moreover, the surge in AE activity near the peak stress becomes more pronounced as the organic matter content decreases. This indicates that specimens with lower organic matter volume fractions exhibit more distinct brittle behavior.
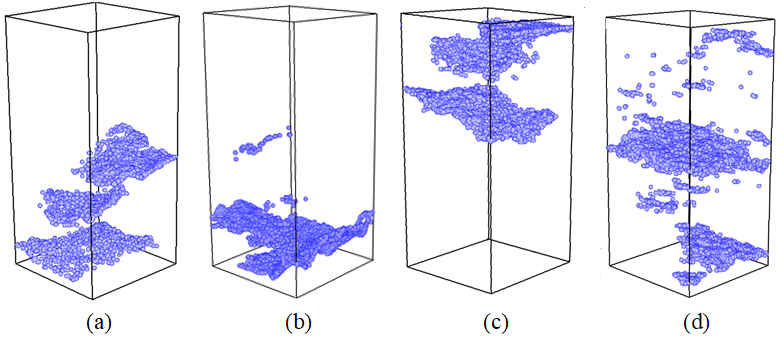
Figure 12 presents the acoustic emission (AE) maps for each specimen, clearly illustrating the three-dimensional spatial distribution of cracks. For specimen WM1, tensile cracks are primarily concentrated in the lower–middle region; in WM2, they are similarly located in the lower part. In contrast, cracks in WM3 are predominantly found in the upper region, while those in WM4 are mainly situated in the central portion. Notably, as shown in Figure 10, beyond the main fracture surfaces, several secondary cracks have also formed, oriented approximately parallel to the direction of the applied tensile load. It is important to emphasize that both the location and morphology of the primary and secondary cracks are largely governed by the internal mineral distribution within the rock, especially the spatial arrangement of organic matter, which exhibits the lowest tensile strength among the constituents.

4. The Influence of Organic Matter Volume Fraction and Fractal Dimension

4.1. Tensile Strength

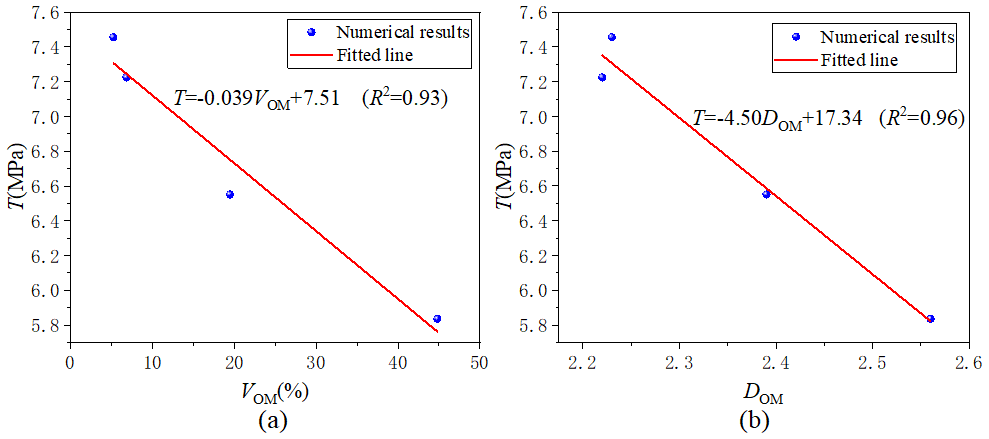
Figure 13 illustrates the relationship between tensile strength and the organic matter characteristics, revealing that both the volume fraction and the fractal dimension of organic matter have a significant influence on tensile strength. Specifically, as the volume fraction of organic matter increases, the tensile strength of the specimen decreases markedly. When the volume fractions are similar, specimens with higher fractal dimensions of organic matter tend to exhibit greater tensile strength. This is because higher fractal dimensions indicate more complex natural crack morphologies, which lead to a more intricate internal stress transfer path. As a result, internal stresses are more effectively dispersed within the rock, thereby enhancing its tensile resistance. However, it is important to note that since the fractal dimension of organic matter is generally positively correlated with its volume fraction, the overall trend shows that tensile strength decreases with increasing fractal dimension.

4.2. Characteristic Parameters of Tensile Cracks

Figure 14 illustrates the relationship between the damage variable ω and organic matter, where the damage variable ω is defined as the ratio of damaged elements to the total number of elements. It is evident from the figure that both the volume fraction and the fractal dimension of natural organic-matter-filled fractures have a significant impact on the extent of damage. Specifically, as the volume fraction of organic matter increases, the damage variable shows a decreasing trend. This suggests that under tensile loading, specimens with a higher organic matter content tend to form simpler crack patterns. This phenomenon may be attributed to the enhanced energy absorption and dissipation capacity associated with a higher organic matter content, which reduces the likelihood of extensive crack propagation. In contrast, specimens with lower organic matter content are more susceptible to stress concentration, thereby promoting the initiation and propagation of new cracks.
However, when the volume fraction of organic matter is comparable, a higher fractal dimension corresponds to a greater damage variable. This is because a higher fractal dimension reflects more intricate natural fissure geometries, which complicate stress transmission paths and lead to the formation of more complex tensile cracks. Nevertheless, since the fractal dimension of organic matter is generally positively correlated with its volume fraction, the overall trend indicates that higher fractal dimensions are associated with lower damage variables.
The results and analysis presented in Figure 15 highlight the significant influence of both the volume fraction and fractal dimension of organic matter on the unit damage variable η, where η represents the damage variable divided by the strain energy. Specifically, as the volume fraction of organic matter increases, the unit damage variable decreases. This indicates that under tensile loading, specimens with higher organic matter content tend to generate smaller volumes of tensile fractures for the same amount of energy input. However, when the organic matter volume fractions are comparable, specimens with higher fractal dimensions exhibit greater unit damage variables, suggesting that more complex microstructural geometries promote higher damage accumulation per unit of energy consumed. Nevertheless, given that the fractal dimension of organic matter is generally positively correlated with its volume fraction, the overall trend indicates that a higher fractal dimension is still associated with a lower unit damage variable.
The above investigation reveals a strong correlation between the mechanical properties of shale specimens and the characteristic parameters of organic-matter-filled cracks, particularly the volume fraction and fractal dimension. These two parameters demonstrate predictive capacity for uniaxial tensile strength, global damage variables, and unit damage variables. As the volume fraction of organic matter increases, all three metrics exhibit a progressive decline. This trend indicates that under tensile loading, specimens with higher organic matter content tend to develop simpler fracture morphologies and are less likely to generate complex tensile cracks. This behavior is primarily attributed to the enhanced capacity for energy absorption and dissipation provided by the higher organic content, which inhibits crack initiation and propagation. Conversely, specimens with lower organic matter volume fractions are more susceptible to stress concentration, thereby facilitating the development of new fractures.

5. Analysis of Tensile Fracture Mechanism

5.1. Dynamic Evolution of Microfracture Mechanisms

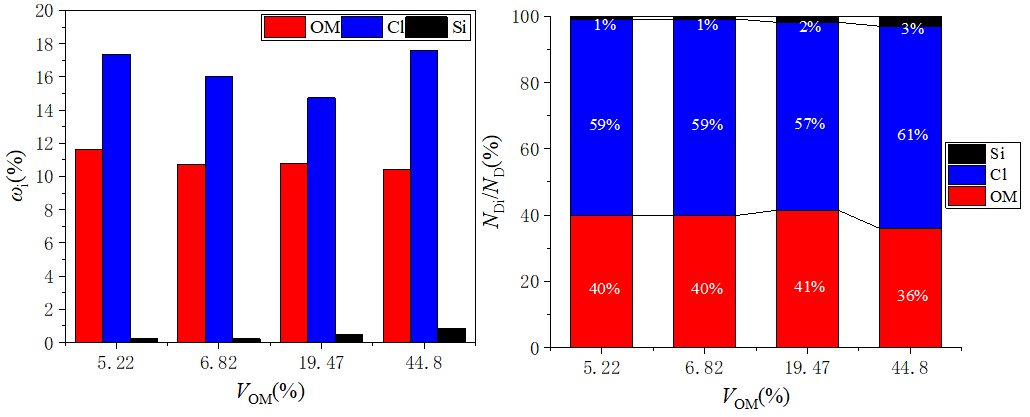
In Figure 16, the failure rates of mineral particles across different models are compared. The results highlight a pronounced effect of the organic matter volume fraction on mineral failure behavior. At the early stage of loading, failure initiates in the clay matrix, followed by progressive damage in the organic matter. In the later stages, silicate minerals exhibit minimal failure, with rates significantly lower than those of the other two components. Moreover, the failure rates of all mineral phases follow a consistent trend: a gradual initial increase, a sharp acceleration, and eventual stabilization as loading continues.
From the perspective of mineral constituents, the clay matrix exhibits the highest failure rate throughout the loading process, followed by organic matter, while silicate minerals show the lowest. Moreover, as the organic matter volume fraction increases, the growth rate of failure across all mineral phases becomes progressively slower. Further analysis reveals that the failure rate of organic matter in samples WM1, WM2, and WM3 increases sharply after the strain reaches a certain threshold, indicating a typical brittle failure stage. However, this phenomenon is not observed in sample WM4.
This difference can be attributed to variations in the organic matter volume fraction and fractal dimension among the samples. Specifically, WM1, WM2, and WM3 have relatively low organic matter contents (5.22%, 6.82%, and 19.47%, respectively) and lower fractal dimensions, resulting in a more discrete distribution of organic matter within the rock matrix. In these samples, the rigid mineral framework (mainly silicates and clays) remains continuous, and the organic matter mainly acts as a filler. During loading, cracks are more likely to branch and propagate along interfaces with significant differences in mineral properties, leading to moderate energy release and intermediate brittleness. In contrast, WM4 has a much higher organic matter content (44.80%) and a higher fractal dimension (2.56). The abundant organic matter forms a more continuous soft phase within the rock, significantly reducing the overall stiffness and strength. In this case, crack propagation and stress concentration are mainly governed by the organic-rich zones, resulting in a more ductile failure mode and a more gradual, dispersed release of energy. As a result, intermediate brittleness is not observed in WM4, which instead exhibits pronounced ductile behavior.
Based on the ultimate tensile failure rates of mineral particles depicted in Figure 17, it is evident that, across all models, the failure rate is highest for the clay matrix, followed by organic matter, and lowest for silicate mineral particles, with silicates exhibiting significantly lower failure rates than the other two phases. This trend suggests that although the clay matrix is not inherently prone to crack initiation, its dominant volume fraction, widespread distribution, and extensive contact interfaces with both harder (e.g., silicates) and softer (e.g., organic matter) mineral phases make it the most susceptible to failure under tensile loading. In contrast, silicate minerals—despite possessing properties that promote crack formation—typically exhibit lower failure rates due to their high tensile strength. Nevertheless, their mechanical stiffness and contrast with adjacent phases may contribute to enhanced failure in the surrounding mineral constituents.
In conclusion, heterogeneity exerts a pronounced influence on tensile failure behavior. The spatial distribution of minerals and the mechanical contrasts between adjacent phases play critical roles in governing the failure process and determining fracture modes. Notably, minerals with the lowest and highest tensile strengths have a dominant influence on both failure rates and damage evolution patterns [48,49]. Therefore, in research, hydraulic fracturing design, and field operations, particular attention should be directed toward these mineral phases.

5.2. Comparison with SEM Scanning Test Results

To verify the reliability of the numerical simulation results in this study, SEM experiments were performed to comprehensively examine the propagation characteristics of microcracks in shale specimens subjected to external mechanical loading, as shown in Figure 18. As illustrated in Figure 18a, cracks are observed to propagate around silicate mineral grains and display a notably complex morphology. This observation highlights the significant influence of the geometric configuration of mineral particles on the form and complexity of crack development. In Figure 18b, the propagation patterns of cracks within and along the boundaries of organic matter are illustrated. Specifically, Crack 1 extends along the interface between the clay matrix and organic matter, while Crack 2 propagates directly through the organic matter. These observations underscore the significant role of organic matter in influencing crack development.
It should be noted that, due to experimental limitations, the SEM images of microcrack propagation were not obtained under strictly uniaxial tensile conditions. Although there are differences in loading conditions compared to the numerical simulations, the SEM observations mainly serve to qualitatively reveal the microcrack propagation paths at mineral interfaces, providing auxiliary validation for the reliability of the simulation results.
In summary, the results of the SEM experiments suggest that heterogeneity in mineral composition and contrasts in elastic stiffness among mineral phases significantly influence the mechanical response of rock specimens. Fracture propagation tends to preferentially occur at interfaces between strong and weak mineral phases, such as those between organic matter and clay minerals or between brittle minerals and clay minerals. This behavior is primarily attributed to the mismatched elastic moduli of different mineral constituents, which create substantial imbalances in their abilities to transmit stress and accommodate deformation. As a result, localized stress concentrations develop, ultimately affecting the fracture behavior of the material [3]. These experimental observations are highly consistent with the crack propagation patterns observed in our numerical simulations (Figure 18c–f), thereby indirectly validating the reliability and accuracy of the present study.

6. Conclusions

In this study, a three-dimensional digital rock core model was reconstructed by integrating high-precision FIB-SEM imaging, digital image processing techniques, grid mapping methods, and the Weibull distribution model. This approach enabled accurate representation of the real microstructure and mineral heterogeneity in tight shale formations. Numerical uniaxial tensile simulations were performed to investigate, from a microscopic perspective, the effects of the volume fraction and fractal dimension of natural organic-matter-filled cracks on the mechanical behavior and fracture characteristics of shale. The key conclusions are as follows:
(1)
The volume fraction and spatial distribution of organic matter have a significant impact on the location of tensile failure. Tensile cracks tend to initiate at interfaces between minerals with large differences in elastic modulus. When the angle between the normal of organic-matter-filled cracks and the direction of applied tensile stress is smaller, cracks are more likely to initiate and propagate along these organic-matter-filled interfaces.
(2)
Under tensile loading, as both the volume fraction and fractal dimension of organic matter increase, the uniaxial tensile strength, global damage variable, unit damage variable, and total number of acoustic emissions all decrease progressively. However, when the volume fractions are approximately equal, specimens with a higher fractal dimension exhibit greater tensile strength, damage variables, and unit damage variables. Therefore, both the volume fraction and fractal dimension of organic matter can be used to predict the tensile strength and damage characteristics of shale specimens.
(3)
For organic-rich shale formations primarily composed of clay minerals, organic matter, and silicates, the tensile failure behavior of different mineral phases is governed by both their mechanical properties and spatial distribution. In our digital core simulations under uniaxial tensile loading, the clay matrix exhibits the highest overall failure rate, followed by organic matter, while silicate minerals show the lowest. However, this trend does not reflect intrinsic material weakness alone. The higher failure rate of clay is primarily due to its dominant volume fraction and widespread interfacial contact with both stronger and softer phases. Organic matter displays intermediate failure behavior, which transitions from brittle to ductile as its volume fraction and structural continuity increase. Although silicate minerals rarely fail directly due to their high tensile strength, their stiffness contrast may induce stress concentrations in adjacent regions. Notably, the sequence of failure typically initiates in the clay matrix, progresses through the organic matter, and affects silicate minerals only minimally at the final stages of loading. Crack propagation preferentially occurs at mechanically heterogeneous interfaces.
This study provides a microscale theoretical foundation for optimizing hydraulic fracturing design in organic-rich shale reservoirs. By quantitatively evaluating the influence of organic matter content and microstructure on shale tensile strength and fracture evolution, the results offer valuable guidance for selecting suitable fracturing intervals. The identified fracture patterns and localized stress concentrations in organic-rich zones further provide predictive insights into potential fracture initiation sites under field conditions. These findings support the optimization of stage placement and perforation strategies by highlighting zones of elevated tensile susceptibility, ultimately enhancing the development of complex fracture networks in unconventional reservoirs. However, the digital core models and simulation conditions used in this work may not fully capture the multi-scale and multi-physics complexity of real reservoir environments. Further research is needed to validate and extend these conclusions under more representative geological scenarios.

Author Contributions

Conceptualization: X.L. and Z.L.; methodology: X.L. and T.L.; formal analysis and investigation: X.L. and Y.W.; writing—original draft preparation: X.L. and T.L.; writing—review and editing: X.L. and T.L.; funding acquisition: X.L. and T.L.; resources: S.M. and L.Z.; supervision: Z.L. All authors have read and agreed to the published version of the manuscript.

Funding

This work was supported by the China Postdoctoral Science Foundation Funded Project (2024M750322), the Postdoctoral Fellowship Program of CPSF (GZC20230364), the National Natural Science Foundation of China (NSFC) (42202305, 42472346), and the Fundamental Research Funds for the Central Universities DUT24RC(3)034.

Data Availability Statement

The original contributions presented in this study are included in the article. Further inquiries can be directed to the corresponding authors.

Acknowledgments

During the preparation of this work, the authors used ChatGPT4.0 to improve readability and language. After using this tool/service, the authors reviewed and edited the content as needed and take full responsibility for the content of the publication.

Conflicts of Interest

Author L.Z. was employed by the company Sanying Precision Instruments Co., Ltd. The remaining authors declare that the research was conducted in the absence of any commercial or financial relationships that could be construed as a potential conflict of interest.

Abbreviations

The following abbreviations are used in this manuscript:
ClClay Matrix
FIB-SEMFocused Ion Beam Scanning Electron Microscopy
OMOrganic Matter
ROIRegions of Interest
SiSilicate Mineral

References

  1. Goral, J.; Deo, M.; McLennan, J.; Huang, H.; Mattson, E. Macro- and micro-compression testing of shales. J. Pet. Sci. Eng. 2020, 191, 107034. [Google Scholar] [CrossRef]
  2. Wang, J.; Liu, Y.; Yang, C.; Zheng, Y.; Jiang, W.; Menegon, L.; Renard, F.; Peng, P.; Xiong, Y. Upscaling the creep behavior of clay-rich and quartz-rich shales from nanoindentation measurements: Application to the Wufeng-Longmaxi shale, China. Int. J. Rock Mech. Min. Sci. 2023, 171, 105580. [Google Scholar] [CrossRef]
  3. Yan, D.; Zhao, L.; Wang, Y.; Zhang, Y.; Cai, Z.; Song, X.; Zhang, F.; Geng, J. Heterogeneity indexes of unconventional reservoir shales: Quantitatively characterizing mechanical properties and failure behaviors. Int. J. Rock Mech. Min. Sci. 2023, 171, 105577. [Google Scholar] [CrossRef]
  4. Guan, Y.; Cui, Z.; Zhou, W. Reconstruction in off-axis digital holography based on hybrid clustering and the fractional Fourier transform. Opt. Laser Technol. 2025, 186, 112622. [Google Scholar] [CrossRef]
  5. Ni, Z.L.; Ma, J.S.; Liu, Y.; Li, B.H.; Nazarov, A.A.; Li, H.; Yuan, Z.P.; Ling, Z.C.; Wang, X.X. Numerical Analysis of Ultrasonic Spot Welding of Cu/Cu Joints. J. Mater. Eng. Perform. 2025, 1–12. [Google Scholar] [CrossRef]
  6. Yali, D. High-temperature deformation measurement using optical imaging digital image correlation: Status, challenge and future. Chin. J. Aeronaut. 2025, 38, 103472. [Google Scholar] [CrossRef]
  7. Zhang, H.H.; Jia, Z.L.; Zhang, P.F.; Liu, Y.; Jiang, L.J.; Ding, D.Z. Electromagnetic-Circuital-Thermal-Mechanical Multiphysics Numerical Simulation Method for Microwave Circuits. IEEE J. Multiscale Multiphysics Comput. Tech. 2024, 9, 129–141. [Google Scholar] [CrossRef]
  8. Liu, Q.; Wang, Z. Review of Numerical Modeling Based on Digital Image Processing for Rock Mechanics Applications. Chinese Chin. J. Rock Mech. Eng 2020, 39, 3286–3296. (In Chinese) [Google Scholar]
  9. Tang, C.A. Numerical simulation of progressive rock failure and associated seismicity. Int. J. Rock Mech. Min. Sci. 1997, 34, 249–261. [Google Scholar] [CrossRef]
  10. Tang, C.; Ma, T.; Ding, X. On stress-forecasting strategy of earthquakes from stress buildup, stress shadow and stress transfer (SSS) based on numerical approach. Earthq. Sci. 2009, 22, 53–62. [Google Scholar] [CrossRef]
  11. Tang, C.A.; Tham, L.; Lee, P.; Tsui, Y.; Liu, H. Numerical studies of the influence of microstructure on rock failure in uniaxial compression—Part II: Constraint, slenderness and size effect. Int. J. Rock Mech. Min. Sci. 2000, 37, 571–583. [Google Scholar] [CrossRef]
  12. Tang, C.A.; Liu, H.; Lee, P.; Tsui, Y.; Tham, L.G. Numerical studies of the inuence of microstructure on rock failure in uniaxial compression part I: Eect of heterogeneity. Int. J. Rock Mech. Min. Sci. 2000, 37, 555–569. [Google Scholar] [CrossRef]
  13. Tang, C.A.; Xu, T.; Yang, T.H.; Liang, Z.Z. Numerical investigation of the mechanical behavior of rock under confining pressure and pore pressure. Int. J. Rock Mech. Min. Sci. 2004, 41, 336–341. [Google Scholar] [CrossRef]
  14. Shimizu, H.; Murata, S.; Ishida, T. The distinct element analysis for hydraulic fracturing in hard rock considering fluid viscosity and particle size distribution. Int. J. Rock Mech. Min. Sci. 2011, 48, 712–727. [Google Scholar] [CrossRef]
  15. Pan, C.; Li, X.; He, L.; Li, J. Study on the effect of micro-geometric heterogeneity on mechanical properties of brittle rock using a grain-based discrete element method coupling with the cohesive zone model. Int. J. Rock Mech. Min. Sci. 2021, 140, 104680. [Google Scholar] [CrossRef]
  16. Liu, G.; Cai, M.; Huang, M. Mechanical properties of brittle rock governed by micro-geometric heterogeneity. Comput. Geotech. 2018, 104, 358–372. [Google Scholar] [CrossRef]
  17. Gao, F.; Stead, D.; Elmo, D. Numerical simulation of microstructure of brittle rock using a grain-breakable distinct element grain-based model. Comput. Geotech. 2016, 78, 203–217. [Google Scholar] [CrossRef]
  18. Mavko, G.; Mukerji, T.; Dvorkin, J. The Rock Physics Handbook: Tools for Seismic Analysis of Porous Media; Cambridge University Press: Cambridge, UK, 2009. [Google Scholar]
  19. Li, Q.; Xing, H.; Liu, J.; Liu, X. A review on hydraulic fracturing of unconventional reservoir. Petroleum 2015, 1, 8–15. [Google Scholar] [CrossRef]
  20. Wang, G.; Shen, J.; Liu, S.; Jiang, C.; Qin, X. Three-dimensional modeling and analysis of macro-pore structure of coal using combined X-ray CT imaging and fractal theory. Int. J. Rock Mech. Min. Sci. 2019, 123, 104082. [Google Scholar] [CrossRef]
  21. Chen, B.; Xiang, J.; Latham, J.-P. Influence of inter-grain cementation stiffness on the effective elastic properties of porous Bentheim sandstone. J. Rock Mech. Geotech. Eng. 2022, 15, 573–583. [Google Scholar] [CrossRef]
  22. Chen, B.; Xiang, J.; Latham, J.-P.; Bakker, R.R. Grain-scale failure mechanism of porous sandstone: An experimental and numerical FDEM study of the Brazilian Tensile Strength test using CT-Scan microstructure. Int. J. Rock Mech. Min. Sci. 2020, 132, 104348. [Google Scholar] [CrossRef]
  23. Zhao, Z.; Zhou, X.-P. Establishment of numerical cracking constitutive models using 3D reconstruction and X-ray CT images of geomaterials. Int. J. Mech. Sci. 2020, 183, 105814. [Google Scholar] [CrossRef]
  24. Wang, Y.; Hou, Z.Q.; Hu, Y.Z. In situ X-ray micro-CT for investigation of damage evolution in black shale under uniaxial compression. Environ. Earth Sci. 2018, 77, 1–12. [Google Scholar] [CrossRef]
  25. Eliyahu, M.; Emmanuel, S.; Day-Stirrat, R.J.; Macaulay, C.I. Mechanical properties of organic matter in shales mapped at the nanometer scale. Mar. Pet. Geol. 2015, 59, 294–304. [Google Scholar] [CrossRef]
  26. Huo, Z.; Zhang, J.; Li, P.; Tang, X.; Yang, X.; Qiu, Q.; Dong, Z.; Li, Z. An improved evaluation method for the brittleness index of shale and its application—A case study from the southern north China basin. J. Nat. Gas Sci. Eng. 2018, 59, 47–55. [Google Scholar] [CrossRef]
  27. Bennett, K.C.; Berla, L.A.; Nix, W.D.; Borja, R.I. Instrumented nanoindentation and 3D mechanistic modeling of a shale at multiple scales. Acta Geotech. 2015, 10, 1–14. [Google Scholar] [CrossRef]
  28. Bobko, C.P.; Gathier, B.; Ortega, J.A.; Franz, J.; Ulm, F.J.; Borges, L.; Abousleiman, Y.N. The nanogranular origin of friction and cohesion in shale—A strength homogenization approach to interpretation of nanoindentation results. Int. J. Numer. Anal. Methods Geomech. 2011, 35, 1854–1876. [Google Scholar] [CrossRef]
  29. Yang, C.; Xiong, Y.; Wang, J.; Li, Y.; Jiang, W. Mechanical characterization of shale matrix minerals using phase-positioned nanoindentation and nano-dynamic mechanical analysis. Int. J. Coal Geol. 2020, 229, 103571. [Google Scholar] [CrossRef]
  30. Gerke, K.M.; Korostilev, E.V.; Romanenko, K.A.; Karsanina, M.V. Going submicron in the precise analysis of soil structure: A FIB-SEM imaging study at nanoscale. Geoderma 2021, 383, 114739. [Google Scholar] [CrossRef]
  31. Tang, X.; Jiang, Z.; Jiang, S.; Li, Z. Heterogeneous nanoporosity of the Silurian Longmaxi Formation shale gas reservoir in the Sichuan Basin using the QEMSCAN, FIB-SEM, and nano-CT methods. Mar. Pet. Geol. 2016, 78, 99–109. [Google Scholar] [CrossRef]
  32. Gou, Q.; Xu, S.; Hao, F.; Yang, F.; Zhang, B.; Shu, Z.; Zhang, A.; Wang, Y.; Lu, Y.; Cheng, X.; et al. Full-scale pores and micro-fractures characterization using FE-SEM, gas adsorption, nano-CT and micro-CT: A case study of the Silurian Longmaxi Formation shale in the Fuling area, Sichuan Basin, China. Fuel 2019, 253, 167–179. [Google Scholar] [CrossRef]
  33. Kelly, S.; El-Sobky, H.; Torres-Verdín, C.; Balhoff, M.T. Assessing the utility of FIB-SEM images for shale digital rock physics. Adv. Water Resour. 2016, 95, 302–316. [Google Scholar] [CrossRef]
  34. Saif, T.; Lin, Q.; Butcher, A.R.; Bijeljic, B.; Blunt, M.J. Multi-scale multi-dimensional microstructure imaging of oil shale pyrolysis using X-ray micro-tomography, automated ultra-high resolution SEM, MAPS Mineralogy and FIB-SEM. Appl. Energy 2017, 202, 628–647. [Google Scholar] [CrossRef]
  35. Zhang, J.; Tang, Y.; He, D.; Sun, P.; Zou, X. Full-scale nanopore system and fractal characteristics of clay-rich lacustrine shale combining FE-SEM, nano-CT, gas adsorption and mercury intrusion porosimetry. Appl. Clay Sci. 2020, 196, 105758. [Google Scholar] [CrossRef]
  36. Shi, X.; Jiang, S.; Lu, S.; He, Z.; Li, D.; Wang, Z.; Xiao, D. Investigation of mechanical properties of bedded shale by nanoindentation tests: A case study on Lower Silurian Longmaxi Formation of Youyang area in southeast Chongqing, China. Pet. Explor. Dev. 2019, 46, 177–185. (In Chinese) [Google Scholar] [CrossRef]
  37. Li, T.; Li, L.; Tang, C.A.; Zhang, Z.; Li, M.; Zhang, L.; Li, A. A coupled hydraulic-mechanical-damage geotechnical model for simulation of fracture propagation in geological media during hydraulic fracturing. J. Pet. Sci. Eng. 2019, 173, 1390–1416. [Google Scholar] [CrossRef]
  38. Tang, C.A.; Tham, L.G.; Lee, P.K.K.; Yang, T.H.; Li, L.C. Coupled analysis of flow, stress and damage (FSD) in rock failure. Int. J. Rock Mech. 2002, 39, 477–489. [Google Scholar] [CrossRef]
  39. Lemaitre, J. How to use damage mechanics. Nucl. Eng. Des. 1984, 80, 233–245. [Google Scholar] [CrossRef]
  40. Liang, Z.Z.; Xing, H.; Wang, S.Y.; Williams, D.J.; Tang, C.A. A three-dimensional numerical investigation of the fracture of rock specimens containing a pre-existing surface flaw. Comput. Geotech. 2012, 45, 19–33. [Google Scholar] [CrossRef]
  41. Zhou, W.; Yan, G.; Yang, R. Elasto brittle damage model for rockmass based on field tests in Laxiwa arch dam site. Chin. J. Geotech. Eng. 1998, 20, 57–60. (In Chinese) [Google Scholar]
  42. Rankine, W.J.M. A Manual of Applied Mechanics; C. Griffin and Company, Ltd.: London, UK, 1901. [Google Scholar]
  43. Liu, X.; Meng, S.-W.; Liang, Z.-Z.; Tang, C.; Tao, J.-P.; Tang, J.-Z. Microscale crack propagation in shale samples using focused ion beam scanning electron microscopy and three-dimensional numerical modeling. Pet. Sci. 2023, 20, 1488–1512. [Google Scholar] [CrossRef]
  44. Ren, Y.; Chua, C.-S.; Ho, Y.-K. Motion detection with nonstationary background. Mach. Vis. Appl. 2003, 13, 332–343. [Google Scholar] [CrossRef]
  45. Otsu, N. A Threshold Selection Method from Gray-Level Histograms. IEEE Trans. Syst. Man Cybern. 1979, 9, 52–66. [Google Scholar] [CrossRef]
  46. Li, X.; Wei, W.; Wang, L.; Cai, J. Fractal Dimension of Digital 3D Rock Models with Different Pore Structures. Energies 2022, 15, 7461. [Google Scholar] [CrossRef]
  47. Tyler, S.W.; Wheatcraft, S.W. Fractal processes in soil water retention. Water Resour. Res. 1990, 26, 1047–1054. [Google Scholar] [CrossRef]
  48. Wang, Y. Numerical modelling of heterogeneous rock breakage behaviour based on texture images. Miner. Eng. 2015, 74, 130–141. [Google Scholar] [CrossRef]
  49. Tan, X.; Konietzky, H.; Chen, W. Numerical Simulation of Heterogeneous Rock Using Discrete Element Model Based on Digital Image Processing. Rock Mech. Rock Eng. 2016, 49, 4957–4964. [Google Scholar] [CrossRef]
Figure 1. Principle of FIB-SEM imaging.
Fractalfract 09 00518 g001
Figure 2. Schematic diagram of the principle of median filtering in 5 × 5 neighborhood windows (N = 1).
Fractalfract 09 00518 g002
Figure 3. Division of mineral material groups.
Fractalfract 09 00518 g003
Figure 4. Heterogeneity characteristics of digital core numerical models.
Fractalfract 09 00518 g004
Figure 5. FIB-SEM scanning samples: (a) WM1. (b) WM2. (c) WM3. (d) WM4.
Fractalfract 09 00518 g005
Figure 6. Schematic illustration of the three-dimensional box-counting method for fractal dimension calculation.
Fractalfract 09 00518 g006
Figure 7. Flowchart of mechanical parameter and Weibull modulus determination for minerals.
Fractalfract 09 00518 g007
Figure 8. Digital core numerical models: (a) WM1. (b) WM2. (c) WM3. (d) WM4.
Fractalfract 09 00518 g008
Figure 9. Surface crack propagation process of the samples: (a) WM1. (b) WM2. (c) WM3. (d) WM4.
Fractalfract 09 00518 g009
Figure 10. Variation in stress and damage variable with axial strain.
Fractalfract 09 00518 g010
Figure 11. Curves of AE counts: (a) WM1. (b) WM2. (c) WM3. (d) WM4.
Fractalfract 09 00518 g011
Figure 12. Crack morphology: (a) WM1. (b) WM2. (c) WM3. (d) WM4.
Fractalfract 09 00518 g012
Figure 13. The relationship between tensile strength and organic matter: (a) volume fraction; (b) fractal dimension.
Fractalfract 09 00518 g013
Figure 14. The relationship between the damage variable and organic matter: (a) volume fraction; (b) fractal dimension.
Fractalfract 09 00518 g014
Figure 15. The relationship between the unit damage variable and organic matter: (a) volume fraction; (b) fractal dimension.
Fractalfract 09 00518 g015
Figure 16. Comparison of dynamic changes in failure rate of mineral particles.
Fractalfract 09 00518 g016
Figure 17. Final failure rate of mineral particles: (a) mineral failure rate; (b) mineral failure percentage.
Fractalfract 09 00518 g017
Figure 18. Crack propagation characteristics of shale samples under tensile forces. (a) SEM image showing crack propagation around silicate mineral grains; (b) SEM image showing cracks at the interface between clay matrix and organic matter; (c) Mineral distribution map in Region 1; (d) Mineral distribution map in Region 2; (e) Simulated crack path in Region 1; (f) Simulated crack path in Region 2.
Fractalfract 09 00518 g018
Table 1. Volume fraction and fractal dimension of minerals in shale samples.
Model No.VSiDSiVOMDOMVClDCl
WM12.30%1.835.22%2.2392.43%2.32
WM20.83%1.876.82%2.2292.35%1.92
WM31.24%1.8919.47%2.3979.27%2.43
WM412.24%2.2744.80%2.5642.87%2.59
Table 2. Mechanical parameters of mineral materials.
Mineral TypeSilicate MineralClay MineralOrganic Matter
Heterogeneity coefficient of elastic modulus9.436.092.15
Elastic modulus (Gpa)95.4935.868.05
Heterogeneity coefficient of uniaxial compressive strength9.731.732.09
Uniaxial compressive strength (Mpa)507.68143.8594.48
Poisson’s ratio0.070.340.14
Disclaimer/Publisher’s Note: The statements, opinions and data contained in all publications are solely those of the individual author(s) and contributor(s) and not of MDPI and/or the editor(s). MDPI and/or the editor(s) disclaim responsibility for any injury to people or property resulting from any ideas, methods, instructions or products referred to in the content.