Article

The Thermoelastic Component of the Photoacoustic Response in a 3D-Printed Polyamide Coated with Pigment Dye: A Two-Layer Model Incorporating Fractional Heat Conduction Theories

1
Institute of Physics Belgrade, National Institute of the Republic of Serbia, University of Belgrade, Pregrevica 118, 11080 Belgrade, Serbia
2
“VINČA” Institute of Nuclear Sciences, National Institute of the Republic of Serbia, University of Belgrade, P.O. Box 522, 11000 Belgrade, Serbia
3
Departamento de Física, Universidade Estadual de Maringá, Av. Colombo 5790, Maringá 87020-900, Brazil
4
Departamento de Física, Universidade Estadual de Ponta Grossa, Av. Gen. Carlos Cavalcanti 4748, Ponta Grossa 84030-900, Brazil
*
Authors to whom correspondence should be addressed.
Fractal Fract. 2025, 9(7), 456; https://doi.org/10.3390/fractalfract9070456
Submission received: 30 May 2025 / Revised: 1 July 2025 / Accepted: 10 July 2025 / Published: 12 July 2025

Abstract

This study presents a theoretical model for the thermoelastic response in transmission-mode photoacoustic systems that feature a two-layer structure. The model incorporates volumetric optical absorption in both layers and is based on classical heat conduction theory, hyperbolic generalized heat conduction theory, and fractional heat conduction models including inertial memory in Generalizations of the Cattaneo Equation (GCEI, GCEII, and GCEIII). To validate the model, comparisons were made with the existing literature models. Using the proposed model, the thermoelastic photoacoustic response of a two-layer system composed of a 3D-printed porous polyamide (PA12) substrate coated with a thin, highly absorptive protective dye layer is analyzed. We obtain that the thickness and thermal conduction in properties of the coating are very important in influencing the thermoelastic component and should not be overlooked. Furthermore, the thermoelastic component is affected by the selected fractional model—whether it is subdiffusion or superdiffusion—along with the value of the order of the fractional derivative, as well as the optical absorption coefficient of the layer being investigated. Additionally, it is concluded that the phase has a greater impact than the amplitude when selecting the appropriate theoretical heat conduction model.

1. Introduction

Materials that are 3D-printed, especially those made from polymers, have become increasingly accessible thanks to rapid advancements in additive manufacturing technologies such as fused deposition modeling (FDM), stereolithography (SLA), and selective laser sintering (SLS). These techniques allow for the creation of complex geometries that are challenging or impossible to achieve with traditional manufacturing methods. This capability opens up new possibilities in fields such as biomedicine, electronics, energy systems, and mechanical engineering [1].
Among the various classes of polymers, 3D-printed polyamides—such as PA6, PA11, and PA12—have garnered significant attention for their mechanical strength, chemical resistance, and adaptability to specific functional requirements. These materials are extensively used in the production of industrial parts, medical devices, automotive and aerospace components, solar panels, and a wide range of consumer products [2,3,4]. Additive manufacturing provides a significant advantage in quickly producing prototypes, facilitating efficient iterative design and reducing material waste. It also enables the creation of complex, customized structures with optimized material utilization. Although the intrinsic porosity of 3D-printed polymer structures is often viewed as a drawback, it can be functional for specific applications. The size and distribution of pores significantly impact the material’s mechanical, thermal, and optical properties, which depend on factors such as printing technology, processing parameters (including temperature and speed), and the properties of the raw material, particularly in the case of polyamide sintering [4]. To customize the properties of these materials for engineering applications, it is crucial to use experimental methods that can simultaneously characterize multiple physical parameters. In this regard, photoacoustic spectroscopy has become a valuable non-destructive technique for simultaneously analyzing optical, thermal, and elastic properties.
Photoacoustic methods, developed and refined over nearly fifty years, are increasingly used to characterize a wide range of materials and structures [5,6,7]. These techniques utilize an excitation optical beam to generate a detectable signal. When the laser interacts with the sample, it heats the material, creating a thermal flux that propagates heat through the sample and its surroundings, resulting in a thermal wave [8]. This thermal wave causes pressure fluctuations in the surrounding gas (the photoacoustic signal), which are influenced by the sample’s optical, thermal, elastic, electronic, and other physical properties [9,10,11,12]. The experimental photoacoustic signal strongly depends on the underlying physical model, requiring an accurate theoretical representation of the involved processes. Developing a model that links the signal to the optical excitation (forward problem) is essential for solving the inverse problem and retrieving the material’s physical properties [13].
Laser-sintered polymeric materials typically exhibit a low optical absorption coefficient, which necessitates the application of a thin optical coating for photothermal and photoacoustic measurements. This can be achieved either by depositing a thin layer of a material with a high optical absorption coefficient or by modifying the surface to enhance photothermal efficiency and improve the signal-to-noise ratio. Additionally, such modifications help protect the detector from the excitation beam in transmission-mode configurations [14,15]. When the measurement is performed with the coating or modified surface facing the excitation beam, information on the optical properties of the laser-sintered material is lost in the detected signal. However, if the laser-sintered material itself is illuminated, the coating serves to enhance photothermal efficiency, shield the detector, and preserve the information on the optical properties of the bulk material in the measured signal. To solve the inverse photothermal problem in such a configuration, it is necessary to develop a model of the temperature distribution and thermoelastic (TE) bending for a bilayer sample.
Previous studies have proposed models of optically induced temperature distributions, thermal moments, and thermoelastic displacements for optically opaque bilayer samples, based on classical heat conduction theory [16], and generalized theories, which account for anomalous diffusion and thermal wave effects but do not consider the influence of distributed heat sources resulting from the low optical absorption coefficient of the illuminated layer [17]. In addition, models that have been developed for temperature distribution and thermoelastic displacement in optically transparent bilayer samples, which allow an analysis of the impact of spatially distributed heat sources on the thermal moment, have been developed only based on hyperbolic heat conduction theory that incorporates wave-like non-Fourier effects, but neglect anomalous diffusion phenomena in thermal transport [18,19]. Given the porous nature of laser-sintered samples, these effects are likely to arise from the fractal distribution of pores. Additionally, photoacoustic measurements of laser-sintered polymer materials show deviations, especially at the extremes of the measurement range, compared to classical model predictions. These discrepancies may stem from detector influences but also from the limitations of the current models.
This work develops a model for the thermoelastic component of the transmission-mode frequency-domain photoacoustic response by considering the optical coefficient absorption in a bilayer sample composed of high structural entropy materials, typical of laser-sintered systems. The goal is to explore how structural entropy influences the photoacoustic signal and to evaluate the potential of frequency-domain photoacoustic techniques for analyzing material properties related to how internal structural disorder affects the propagation of electromagnetic, thermal, and elastic waves in these complex structures.
Section 2 presents the mathematical model for the thermoelastic component of the photoacoustic response in a two-layer structure, where both layers absorb incident radiation. The adoption of fractional heat conduction models in this study is justified by theoretical and experimental evidence indicating the limitations of classical and hyperbolic formulations in representing thermal transport in structurally complex media. As established in prior works [20,21], fractional-order models offer a more accurate framework by accounting for memory effects, nonlocality, and anomalous diffusion phenomena associated with heterogeneities, fractal structures, and dynamic disorder. Section 3 analyzes effects of anomalous diffusion and optical transparence of illuminated layer on the thermoelastic component for a specific two-layer structure consisting of laser-sintered PA12 as the first layer and a thin black protective coating as the second layer. The two-layer models are also compared to the single-layer model for the thermoelastic component that consider only the influence of the optical opacity of the non-illuminated coating discussed in paper [22]. The most important conclusions are given in Section 4.

2. Theory

The thermoelastic response of a two-layer sample containing materials with optical volume absorption is investigated in this study. To tackle this problem, it is crucial to understand, firstly, how temperature variations are distributed within the two-layer sample. In reference [18], a model for the dynamic temperature distribution in a sample composed of two layers of optically transparent materials has been developed using the hyperbolic generalized theory. However, there is currently no model that applies classical heat conduction theory or fractional heat conduction theories to this scenario.
This section starts with a discussion on fractional thermal diffusion. It then examines temperature variations in a two-layer sample by utilizing classical heat conduction theory, hyperbolic heat conduction theory, and all three fractional heat conduction theories. Finally, a model is introduced for the thermoelastic component of the photoacoustic response for a two-layer system that incorporates the volume absorption of the incident radiation based on all five theories

2.1. Fractional Thermal Diffusion

Fractional diffusion is used to describe the transfer of mass or energy in materials with high structural entropy (disorder) and porous media or materials with heterogeneities on the meso- or microscale [23,24,25,26,27]. In such systems, the non-Fickian movement of particles has been experimentally observed [28,29,30,31,32]. In addition, the classical Fourier heat diffusion equation fails to accurately reproduce experimentally observed temperature and thermoelastic variations, especially in photothermal and photoacoustic measurements.
Two basic fractional diffusion models derived from probabilistic considerations of continuous-time random walks (CTRWs) are (1) the subdiffusive model that employs fractional derivatives with respect to time [33,34,35,36] and can be associated with the system’s memory in thermodynamic phase space so called kinetic memory [37] and (2) the superdiffusive model that involves fractional spatial derivatives that describe long-range jumps in energy transport across structurally disordered domains [35,38].
However, neither of these probabilistic models accounts for possible inertial memory effects and non-Fourier or non-Fickian behaviors [39,40,41]. Specifically, the linear relation between the temperature gradient as a thermodynamic force and the heat flux neglects the inertia of heat carriers. This leads to non-physical results, namely, a model that predicts an infinite speed of thermal perturbation propagation. Several authors have addressed this limitation by introducing models that incorporate memory effects and anomalous diffusion, including hyperbolic models that ensure finite thermal wave propagation speed [42,43,44], and approaches that highlight the influence of thermal memory on the dynamics of heat transport through the generation of thermal waves [45,46,47,48].
The effect of finite thermal propagation speed was experimentally observed as early as the 1940s in studies at extremely low temperatures (near absolute zero) [49] and was theoretically explained by the famous Russian physicist Landau as the phenomenon of second sound [50]. Later laser-heating experiments on crystalline materials [51,52,53] confirmed Landau’s insight: if relaxation times of specific subsystems exceed the characteristic timescale for the system to reach equilibrium with the environment [54,55,56], which is typical for substances at cryogenic temperatures [57] or highly disordered systems [58] at room temperatures, then a wave-like model of heat propagation becomes necessary.
Building on Landau’s undamped wave model for second sound, Cattaneo [59] and Vernotte [60], independently, proposed a hyperbolic damped wave model of heat propagation, which has recently been applied in photothermal experiments to measure the thermal propagation speed in 2D materials [61,62]. However, this model neglects anomalous diffusion effects, which have also been experimentally observed in materials with high structural entropy.
The development of probabilistic models that incorporate both inertial and kinetic memory is still an active field of research. However, phenomenological models, that include both types of memory, have been proposed [39]. These models are known as the generalized fractional Cattaneo equations (referred to as GCEI, GCEII, and GCEIII). These equations extend classical hyperbolic models by incorporating fractional time derivatives [39], thereby allowing for the simultaneous modeling of inertial memory effects and kinetic memory effects. In this context, kinetic memory is related to anomalous diffusion and long-term statistical correlations in the motion of thermal carriers, while inertial memory describes the delayed thermal flux response resulting from the finite relaxation times of energy or mass carriers [25,40]. These two types of memory represent fundamentally different physical origins of non-locality in time, and their combined effect is captured in generalized fractional hyperbolic models.
An analysis of the proposed models has shown that GCEI and GCEIII can describe subdiffusive transport with inertial memory, while GCEII describes superdiffusive transport incorporating inertial memory effects [39]. To date, experimental results have not favored one of these three models over the others, so all three are commonly employed in studies, particularly for modeling photothermal and photoacoustic measurements [17,21,63,64].
The optically induced temperature distribution in a sample, under 1D approximation based on each model, is described by the generalized balanced energy and Fourier law equations, respectively, as follows:
GCEI
2 ϑ ( x , t ) x 2 1 D T ν ν ϑ x , t t ν τ ν D T ν 2 ν ϑ x , t t 2 ν = 1   k ν S x , t + τ ν ν S x , t t ν , q ( x , t ) + τ ν ν q x , t t ν = k ν ϑ x , t x ,
GCEII
2 ϑ ( x , t ) x 2 1 D T ν 2 ν ϑ x , t t 2 ν τ ν D T ν 2 ϑ x , t t 2 = 1 k ν S x , t + τ ν ν S x , t t ν , q ( x , t ) + τ ν ν q x , t t ν = k ν ν 1 t ν 1 ϑ x , t x ,
GCEIII
1 ν t 1 ν 2 ϑ ( x , t ) x 2 1 D T ν ϑ x , t t τ D T ν 2 ϑ x , t t 2 = 1 k ν S x , t + τ ν ν S x , t t ν , q ( x , t ) + τ q x , t t = k ν ϑ x , t x ,
where ϑ x , t and q x , t signify time-varying components of the temperature distribution and heat flux, respectively. The temperature distribution and heat flux caused by the heat sources can be expressed by T x , t = T a m b + θ x + ϑ ( x , t ) , measured in [K], and Q x , t = q x x + q ( x , t ) , in [Wm−2]. Symbol Tamb represents ambient temperature, while θ(x) and qx(x) denote steady components. Owing to the linearity of the differential equations in the model, the steady and dynamic components of temperature distribution can be determined independently. The dynamic aspect of temperature distribution is crucial for the photoacoustic response; therefore, we will concentrate solely on dynamic equations.
The sample’s volumetric heat generation rate, S ( x , t ) , measured in [W/m3], represents the production of heat sources, also known as thermalization, and can be obtained by the expression S x , t = η I i ( x , t ) x , with I i ( x , t ) representing the intensity of the light beam. Here, η represents the quantum mechanical coefficient of the electromagnetic energy-to-heat conversion that is usually considered as unity [17,18].
In previous equations, D T ν represented the thermal diffusivity with dimensions [m2/sν] for the GCEI and GCEIII models and [m2/s2−ν] for GCEII model, while k ν denotes the thermal conductivity with dimensions [J/(m·K·sν)] for the GCEI and GCEIII models and [J/(m·K s2−ν)] for the GCEII model. Additionally, τ i represents the thermal relaxation time in seconds [s], and ν refers to the fractional order with   ν 0 ,   1 .
Fractional derivatives, in the Caputo or Riemann–Liouville sense [65,66,67], are utilized to describe thermal transport behavior. The Riemann–Liouville and Caputo formulations differ in their treatment of initial conditions. The Caputo definition is often favored in physics because it naturally incorporates initial conditions. In frequency-domain photothermal experiments, the sample is excited by a sinusoidally modulated wave I x , t = I x c o s ( w t ) [17,18,22,68], and the system’s stationary-state response at the modulation frequency is measured using lock-in detection. Since transient processes are already excluded in this context, the distinction between different definitions becomes largely irrelevant. Therefore, we used the Riemann–Liouville definition of the fractional differintegral:
ν f ( x , t ) t ν = 1 Γ ( 1 ν ) t 0 t f ( x , t ) ( t t ) ν d t 0 < ν < 1 1 Γ ( ν ) t 0 t f ( x , t ) ( t t ) 1 + ν d t ν < 0 ,
where Γ 1 ν and Γ ν are the Euler Gamma functions.
In our analysis, the problem was treated by introducing complex representatives of excitation heat flux, temperature, and heat flux:
S ( x , t ) = Re S ( x ) e j ω t , ϑ x , t = Re ϑ ~ ( x ) e j ω t , q ( x , t ) = Re q ~ ( x ) e j ω t ,
where
ϑ ~ = ϑ j ω , q ~ = q j ω .
The tilde represents the complex parameter; the variable ω, defined as ω = 2πf, indicates the circular frequency in radians per second (rad/s), where f is the modulation frequency in hertz (Hz), and j is the imaginary unit.
Knowing this, fractional time derivatives can be described by complexes represented as
  ν ϑ ( x , t ) t ν = R e { ( j ω ) ν ϑ ~ x e j ω t } , ν q ( x , t ) t ν = R e { ( j ω ) ν q ~ x e j ω t } ,
The system of partial differential equations for each GCE’s theory, Equations (1)–(3), is reduced to a system of ordinary differential equations:
d 2 ϑ ~ ( x ) d x 2 σ ~ 2 ϑ ~ ( x ) = σ ~ z ~ c S ~ ( x ) , q ~ ( x ) = 1 σ ~ z ~ c d ϑ ~ ( x ) d x     .
The parameters σ ~ and z ~ c denote the complex coefficients of thermal wave propagation [m−1] and the complex thermal impedance of the medium [K·m2/W], respectively. These parameters depend on the heat conduction theory used in the model. Unlike most previous studies that overlook structural entropy or focus solely on non-Fourier effects [18,65,69], this work fully incorporates the impact of structural entropy on both the optical absorption coefficient and heat conduction through the heat propagation coefficient, σ ~ , and the thermal impedance,   z ~ c . The parameters for various models are as follows [17,40]:
GCEI model
σ ~ = 1 D T ν j ω ν ( 1 + ( j ω τ ) ν ) , z ~ c = D T ν k ν 1 + ( j ω τ ) ν ( j ω ) ν ,
GCEII model
σ ~ = 1 D T ν j ω 2 ν ( 1 + ( j ω τ ) ν ) , z ~ c = D T ν k ν 1 + ( j ω τ ) ν ( j ω ) ν ,
GCEIII model
σ ~ = 1 D T ν j ω ν ( 1 + j ω τ ) , z ~ c = D T ν k ν 1 + j ω τ ( j ω ) 2 ν       .
These two parameters in classical and hyperbolic heat conduction theories are given by the following [46]:
Classical model
σ ~ = 1 D T j ω , z ~ c = D T k 1 j ω ,
Hyperbolic model
σ ~ = 1 D T j ω ( 1 + j ω τ ) , z ~ c = D T k 1 + j ω τ j ω .

2.2. Temperature Variations

This section of Part 2 develops the temperature distribution model for the two-layer structure illustrated in Figure 1a, encompassing all five theories.
The following assumptions are adopted based on the typical configuration of frequency-domain photoacoustic experiments (see Figure 1a):
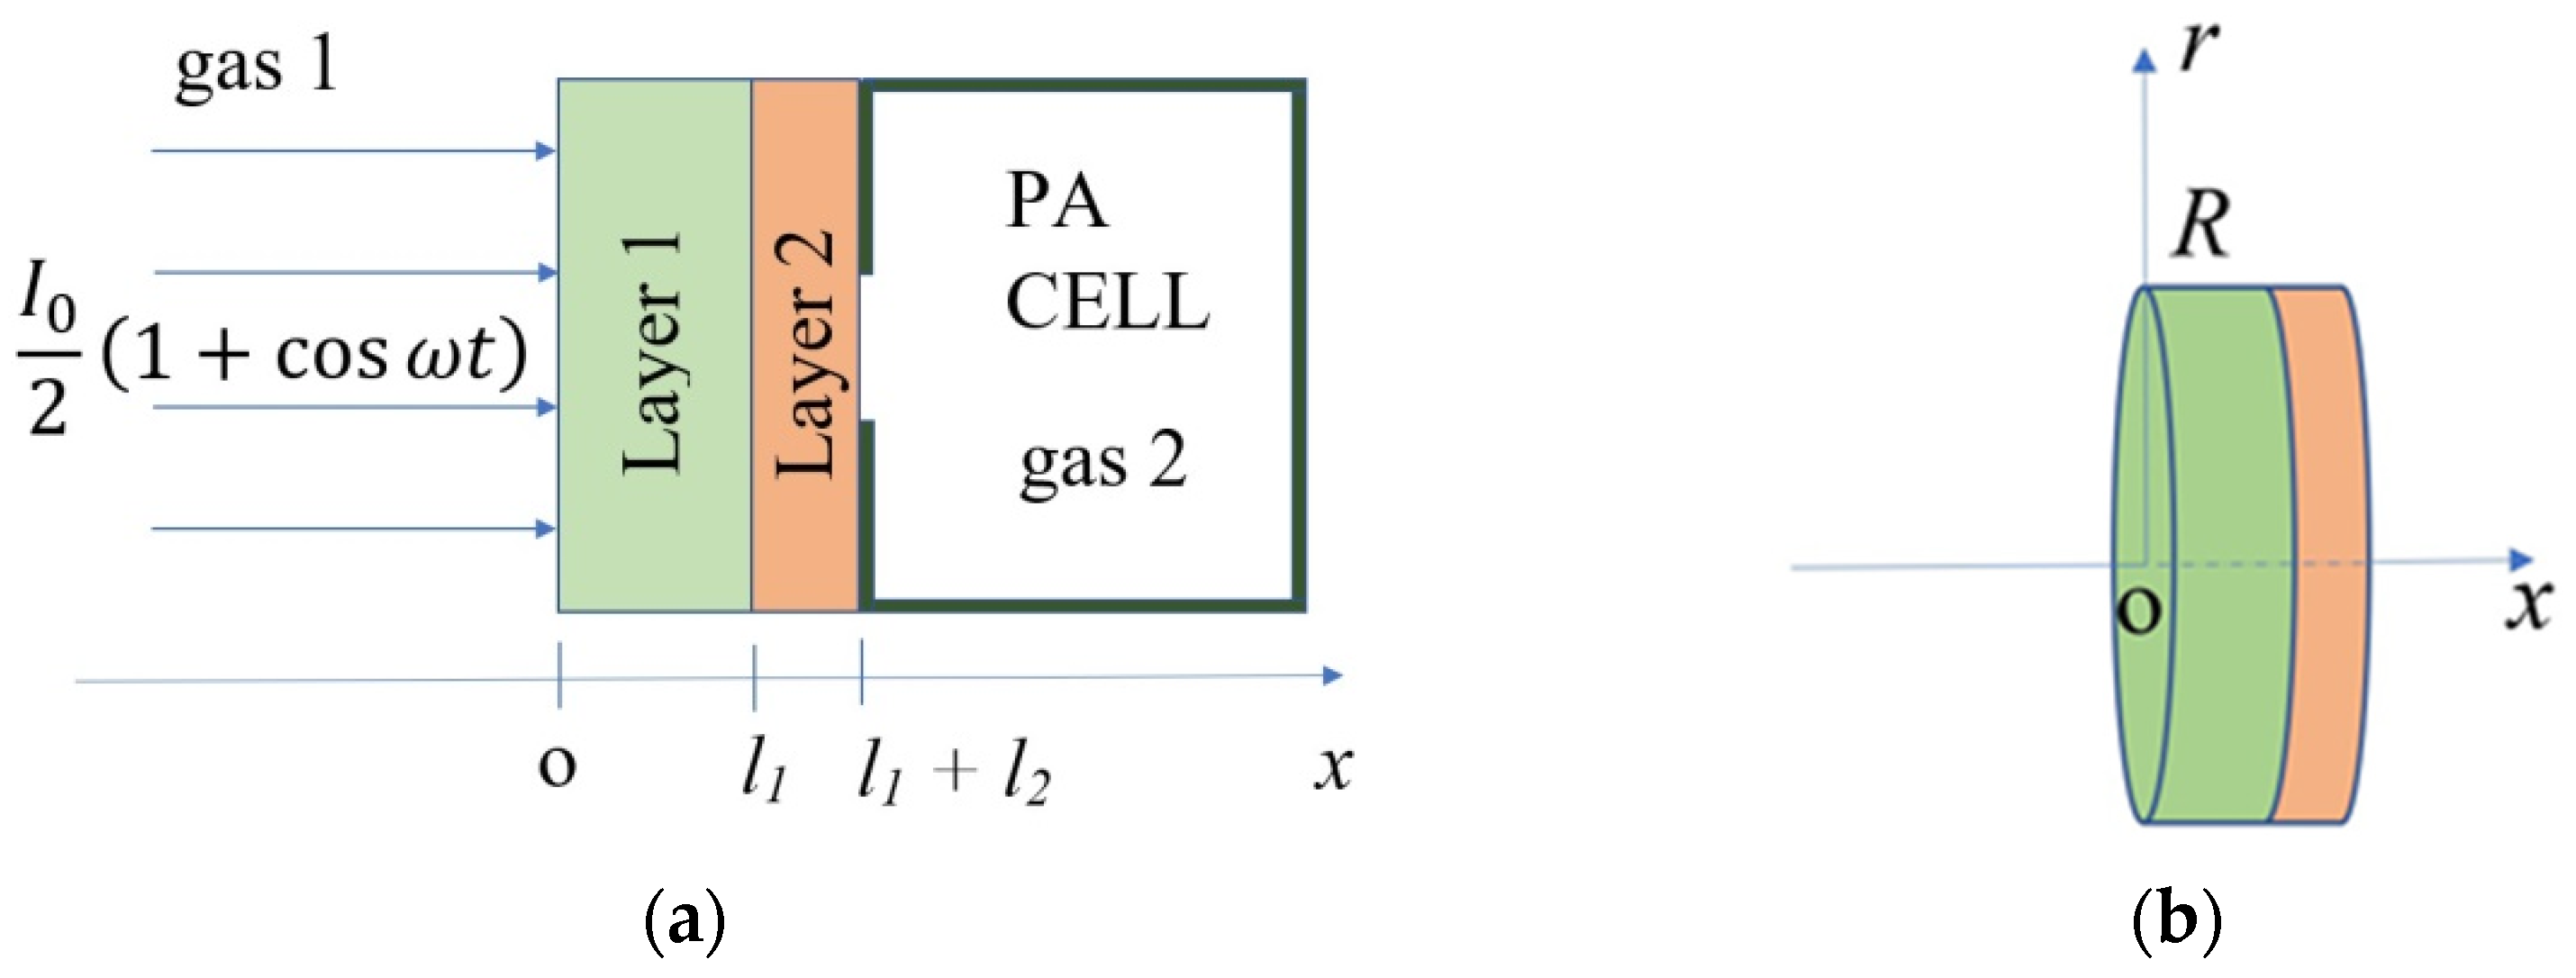
  • One-dimensional spatial approximation: The sample is uniformly illuminated over its surface, and the lateral dimensions are significantly larger than the thermal diffusion length in the modulation frequency range. This justifies the use of a one-dimensional geometry along the axis perpendicular to the surface, as commonly employed in photoacoustic modeling [8,9,15,70].
  • Sinusoidal optical modulation and lock-in detection: The excitation source is modulated sinusoidally in time, and the resulting acoustic signal is recorded using a lock-in amplifier. Consequently, all physical quantities of interest—such as temperature, displacement, and pressure—are represented in the frequency domain using their spectral counterparts.
Under these conditions, we present an analytical expression for the temperature distribution, building upon the general two-layer model that considers the following:
  • Volumetric optical absorption in both layers, as opposed to the more commonly assumed surface absorption scenario [17,71,72,73,74]. This extension is crucial for describing polymeric or composite materials with structural disorder. The absorbed irradiance is calculated using Beer–Lambert’s law of absorption, I x = I 0 2 ( 1 R i ) e β i x , where I0 is the incident radiation’s peak intensity in [W/m2], β i is the optical absorption coefficient in [1/m], and R i is the optical reflection coefficient.
  • The absence of absorption and heat conduction in the surrounding gas—Air is regarded as completely transparent, meaning it does not absorb incoming optical radiation and, as a result, does not generate heat sources. This property enables all incoming radiation to reach the first layer. Additionally, air is known to be a poor conductor of heat, which is why we apply adiabatic boundary conditions [18,69].
  • Finite-speed heat propagation, included through the framework of generalized thermoelastic wave propagation theories (GTE), such as the Lord–Shulman theory [75], but neglecting feedback effects of heat flux propagation on the temperature distribution [9].
  • The incorporation of anomalous diffusion effects via generalized Cattaneo equation (GCE) models—specifically GCEI, GCEII, and GCEIII—which allow for structural heterogeneity and memory effects in heat transport, both of which are relevant in polymeric systems with high entropy and fractal structures [17,37,39,40,64,76].
Based on the above assumptions and the theoretical description of anomalous heat transfer, including inertial memory in an optically excited sample corresponding to the geometry in Figure 1a, the heat conduction equation and the constitutive equation are formulated as follows:
d 2 ϑ ~ ( x ) d x 2 σ ~ i 2 ϑ ~ ( x ) = σ ~ i z ~ c i S i ( x ) , q ~ ( x ) = 1 σ ~ i z ~ c i d ϑ ~ ( x ) d x     .
Index i = 1, 2, where 1 and 2 refer to layer 1 and layer 2, respectively (see Figure 1a). The parameters σ ~ i and z ~ c i are provided by Expressions (9)–(13) for each theory: classical heat conduction, hyperbolic, GCEI, GCEII, and GCEIII. The heat sources for each domain are defined as follows:
S 1 x = S 01 β 1 e β 1 x ,     S 01 = I 0 2 η 1 R 1 ,
S 2 x = S 02 β 2 e β 1 l 1 e β 2 x l 1 ,     S 02 = I 0 2 η 1 R 1 1 R 2 ,
By solving this system of equations along with the boundary conditions and conditions at the heterointerfaces, the distribution of temperature variations in both layers can be obtained. We have assumed adiabatic boundary conditions (17) and the continuity of the temperature variations and the thermal flux at the heterointerface (18):
q ~ 0 = 0 , q ~ l 1 + l 2 = 0 ,
ϑ ~ l 1 = ϑ ~ l 1 + , q ~ l 1 = q ~ l 1 + .
In paper [18], a comprehensive derivation of the system of equations is presented, beginning with the hyperbolic generalized heat conduction equation and the relevant constitutive relation. By introducing complex coefficients for thermal wave propagation and complex thermal impedance specific to each heat conduction theory, the solutions obtained based on one theory can be further extended to include the other four theories.
The temperature distribution in layer one is described by Expressions (19) and (21), while that in layer two is described by Expressions (20) and (21).
For x 0 , l 1 :
ϑ ~ x = A ~ 1 e σ ~ 1 x + A ~ 2 e σ ~ 1 x + S 01 z ~ c 1 σ ~ 1 β 1 σ ~ 1 2 β 1 2 e β 1 x , A ~ 1 = U ~ 1 sinh a ~ 2 + z ~ c 1 U ~ 2 sinh a ~ 2 r ~ z cosh a ~ 2 e a ~ 1 z ~ c 2 U ~ 3 cosh a ~ 2 z ~ c 2 U ~ 4 2 ( r ~ z sinh a ~ 1 cosh a ~ 2 + cosh a ~ 1 sinh a ~ 2 ) , A ~ 2 = U ~ 1 sinh a ~ 2 z ~ c 1 U ~ 2 sinh a ~ 2 + r ~ z cosh a ~ 2 e a ~ 1 z ~ c 2 U ~ 3 cosh a ~ 2 z ~ c 2 U ~ 4 2 ( r ~ z sinh a ~ 1 cosh a ~ 2 + cosh a ~ 1 sinh a ~ 2 ) .
For x l 1 , l 1 + l 2 :
ϑ ~ x = A ~ 3 e σ ~ 2 x l 1 + A ~ 4 e σ ~ 2 x l 1 + S 02 z ~ c 2 σ ~ 2 β 2 σ ~ 2 2 β 2 2 e β 1 l 1 e β 2 x l 1 , A ~ 3 = r ~ z U ~ 1 sinh a ~ 1 e a ~ 2 r ~ z z ~ c 1 U ~ 2 e a ~ 2 z ~ c 2 U ~ 3 cosh a ~ 1 e a ~ 2 z ~ c 2 U ~ 4 r ~ sinh a ~ 1 + cosh a ~ 1 2 ( r ~ z sinh a ~ 1 cosh a ~ 2 + cosh a ~ 1 sinh a ~ 2 ) , A ~ 4 = r ~ z U ~ 1 sinh a ~ 1 e a ~ 2 r ~ z z ~ c 1 U ~ 2 e a ~ 2 z ~ c 2 U ~ 3 cosh a ~ 1 e a ~ 2 + z c 2 U ~ 4 r ~ z sinh a ~ 1 cosh a ~ 1 2 ( r ~ z sinh a ~ 1 cosh a ~ 2 + cosh a ~ 1 sinh a ~ 2 ) .
In the previous expressions, parameters U ~ 1 , U ~ 2 , U ~ 3 , U ~ 4 , a ~ 1 , a ~ 2   and   r ~ z are
U ~ 1 = S 01 z ~ c 1 σ ~ 1 β 1 σ ~ 1 2 β 1 2 e β 1 l 1 + S 02 z ~ c 2 σ ~ 2 β 2 σ ~ 2 2 β 2 2 e β 1 l 1 , U ~ 2 = S 01 β 1 2 σ ~ 1 2 β 1 2 , U ~ 3 = S 01 β 1 2 σ ~ 1 2 β 1 2 e β 1 l 1 + S 02 β 2 2 σ ~ 2 2 β 2 2 e β 1 l 1 , U ~ 4 = S 02 β 2 2 σ ~ 2 2 β 2 2 e β 1 l 1 e β 2 l 2 , a ~ 1 = σ ~ 1 l 1 ,     a ~ 2 = σ ~ 2 l 2 ,     r ~ z = z ~ c 2 z ~ c 1 .

2.3. Thermoelastic Bending Effect

Heat generation leads to elastic deformation, which can be analyzed through the stress–strain relationship and the related equations of motion based on elastic displacement. Rousset, Lepoutre, and Bertrand [9] were the first to describe the theory of elastic bending. A chapter of the book [77] provides a detailed overview of the photoacoustic theory for single-layer semiconductors, which is rooted in classical heat conduction principles. The theoretical framework for opaque bilayered samples, also based on classical principles, is discussed in [16], while the hyperbolic theory is addressed in [17]. The theories of photoacoustic response and thermoelastic components, which consider the volume absorption of incident radiation in both layers of the bilayer structure, are derived solely from hyperbolic heat conduction theory and are explored in Monograph [19].
This section introduces a mathematical model of thermoelastic component theory for a bilayered sample, integrating classical heat conduction theory with the four generalized theories: hyperbolic, GCEI, GCEII, and GCEIII. The model is based on the geometry shown in Figure 1b and incorporates assumptions from the previous section, along with new ones introduced here:
  • A thin circular plate with a thickness of l 1 + l 2 and radius R, displays rotational symmetry around the x-axis, as illustrated in Figure 1b. The azimuthal displacement coordinate u θ can be disregarded [9,16,77]. Positive displacement occurs opposite the x-axis, towards the radiation source.
  • The wavelength of elastic waves is significantly longer than the bilayer sample’s thickness, enabling us to treat the sample as elastic [9,77].
  • It neglects wave-propagation effects in the acoustic field, justified by the assumption of an infinite speed of sound propagation, consistent with prior photoacoustic modeling approaches [9,16,17,22].
  • It is considered that the circular plate is simply supported.
Based on the assumptions outlined above, the equation for thermoelastic bending is
p ~ T E = γ P 0 V 0 2 π 0 R r u ~ x ( r , l 1 + l 2 ) d r ,
u ~ x r , l s = 6 R 2 r 2 l 1 + l 2 3 α T 1 M ~ T 1 l 1 + l 2 2 N ~ T 1 + α T 2 M ~ T 2 l 1 + l 2 2 N ~ T 2 .
From Equations (22) and (23), the following is obtained:
p ~ T E = 3 γ P 0 R 4 R c 2 l g l 1 + l 2 3 α T 1 M ~ T 1 l 1 + l 2 2 N ~ T 1 + α T 2 M ~ T 2 l 1 + l 2 2 N ~ T 2 .
The variables P0 [Pa] and V0 [m3] denote the pressure and volume of the gas in the cell, while γ represents the ratio of heat capacities at constant pressure and volume. The coefficient of linear thermal expansion is α T i [1/K], i = 1,2, and R [m] is the sample radius. l1 and l2 are the first- and second-layer thicknesses, respectively. It is assumed that the gas volume in the cell equals the volume of the microphone cavity in front of the diaphragm, given by V 0 = R c 2 π l g , where R c is the radius of the microphone cavity and l g is its length. MT1, MT2, NT1, and NT2 represent the temperature moments in the illuminated and non-illuminated layers and the mean temperatures (spatially averaged) for the first and second layers, defined by the following expression:
M ~ T 1 = 0 l 1 x ϑ ~ x d x ,     M ~ T 2 = l 1 l 1 + l 2 x ϑ ~ x l 1 d x ,
N ~ T 1 = 0 l 1 ϑ ~ x d x ,     N ~ T 2 = l 1 l 1 + l 2 ϑ ~ x l 1 d x ,
Substituting Expressions (19)–(21) into Equations (25) and (26) and solving Equation (24) results in a frequency-domain model of the thermoelastic component of the photoacoustic signal. This complex model has a nonlinear dependence on the optical absorbance of each layer in the two-layer structure, their classical thermal properties (thermal conductivity (k) and thermal diffusivity ( D T )), linear expansion coefficients ( α T ) and thermal properties associated with the structural entropy of the layers (thermal relaxation time (τ), and the order of the fractional derivative (ν)):
p ~ T E = K α T 1 c ~ 1 2 I ~ m P ~ 1 P ~ 2 + α T 2 d ~ 1 2 I ~ m Q ~ 1 + Q ~ 2 + S 01 z ~ c 1 α T 1 a ~ 1 2 b ~ 1 2 B ~ 1 + S 02 z ~ c 2 α T 2 a ~ 2 2 b ~ 2 2 B ~ 2 ,
P ~ 1 = c ~ 2 2 sinh a ~ 1 + 1 cosh a ~ 1 U ~ 1 sinh a ~ 2 + z ~ c 2 U ~ 3 cosh a ~ 2 + z ~ c 2 U ~ 4 ,
P ~ 2 = c ~ 2 2 + c ~ 1 2 cosh a ~ 1 sinh a ~ 1 sinh a ~ 2 + c ~ 1 2 sinh a ~ 1 + 1 cosh a ~ 1 r ~ z cosh a ~ 2 z ~ c 1 U ~ 2 ,
Q ~ 1 = d ~ 2 2 sinh a ~ 2 1 + cosh a ~ 2 r ~ z U ~ 1 sinh a ~ 1 + z ~ c 2 U ~ 3 cosh a ~ 1 + z ~ c 2 U ~ 2 ,
Q ~ 2 = d ~ 2 2 + d ~ 1 2 cosh a ~ 2 sinh a ~ 2 r ~ z sinh a ~ 1 + d ~ 1 2 sinh a ~ 2 1 + cosh a ~ 2 cosh a ~ 1 z ~ c 2 U ~ 4 ,
I ~ m = r ~ z sinh a ~ 1 cosh a ~ 2 + cosh a ~ 1 sinh a ~ 2 ,
B ~ 1 = c ~ 2 2 e b 1 + c ~ 1 2 + a ~ 1 b 1 e b 1 a ~ 1 b 1 ,
B ~ 2 = d ~ 1 2 e b 2 d ~ 2 2 + a ~ 2 b 2 e b 2 a ~ 2 b 2 ,
b 1 = β 1 l 1 ,     b 2 = β 2 l 2 , c ~ 1 = σ ~ 1 l 1 + l 2 ,       c ~ 2 = σ ~ 1 l 1 l 2 , d ~ 1 = σ ~ 2 l 1 + l 2 ,       d ~ 2 = σ ~ 2 l 1 l 2 ,
K = 3 γ P 0 R 4 R c 2 l g ( l 1 + l 2 ) .
This model has been validated against three established models:
  • A two-layer model utilizing generalized heat conduction theories with an infinite optical absorption coefficient for the first layer [17]—corresponding to β 1 in our model. This model was developed to describe optically opaque bilayer structures, which commonly arise in photoacoustic investigations of materials with high reflectivity. In such cases, a thin coating is applied to the sample surface to reduce optical reflection, and the sample is oriented during measurement so that the coating is illuminated. This coating typically has a very high optical absorption coefficient, ensuring that the entire incident electromagnetic energy is absorbed within a very thin surface layer—effectively at the very surface of the sample—since the optical absorption parameter β 1 l 1 1 .
  • A two-layer model based on classical heat conduction theory for opaque layers [16]—aligning with β 1 and τ 1 = τ 2 = 0 in our model. Similarly to the previous case, this model was developed for optically opaque bilayer samples, in which the illuminated layer exhibits a very high optical absorption coefficient, such that β 1 l 1 1 . However, in contrast to the previously described model, the classical model A Priori neglects the possible presence of anomalous diffusion effects and the finite speed of heat propagation.
  • A single-layer model from hyperbolic heat conduction theory, that incorporates volumetric absorption of incident radiation and a coating on the unilluminated side (the microphone side) [22]—corresponding to β 2 and l 2 0 in the derived model. This model was developed to enable photoacoustic measurements of optically transparent or semi-transparent samples in a way that allows the determination of the sample’s optical absorption coefficient, regardless of how low it may be. In such cases, a thin coating with a very high optical absorption coefficient is applied to the transparent or semi-transparent sample, and the measurement configuration is such that this highly absorbing coating is illuminated. In this model, the possible presence of anomalous thermal diffusion in the optically transparent layer is neglected, as is the contribution of heat conduction through the coating, i.e., the coating is considered solely as an optical layer.
Based on the above considerations, it can be concluded that the model developed in this work is the most general one, encompassing all previously discussed, analyzed, and applied models of the thermoelastic component of the photoacoustic signal as special cases to which the derived model can be reduced.

3. Results

Before presenting the graphical results for a specific bilayer sample consisting of a porous 3D-printed polyamide layer and a thin coating with a high optical absorption coefficient, let us briefly discuss the influence of anomalous diffusion—described by the fractional derivative order in our equations—on the nature of optically induced heat propagation.

3.1. Analysis of Anomalous Diffusion Effects

By comparing Expressions (9)–(11) with Expressions (12) derived from the classical Fourier theory of heat conduction, and with Expressions (13) derived from the hyperbolic (Cattaneo) theory, the following conclusions can be drawn.
When the order of fractional derivative ν = 1 , all three generalized fractional conduction theories are reduced to the hyperbolic theory. In this case, the thermal diffusion coefficient and thermal impedance predicted by the GCE models coincide with those predicted by the hyperbolic model but differ from those obtained from the classical theory. From a physical perspective, this is due to the fact that the classical model neglects the finite speed of heat propagation and the wave-like nature of the process and therefore cannot account for non-Fourier effects that can be significant in media with high structural entropy. In contrast, both the hyperbolic and the generalized fractional models account for these effects, so phenomena such as reflection and interference of thermal waves can be expected to affect the temperature distribution and, consequently, the thermoelastic bending of the sample—particularly at high modulation frequencies. At such frequencies, the models predict a non-zero thermal impedance and a thermal wavelength smaller than the sample thickness.
On the other hand, if the thermal relaxation time is assumed to be zero and the fractional derivative order ν = 1 , all models—including the generalized fractional, hyperbolic, and classical—reduce to the classical Fourier theory. In other words, if the relaxation time is small, the thermal propagation speed becomes very large, and its influence can be neglected except at very high modulation frequencies. However, if thermal relaxation is neglected while anomalous diffusion effects described by the fractional derivative order ν are retained, then the classical and hyperbolic models predict the same diffusion coefficient and thermal impedance, whereas the fractional models predict qualitatively different behavior of the thermal waves.
The GCEI model with ν < 1 predicts equal real and imaginary parts of the complex thermal diffusion coefficient, both smaller than those of the classical model. This implies a longer thermal diffusion length at a given modulation frequency compared to the classical case and a larger thermal impedance—indicating subdiffusive heat transport (i.e., slower heat propagation than classical diffusion). Therefore, this model is expected to yield a different temperature distribution across the frequency range and, consequently, a different frequency response of the thermoelastic component of the photoacoustic signal.
The GCEIII model predicts the same thermal diffusion coefficient as the GCEI model but a lower thermal impedance than both the GCEI and classical models. This implies that the frequency response of the TE component of the photoacoustic signal, as predicted by GCEIII, will differ from that predicted by GCEI, despite both being subdiffusive.
In contrast, the GCEII model predicts equal real and imaginary parts of the thermal diffusion coefficient but larger ones than those in the classical and subdiffusive GCE models. It also predicts a lower thermal impedance than the GCEI and classical models but equal to that of GCEIII. As a result, superdiffusive heat transport (faster than classical diffusion) and low thermal impedance are expected to influence the frequency characteristics of the thermoelastic component in a complex manner, distinct from those predicted by the other two fractional models and the classical theory.
From this analysis, it can be concluded that anomalous diffusion properties of heat conduction influence the temperature distribution in the optically excited sample in a complex and nonlinear way, indicating a more complex effect on the temperature moment and thermoelastic bending.

3.2. Thermoelastic Component of Photoacoustic Signal for PA12 Coated Sample

This section analyzes the thermoelastic component of the frequency-domain transmission-mode photoacoustic response for a specific bilayer sample. The illuminated layer is laser-sintered PA12, which exhibits structural entropy due to its complex macromolecular architecture and typical laser-sintered pores. As a result, this layer may show a low optical absorption coefficient and limited photothermal conversion efficiency. To effectively characterize such samples with photothermal techniques, applying a thin coating of a material with a high optical absorption coefficient is essential. This coating increases the absorption of electromagnetic energy, enhancing thermal excitation and leading to larger pressure fluctuations, thereby improving the signal-to-noise ratio. Additionally, these coatings protect the microphone membrane from direct exposure to excitation light. In practical experiments, researchers often use thin layers of pigment-based coatings or suspensions that contain metallic or graphene nanoparticles—materials known for their high optical absorption coefficients. These coatings are typically treated as optical layers and are not modeled to influence heat conduction [78].
In this study, we assume that the coating layer does not exhibit non-Fourier or anomalous thermal diffusion effects. However, it may be thick enough to influence the temperature profile, which in turn can affect the bending of the illuminated system and the resulting photoacoustic signal. The mathematical expression in this analysis is derived from the assumption that the optical absorption coefficient of the second layer approaches infinity ( β 2 ) based on the previously derived model (Equations (27)–(36)). It is also assumed that there is no optical reflection ( R 1 = R 2 = 0 ), leading to the condition S 01 = S 02 = S 0 = I 0 2 . In this case, the derived the thermoelastic component of the photoacoustic response is
p ~ T E = K S 0 z ~ c 1 [ α T 1 a ~ 1 2 I m [ c ~ 2 2 sinh a ~ 1 cosh a ~ 1 + 1   a ~ 1 b 1 a ~ 1 2 b 1 2 sinh a ~ 2 r ~ z a ~ 1 2 a ~ 1 2 b 1 2 cosh a ~ 2 e b 1 sinh a ~ 2 c ~ 2 2 + c ~ 1 2 cosh a ~ 1 sinh a ~ 1 + r ~ z cosh a ~ 2 c ~ 1 2 sinh a ~ 1 cosh a ~ 1 + 1 b 1 2 a ~ 1 2 b 1 2 ] α T 2 a ~ 2 2 I m d ~ 2 2 sinh a ~ 2 + cosh a ~ 2 1   r ~ z a ~ 1 b 1 e b 1 a ~ 1 2 b 1 2 sinh a ~ 1 r ~ z b ~ 1 2 a ~ 1 2 b 1 2 + r ~ z a ~ 1 2 e b 1 a ~ 1 2 b 1 2 cosh a ~ 1 + α T 1 a ~ 1 2 b 1 2 c ~ 2 2 e b 1 + c ~ 1 2 + a ~ 1 b 1 e b 1 a ~ 1 b 1 ] .
This analysis investigates how the thickness of the black polymer ink coating and the order of fractional derivatives of PA12 influence the thermoelastic component of the photoacoustic response. While photoacoustic responses are typically measured within the frequency range of 10 Hz to 20 kHz, this study expands the range from 10−2 Hz to 106 Hz to provide a more comprehensive understanding. The film thicknesses examined in this study include 0.1 nm, which is used for theoretical analysis to gain insights into the behavior of the function and to validate the model, as well as 1 µm, which represents the actual thickness of the thin film. This study also considers transparent PA12 samples with absorbance coefficients below 1.5 ( β 1 l 1 < 1.5 ) [79] and whitish (semitransparent to opaque) PA12 samples when absorbance exceeds 1.5 ( β 1 l 1 > 1.5 ) [80]. The objective is to understand the effects of anomalous diffusion in PA12 and the role of a thin protective coating on the recorded signal. Relevant physical parameters for PA12 [81] and the black ink dye [82] are detailed in Table 1. The analysis includes amplitude and phase graphs for all two-layer sample models from Section 2 (classical, hyperbolic, GCEI, GCEII, and GCEIII) and a single-layer model with a coating on the unilluminated side, as outlined in paper [22].

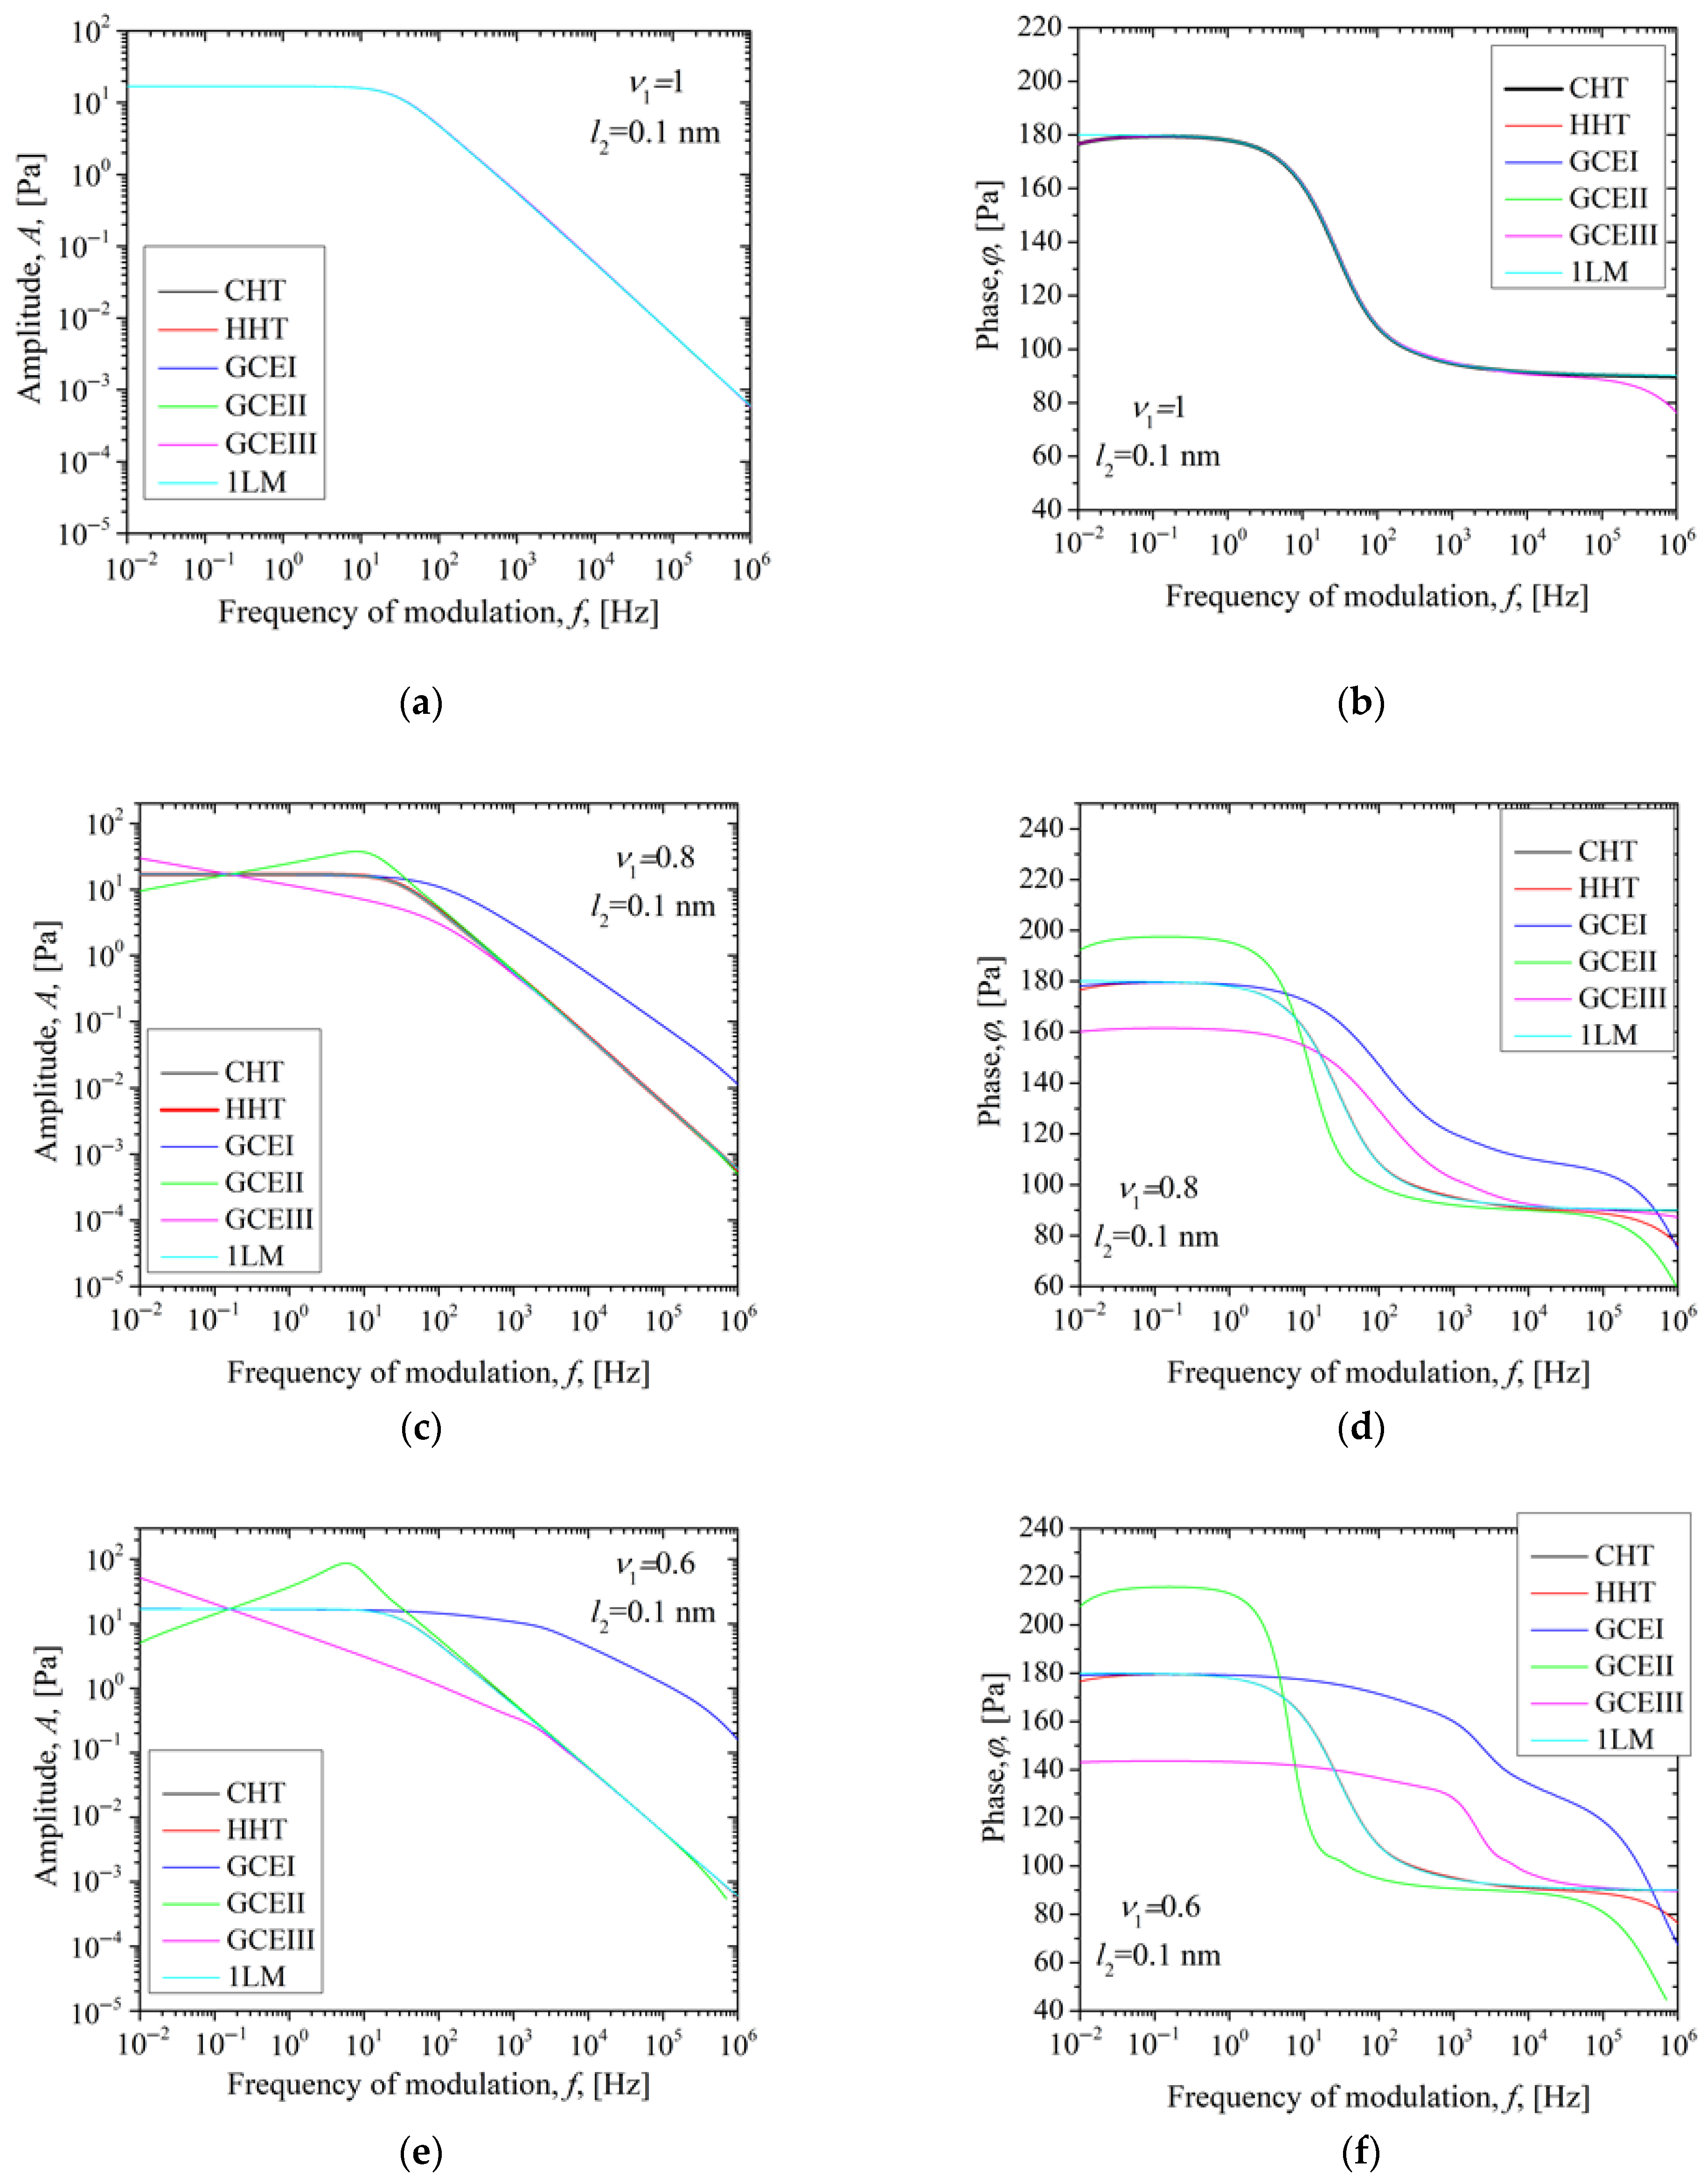
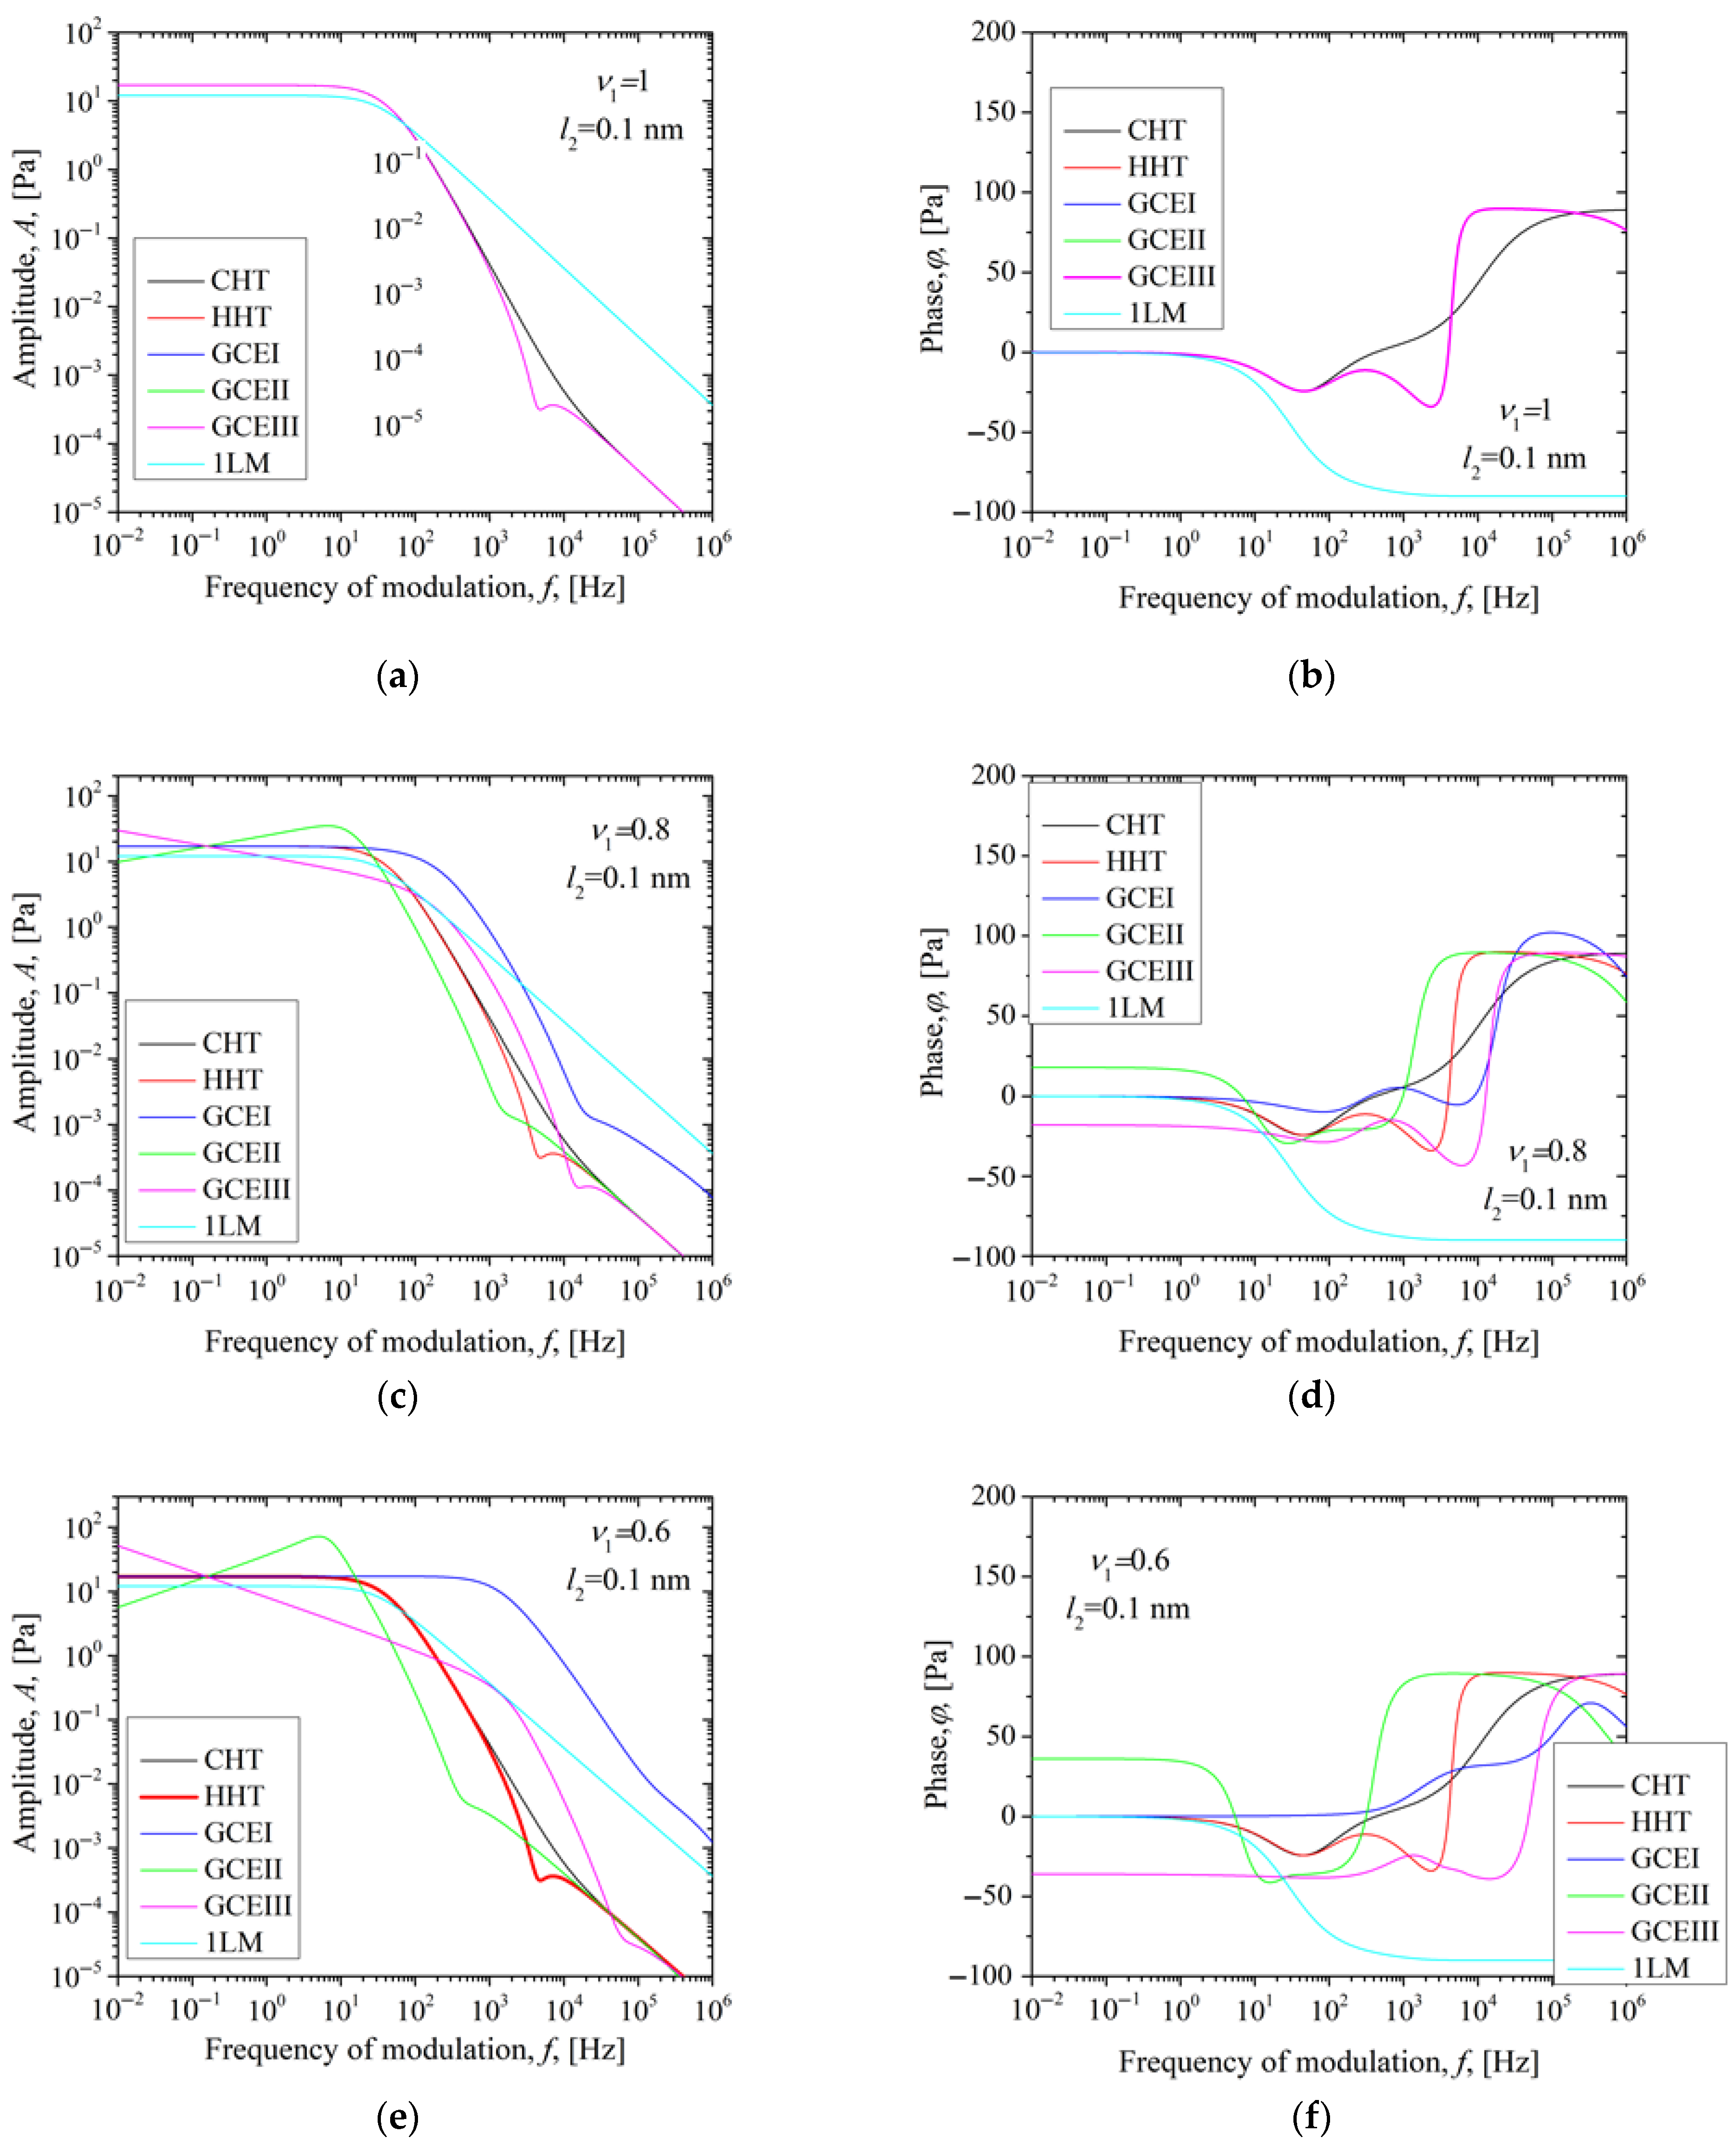
3.2.1. The Influence of the Order of the Fractional Derivative of a Transparent PA12 Sample and the Coating Thickness on the Thermoelastic Component

This section considers a PA12 sample with an optical absorption coefficient of 100 m−1 and a thermal relaxation time of 9 × 10⁻⁵ s. Figure 2 shows the amplitudes and phases of a two-layer sample, consisting of a 100 µm thick PA12 layer and a 0.1 nm thick black dye layer. Three fractional derivative orders for the anomalous diffusion of the PA12 layer are considered: 1, 0.8, and 0.6. The classical heat theory model is represented by a black line labeled CHT, while the hyperbolic heat theory model is shown in red, labeled HHT. Models based on fractional theories of anomalous diffusion are depicted with blue, green, and magenta lines, labeled GCEI, GCEII, and GCEIII, respectively. The specific one-layer model for the sample coating structure, shown in cyan and labeled 1LM, represents a hyperbolic heat conduction model for a single PA12 layer. This model explicitly considers the light absorption coefficient of the PA12 layer, while excluding the influence of the thin coating’s thermal parameters, focusing solely on its large optical absorption through the flux condition on the unilluminated side of the sample [22,65].
In Figure 2a, all six amplitude curves overlap. For ν 1 = 1 , the generalized theories (hyperbolic, GCEI, GCEII, and GCEIII) converge. When the coating is extremely thin, it is expected to align with the single-layer model incorporating the thermal memory effect (hyperbolic theory) and the two-layer hyperbolic model, validating the derived model. The small value of the PA12 thermal relaxation time allows the classical (parabolic) model to overlap the hyperbolic theory.
When the fractional order ν 1 is set to 0.8, anomalous diffusion properties are evident in both the amplitude and phase characteristics (see Figure 2c,d). The single-layer, classical and hyperbolic models display consistent amplitude and phase characteristics that remain unaffected by the fractional derivative order. The expected amplitude shape of the thermoelastic component resembles a filter; it is flat at low frequencies, followed by a breakpoint, after which it decreases linearly (at a rate of 20–40 dB/dec). This pattern is observed in the amplitudes of the HHT, CHT, and 1LM models, as well as in the GCEI model, though in the GCEI model, the breakpoint shifts to higher frequencies with a smaller slope. The GCEII model initially increases, reaching its maximum at a frequency lower than the breakpoint of the HHT, CHT, and 1LM models, before declining with the same slope as these models. In contrast, the GCEIII model experiences a slight initial decrease, with its breakpoint occurring at a higher frequency than that of the HHT, before it decreases again with the same slope as the HHT. Notably, at low frequencies, all three curves (flat, increasing, and decreasing) intersect at the same point.
For ν 1 = 0.6 , the anomalous effects are more pronounced. The GCEI model (represented by the blue line) shifts the inflection point to higher frequencies and identifies an additional inflection point, beyond which the slope changes again. The GCEII model (indicated by the green line) displays a steeper slope increase at low frequencies and has a more noticeable maximum. The GCEIII model (shown in magenta) moves the inflection point to even higher frequencies.
The GCEII theory addresses superdiffusion, while the GCEI and GCEIII theories pertain to subdiffusion. Although both are classified as subdiffusion theories, GCEI and GCEIII differ in their thermal impedances. The superdiffusion theory displays a turning point at lower frequencies than the hyperbolic model, with this frequency decreasing as the fractional derivative order lowers. In contrast, the subdiffusion theories exhibit a turning point at higher frequencies, which increases as the order of the fractional derivative decreases.
In the phase response (see Figure 2b), the phases align across most frequencies, although there are some deviations at both the lower and upper ends of the range. The single-layer model exhibits a flat response at low frequencies, while other models show a slight increase before leveling off. This behavior suggests that the second layer exerts a significant influence, as evidenced by a sharp decline in the curve after an initial breakpoint, followed by a secondary breakpoint where the curve stabilizes once more. At high frequencies, the single-layer model and the classical two-layer models align, but the generalized two-layer theories diverge due to the bending effect of the second layer. This results in a slight decrease following a third breakpoint. The divergence occurs because the single-layer model assumes the second layer has infinite thermal impedance, which means it does not influence bending. In contrast, the classical model features a frequency-independent ratio of thermal impedances r ~ z = z ~ c 2 / z ~ c 1 , as derived from Expressions (12) and (37), resulting in a flat curve for the small value of l2. On the other hand, generalized theories account for the bending effect of the second layer through their thermal impedance ratio r ~ z (as seen in Expressions (9)–(11), (13) and (37)). As the fractional derivative order ν1 decreases, the anomalous effects become more pronounced.
Figure 3 presents the amplitudes and phases of all models, including CHT, HHT, GCEI, GCEII, and GCEIII, alongside the model for a single-layer PA12 coating sample with a thicker black dye layer of 1 µm. As in Figure 2, three fractional derivative order values are analyzed: 1, 0.8, and 0.6. The color scheme remains consistent with the earlier figure: black represents CHT, red indicates HHT, blue corresponds to GCEI, green stands for GCEII, and magenta symbolizes GCEIII.
For a sample thickness of 1 µm, the differences between the two-layer and single-layer models become evident. In the amplitude characteristic, the two-layer models initially show a decline, followed by a period of flattening, and then a subsequent steeper decline compared to the single-layer model. Moreover, the generalized models display an additional inflection point at higher frequencies that is not found in the classical model (see Figure 2a). As fractional derivative order ν1 increases, the inflection point shifts to lower frequencies in the superdiffusion theory and to higher frequencies in the subdiffusion theories. The “bell curve” for the superdiffusion theory (the GCEII model) at lower frequencies narrows, as illustrated in Figure 3c,d, while the phase values increase. In contrast, subdiffusion models show a widening of the “bell curve” with increased frequencies at the inflection points. The GCEI model does not change the height of the flat section of the bell, while the phase value of the GCEIII model declines.
The phase characteristic exhibits a peak on the bell curve in all two-layer models, with the minimum observable at higher frequencies. This minimum is more pronounced in generalized theories of heat conduction compared to classical ones. As the parameter ν1 decreases, the bell curve narrows, and the height of the peak increases in generalized theories that describe superdiffusion. In contrast, subdiffusion theories show a widening of the curve and a significant decrease in peak height, especially in the GCEIII theory. Furthermore, the minimum frequency of the GCEII theory shifts to lower frequencies, while the minimum frequencies of the GCEI and GCEIII theories move to higher frequencies as ν1 decreases.
As the fractional order derivative ν1 decreases, the GCEI model shows only slight changes: the amplitude curve gradually deviates from the classical curve at high frequencies, with a slight reduction in the steepness of its decay, while the phase curve shifts its transition slightly toward lower frequencies, remaining close to the classical behavior. In the GCEII model, decreasing the fractional order produces a more noticeable effect: the amplitude becomes more stable at high frequencies, with a gentler slope, and the phase curve broadens, showing a more gradual transition shifted to lower frequencies. For the GCEIII model, the influence of ν 1 variation is even more pronounced, the amplitude remains nearly constant over a wider range before dropping, and the phase shows a sharper transition with more pronounced peaks as ν 1 decreases, indicating greater sensitivity to this parameter.
Based on these two figures, we can conclude that the phase is considerably more selective than the amplitude when selecting the theoretical heat conduction model. Additionally, the thickness of the second layer has a significant impact on both the amplitude and phase characteristics. Therefore, it is essential to consider the influence of this layer before deciding on the model. Furthermore, the results demonstrate that structure inhomogeneous effects, represented by the fractional order derivative, on the thermoelastic behavior in printed polymers can be detected by photoacoustic techniques. Additionally, using the intersection of amplitude characteristics at a single point, as illustrated in Figure 2, we can propose a straightforward method to determine the type of anomalous diffusion with appropriate calibration. If, after this point, the behavior shows a decrease or an increase in the slope, it can be observed whether the behavior of a sample is super- or subdiffusive.

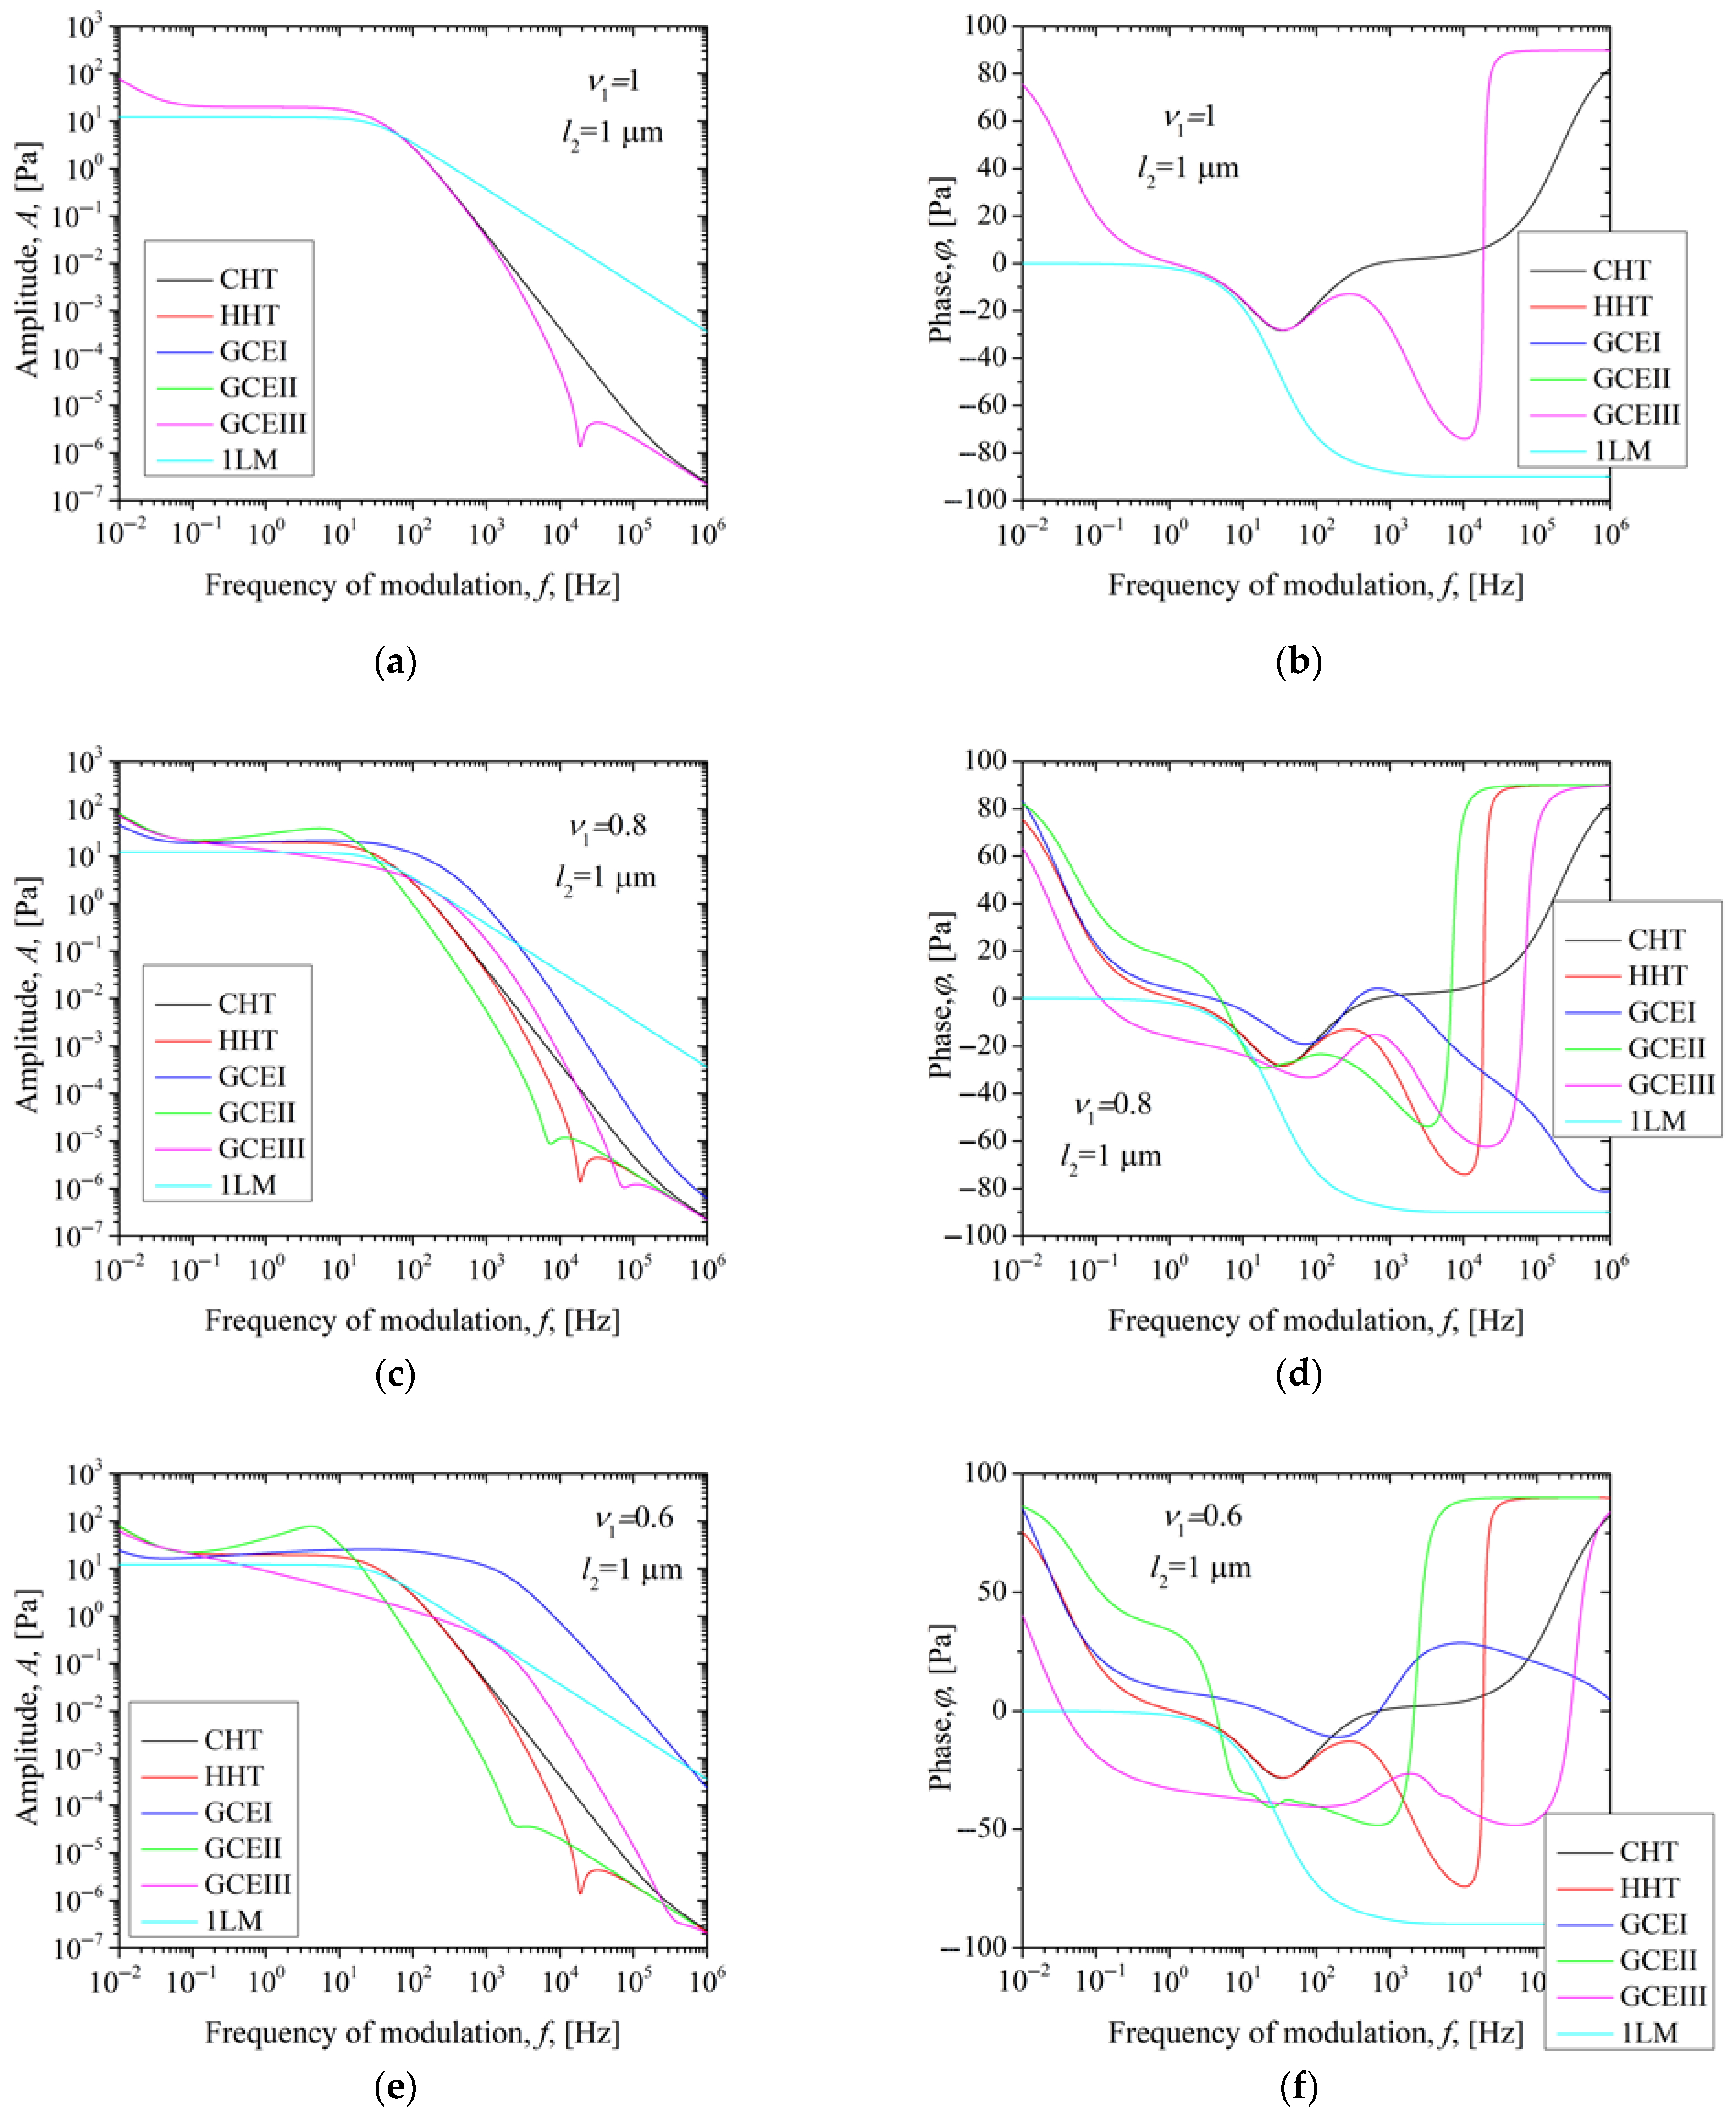
3.2.2. The Influence of the Order of the Fractional Derivative of a Whitish PA12 Sample and the Coating Thickness on the Thermoelastic Component

This section examines semi-transparent (whitish) laser-sintered PA12, which retains the previously discussed characteristics. We first analyze the impact of the fractional derivative order on the anomalous models with three values for the thinner coating, followed by an examination of the thicker coating.
Figure 4 displays the amplitudes and phases of various two-layer models, including CHT, HHT, GCEI, GCEII, and GCEIII, as well as the model for a single-layer PA12 coating sample. Unlike Figure 2, this figure focuses on the whitish PA12 with the same thickness of coating. We analyze three fractional derivative order values: 1, 0.8, and 0.6. The color scheme is consistent with the previous figures: black represents CHT, red indicates HHT, blue corresponds to GCEI, green stands for GCEII, and magenta symbolizes GCEIII.
When comparing Figure 4a,b to Figure 2a,b, it is evident that while the results obtained from the derived model include all same parameters, except for the optical absorption coefficient of the PA12 layer, there is a significant difference in the amplitudes and phases predicted by the CHT, 1LM, and generalized hyperbolic theory for the semi-transparent (whitish) sample. In both cases of an optically semi-transparent and an optically transparent PA12 layer, all theories predict flat amplitudes at low frequencies up to a specific breakpoint frequency. Above this frequency, however, the 1LM theory predicts a decline with a slope between 20 dB/dec and 40 dB/dec, similar to what is observed in the optically transparent PA12 layer. In contrast, the CHT predicts a steeper decline. The generalized hyperbolic theory not only predicts a decline with a slope analogous to that of the CHT but also indicates the emergence of a local minimum and maximum that are very close to one another.
Additionally, we observed a similar min–max structure in the amplitude for the transparent PA12 sample in Figure 3, particularly when the coating thickness increases. The complex relationship between the absorption coefficient of PA12 and the coating thickness necessitates a further analysis of this phenomenon to accurately interpret the experimental photoacoustic measurements, which is the focus of our ongoing research.
The phase characteristics reveal even more significant differences compared to the phases illustrated in Figure 2b. While the 1LM model predicts a relatively abrupt phase change at the breakpoint of 90 degrees, the two-layer theories indicate a gradual phase increase that reaches 90 degrees at higher frequencies. This suggests that in optically semitransparent samples, the impact of the coating on the thermal moment and the average temperature of the entire sample is more evident than in transparent samples, even with the coating’s small thickness.
As the fractional derivative order decreases, the subdiffusive (GCEIII) and superdiffusive (GCEII) properties of thermal transport in PA12 increasingly influence the shape of the TE amplitudes at low frequencies. At high frequencies, however, their slope corresponds to the prediction made by classical theory for a two-layer sample. For the subdiffusive GCEI theory, the low-frequency amplitude shape matches that predicted by CHT theory and the 1LM model, albeit with larger amplitudes. The high-frequency slope diverges more from CHT predictions and aligns with 1LM theory (Figure 4c,e). In contrast, all two-layer theories anticipate an increase in phase, unlike the 1LM theory. Consequently, the phase can help distinguish between the domains of validity for the 1LM theory and the two-layer theories, based on the thermal properties of the examined layer if it is semitransparent.
The amplitudes and phases of two-layer models (CHT, HHT, GCEI, GCEII, and GCEIII) for the PA12 structure with a black dye protective coating are analyzed in Figure 5 and compared to the single-layer model of the PA12 coating sample, considering a thicker coating (l2 = 1 µm). Three fractional derivative order values are examined: 1, 0.8, and 0.6. As in previous figures, black lines represent CHT, red indicates HHT, blue corresponds to GCEI, green denotes GCEII, and magenta symbolizes GCEIII.
For a sample thickness of 1 µm, the differences between the two-layer and single-layer models become clear. The two-layer models exhibit an initial decline in amplitude, followed by a phase of flattening, and then a sharper decline compared to the single-layer model. This pattern resembles that in Figure 3a but is even steeper.
By comparing Figure 5a–f with Figure 4a–f, where all parameters except coating thickness remain constant, we can infer that increased coating thickness leads to a further decrease in low-frequency amplitudes and phases, aligning with both generalized and classical two-layer theories.
In whitish samples, the optical absorption coefficient and anomalous diffusion properties significantly affect the amplitudes and phases of the thermoelastic component. However, isolating the area of unwanted influence from the coating becomes more challenging with these samples.
It is important to note that all bilayer models—except for GCEI—predict a stabilization of the phase difference at 90 degrees at high frequencies when the coating thickness is sufficiently large (see comparisons Figure 5b,d,f with Figure 4b,d,f). In contrast, the one-layer model (1LM) predicts a decrease and stabilization of the phase at −90 degrees at high frequencies. This 180-degree phase difference indicates that the 1LM model suggests a reversal in the direction of the sample bending [22,83], which is not observed in the bilayer models. This implies that the 1LM model ignores the stiffening effect of the coating on the sample, making it unsuitable even for very thin coatings if the coating functions as a distinct layer rather than just an optically modified surface of the sample (for example, the surface adsorption of nanoparticles with a high optical absorption coefficient or their ionic implantation).
If heat conduction in PA12 can be explained by the subdiffusive GCEI theory, we might expect that adding a coating layer will have a reduced impact on the stiffening of the sample. In this scenario, it is possible that the direction of its bending could reverse; however, this will require further investigation.

4. Conclusions

A two-layer model was developed to account for volumetric optical absorption in both layers, as well as anomalous diffusion and thermal memory effects. This model was validated against three established frameworks: a classical two-layer heat conduction model for opaque samples, a generalized two-layer model for the opaque first layer, and a single-layer model based on hyperbolic theory applied to the sample-protective coating–structure.
Using the derived model, we analyzed the thermoelastic component of the photoacoustic response for a structure comprising a porous layer with high structural entropy and a thin, optically opaque coating. This configuration is relevant for photoacoustic measurements of 3D-printed polymer samples.
We examined the effects of the optical absorption coefficient of PA12, coated with a layer of black dye, the anomalous diffusion properties of the PA12 layer, and the thickness of this thin coating on our models. Our results indicate that subdiffusive and superdiffusive effects, regardless of the governing GCE theories, significantly influence the shape and magnitude of the thermoelastic component of the photoacoustic signal, depending on the optical absorbance of the illuminated layer.
The frequency range in which anomalous diffusion effects are evident is influenced by both the coating thickness and the fractional derivative order. As the coating thickness increases and the fractional derivative order decreases, the effects of anomalous diffusion become more pronounced at higher frequencies. Notably, the impact of coating thickness differs from that of the fractional derivative order. Furthermore, the phase of the thermoelastic component of the photoacoustic response is more sensitive to the effects of anomalous diffusion and coating thickness than the amplitude.
Our results show that thermoelastic bending measurements via photoacoustic methods can detect the type of anomalous effects in laser-sintered polymers. With proper calibration, it can be determined whether a sample exhibits super- or subdiffuse behavior by analyzing the amplitude characteristics at the intersection point depicted in Figure 2. This modeling approach can support the development of non-destructive diagnostic techniques for quality control in additive manufacturing, especially in the characterization of thermal and structural properties of 3D-printed polymer components.
Our analysis indicates that some of the phenomena observed in photoacoustic measurements of laser-sintered polymers should not be attributed solely to the influence of the detectors. Instead, these observations can be explained by a combination of factors: volumetric absorption within the porous polymer sample, increased stiffness arising from the applied coating—especially if the coating consists of a separate material layer rather than just a modified surface layer (such as nanoparticle adsorption from a suspension or ionic implantation)—and anomalous diffusion effects in heat conduction through materials with high structural entropy, like laser-sintered polymers.
To enable the photoacoustic measurement of thermal relaxation parameters in laser-sintered polymers—parameters linked to their fractal structure—further research is necessary. This research should focus on identifying the most appropriate generalized forward model, which best explains the experimental measurements [19]. Additionally, a methodology must be developed to address the complex, nonlinear, and multi-parameter inverse photoacoustic problem.

Author Contributions

Conceptualization: M.N.P. and S.P.G.; methodology: M.N.P.; validation: M.N.P. and A.S.; formal analysis: M.N.P., S.P.G., E.K.L. and A.S.; writing—original draft preparation: M.N.P. and S.P.G.; writing—review and editing: A.S. and E.K.L.; supervision: A.S. and E.K.L.; funding acquisition: A.S. and E.K.L. All authors have read and agreed to the published version of the manuscript.

Funding

This work was supported by the Ministry of Science, Technological Development and Innovation of the Republic of Serbia, contract number 451-03-47/2023-01/200017, and by CNPq under Grant No. 301715/2022-0, and the APC was funded by A.S.

Data Availability Statement

The raw data supporting the conclusions of this article will be made available by the authors on request.

Conflicts of Interest

The authors declare no conflicts of interest.

Abbreviations

The following abbreviations are used in this manuscript:
GCEGeneralized Cattaneo Equation
3D-Three-Dimensional
FDMFused Deposition Modeling
SLAStereolithography
SLSSelective Laser Sintering
TEThermoelastic
CTRWContinuous-Time Random Walk
CHTClassical Heat Theory
HHTHyperbolic Heat Theory
1LMOne-Layer Model

References

  1. Formlabs Professional 3D Printers. Available online: https://formlabs.com/global/3d-printers/catalog/ (accessed on 20 May 2025).
  2. Polyamide (PA): Structure, Properties, and 3D Printing Applications. Available online: Https://www.sculpteo.com/en/3d-learning-hub/3d-printing-materials-guide/polyamide-pa-structure-properties-and-3d-printing-applications/ (accessed on 20 May 2025).
  3. Mamo, H.B.; Adamiak, M.; Kunwar, A. 3D printed biomedical devices and their applications: A review on state-of-the-art technologies, existing challenges, and future perspectives. J. Mech. Behav. Biomed. Mater. 2023, 143, 105930. [Google Scholar] [CrossRef] [PubMed]
  4. Kohutiar, M.; Kakošová, L.; Krbata, M.; Janík, R.; Fekiač, J.J.; Breznická, A.; Eckert, M.; Mikuš, P.; Timárová, Ľ. Comprehensive Review: Technological Approaches, Properties, and Applications of Pure and Reinforced Polyamide 6 (PA6) and Polyamide 12 (PA12). Compos. Mater. Polym. 2025, 17, 442. [Google Scholar] [CrossRef]
  5. Vargas, H.; Miranda, L.C.M. Photoacoustic and related photothermal techniques. Phys. Rep. 1988, 161, 43–101. [Google Scholar] [CrossRef]
  6. Bialkowski, S.E.; Astrath, N.G.C.; Proskurnin, M.A. Photothermal Spectroscopy Methods; John Wiley & Sons: Hoboken, NJ, USA, 2019. [Google Scholar]
  7. Bertolotti, M.; Li Voti, R. A note on the history of photoacoustic, thermal lensing, and photothermal deflection techniques. J. Appl. Phys. 2020, 128, 230901. [Google Scholar] [CrossRef]
  8. Rosencwaig, A.; Gersho, A. Theory of the photoacoustic effect with solids. J. Appl. Phys. 1976, 47, 64–69. [Google Scholar] [CrossRef]
  9. Rousset, L.B.G.; Lepoutre, F. Influence of thermoelastic bending on photoacoustic experiments related to measurements of thermal diffusivity of metals. J. Appl. Phys. 1983, 54, 2383–2391. [Google Scholar] [CrossRef]
  10. Tam, A.C. Photothermal techniques in material characterization applications. In Review of Progress in Quantitative Nondestructive Evaluation, 1st ed.; Thompson, D.O., Chimenti, D.E., Eds.; Springer: Boston, MA, USA, 1989; Volume 1, pp. 473–487. [Google Scholar]
  11. Tam, A.C. Applications of PA sensing techniques. Rev. Mod. Phys. 1986, 58, 381. [Google Scholar] [CrossRef]
  12. McDonald, F.A. Practical quantitative theory of photoacoustic pulse generation. Appl. Phys. Lett. 1989, 54, 1504–1506. [Google Scholar] [CrossRef]
  13. Perondi, L.F.; Miranda, L.C.M. Minimal-volume photoacoustic cell measurement of thermal diffusivity: Effect of the thermoelastic sample bending. J. Appl. Phys. 1987, 62, 2955–2959. [Google Scholar] [CrossRef]
  14. Medina, J.; Gurevich, Y.U.G.; Logvinov, G.N.; Guez, P.R. Photoacoustic investigation of the effective diffusivity of two-layer. Mol. Phys. 2002, 100, 3133–3138. [Google Scholar] [CrossRef]
  15. Gurevich, Y.G.; Logvinov, G.N.; de la Cruz, G.G.; Espejo López, G. Physics of thermal waves in homogeneous and inhomogeneous (two-layer) samples. Int. J. Therm. Sci. 2003, 42, 63–69. [Google Scholar] [CrossRef]
  16. Pichardo-Molina, J.L.; Alvarado-Gil, J.J. Heat diffusion and thermoelastic vibration influence on the signal of an open photoacoustic cell for two layer systems. J. Appl. Phys. 2004, 95, 6450–6456. [Google Scholar] [CrossRef]
  17. Somer, A.; Popovic, M.N.; da Cruz, G.K.; Novatski, A.; Lenzi, E.K.; Djordjevic, K.; Galovic, S. Photoacoustic Signal of Optically Opaque Two-Layer Samples: Influence of Anomalous Thermal Diffusion. Int. J. Thermophys. 2025, 46, 84. [Google Scholar] [CrossRef]
  18. Popovic, M.N.; Markushev, D.D.; Nesic, M.V.; Jordovic-Pavlovic, M.I.; Galovic, S.P. Optically induced temperature variations in a two-layer volume absorber including thermal memory effects. J. Appl. Phys. 2021, 129, 015104. [Google Scholar] [CrossRef]
  19. Popović, M. Generalizovani Fotoakustični odziv Dvoslojnih Struktura; Zadužbina Andrejević: Beograd, Serbia, 2019. [Google Scholar]
  20. Evangelista, L.R.; Lenzi, E.K. Fractional Diffusion Equations and Anomalous Diffusion; Cambridge University Press: Cambridge, UK, 2018. [Google Scholar]
  21. Somer, A.; Novatski, A.; Serbena, F.C.; Lenzi, E.K. Interplay between super and subdiffusive behaviors in photothermal phenomena. Int. J. Therm. Sci. 2021, 159, 106539. [Google Scholar] [CrossRef]
  22. Popovic, M.N.; Milicevic, D.; Kostic, L.T.; Miletic, V.V.; Galovic, S.P. Influence of the high absorbing nonilluminated surface of the sample on the photothermally induced thermoelastic bending. Int. J. Therm. Sci. 2025, 211, 109689. [Google Scholar] [CrossRef]
  23. Hilfer, R. Fractional diffusion based on Riemann-Liouville fractional derivatives. J. Phys. Chem. B 2000, 104, 3914–3917. [Google Scholar] [CrossRef]
  24. Cesarone, F.; Caputo, M.; Cametti, C. Memory formalism in the passive diffusion across highly heterogeneous systems. J. Memb. Sci. 2005, 250, 79–84. [Google Scholar] [CrossRef]
  25. Čukić, M.; Galovic, S. Mathematical modeling of anomalous diffusive behavior in transdermal drug-delivery including time-delayed flux concept. Chaos Solitons Fractals 2023, 172, 113584. [Google Scholar] [CrossRef]
  26. Metzler, R.; Rajyaguru, A.; Berkowitz, B. Modelling anomalous diffusion in semi-infinite disordered systems and porous media. New J. Phys. 2022, 24, 123004. [Google Scholar] [CrossRef]
  27. Metzler, R.; Jeon, J.H.; Cherstvy, A.G.; Barkai, E. Anomalous diffusion models and their properties: Non-stationarity, non-ergodicity, and ageing at the centenary of single particle tracking. Phys. Chem. Chem. Phys. 2014, 16, 24128–24164. [Google Scholar] [CrossRef] [PubMed]
  28. Metzler, R.; Jeon, J.H.; Cherstvy, A.G. Non-Brownian diffusion in lipid membranes: Experiments and simulations. Biochim. Biophys. Acta-Biomembr. 2016, 1858, 2451–2467. [Google Scholar] [CrossRef] [PubMed]
  29. Wu, H.; Schwartz, D.K. Nanoparticle tracking to probe transport in porous media. Acc. Chem. Res. 2020, 53, 2130–2139. [Google Scholar] [CrossRef]
  30. Höfling, F.; Franosch, T. Anomalous transport in the crowded world of biological cells. Rep. Prog. Phys. 2013, 76, 046602. [Google Scholar] [CrossRef]
  31. Zagato, E.; Forier, K.; Martens, T.; Neyts, K.; Demeester, J.; De Smedt, S.; Remaut, K.; Braeckmans, K. Single-particle tracking for studying nanomaterial dynamics: Applications and fundamentals in drug delivery. Nanomedicine 2014, 9, 913–927. [Google Scholar] [CrossRef] [PubMed]
  32. Koh, Y.R.; Shirazi-HD, M.; Vermeersch, B.; Mohammed, A.M.S.; Shao, J.; Pernot, G.; Bahk, J.-H.; Manfra, M.J.; Shakouri, A. Quasi-ballistic thermal transport in Al0.1Ga0.9N thin film semiconductors. Appl. Phys. Lett. 2016, 109, 243107. [Google Scholar] [CrossRef]
  33. Vlahos, L.; Isliker, H.; May, C.D. Normal and anomalous diffusion: A tutorial. arXiv 2024, arXiv:0805.0419. [Google Scholar]
  34. Chen, W.; Sun, H.; Zhang, X.; Korošak, D. Anomalous diffusion modeling by fractal and fractional derivatives. Comput. Math. Appl. 2010, 59, 1754–1758. [Google Scholar] [CrossRef]
  35. Meerschaert, M.M.; Scheffler, H. Limit theorems for continuous-time random walks with infinite mean waiting times. J. Appl. Probab. 2004, 41, 623–638. [Google Scholar] [CrossRef]
  36. Korabel, N.; Klages, R.; Chechkin, A.V.; Sokolov, I.M.; Gonchar, V.Y. Fractal properties of anomalous diffusion in intermittent maps. Phys. Rev. E 2007, 75, 036213. [Google Scholar] [CrossRef]
  37. Galovic, S.; Djordjevic, A.I.; Kovacevic, B.Z.; Djordjevic, K.L.; Chevizovich, D. Influence of local thermodynamic non-equilibrium to photothermally induced acoustic response of complex systems. Fractal Fract. 2024, 8, 399. [Google Scholar] [CrossRef]
  38. Meerschaert, M.M. Fractional Calculus, Anomalous Diffusion, and Probability; Chapter 11; World Scientific Publishing Co. Pte. Ltd.: Singapore, 2011. [Google Scholar]
  39. Compte, A.; Metzler, R. The generalized Cattaneo equation for the description of anomalous transport processes. J. Phys. A Math. Gen. 1997, 30, 7277–7289. [Google Scholar] [CrossRef]
  40. Galovic, S.; Čukić, M.; Chevizovich, D. Inertial memory effects in molecular transport across nanoporous membranes. Membranes 2025, 15, 11. [Google Scholar] [CrossRef]
  41. Metzler, R.; Klafter, J. The random walk’s guide to anomalous diffusion: A fractional dynamics approach. Phys. Rep. 2000, 339, 1–77. [Google Scholar] [CrossRef]
  42. Joseph, D.D.; Preziosi, L. Addendum to the paper ‘Heat waves’. Rev. Mod. Phys. 1989, 62, 375–391. [Google Scholar] [CrossRef]
  43. Ozisik, M.N.; Tzou, D.Y. On the wave theory in heat conduction. J. Heat Transfer 1994, 116, 526–535. [Google Scholar] [CrossRef]
  44. Zhukovsky, K. Operational approach and solutions of hyperbolic heat conduction equations. Axioms 2016, 5, 28. [Google Scholar] [CrossRef]
  45. Novikov, I.A. Harmonic thermal waves in materials with thermal memory. J. Appl. Phys. 1997, 81, 1067–1072. [Google Scholar] [CrossRef]
  46. Galović, S.; Kostoski, D. Photothermal wave propagation in media with thermal memory. J. Appl. Phys. 2003, 93, 3063–3070. [Google Scholar] [CrossRef]
  47. Novikov, I.A. Resonant generation of harmonic thermal waves in media with memory. J. Eng. Phys. Thermophys. 1992, 62, 367–372. [Google Scholar] [CrossRef]
  48. Jou, D.; Lebon, G. Extended irreversible thermodynamics. Rep. Prog. Phys. 1999, 51, 1105–1179. [Google Scholar] [CrossRef]
  49. Peshkov, V.P. Second sound in helium II. J. Phys. 1944, 8, 381–389. [Google Scholar]
  50. Landau, L. Theory of the superfluidity of helium II. Phys. Rev. 1941, 60, 356–358. [Google Scholar] [CrossRef]
  51. Jackson, T.H.; Walker, C.; McNelly, T.F. Second sound in NaF. Phys. Rev. Lett. 1970, 25, 26–28. [Google Scholar] [CrossRef]
  52. Narayanamurti, V.; Dynes, R.C. Observation of second sound in bismuth. Phys. Rev. Lett. 1972, 28, 1461–1465. [Google Scholar] [CrossRef]
  53. Kirsanov, Y.A.; Kirsanov, A.Y.; Yudakhin, A.E. Measurement of thermal relaxation and temperature damping time in a solid. High Temp. 2017, 55, 114–119. [Google Scholar] [CrossRef]
  54. Sobolev, S.L. Local non-equilibrium transport models. Phys. Usp. 1997, 40, 1043–1053. [Google Scholar] [CrossRef]
  55. Sobolev, S.L.; Dai, W. Heat transport on ultrashort time and space scales in nanosized systems: Diffusive or wave-like? Materials 2022, 15, 4287. [Google Scholar] [CrossRef]
  56. Garden, J. Macroscopic non-equilibrium thermodynamics in dynamic calorimetry. Thermochim. Acta 2007, 452, 85–105. [Google Scholar] [CrossRef]
  57. Huberman, S.; Duncan, R.A.; Chen, K.; Song, B.; Chiloyan, V.; Ding, Z.; Maznev, A.A.; Chen, G.; Nelson, K.A. Observation of second sound in graphite at temperatures above 100 K. Science 2019, 364, 375–379. [Google Scholar] [CrossRef]
  58. Mitra, A.V.; Kumar, S.K.; Mitra, M.K. Experimental evidence of hyperbolic heat conduction in processed meat. J. Heat Transf. 1995, 117, 568–573. [Google Scholar] [CrossRef]
  59. Cattaneo, C. Sur une forme de l’equation de la chaleur eliminant la paradoxe d’une propagation instantanée. Compt. Rendu 1958, 247, 431–433. [Google Scholar]
  60. Vernotte, P. Sur quelques complications possibles dans les phénomènes de conduction de la chaleur. Compt. Rendus Hebd. Séances Acad. Sci. 1961, 252, 2190. [Google Scholar]
  61. Ding, Z.; Chen, K.; Song, B.; Shin, J.; Maznev, A.A.; Nelson, K.A.; Chen, G. Observation of second sound in graphite over 200 K. Nat. Commun. 2022, 13, 285. [Google Scholar] [CrossRef]
  62. Jeong, J.; Li, X.; Lee, S.; Shi, L.; Wang, Y. Transient hydrodynamic lattice cooling by picosecond laser irradiation of graphite. Phys. Rev. Lett. 2021, 127, 085901. [Google Scholar] [CrossRef] [PubMed]
  63. Somer, A.; Novatski, A.; Lenzi, E. Theoretical predictions for photoacoustic signal: Fractionary thermal diffusion with modulated light absorption source. Eur. Phys. J. Plus 2019, 134, 593. [Google Scholar] [CrossRef]
  64. Somer, A.; Popovic, M.N.; da Cruz, G.K.; Novatski, A.; Lenzi, E.K.; Galovic, S.P. Anomalous thermal diffusion in two-layer system: The temperature profile and photoacoustic signal for rear light incidence. Int. J. Therm. Sci. 2022, 179, 107661. [Google Scholar] [CrossRef]
  65. Kiryakova, V.S. Generalized Fractional Calculus and Applications; CRC Press: Boca Raton, FL, USA, 1993. [Google Scholar]
  66. Oldham, K.; Spanier, J. The Fractional Calculus: Theory and Applications of Differentiation and Integration to Arbitrary Order; Elsevier: New York, NY, USA, 1974; Volume 111. [Google Scholar]
  67. Podlubny, I. Fractional Differential Equations: An Introduction to Fractional Derivatives, Fractional Differential Equations, to Methods of Their Solution and Some of Their Applications; Elsevier: San Diego, CA, USA, 1998; Volume 198. [Google Scholar]
  68. Miletic, V.V.; Popovic, M.N.; Galovic, S.P.; Markushev, D.D.; Nesic, M.V. Photothermally induced temperature variations in a low-absorption sample via backside absorption. J. Appl. Phys. 2023, 133, 075101. [Google Scholar] [CrossRef]
  69. Popovic, M.N.; Nesic, M.V.; Zivanov, M.; Markushev, D.D.; Galovic, S.P. Photoacoustic response of a transmission photoacoustic configuration for two-layer samples with thermal memory. Opt. Quantum Electron. 2018, 50, 330. [Google Scholar] [CrossRef]
  70. Mandelis, A. Photothermal applications to the thermal analysis of solids. J. Therm. Anal. 1991, 37, 1065–1101. [Google Scholar] [CrossRef]
  71. Galović, S.; Šoškić, Z.; Popović, M.; Cevizović, D.; Stojanović, Z. Theory of photoacoustic effect in media with thermal memory. J. Appl. Phys. 2014, 116, 024901. [Google Scholar] [CrossRef]
  72. Pichardo, J.L.; Alvarado-Gil, J.J. Open photoacoustic cell determination of the thermal interface resistance in two layer systems. J. Appl. Phys. 2001, 89, 4070–4075. [Google Scholar] [CrossRef]
  73. Astrath, N.G.C.; Astrath, F.B.G.; Shen, J.; Lei, C.; Zhou, J.; Liu, Z.S.; Navessin, T.; Baesso, M.L.; Bento, A.C. An open-photoacoustic-cell method for thermal characterization of a two-layer system. J. Appl. Phys. 2010, 107, 043514. [Google Scholar] [CrossRef]
  74. Ordóñez-Miranda, J.; Alvarado-Gil, J.J. Frequency-modulated hyperbolic heat transport and effective thermal properties in layered systems. Int. J. Therm. Sci. 2010, 49, 209–217. [Google Scholar] [CrossRef]
  75. Lord, H.W.; Shulman, Y. A generalized dynamical theory of thermoelasticity. J. Mech. Phys. Solids 1967, 15, 299–309. [Google Scholar] [CrossRef]
  76. Metzler, R.; Nonnenmacher, T.F. Fractional diffusion: Exact representations of spectral functions. J. Phys. A Math. Gen. 1997, 30, 1089–1093. [Google Scholar] [CrossRef]
  77. Todorović, D.M.; Nikolic, P.M. Carrier transport contribution on thermoelastic and electronic deformation in semiconductors. In Progress in Semiconductors; SPIE Press: Bellingham, WA, USA, 2000; Volume 4. [Google Scholar]
  78. Miletic, V.; Popovic, M.; Galovic, S.; Markushev, D.; Kostic, L.; Nesic, M. Influence of non-irradiated surface optical absorber on temperature gradient induced by photothermal effect in a thin film. Facta Univ. Ser. Phys. Chem. Technol. 2022, 20, 67–77. [Google Scholar] [CrossRef]
  79. Tuntun Plastic. Available online: https://www.tuntunplastic.com/product/polyamide-12-material.html (accessed on 20 May 2025).
  80. Additive 3D. Available online: https://www.additive-3d.com/polyamide-PA12-SLS-3d-printing.html (accessed on 20 May 2025).
  81. NETZSCH. PA12: Polyamide 12. Available online: https://analyzing-testing.netzsch.com/en/polymers-netzsch-com/engineering-thermoplastics/pa12-polyamide-12 (accessed on 20 May 2025).
  82. Humphries, A.; Lister, T.S.; Wright, P.A.; Hughes, M.P. Determination of the thermal and physical properties of black tattoo ink using compound analysis. Lasers Med. Sci. 2013, 28, 1107–1112. [Google Scholar] [CrossRef]
  83. Zakrzewski, J.; Maliński, M.; Chrobak; Pawlak, M. Comparison of theoretical basics of microphone and piezoelectric photothermal spectroscopy of semiconductors. Int. J. Thermophys. 2017, 38, 2. [Google Scholar] [CrossRef]
Figure 1. The geometry of the problem: (a) the photoacoustic cell is closed with a two-layer material heated by a periodic light source; (b) the radial geometry considered for the thermoelastic solution.
Fractalfract 09 00456 g001
Figure 2. Photoacoustic amplitude and phase characteristics of the transparent PA12 black dye double-layer sample with thicknesses of 100 µm and 0.1 nm for three fractional derivative orders, ν1: (a) amplitude and (b) phase for ν 1 = 1 , (c) amplitude and (d) phase for ν 1 = 0.8 , (e) amplitude and (f) phase for ν 1 = 0.6 .
Fractalfract 09 00456 g002
Figure 3. Photoacoustic amplitude and phase characteristics of the transparent PA12 black dye double-layer sample with thicknesses of 100 µm and 1 µm for three fractional derivative orders, ν1: (a) amplitude and (b) phase for ν 1 = 1 , (c) amplitude and (d) phase for ν 1 = 0.8 , (e) amplitude and (f) phase for ν 1 = 0.6 .
Fractalfract 09 00456 g003
Figure 4. Photoacoustic amplitude and phase characteristics of the whitish PA12 black dye double-layer sample with thicknesses of 100 µm and 0.1 nm for three fractional derivative orders, ν1: (a) amplitude and (b) phase for ν 1 = 1 , (c) amplitude and (d) phase for ν 1 = 0.8 , (e) amplitude and (f) phase for ν 1 = 0.6 .
Fractalfract 09 00456 g004
Figure 5. Photoacoustic amplitude and phase characteristics of the whitish PA12 black dye double-layer sample with thicknesses of 100 µm and 1 µm for three fractional derivative orders, ν1: (a) amplitude and (b) phase for ν 1 = 1 , (c) amplitude and (d) phase for ν 1 = 0.8 , (e) amplitude and (f) phase for ν 1 = 0.6 .
Fractalfract 09 00456 g005
Table 1. Thermal properties of PA12 and dye [81,82].
DT [m2/s]k [W/(m·K)] α T [1/K]τ [s]
PA121.85 × 10−70.231.3 × 10−49 × 10−5
Black dye3 × 10−6701.5 × 10−410−12
Disclaimer/Publisher’s Note: The statements, opinions and data contained in all publications are solely those of the individual author(s) and contributor(s) and not of MDPI and/or the editor(s). MDPI and/or the editor(s) disclaim responsibility for any injury to people or property resulting from any ideas, methods, instructions or products referred to in the content.

