
Binary-Classification Physical Fractal Models in Different Coal Structures

Abstract
1. Introduction
2. Mathematical Model
2.1. The Binary-Classification Physical Fractal Model of Coal
2.2. Derivation of the Constitutive Equation for the Binary-Classification Physical Fractal Structure of Coal
3. Significance of Model Parameters
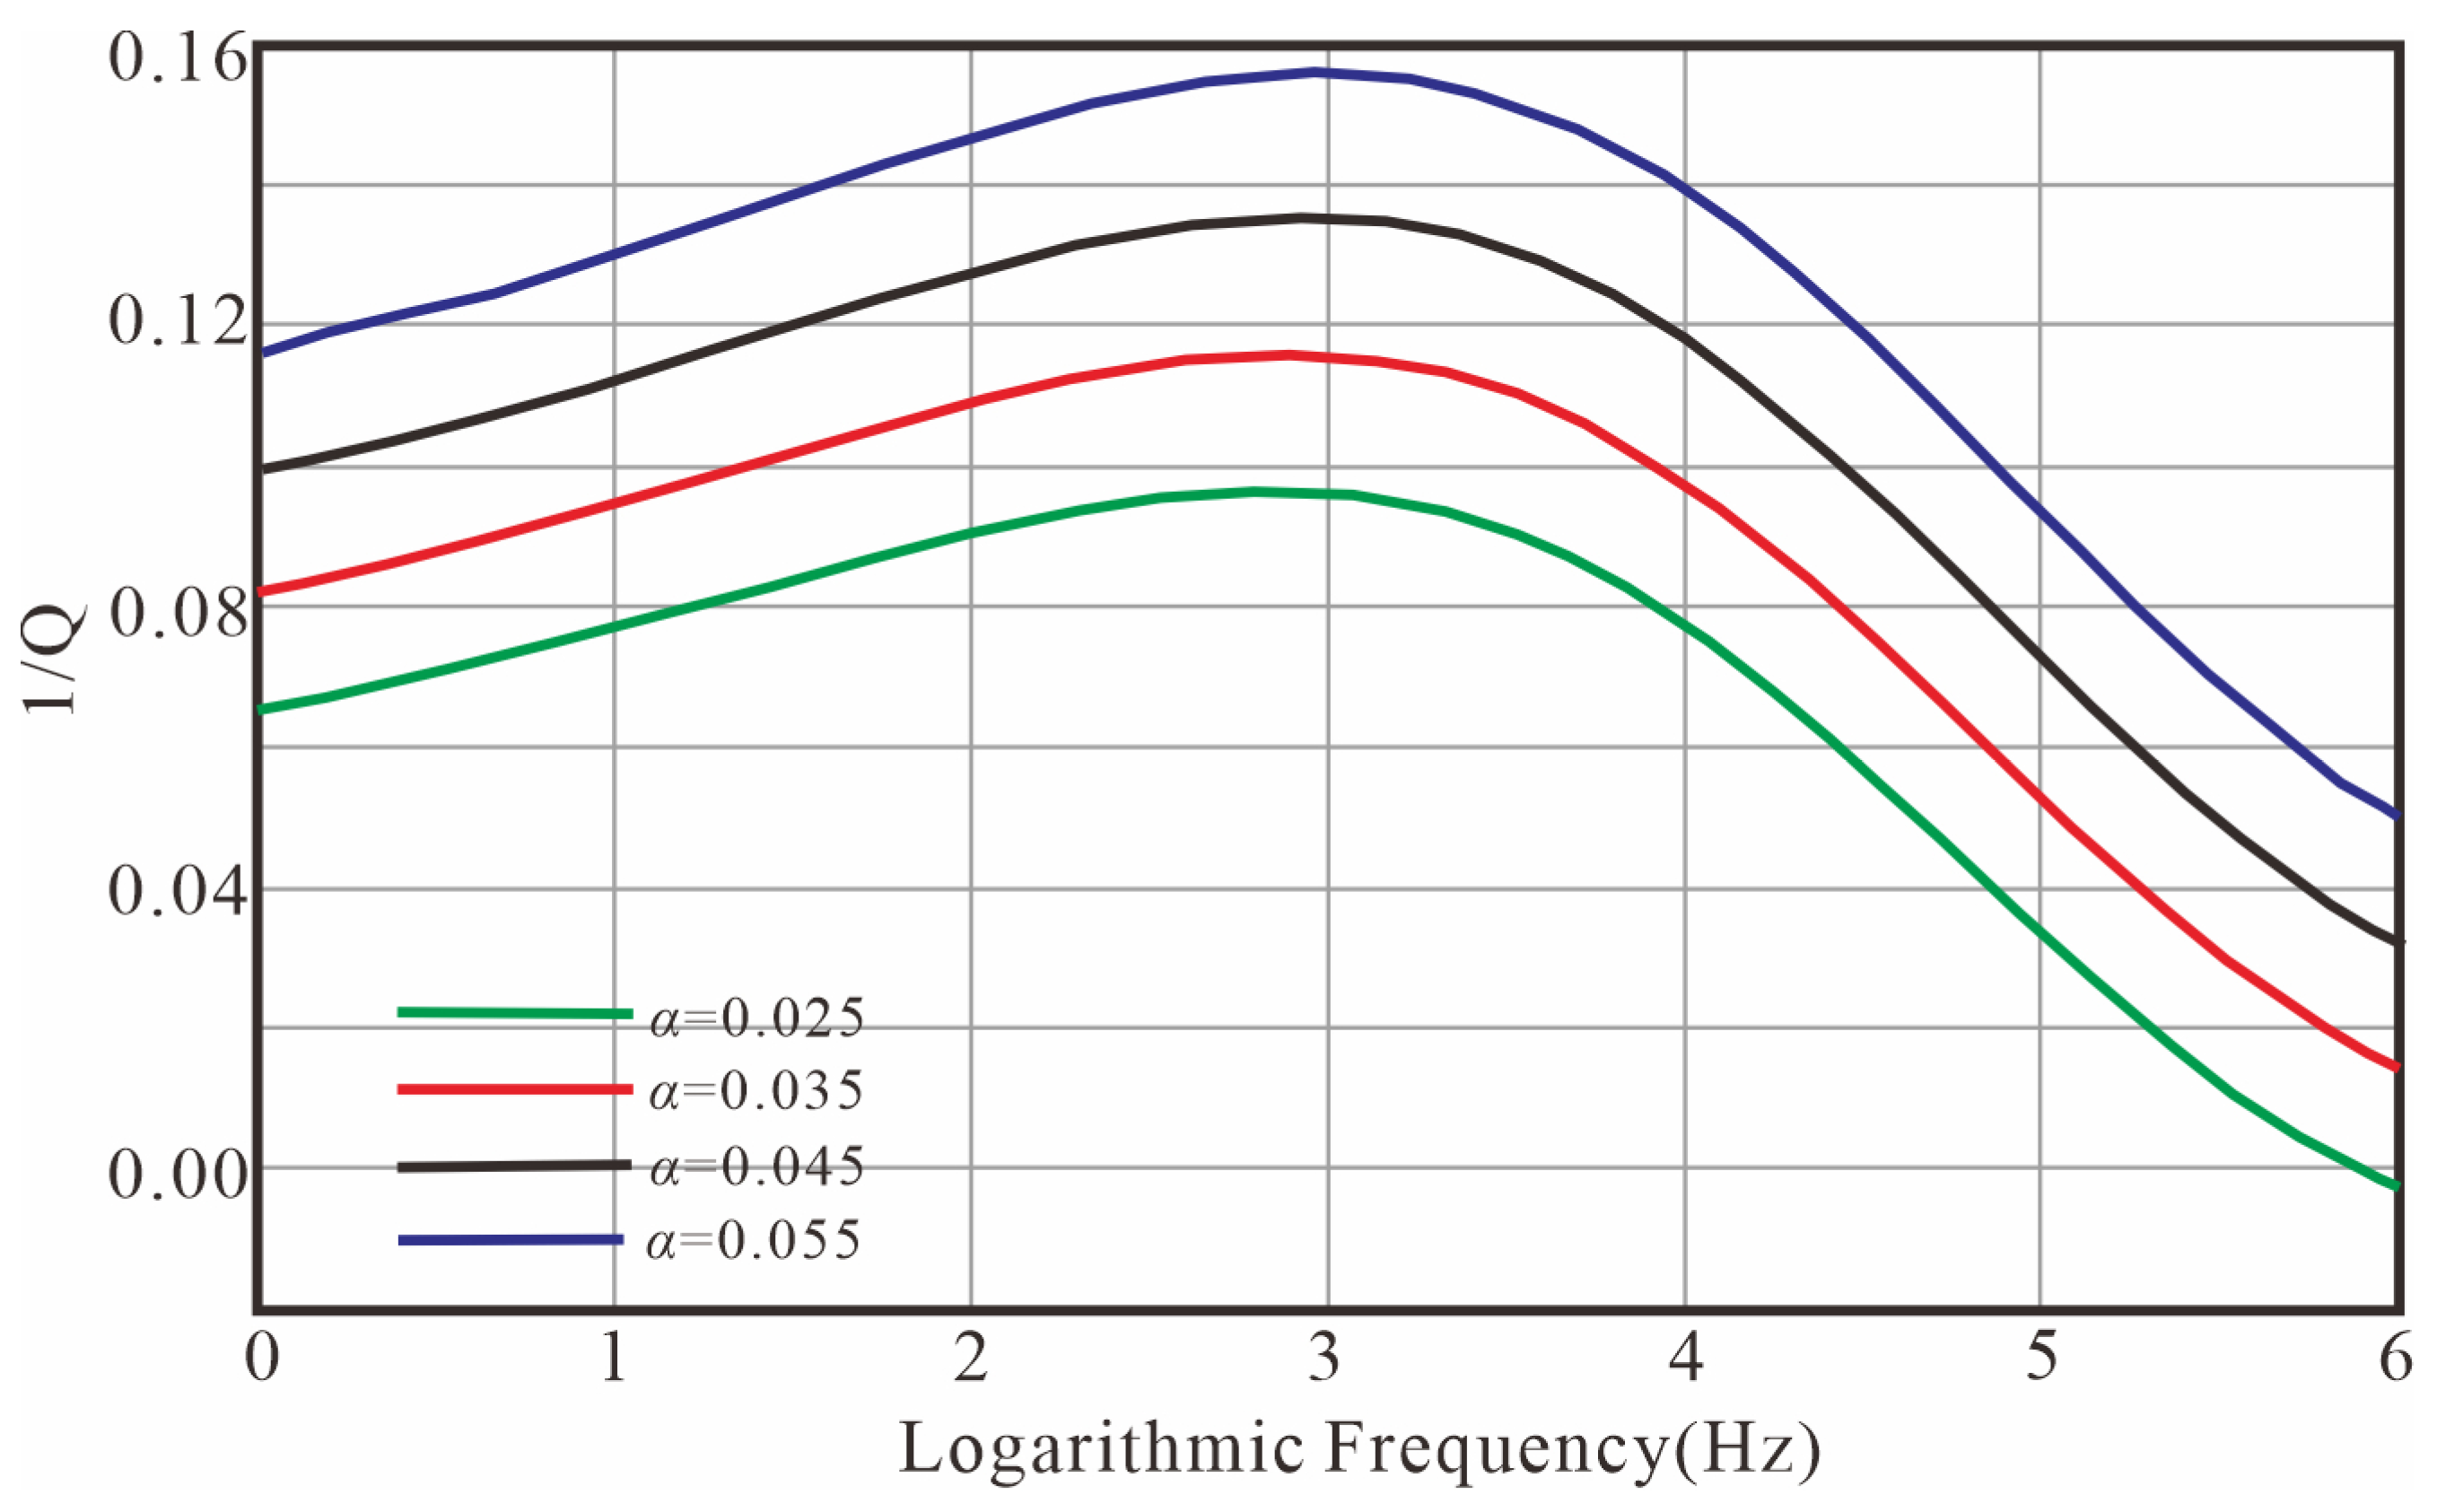
3.1. The Influence of the Value of on Dispersion and Attenuation
3.2. The Influence of the Value of on Dispersion and Attenuation


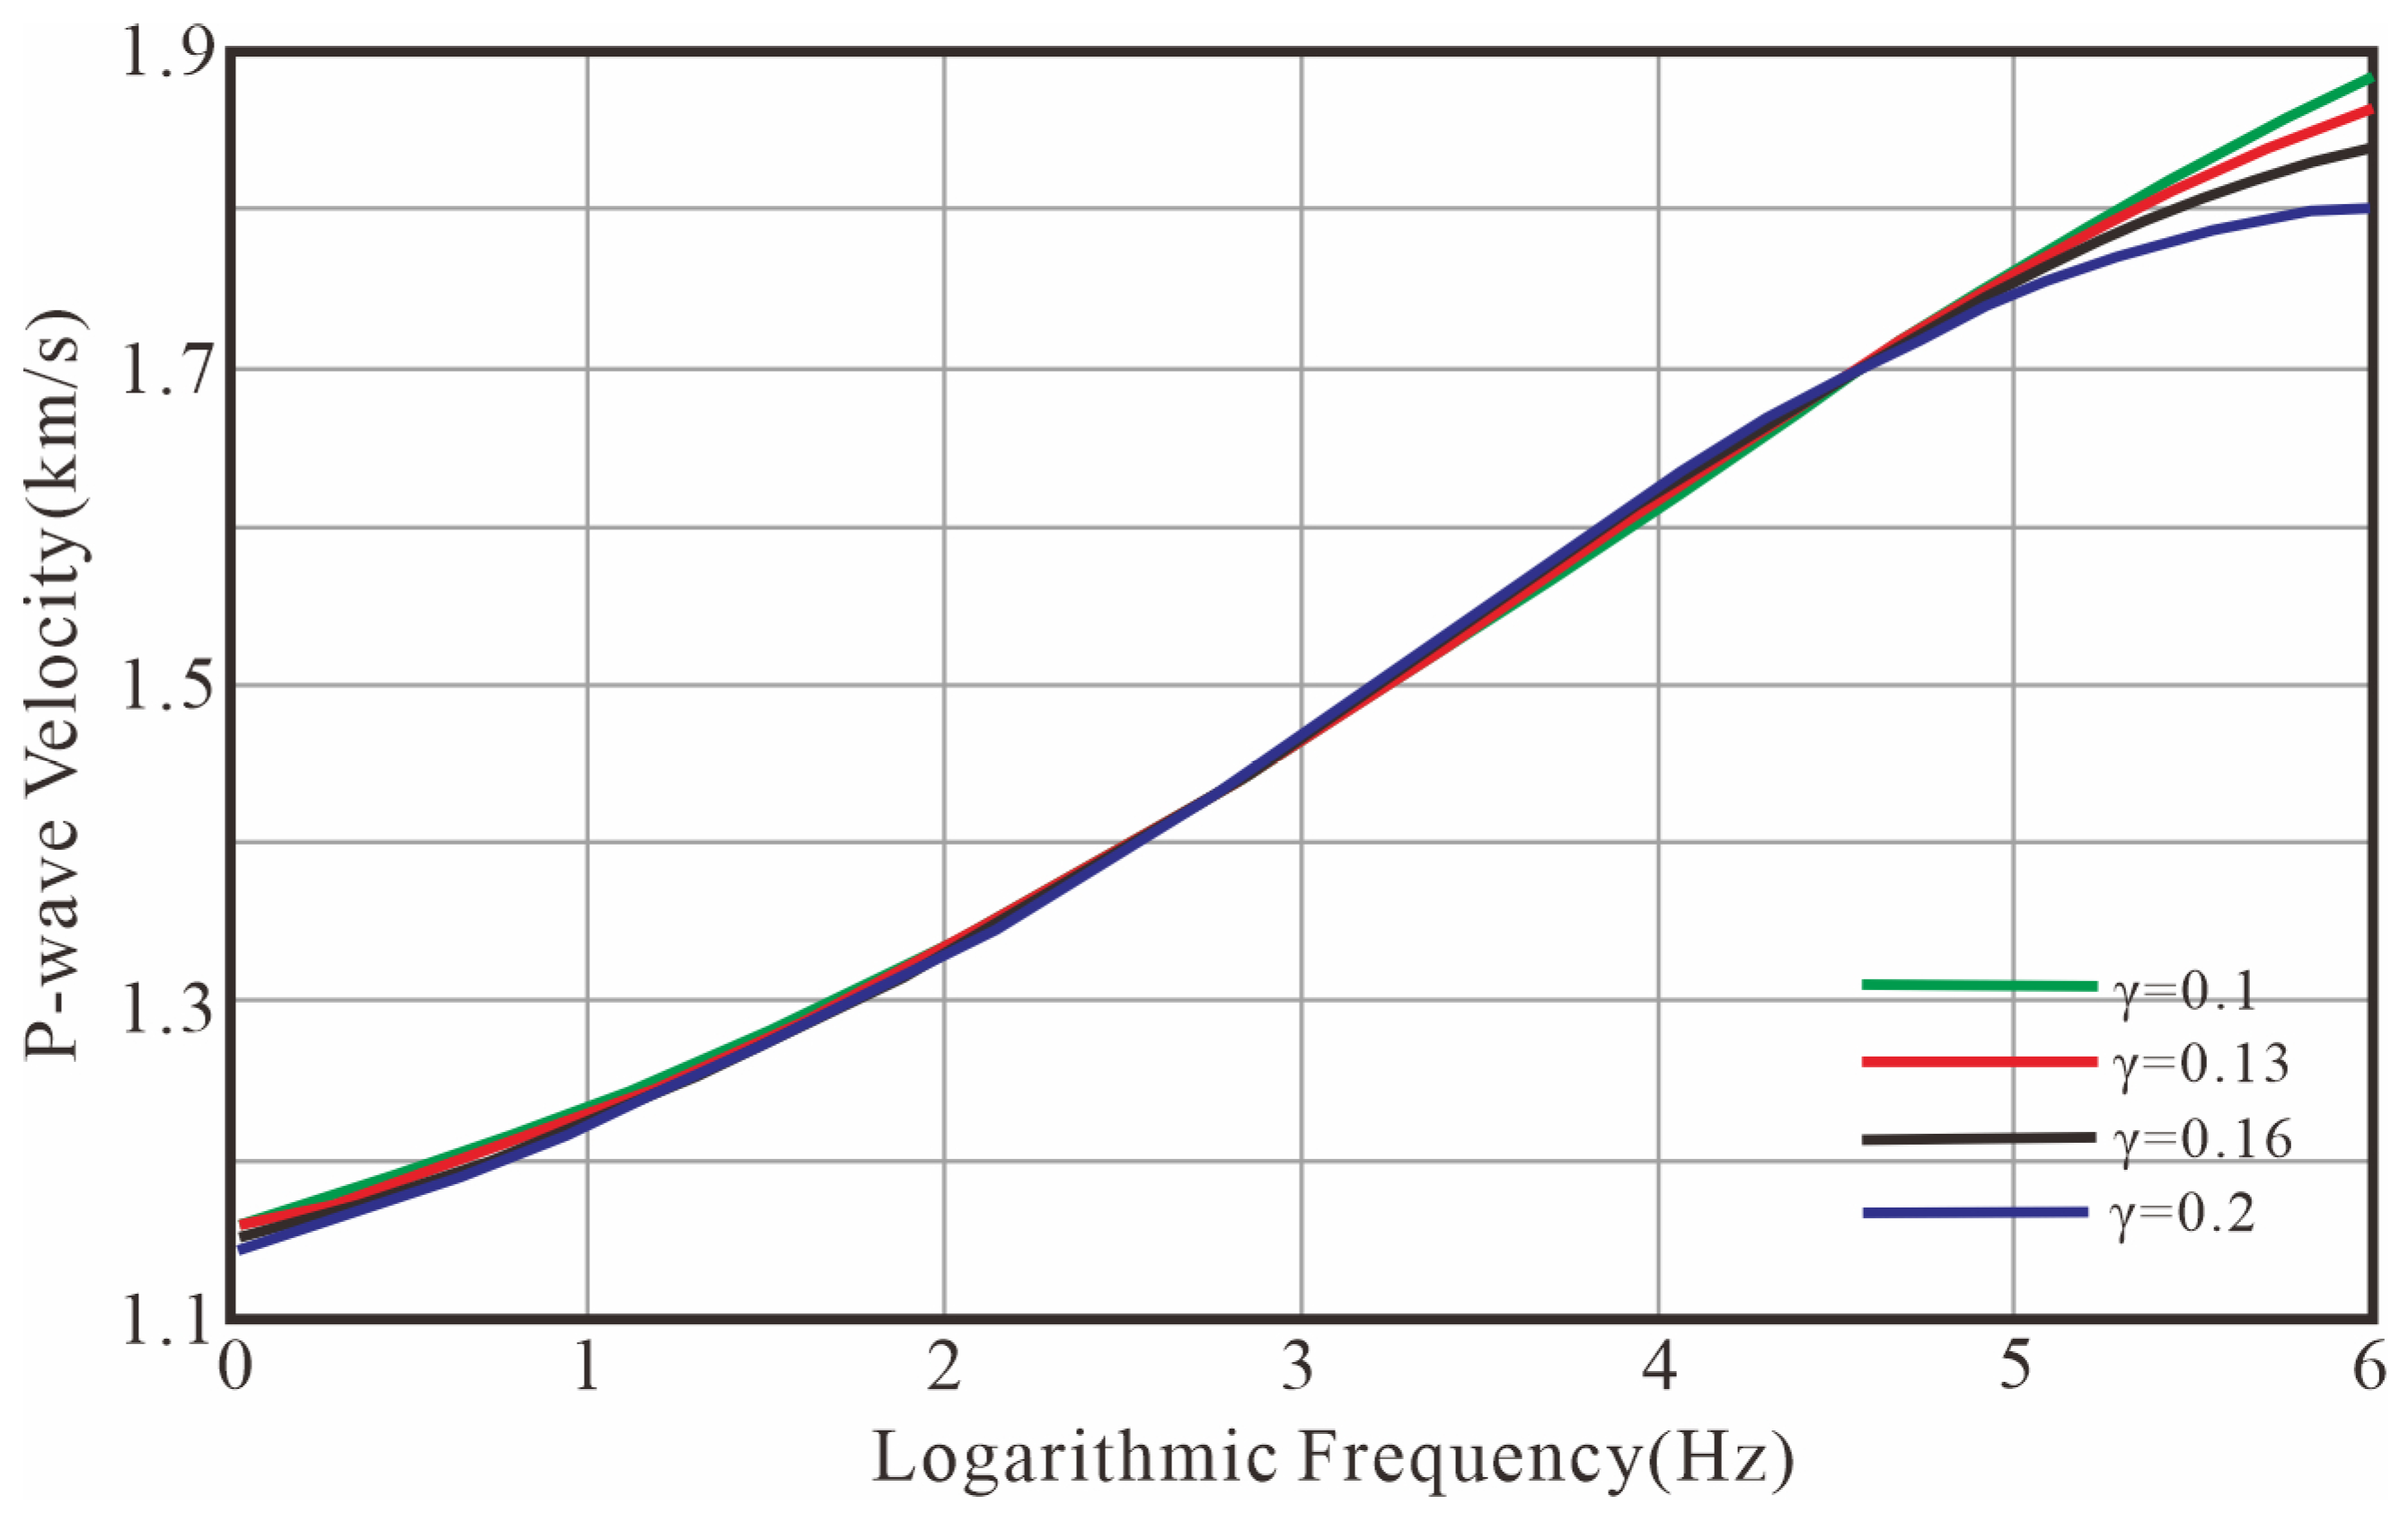
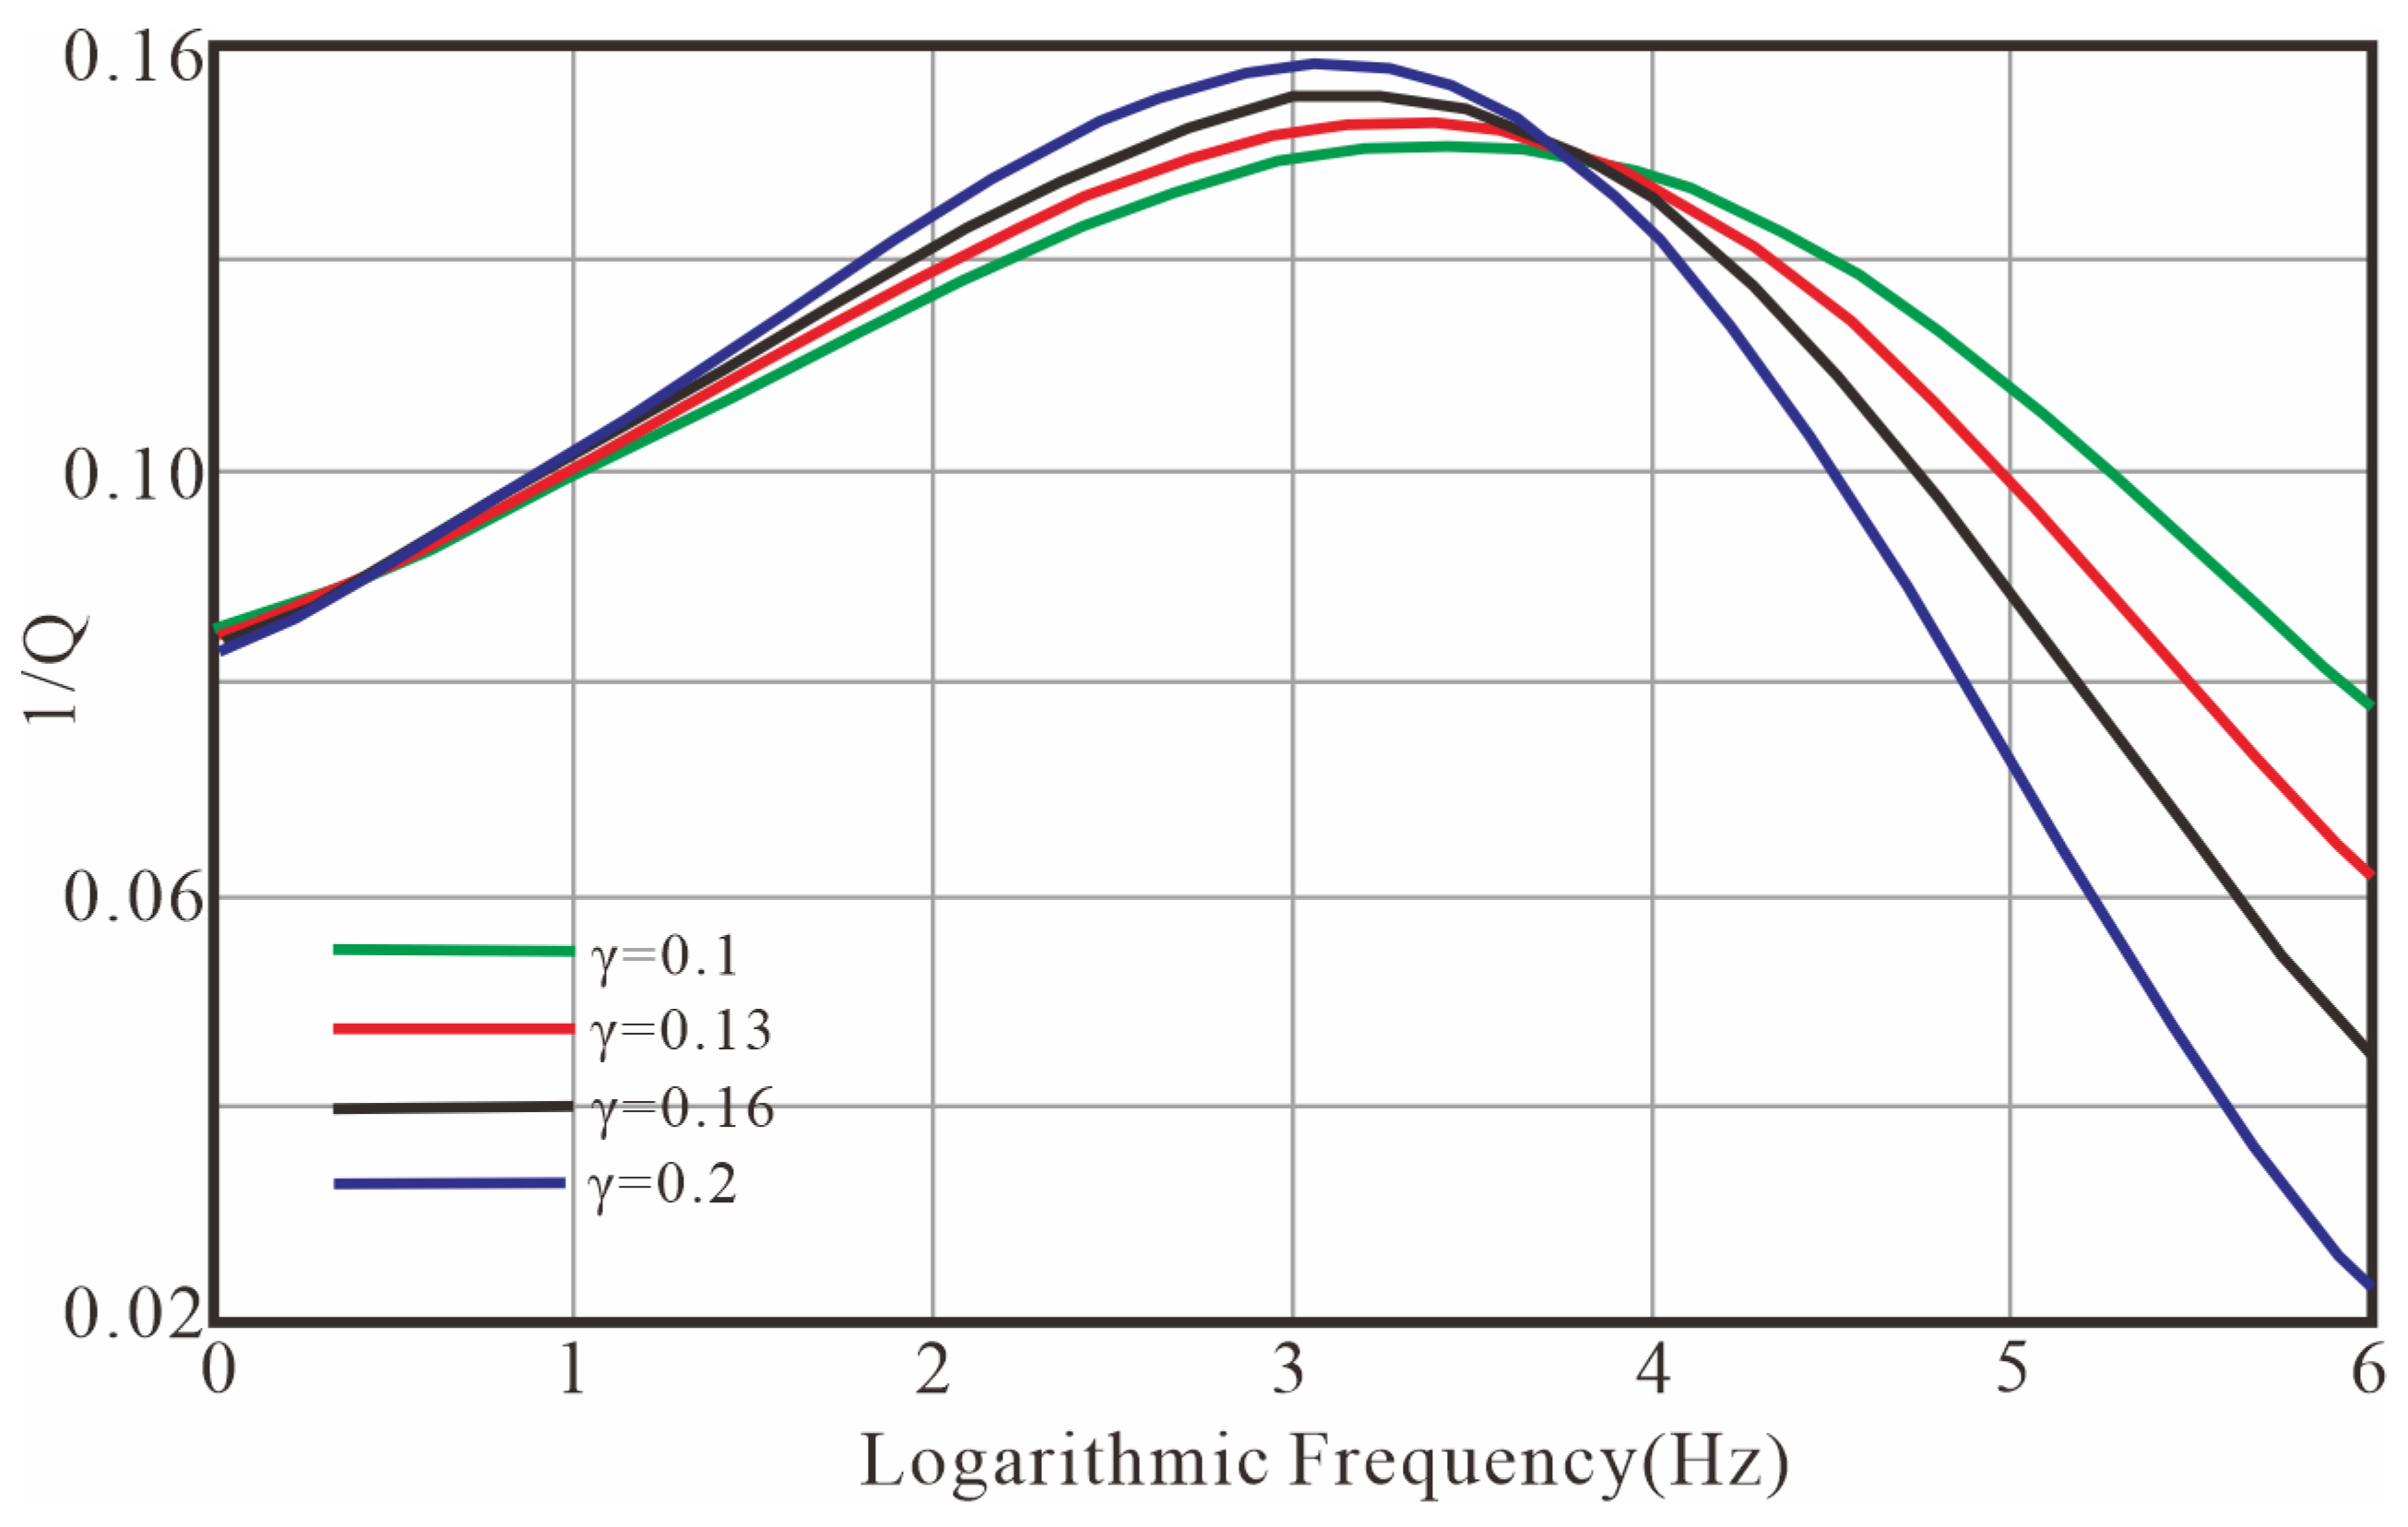
3.3. The Influence of the Value of on Dispersion and Attenuation
4. Experimental Results and Discussion
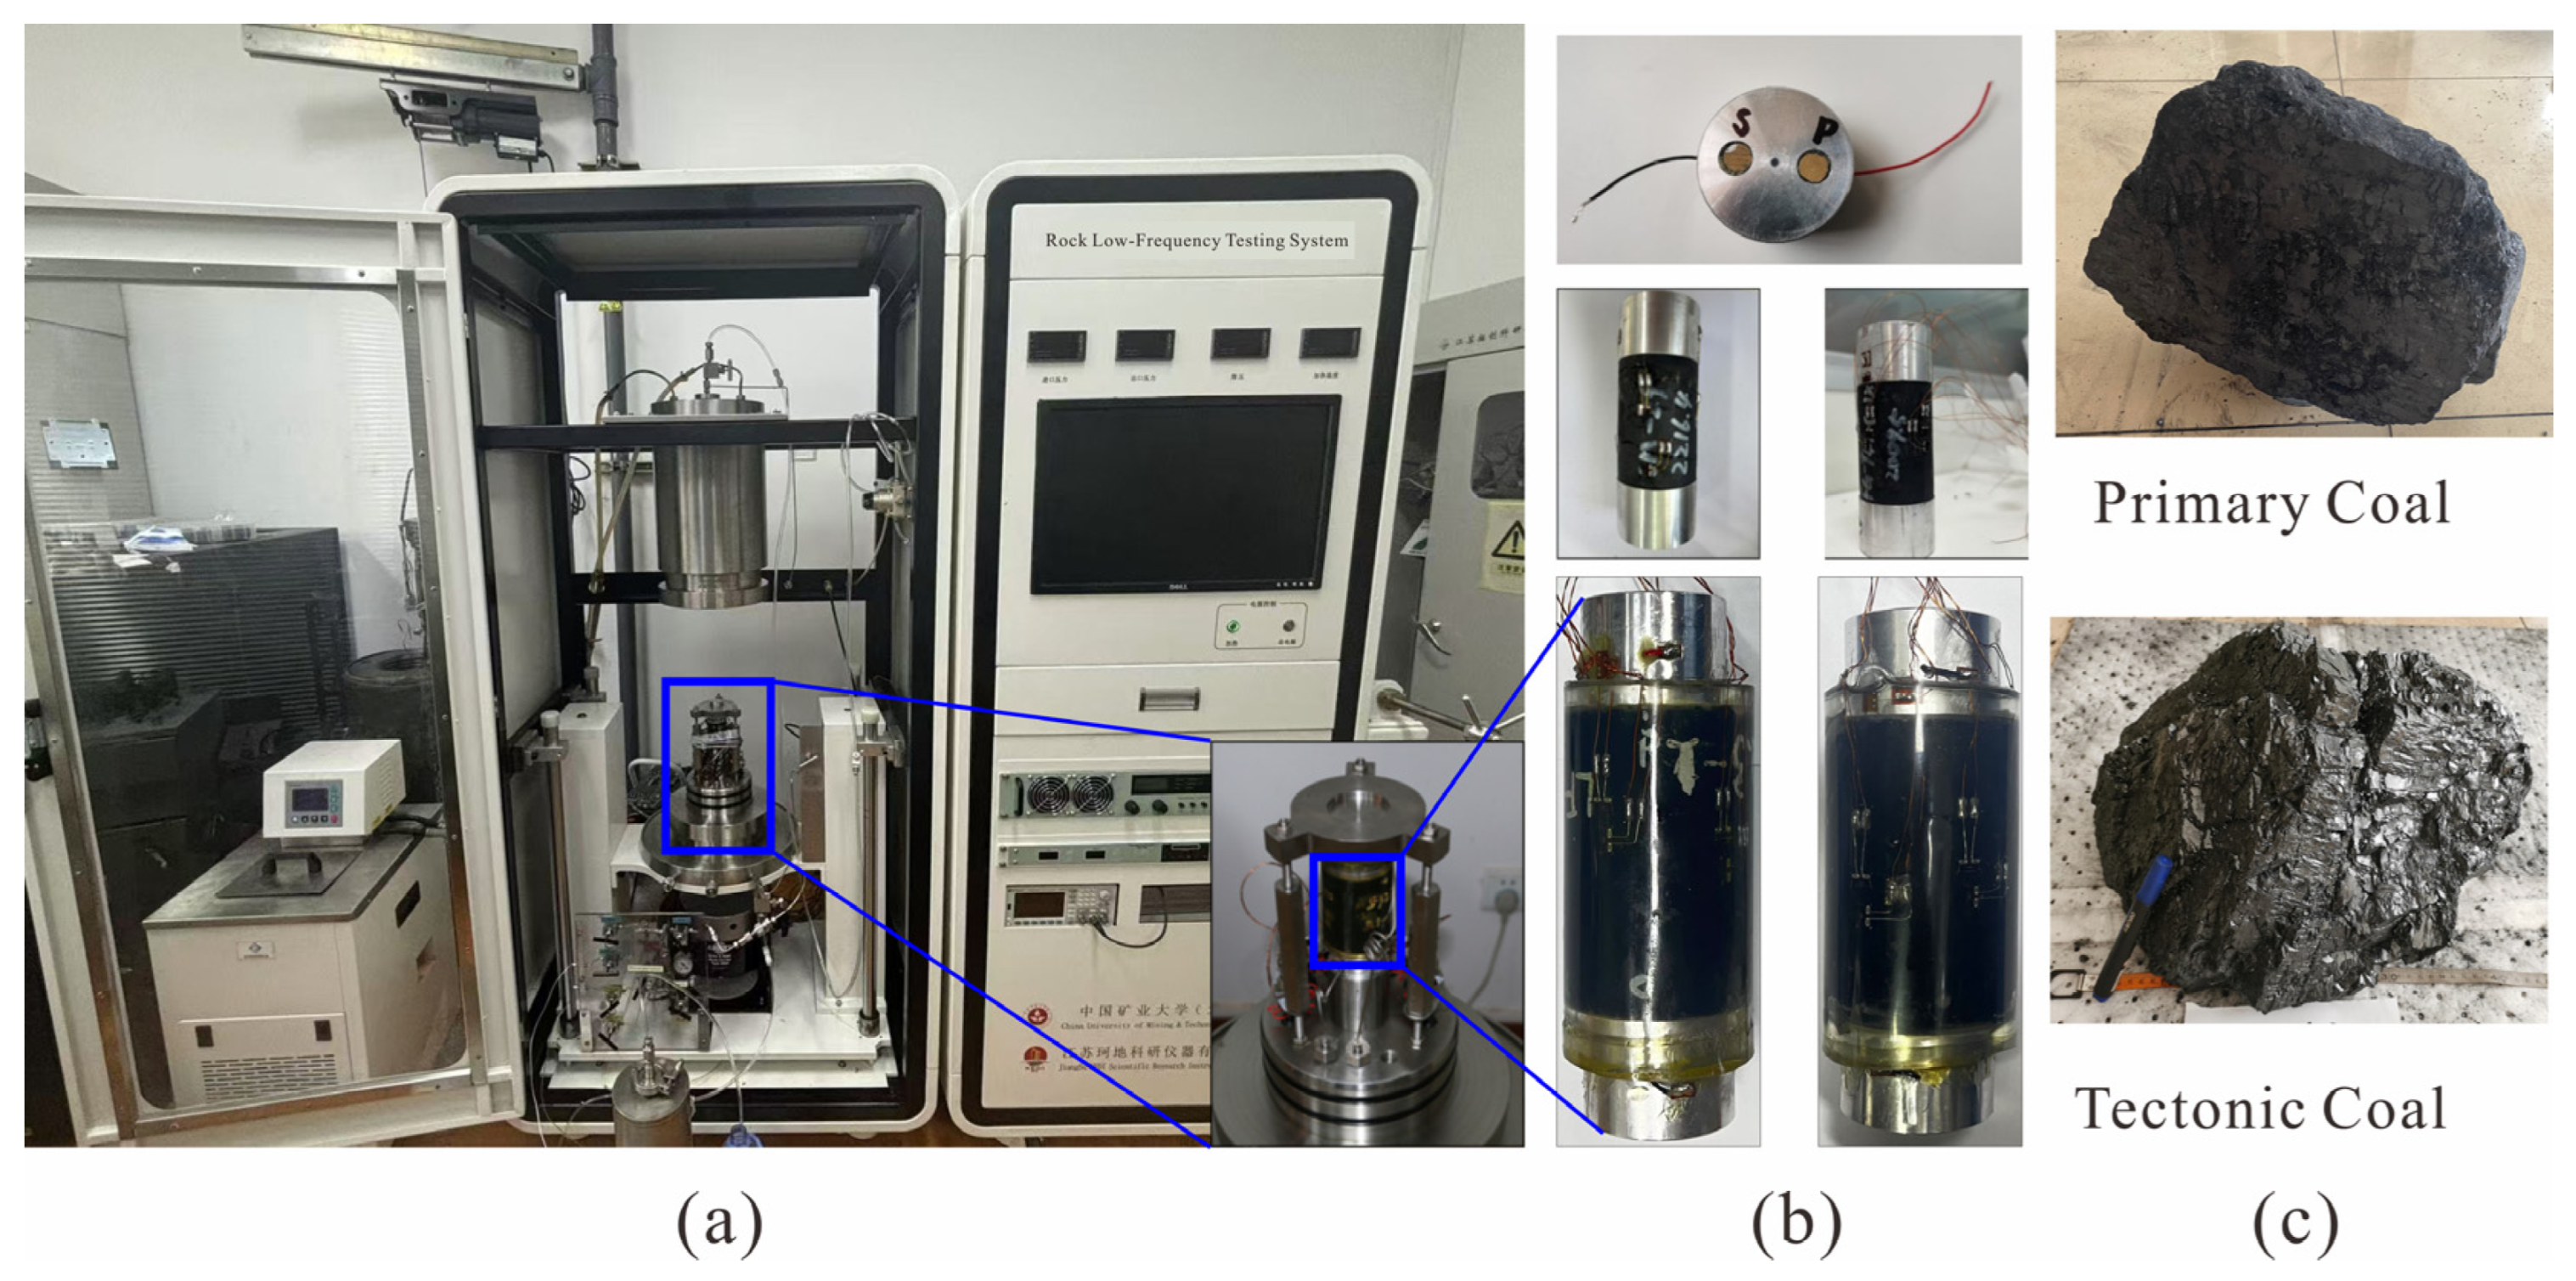
4.1. Attenuation Experiments Across Frequency Bands for Different Coal Mass Structures
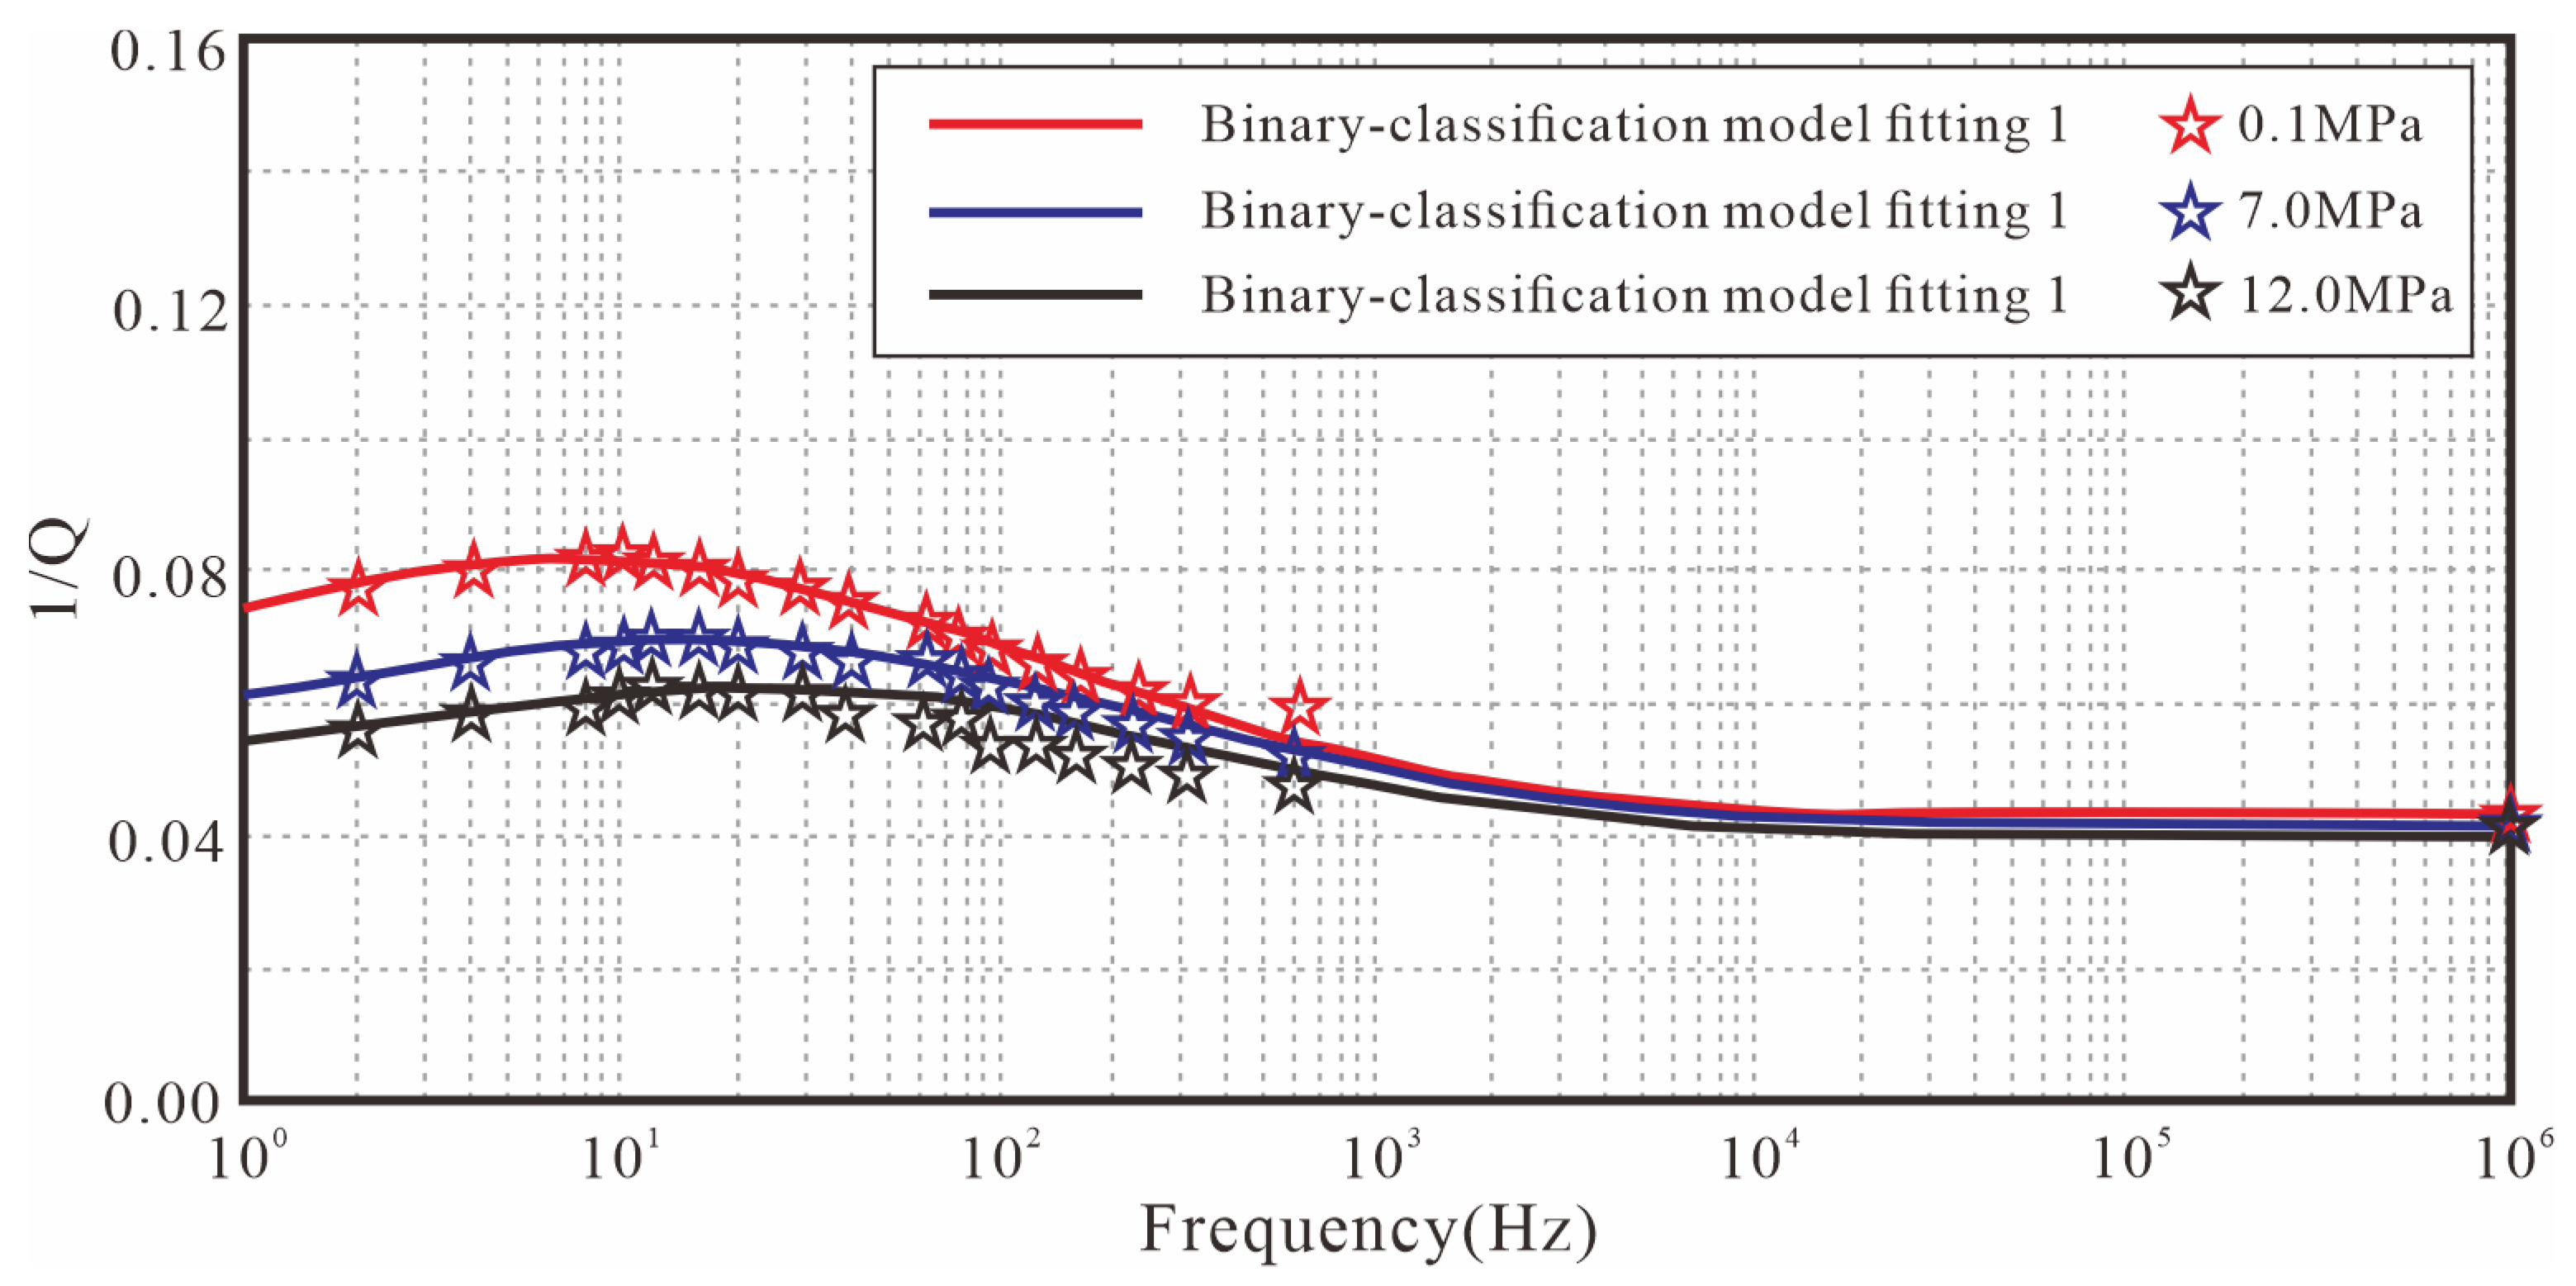
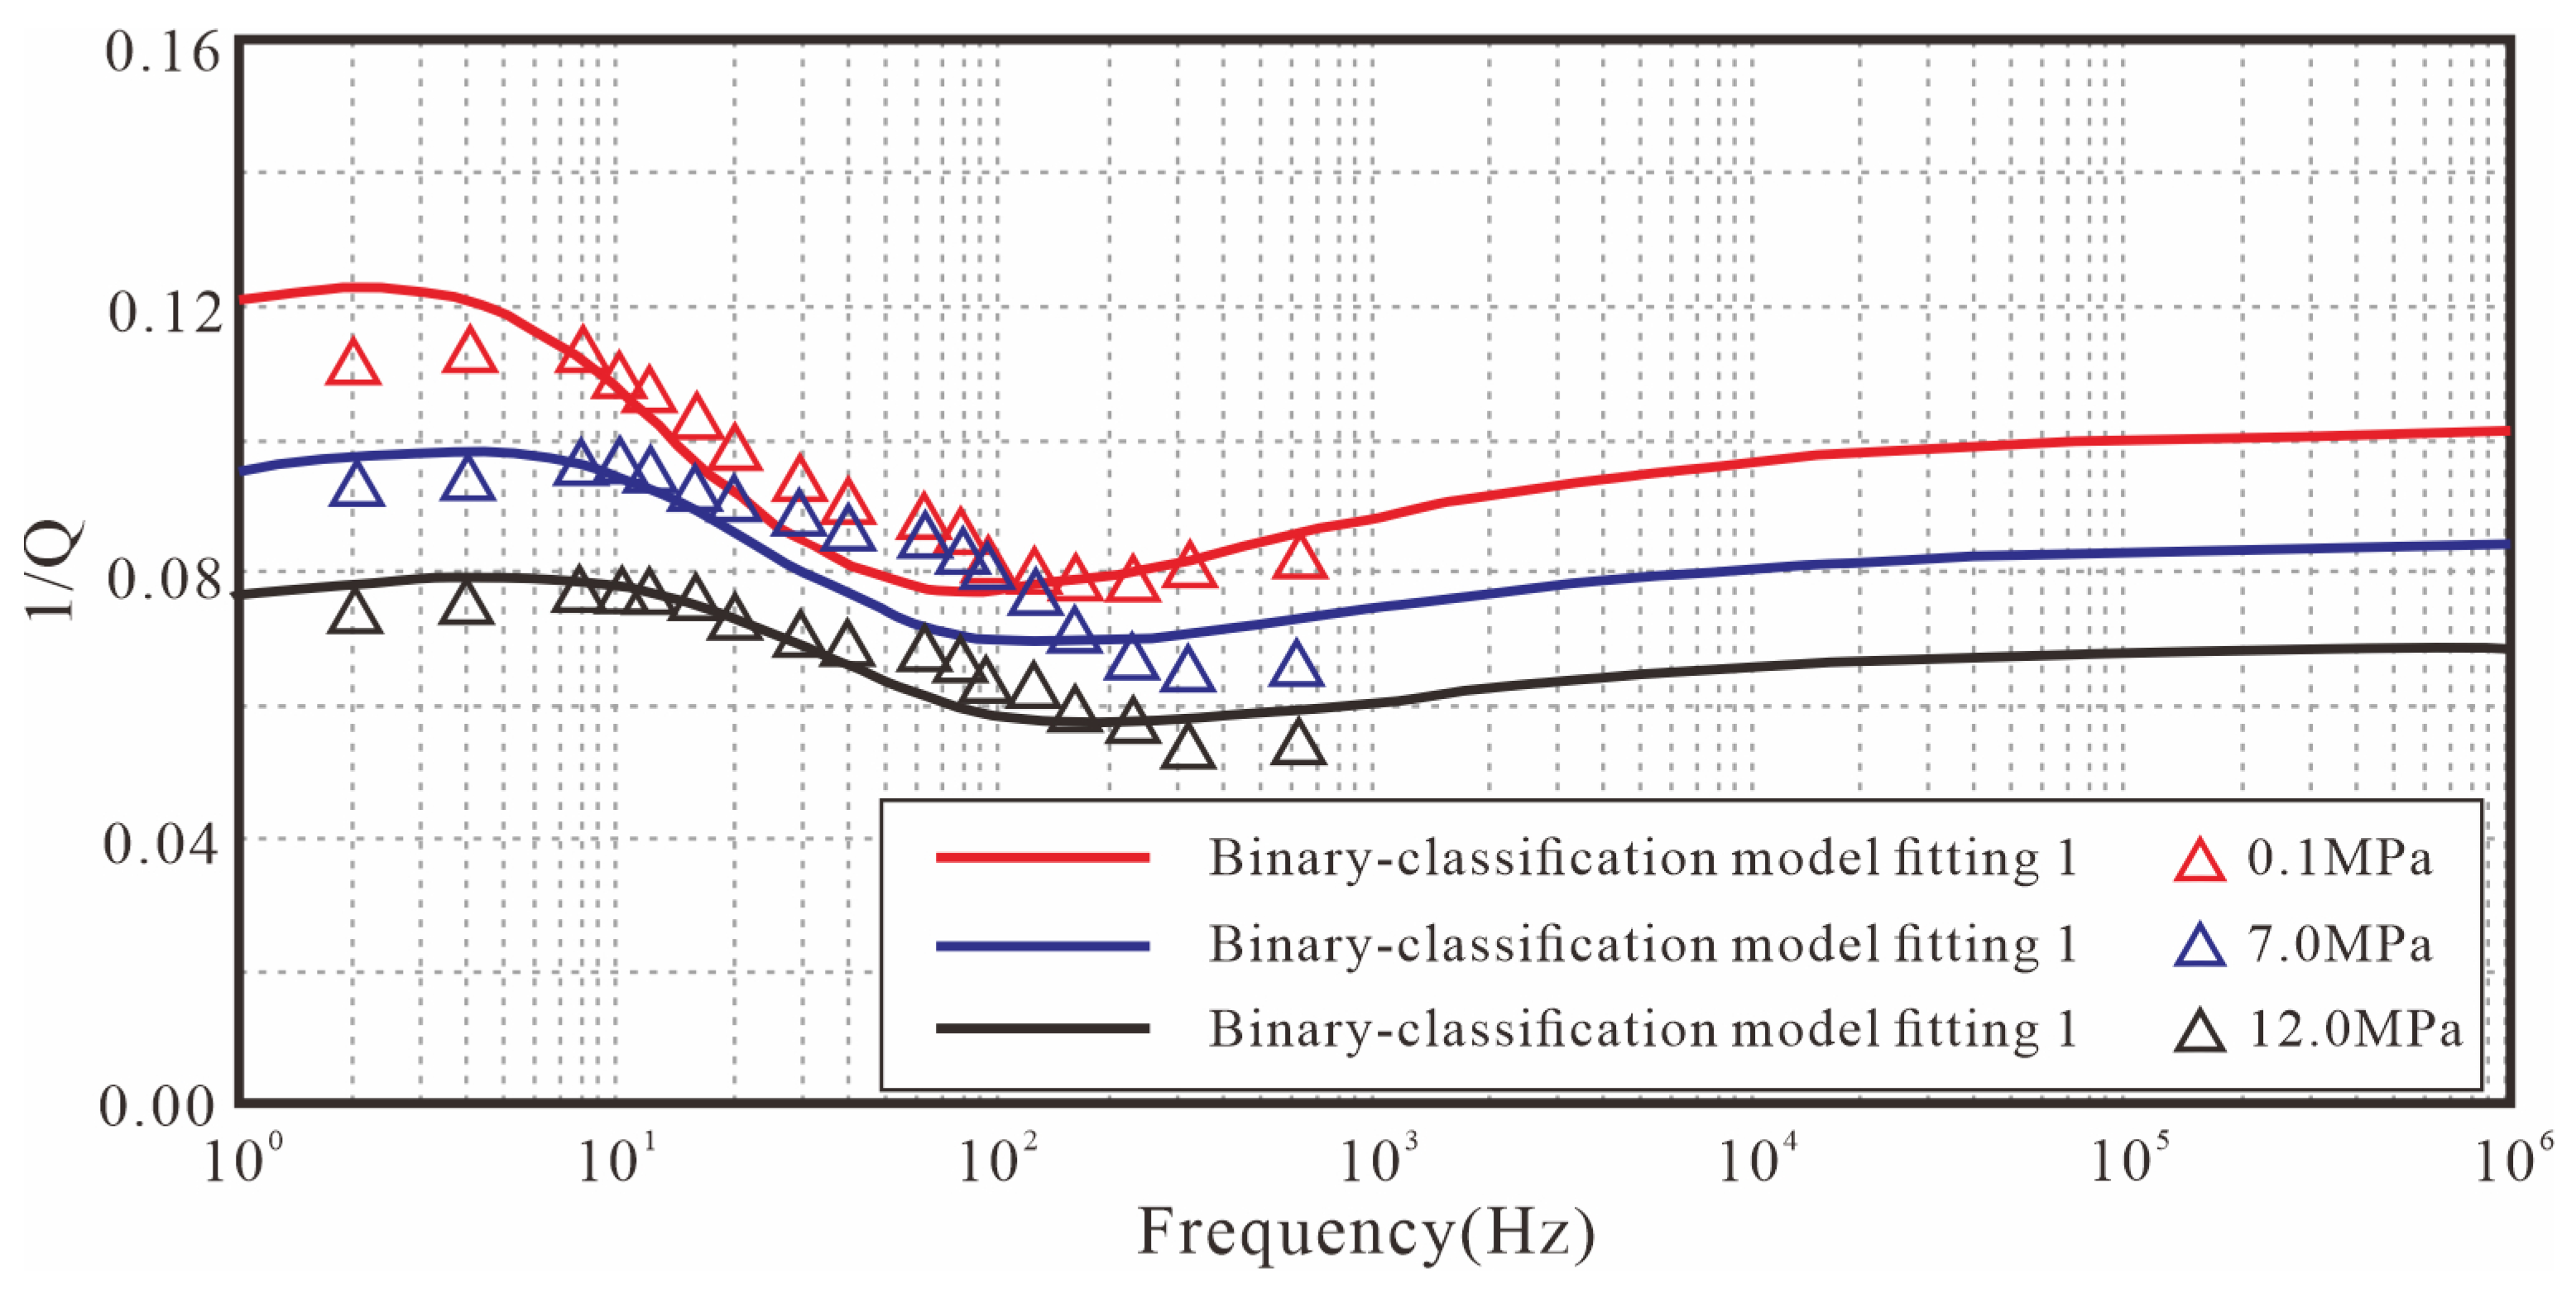
4.2. Fitting Results and Analysis of Partially Saturated Coal Samples Under Variable Confining Pressure Conditions
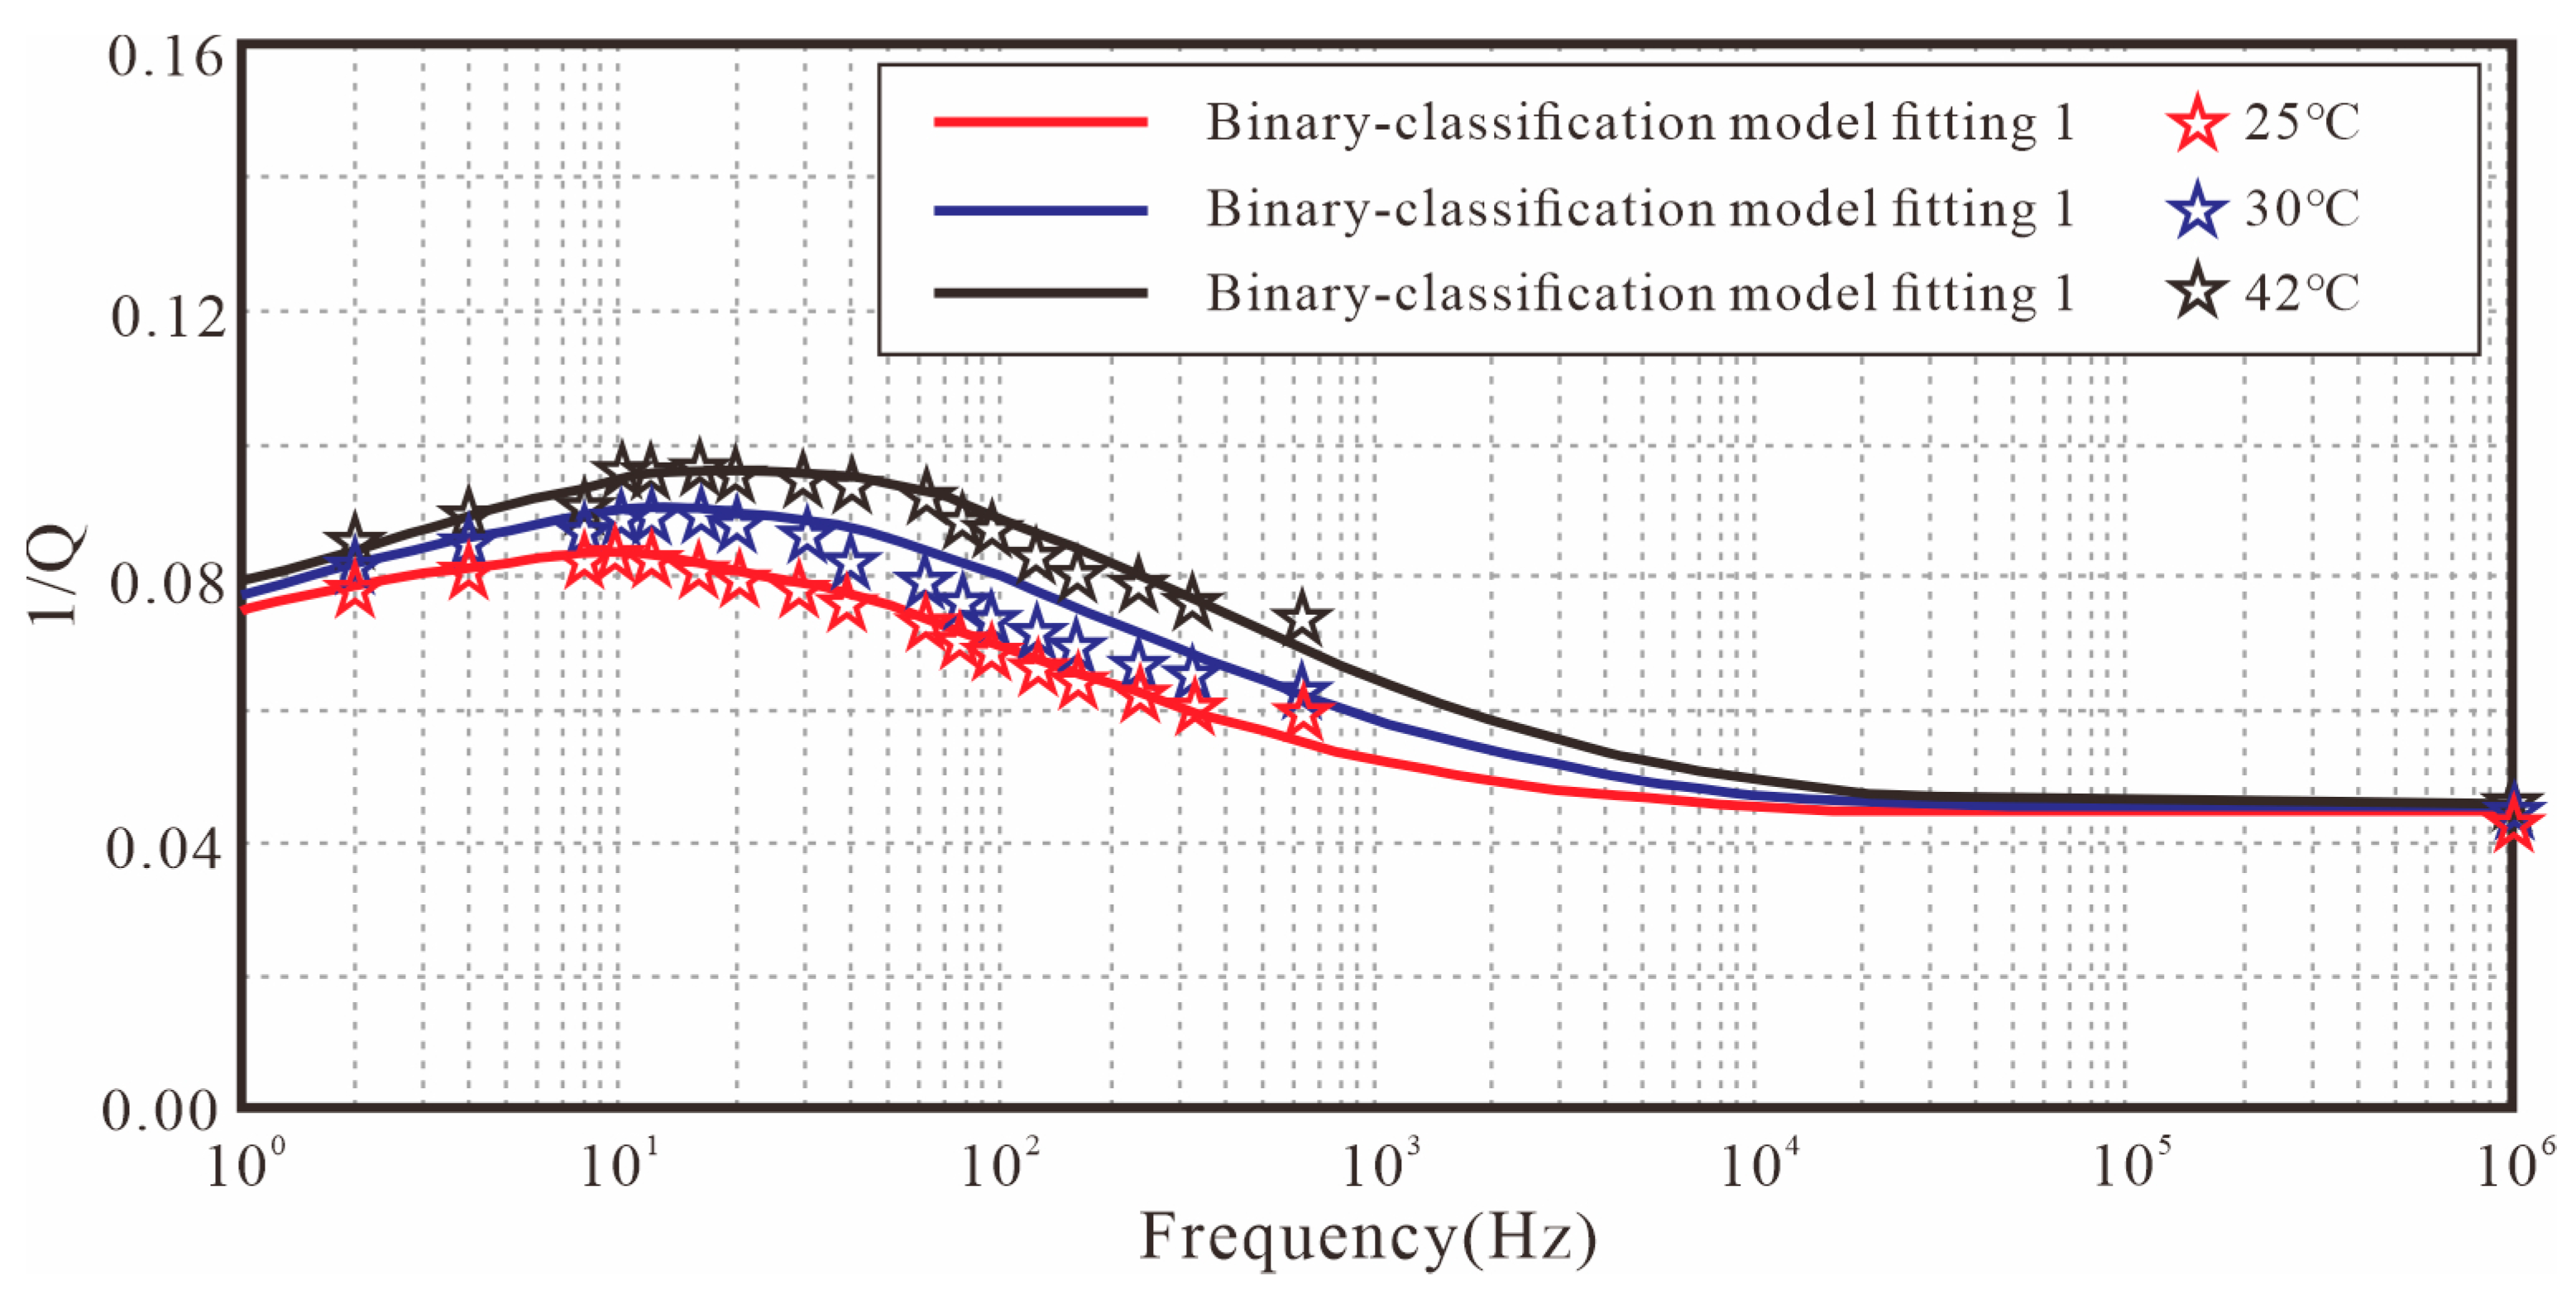
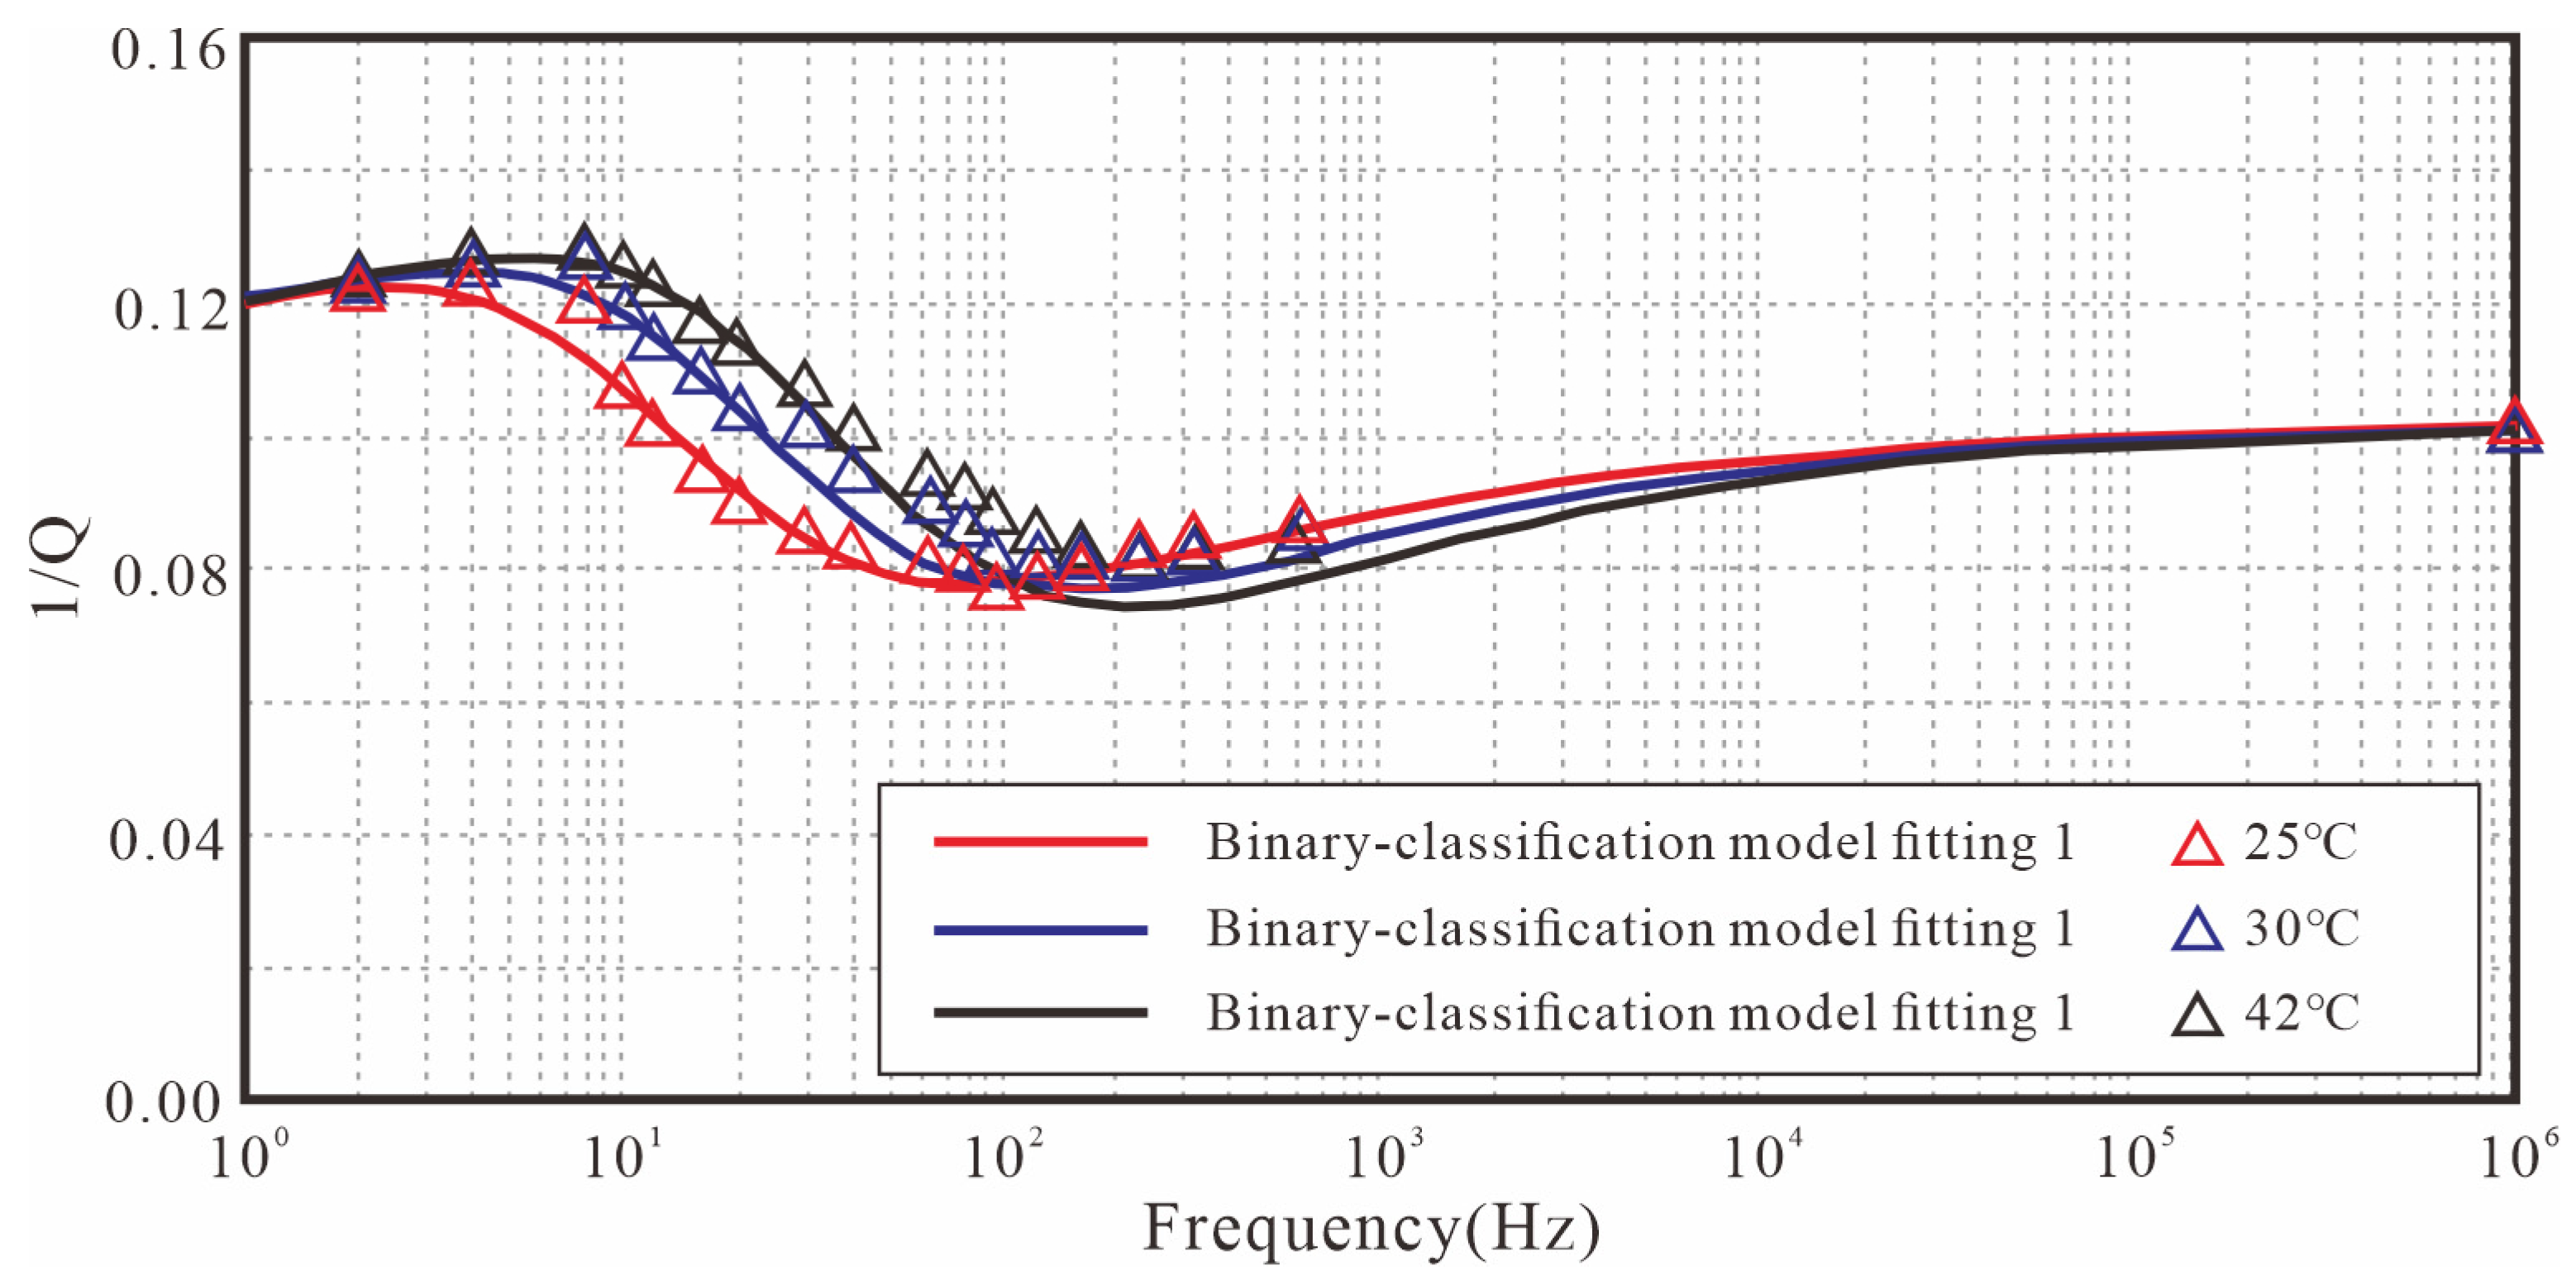
4.3. Fitting Effects and Analysis of Partially Saturated Coal Samples Under Variable Temperature Conditions
5. Conclusions
Author Contributions
Funding
Data Availability Statement
Acknowledgments
Conflicts of Interest
References
- Sun, J.; Zhu, T. Strategies for stable attenuation compensation in reverse-time migration. Geophys. Prospect. 2018, 66, 498–511. [Google Scholar] [CrossRef]
- Brajanovski, M.; Mueller, T.M.; Parra, J.O. A rock physics model for fractured and patchy-saturated reservoirs. In Proceedings of the EAGE/SEG Research Workshop on Fractured Reservoirs-Integrating Geosciences for Fractured Reservoirs Description 2007, Perugia, Italy, 3–6 September 2007. [Google Scholar] [CrossRef]
- Qi, Q.; Müller, T.M.; Gurevich, B.; Lopes, S.; Lebedev, M.; Caspari, E. Quantifying the effect of capillarity on attenuation and dispersion in patchy-saturated rocks. Geophysics 2014, 79, WB35–WB50. [Google Scholar] [CrossRef]
- Wang, P.; Chen, X.; Li, X.; Cui, Y.-A.; Li, J. Moduli variations in two-phase fluid rocks considering squirt flow and patchy saturation. J. Pet. Sci. Eng. 2021, 206, 109041. [Google Scholar] [CrossRef]
- Solazzi, S.G.; Castromán, G.A.; Barbosa, N.D.; Holliger, K.; Rubino, J.G. Acoustic response of patchy-saturated porous media: Coupling biot’s poroelasticity equations for mono- and biphasic pore fluids. J. Acoust. Soc. Am. 2024, 156, 1324–1342. [Google Scholar] [CrossRef] [PubMed]
- Zhang, L.; Ba, J.; Fu, L.; Carcione, J.M.; Cao, C. Estimation of pore microstructure by using the static and dynamic moduli. Int. J. Rock Mech. Min. Sci. 2019, 113, 24–30. [Google Scholar] [CrossRef]
- Guo, Z.; Qin, X.; Zhang, Y.; Niu, C.; Wang, D.; Ling, Y. Numerical investigation of the effect of heterogeneous pore structures on elastic properties of tight gas sandstones. Front. Earth Sci. 2021, 9, 641637. [Google Scholar] [CrossRef]
- Chapman, M.; Zatsepin, S.V.; Crampin, S. Derivation of a microstructural poroelastic model. Geophys. J. Int. 2002, 151, 427–451. [Google Scholar] [CrossRef]
- Huang, Q.; Han, D.-H.; Yuan, H.; Wei, Q.; Sun, M. Velocity dispersion and wave attenuation of berea sandstone at different saturations and pressures in seismic frequency band. In Proceedings of the 2017 SEG International Exposition and Annual Meeting, Houston, TX, USA, 24–29 September 2017; pp. 3574–3578. [Google Scholar] [CrossRef]
- Wei, G.; Liu, H.; Wang, X.; Li, M.; Yang, H. Low-frequency experiments on tight sandstone cores of buried hill and its dispersion characteristics in the seismic frequency band. In Proceedings of the Rock Physics and Digital Rock Applications Workshop, Beijing, China, 20–22 May 2018; pp. 29–32. [Google Scholar] [CrossRef]
- Lozovyi, S.; Bauer, A. From static to dynamic stiffness of shales: Frequency and stress dependence. Rock Mech. Rock Eng. 2019, 52, 5085–5098. [Google Scholar] [CrossRef]
- Han, X.; Wang, S.; Tang, G.; Dong, C.; He, Y.; Liu, T.; Zhao, L.; Sun, C. Coupled effects of pressure and frequency on velocities of tight sandstones saturated with fluids: Measurements and rock physics modelling. Geophys. J. Int. 2021, 226, 1308–1321. [Google Scholar] [CrossRef]
- Pride, S.R.; Berryman, J.G.; Harris, J.M. Seismic attenuation due to wave-induced flow. J. Geophys. Res. Solid Earth 2004, 109, B01201. [Google Scholar] [CrossRef]
- Ba, J.; Xu, W.H.; Fu, L.Y.; Carcione, J.M.; Zhang, L. Rock anelasticity due to patchy saturation and fabric heterogeneity: A double double-porosity model of wave propagation. J. Geophys. Res. Solid Earth 2017, 122, 1949–1976. [Google Scholar] [CrossRef]
- Hu, K.X.; Zhu, K.Q. Mechanical analogies of fractional elements. Chin. Phys. Lett. 2009, 26, 108301. [Google Scholar] [CrossRef]
- McDonal, F.J.; Angona, F.A.; Mills, R.L.; Sengbush, R.L.; Nostrand, R.G.V.; White, J.E. Attenuation of shear and compressional waves in pierre shale. Geophysics 1958, 23, 421–439. [Google Scholar] [CrossRef]
- Emmerich, H.; Korn, M. Incorporation of attenuation into time-domain computations of seismic wave fields. Geophysics 1987, 52, 1252–1264. [Google Scholar] [CrossRef]
- Blanch, J.O.; Robertsson, J.O.A.; Symes, W.W. Modeling of a constant q: Methodology and algorithm for an efficient and optimally inexpensive viscoelastic technique. Geophysics 1995, 60, 176–184. [Google Scholar] [CrossRef]
- Moczo, P.; Kristek, J. On the rheological models used for time-domain methods of seismic wave propagation. Geophys. Res. Lett. 2005, 32, L01306. [Google Scholar] [CrossRef]
- Du, Q.Z. Wavefield forward modeling with the pseudo-spectral method in viscoelastic and azimuthally anisotropic media. Acta Phys. Sin. 2004, 53, 4428–4434. [Google Scholar] [CrossRef]
- He, H.B.; Wu, G.Z. Inverse of characterization parameters of the generalized flow variant constant-q model. Oil Geophys. Prospect. 2016, 51, 9. [Google Scholar] [CrossRef]
- Chang, X.W.; Cao, D.P.; Liang, K.; Yin, X.Y. Forward modeling of elastic wave in 3d viscoelastic medium based on high order generalized standard linear body model. Prog. Geophys. 2019, 34, 1010–1016. [Google Scholar] [CrossRef]
- Nie, J.-X.; Ba, J.; Yang, D.-H.; Yan, X.-F.; Yuan, Z.-Y.; Qiao, H.-P. Bisq model based on a kelvin-voigt viscoelastic frame in a partially saturated porous medium. Appl. Geophys. 2012, 9, 213–222. [Google Scholar] [CrossRef]
- Shahidi, M.; Pichler, B.; Hellmich, C. Interfacial micromechanics assessment of classical rheological models. I: Single interface size and viscosity. J. Eng. Mech. 2016, 142, 04015092. [Google Scholar] [CrossRef]
- Hao, Q.; Greenhalgh, S. The generalized standard-linear-solid model and the corresponding viscoacoustic wave equations revisited. Geophys. J. Int. 2019, 219, 1939–1947. [Google Scholar] [CrossRef]
- Chang, Z.; Gao, H.; Huang, F.; Chen, J.; Huang, J.; Guo, Z. Study on the creep behaviours and the improved burgers model of a loess landslide considering matric suction. Nat. Hazards 2020, 103, 1479–1497. [Google Scholar] [CrossRef]
- Subramaniyan, S.; Quintal, B.; Madonna, C.; Saenger, E.H. Laboratory-based seismic attenuation in fontainebleau sandstone: Evidence of squirt flow. J. Geophys. Res. Solid Earth 2015, 120, 7526–7535. [Google Scholar] [CrossRef]
- Subramaniyan, S.; Quintal, B.; Saenger, E.H. Forced oscillation measurements of seismic attenuation in fluid saturated sandstone. Acta Geophys. 2017, 65, 165–172. [Google Scholar] [CrossRef]
- Chapman, S.; Borgomano, J.V.M.; Yin, H.; Fortin, J.; Quintal, B. Forced oscillation measurements of seismic wave attenuation and stiffness moduli dispersion in glycerine-saturated berea sandstone. Geophys. Prospect. 2019, 67, 956–968. [Google Scholar] [CrossRef]
- Zhao, L.M.; Tang, G.Y.; Sun, C.; Zhao, J.G.; Wang, S.X. Dual attenuation peaks revealing mesoscopic and microscopic fluid flow in partially oil-saturated fontainebleau sandstones. Geophys. J. Int. 2020, 224, 1670–1683. [Google Scholar] [CrossRef]
- Wang, N.; Zhou, H.; Chen, H.M.; Xia, M.M.; Wang, S.C.; Fang, J.W.; Sun, P.Y. A constant fractional-order viscoelastic wave equation and its numerical simulation scheme. Geophysics 2018, 83, T39–T48. [Google Scholar] [CrossRef]
- Caputo, M.; Mainardi, F. New dissipation model based on memory mechanism. Pure Appl. Geophys. 1976, 91, 134–147. [Google Scholar] [CrossRef]
- Kjartansson, E. Constant q-wave propagation and attenuation. J. Geophys. Res. Solid Earth 1979, 84, 4737–4748. [Google Scholar] [CrossRef]
- Carcione, J.M. Theory and modeling of constant-q p- and s-waves using fractional time derivatives. Geophysics 2009, 74, T1–T11. [Google Scholar] [CrossRef]
- Chen, W.; Holm, S. Fractional laplacian time-space models for linear and nonlinear lossy media exhibiting arbitrary frequency power-law dependency. J. Acoust. Soc. Am. 2004, 115, 1424–1430. [Google Scholar] [CrossRef]
- Zhu, T.; Harris, J.M. Modeling acoustic wave propagation in heterogeneous attenuating media using decoupled fractional laplacians. Geophysics 2014, 79, T105–T116. [Google Scholar] [CrossRef]
- Chen, H.; Zhou, H.; Jiang, S.; Rao, Y. Fractional laplacian viscoacoustic wave equation low-rank temporal extrapolation. IEEE Access 2019, 7, 93187–93197. [Google Scholar] [CrossRef]
- Chen, H.; Zhou, H.; Li, Q.; Wang, Y. Two efficient modeling schemes for fractional laplacian viscoacoustic wave equation. Geophysics 2016, 81, T233–T249. [Google Scholar] [CrossRef]
- Xue, Z.G.; Baek, H.; Zhang, H.Z.; Zhao, Y.; Zhu, T.Y.; Fomel, S. Solving fractional laplacian viscoelastic wave equations using domain decomposition. In Proceedings of the 2018 SEG International Exposition and Annual Meeting, Anaheim, CA, USA, 14–19 October 2018. [Google Scholar] [CrossRef]
- Yao, J.; Zhu, T.Y.; Hussain, F.; Kouri, D.J. Locally solving fractional laplacian viscoacoustic wave equation using hermite distributed approximating functional method. Geophysics 2017, 82, T59–T67. [Google Scholar] [CrossRef]
- Fomel, S.; Ying, L.X.; Song, X.L. Seismic wave extrapolation using lowrank symbol approximation. Geophys. Prospect. 2013, 61, 526–536. [Google Scholar] [CrossRef]
- Song, X.L.; Fomel, S.; Ying, L.X. Lowrank finite-differences and lowrank fourier finite-differences for seismic wave extrapolation in the acoustic approximation. Geophys. J. Int. 2013, 193, 960–969. [Google Scholar] [CrossRef]
- Zhu, T.Y.; Carcione, J.M. Theory and modelling of constant-q p- and s-waves using fractional spatial derivatives. Geophys. J. Int. 2013, 196, 1787–1795. [Google Scholar] [CrossRef]
- Zhang, L.; Ba, J.; Carcione, J.M. Wave propagation in infinituple-porosity media. J. Geophys. Res. Solid Earth 2021, 126, e2020JB021266. [Google Scholar] [CrossRef]
- Yin, Y.; Guo, J.; Peng, G.; Yu, X.; Kong, Y. Fractal operators and fractional dynamics with 1/2 order in biological systems. Fractal Fract. 2022, 6, 378. [Google Scholar] [CrossRef]
- Yin, Y.; Peng, G.; Yu, X. Algebraic equations and non-integer orders of fractal operators abstracted from biomechanics. Acta Mech. Sin. 2022, 38, 521488. [Google Scholar] [CrossRef]
- Guo, J.Q.; Yin, Y.J.; Ren, G.X. Abstraction and operator characterization of fractal ladder viscoelastic hyper-cell for ligaments and tendons. Appl. Math. Mech. 2019, 40, 1429–1448. [Google Scholar] [CrossRef]
- Zhao, T.L.; Zou, G.G.; Peng, S.P.; Zeng, H.; Gong, F.; Yin, Y.J. Analysis of the viscoelasticity in coal based on the fractal theory. Geophysics 2023, 88, WA177–WA187. [Google Scholar] [CrossRef]
- Dong, J.; Cheng, Y.; Hu, B.; Hao, C.; Tu, Q.; Liu, Z. Experimental study of the mechanical properties of intact and tectonic coal via compression of a single particle. Powder Technol. 2018, 325, 412–419. [Google Scholar] [CrossRef]
- Peng, S.; Gao, Y.; Peng, X.; Zhang, S.; Zhao, G. Study on the rock physic parameters of coal bearing strata in huainan coalfield. J. China Coal Soc. 2004, 29, 177–181. [Google Scholar]
- Batzle, M.L.; Kumar, G.; Hofmann, R.; Duranti, L.; Adam, L. Seismic-frequency loss mechanisms: Direct observation. Lead. Edge 2014, 33, 656–662. [Google Scholar] [CrossRef]


| Models | Component Combination Mode | Complex Modulus | Quality Factor |
|---|---|---|---|
| Kelvin-Voigt model [23] | 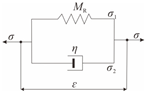 | ||
| Maxwell model [24] | 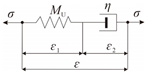 | ||
| Standard Linear Solid model [25] | 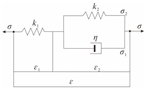 | ||
| Burgers model [26] |  |
| Figure Number | (Dimensionless) | (Dimensionless) | (Dimensionless) | (ms) |
|---|---|---|---|---|
| Figure 3 and Figure 4 | 0.025~0.055 | 0.2 | 0.3 | 1.667 |
| Figure 5 and Figure 6 | 0.03 | 0.1~0.2 | 0.3 | 1.667 |
| Figure 7 and Figure 8 | 0.03 | 0.3 | 0.1~0.2 | 1.667 |
| Sample | Coal Structure | Length (mm) | Diameter (mm) | Velocity (m/s) | Porosity (%) | Permeability (mD) |
|---|---|---|---|---|---|---|
| DT-1 | Primary coal | 64.980 | 37.207 | 2394.28 | 7.41 | 0.36 × 10⁻³ |
| DT-4 | Tectonic coal | 65.198 | 36.932 | 2108.13 | 11.23 | 60.7 × 10⁻³ |
| Sample | Confining Pressure (MPa) | (ms) | (Dimensionless) | (Dimensionless) | (Dimensionless) |
|---|---|---|---|---|---|
| DT-1 | 0.1 | 0.33 | 0.038 | 0.6 | 0.1 |
| DT-1 | 7 | 0.19 | 0.036 | 0.6 | 0.1 |
| DT-1 | 12 | 0.14 | 0.032 | 0.6 | 0.1 |
| DT-4 | 0.1 | 0.55 | 0.065 | 0.2 | 0.8 |
| DT-4 | 7 | 0.31 | 0.054 | 0.2 | 0.8 |
| DT-4 | 12 | 0.23 | 0.044 | 0.2 | 0.8 |
| Sample | Temperature (°C) | (ms) | (Dimensionless) | (Dimensionless) | (Dimensionless) |
|---|---|---|---|---|---|
| DT-1 | 25 | 0.33 | 0.038 | 0.6 | 0.1 |
| DT-1 | 30 | 0.28 | 0.039 | 0.6 | 0.1 |
| DT-1 | 42 | 0.22 | 0.040 | 0.6 | 0.1 |
| DT-4 | 25 | 0.55 | 0.065 | 0.2 | 0.8 |
| DT-4 | 30 | 0.33 | 0.0652 | 0.2 | 0.8 |
| DT-4 | 42 | 0.22 | 0.0654 | 0.2 | 0.8 |
Disclaimer/Publisher’s Note: The statements, opinions and data contained in all publications are solely those of the individual author(s) and contributor(s) and not of MDPI and/or the editor(s). MDPI and/or the editor(s) disclaim responsibility for any injury to people or property resulting from any ideas, methods, instructions or products referred to in the content. |
© 2025 by the authors. Licensee MDPI, Basel, Switzerland. This article is an open access article distributed under the terms and conditions of the Creative Commons Attribution (CC BY) license (https://creativecommons.org/licenses/by/4.0/).
Share and Cite
Zou, G.; Che, Y.; Zhao, T.; Yin, Y.; Peng, S.; She, J. Binary-Classification Physical Fractal Models in Different Coal Structures. Fractal Fract. 2025, 9, 450. https://doi.org/10.3390/fractalfract9070450
Zou G, Che Y, Zhao T, Yin Y, Peng S, She J. Binary-Classification Physical Fractal Models in Different Coal Structures. Fractal and Fractional. 2025; 9(7):450. https://doi.org/10.3390/fractalfract9070450
Chicago/Turabian StyleZou, Guangui, Yuyan Che, Tailang Zhao, Yajun Yin, Suping Peng, and Jiasheng She. 2025. "Binary-Classification Physical Fractal Models in Different Coal Structures" Fractal and Fractional 9, no. 7: 450. https://doi.org/10.3390/fractalfract9070450
APA StyleZou, G., Che, Y., Zhao, T., Yin, Y., Peng, S., & She, J. (2025). Binary-Classification Physical Fractal Models in Different Coal Structures. Fractal and Fractional, 9(7), 450. https://doi.org/10.3390/fractalfract9070450