
Pore-Throat Structure, Fractal Characteristics, and Main Controlling Factors in Extremely Low-Permeability Sandstone Reservoirs: The Case of Chang 3 Section in Huachi Area, Ordos Basin

Abstract
1. Introduction
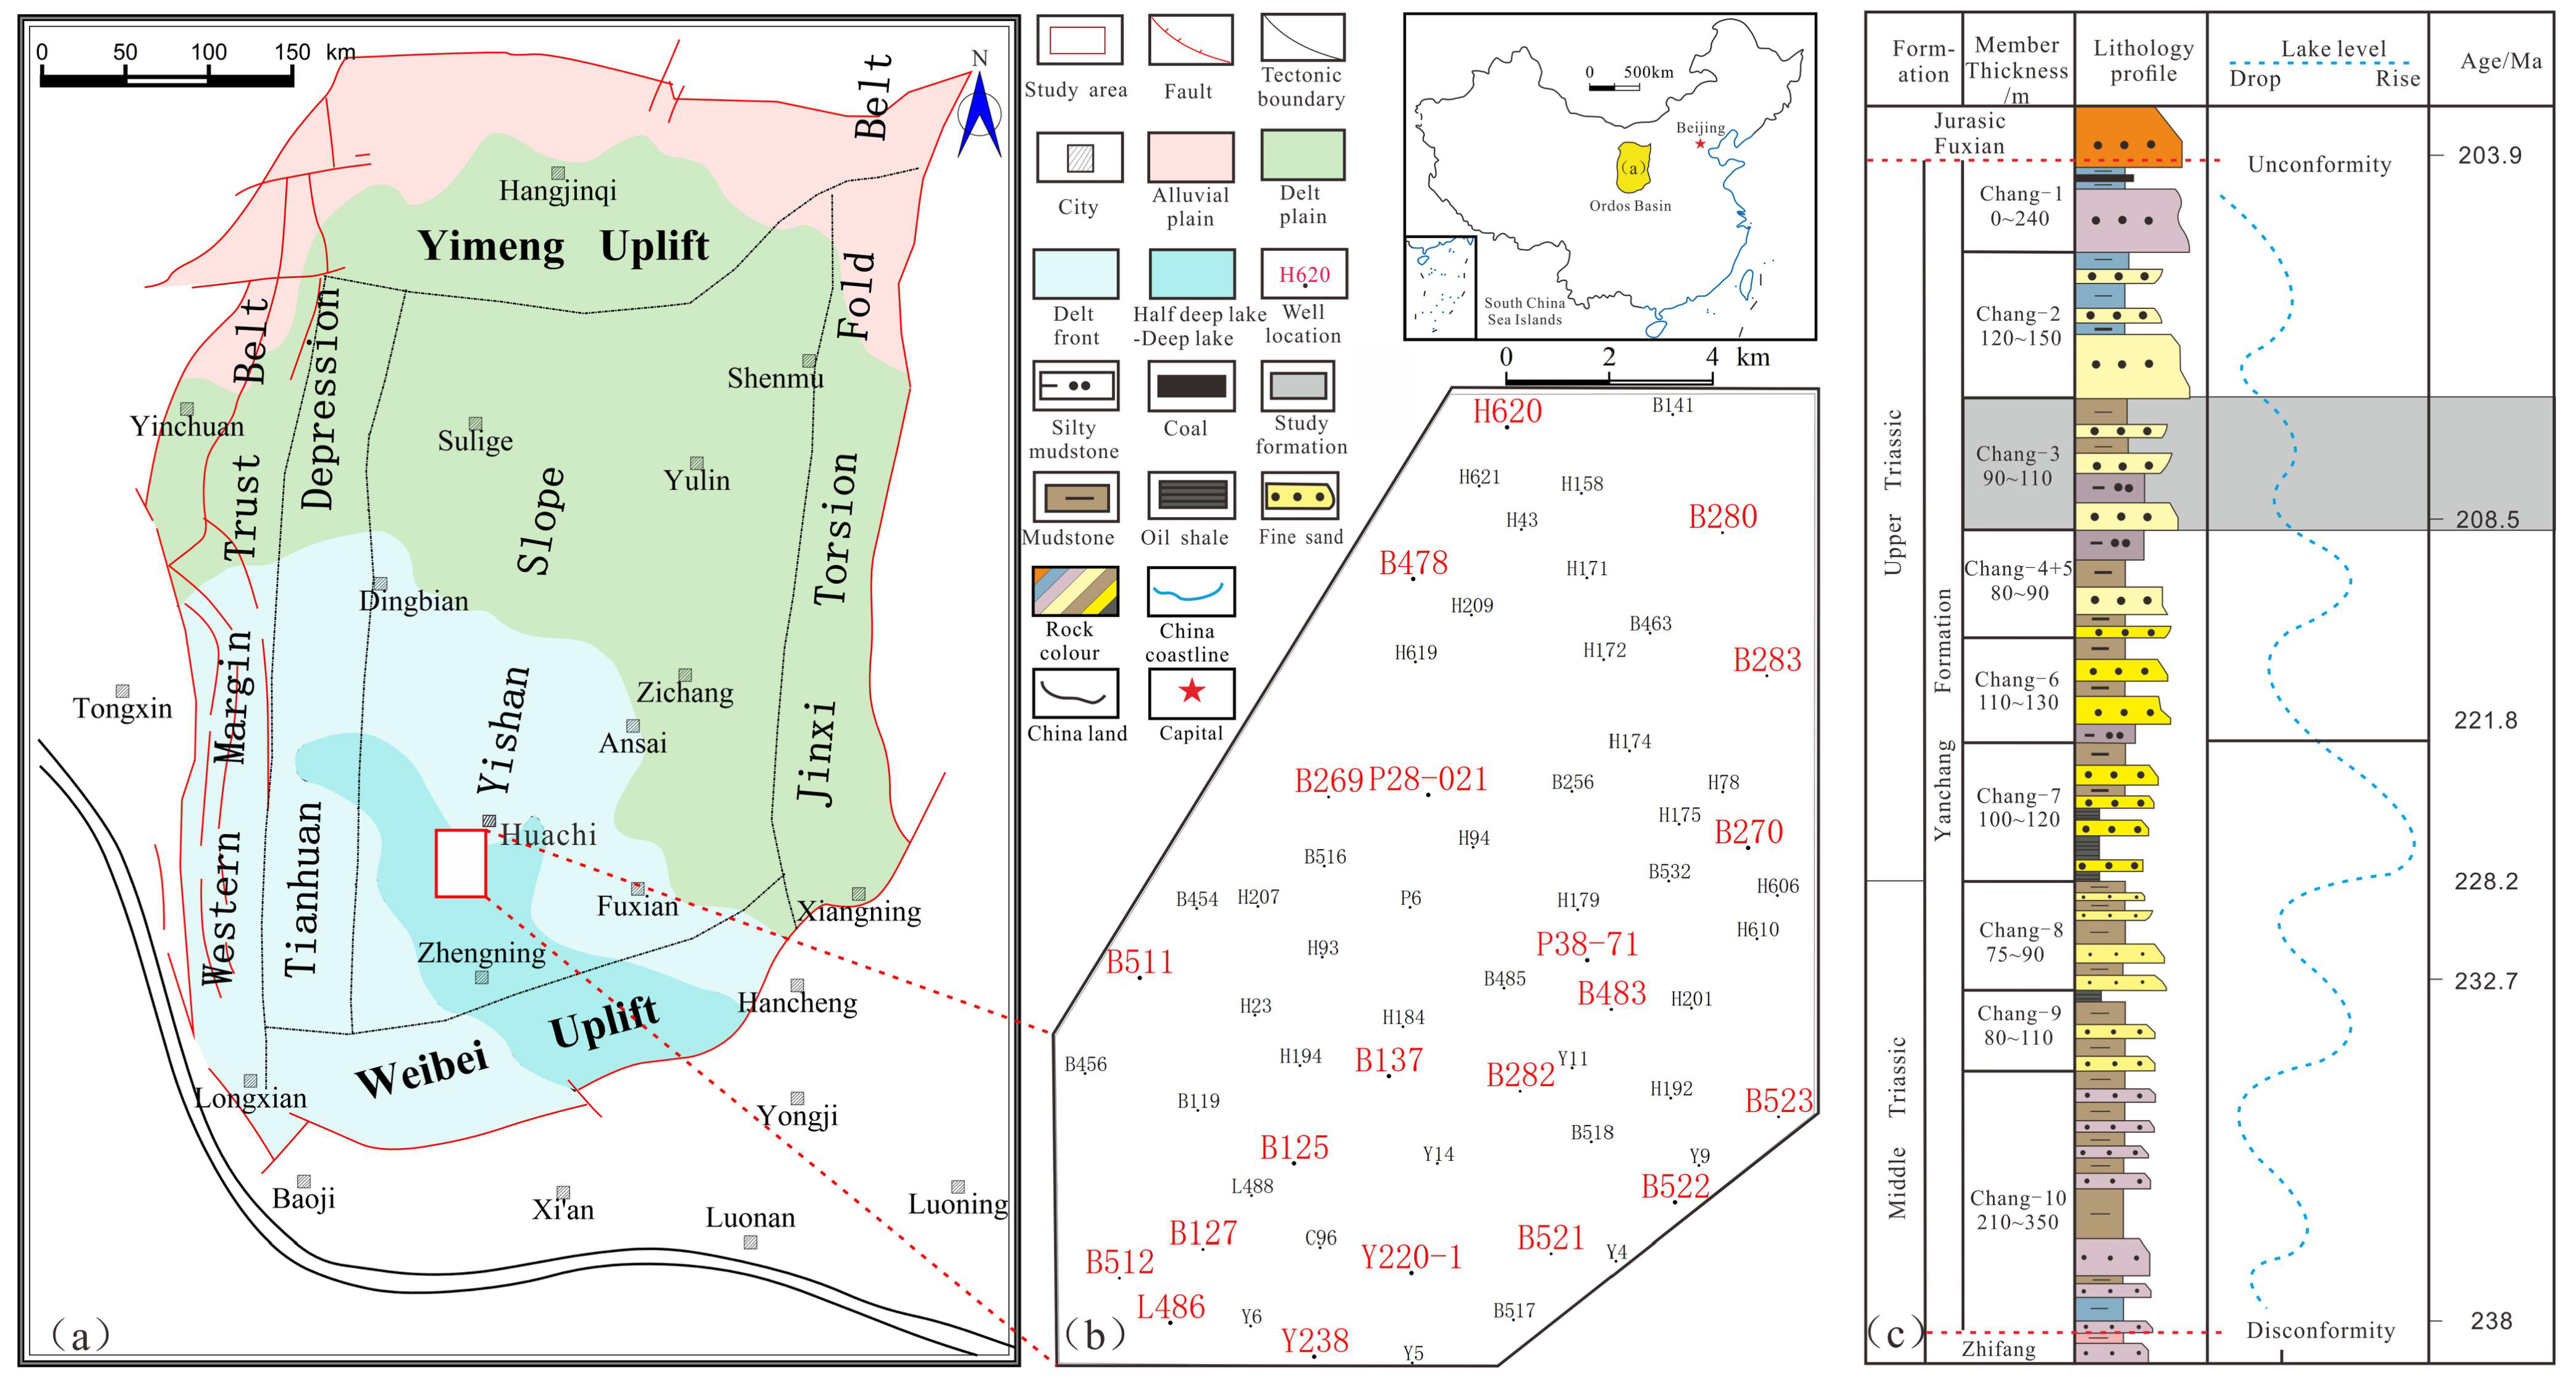
2. Geological Setting
3. Materials and Methods
3.1. Sampling and Processing
3.2. Experimental Measurements
3.3. Fractal Theory
4. Results
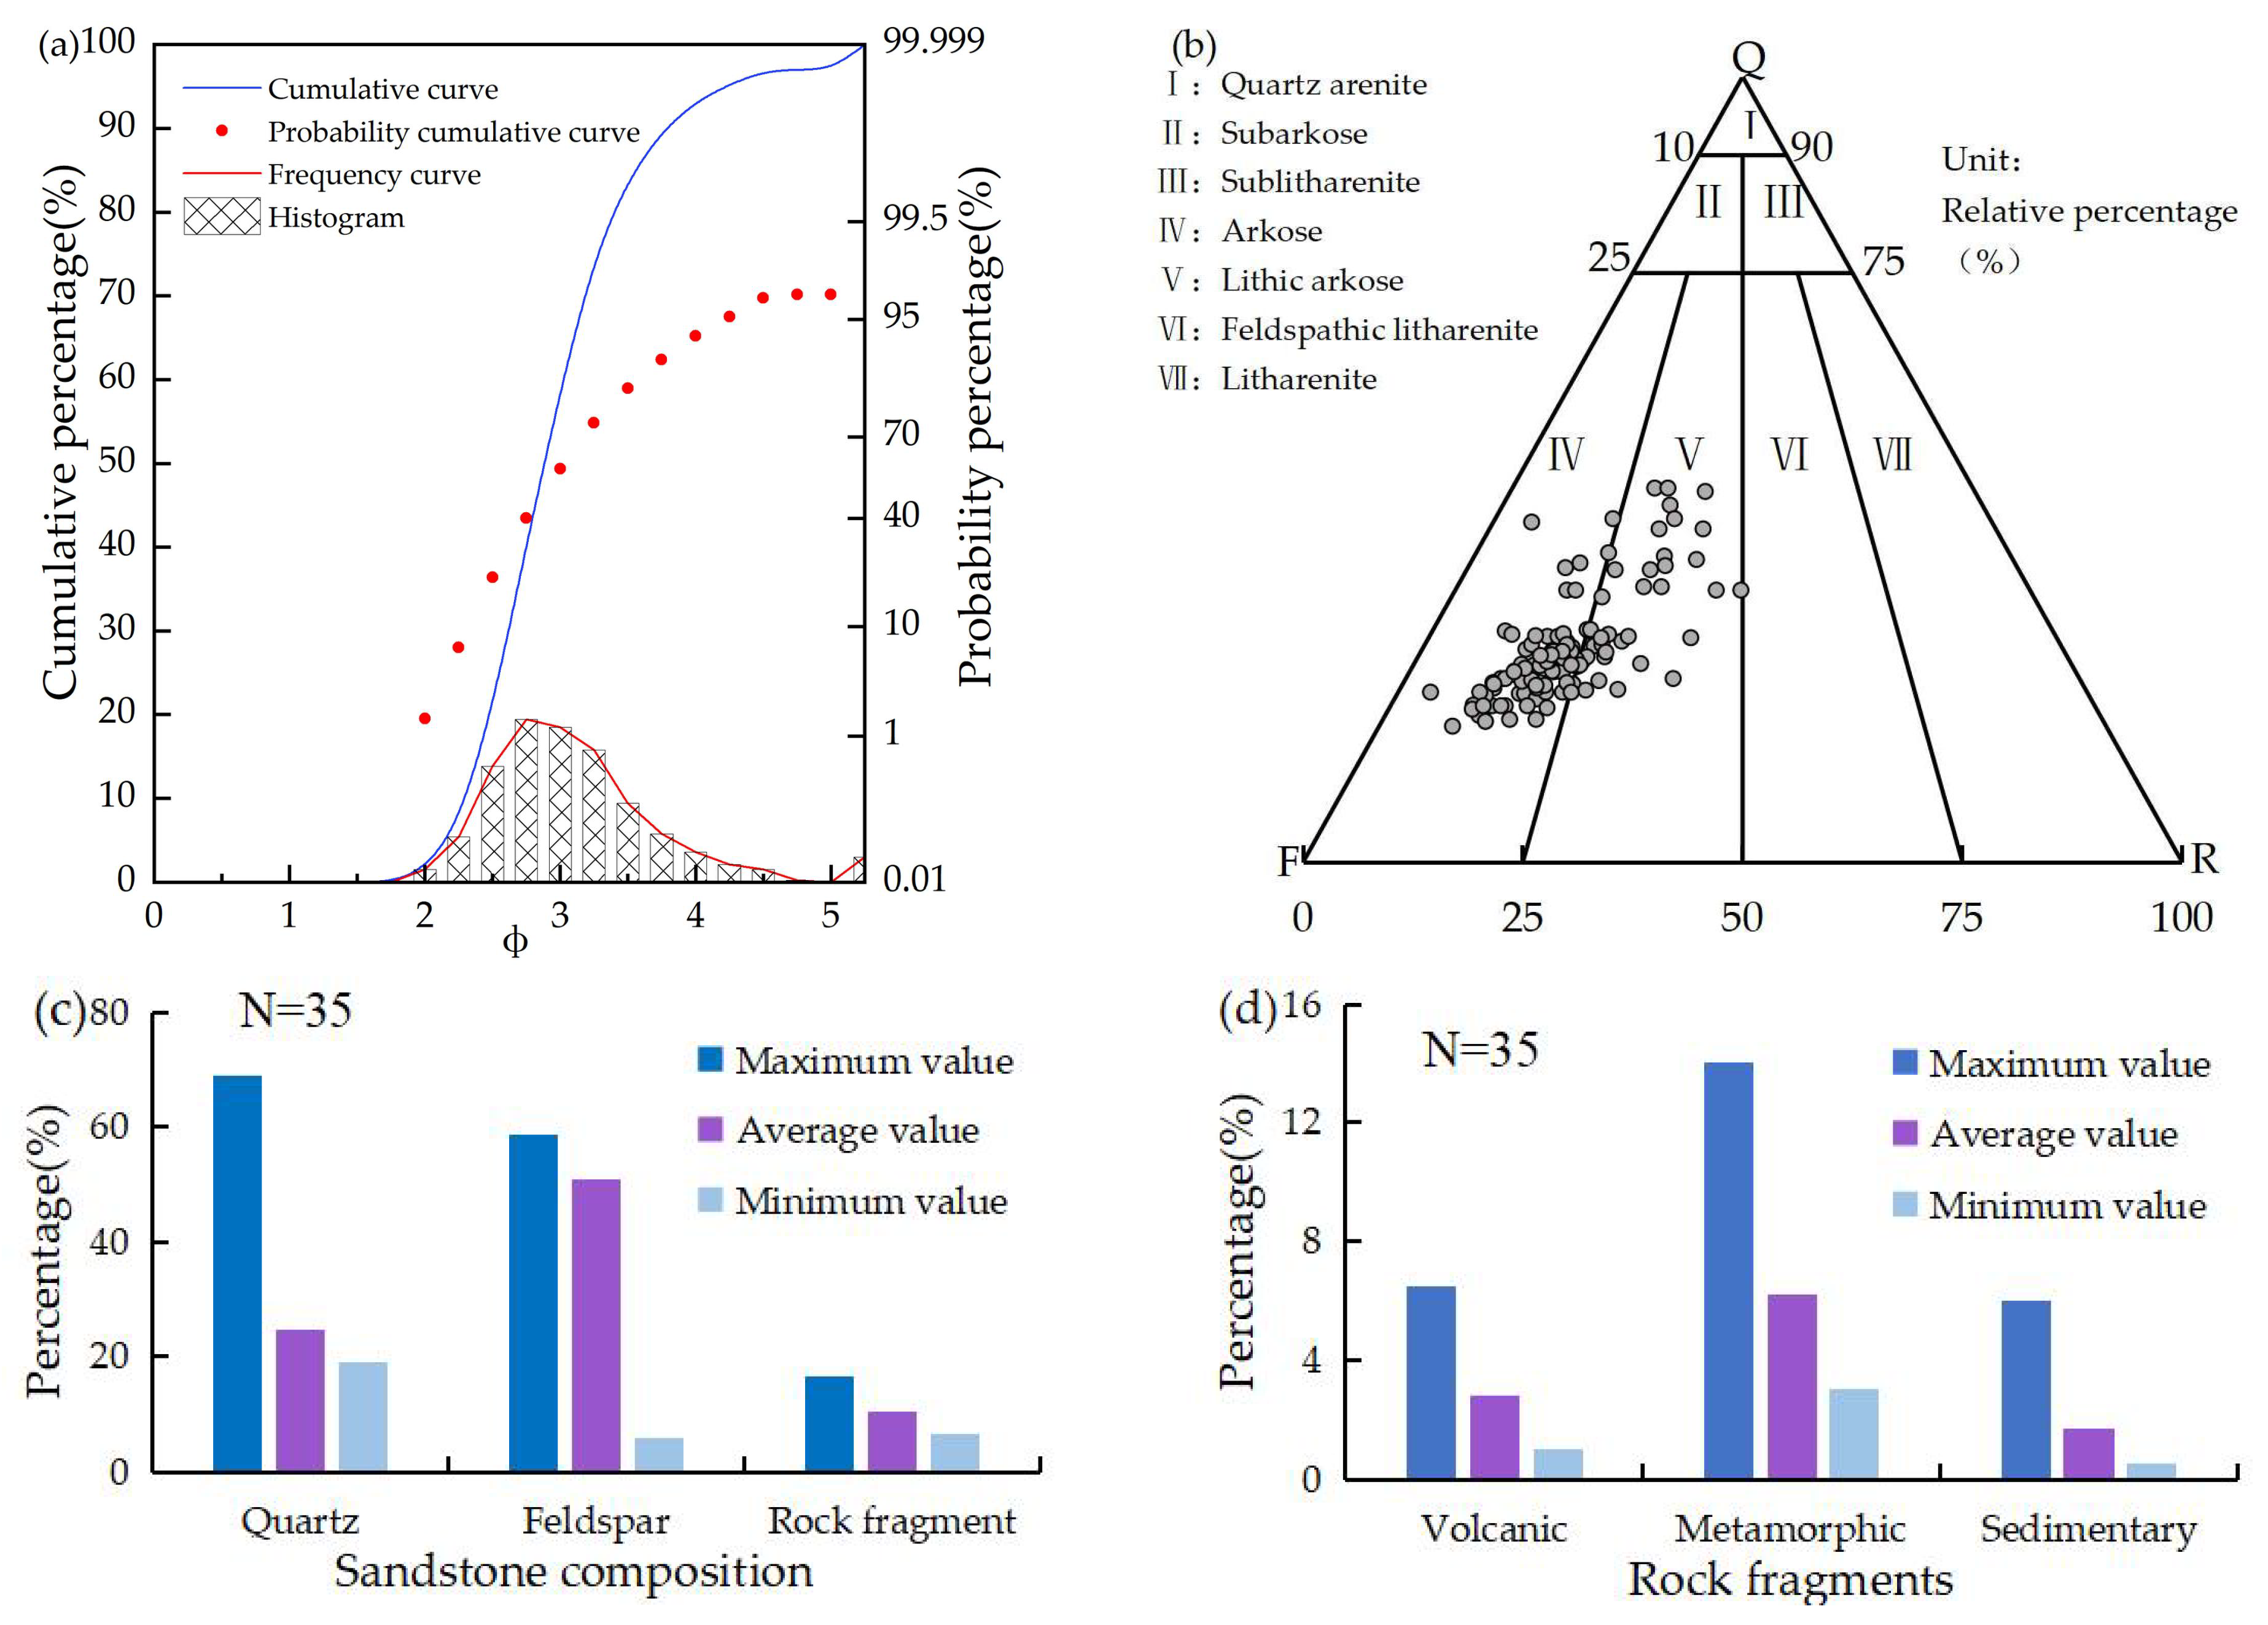
4.1. Mineral Composition and Petrophysical Characteristics
4.2. Characteristics of the Pore-Throat Network
4.3. Characteristics of the Pore-Throat Distribution
4.4. Fractal Features
4.4.1. Fractal Characteristics of HPMI and CRMI
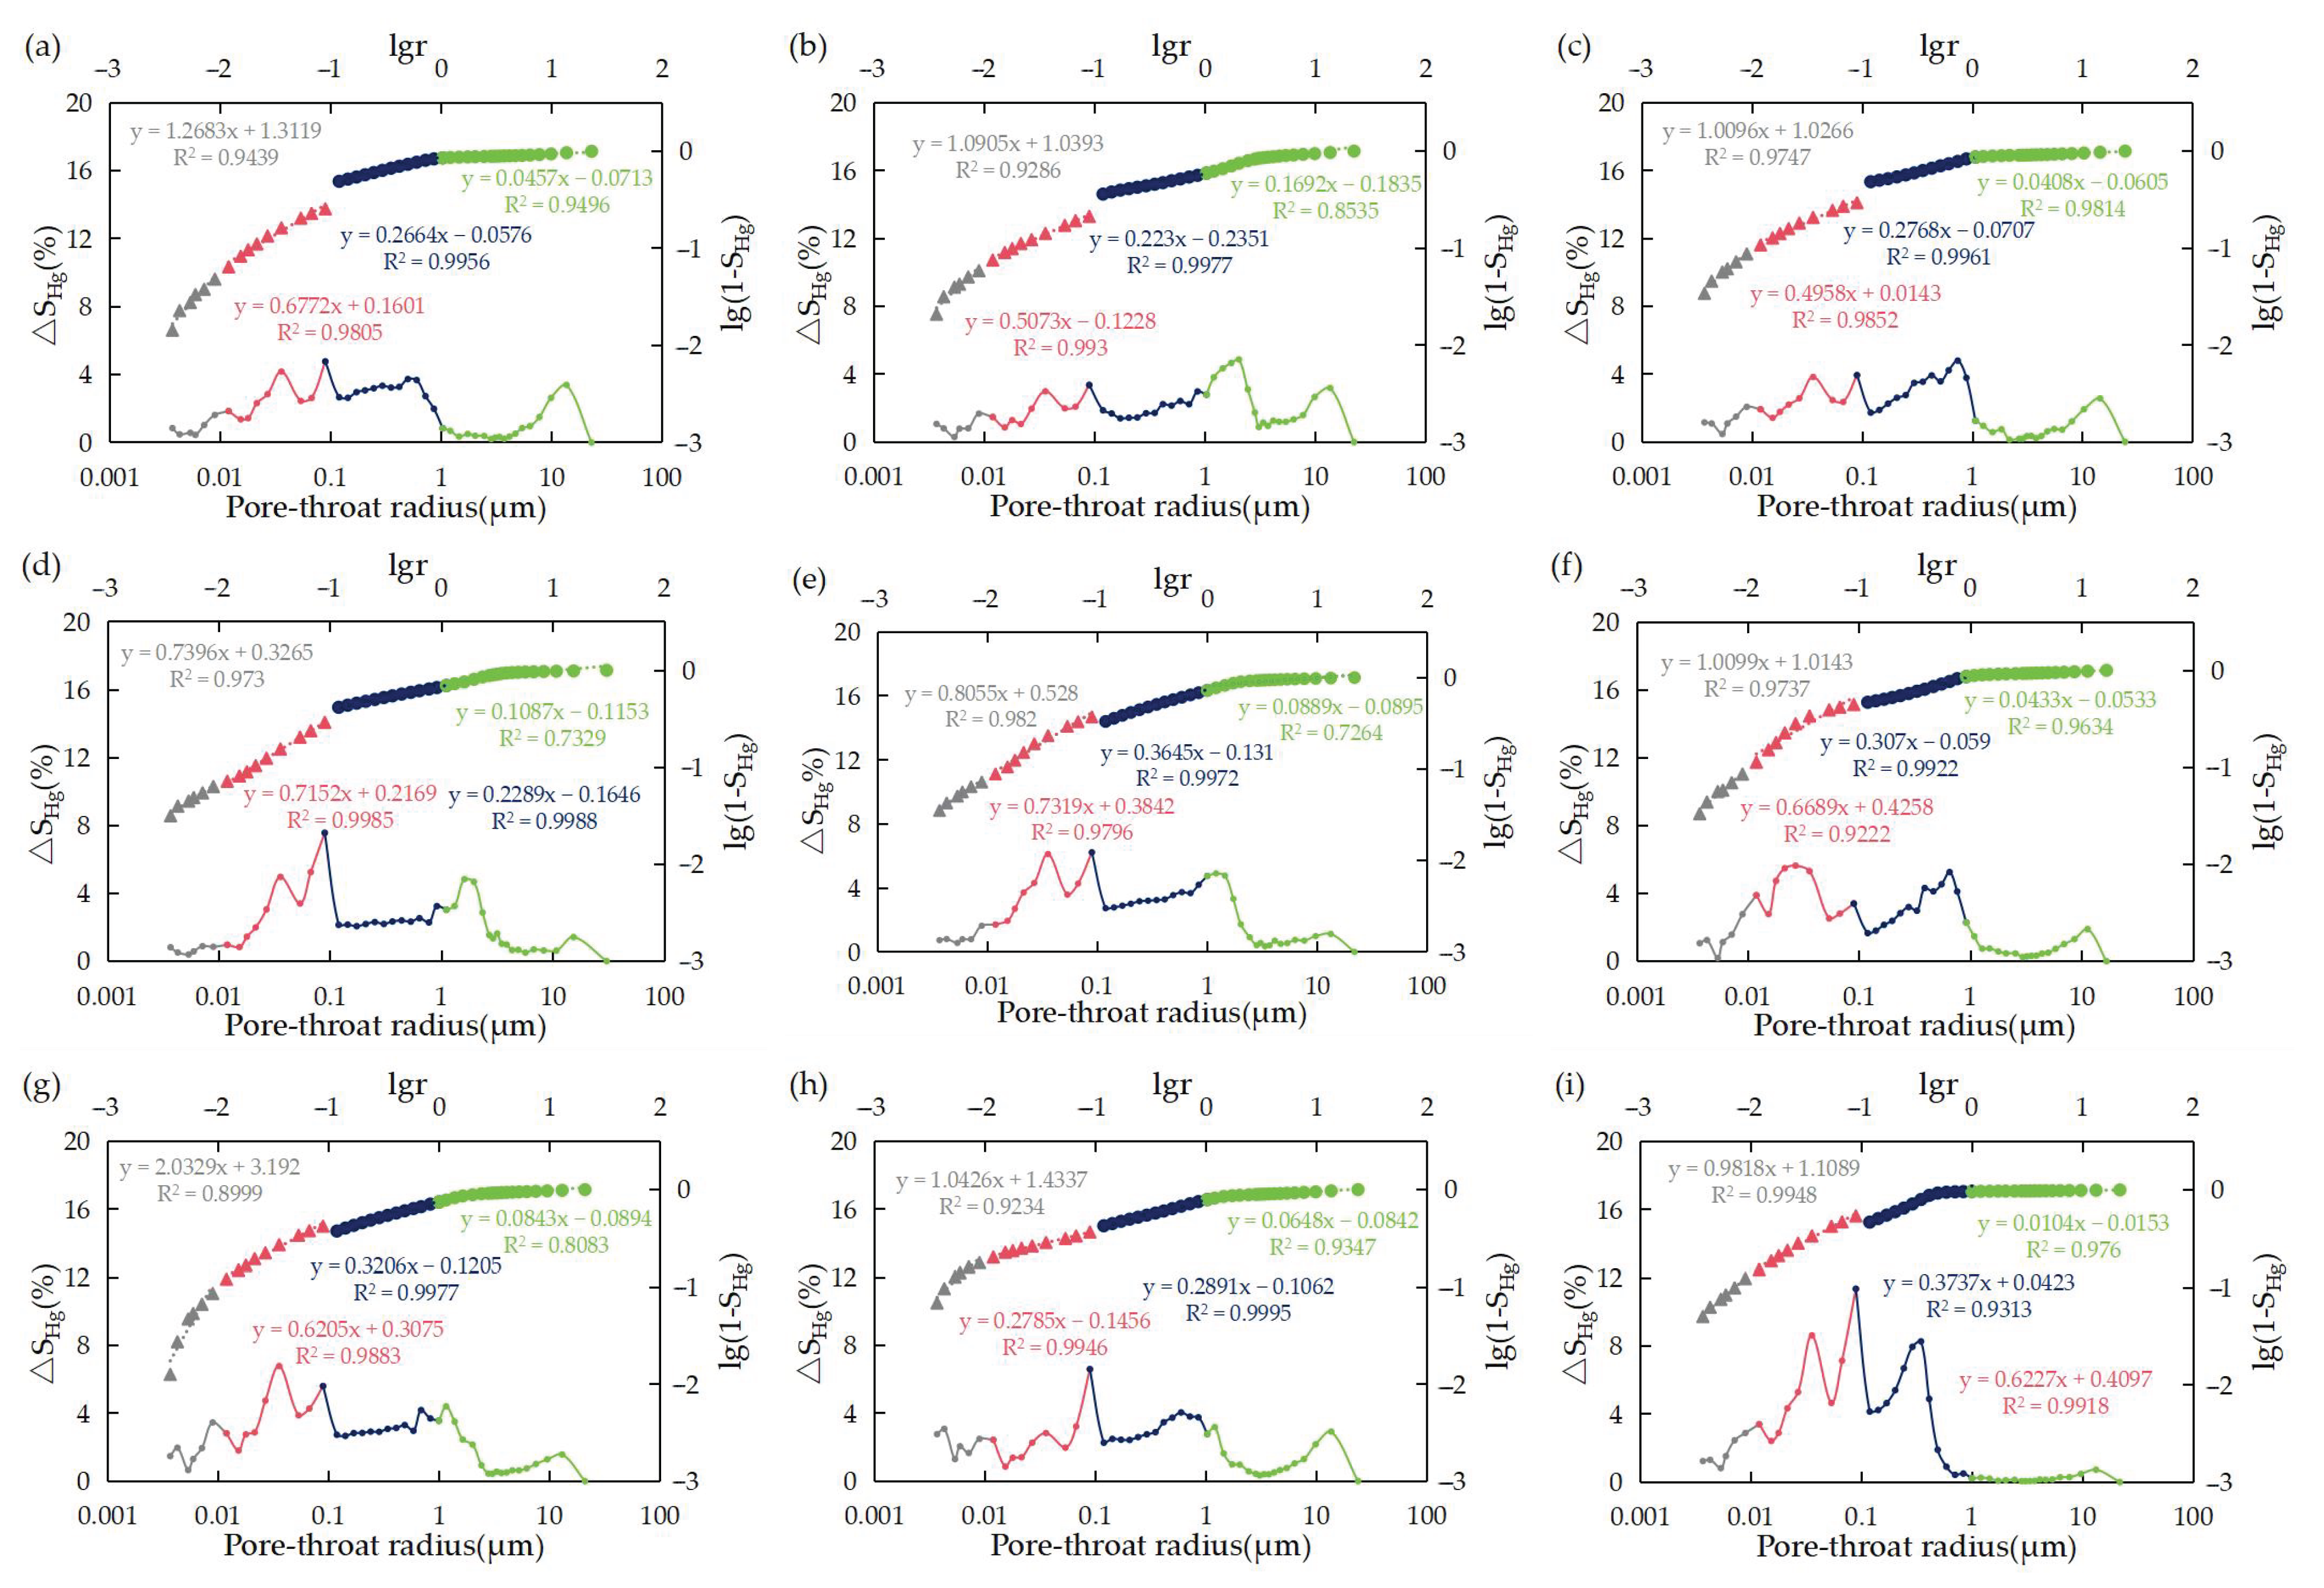
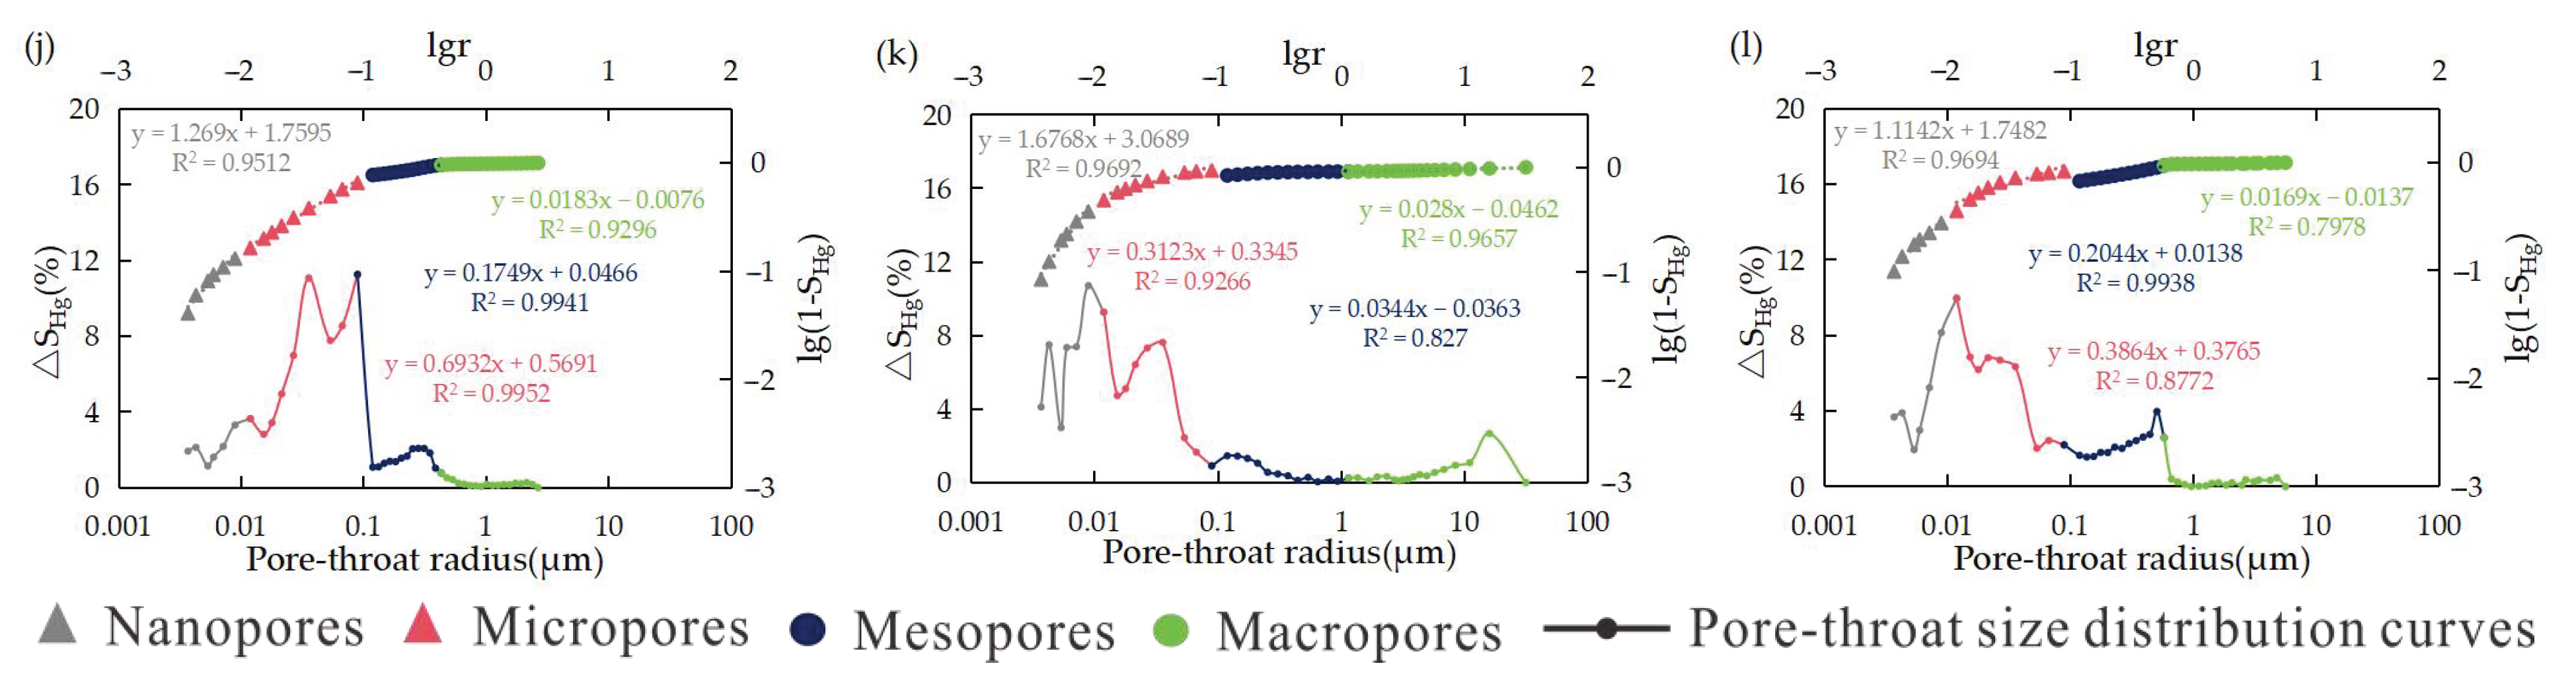
4.4.2. Combined HPMI and CRMI for Full-Size Pore-Throat Fractal Characterisation
5. Discussion
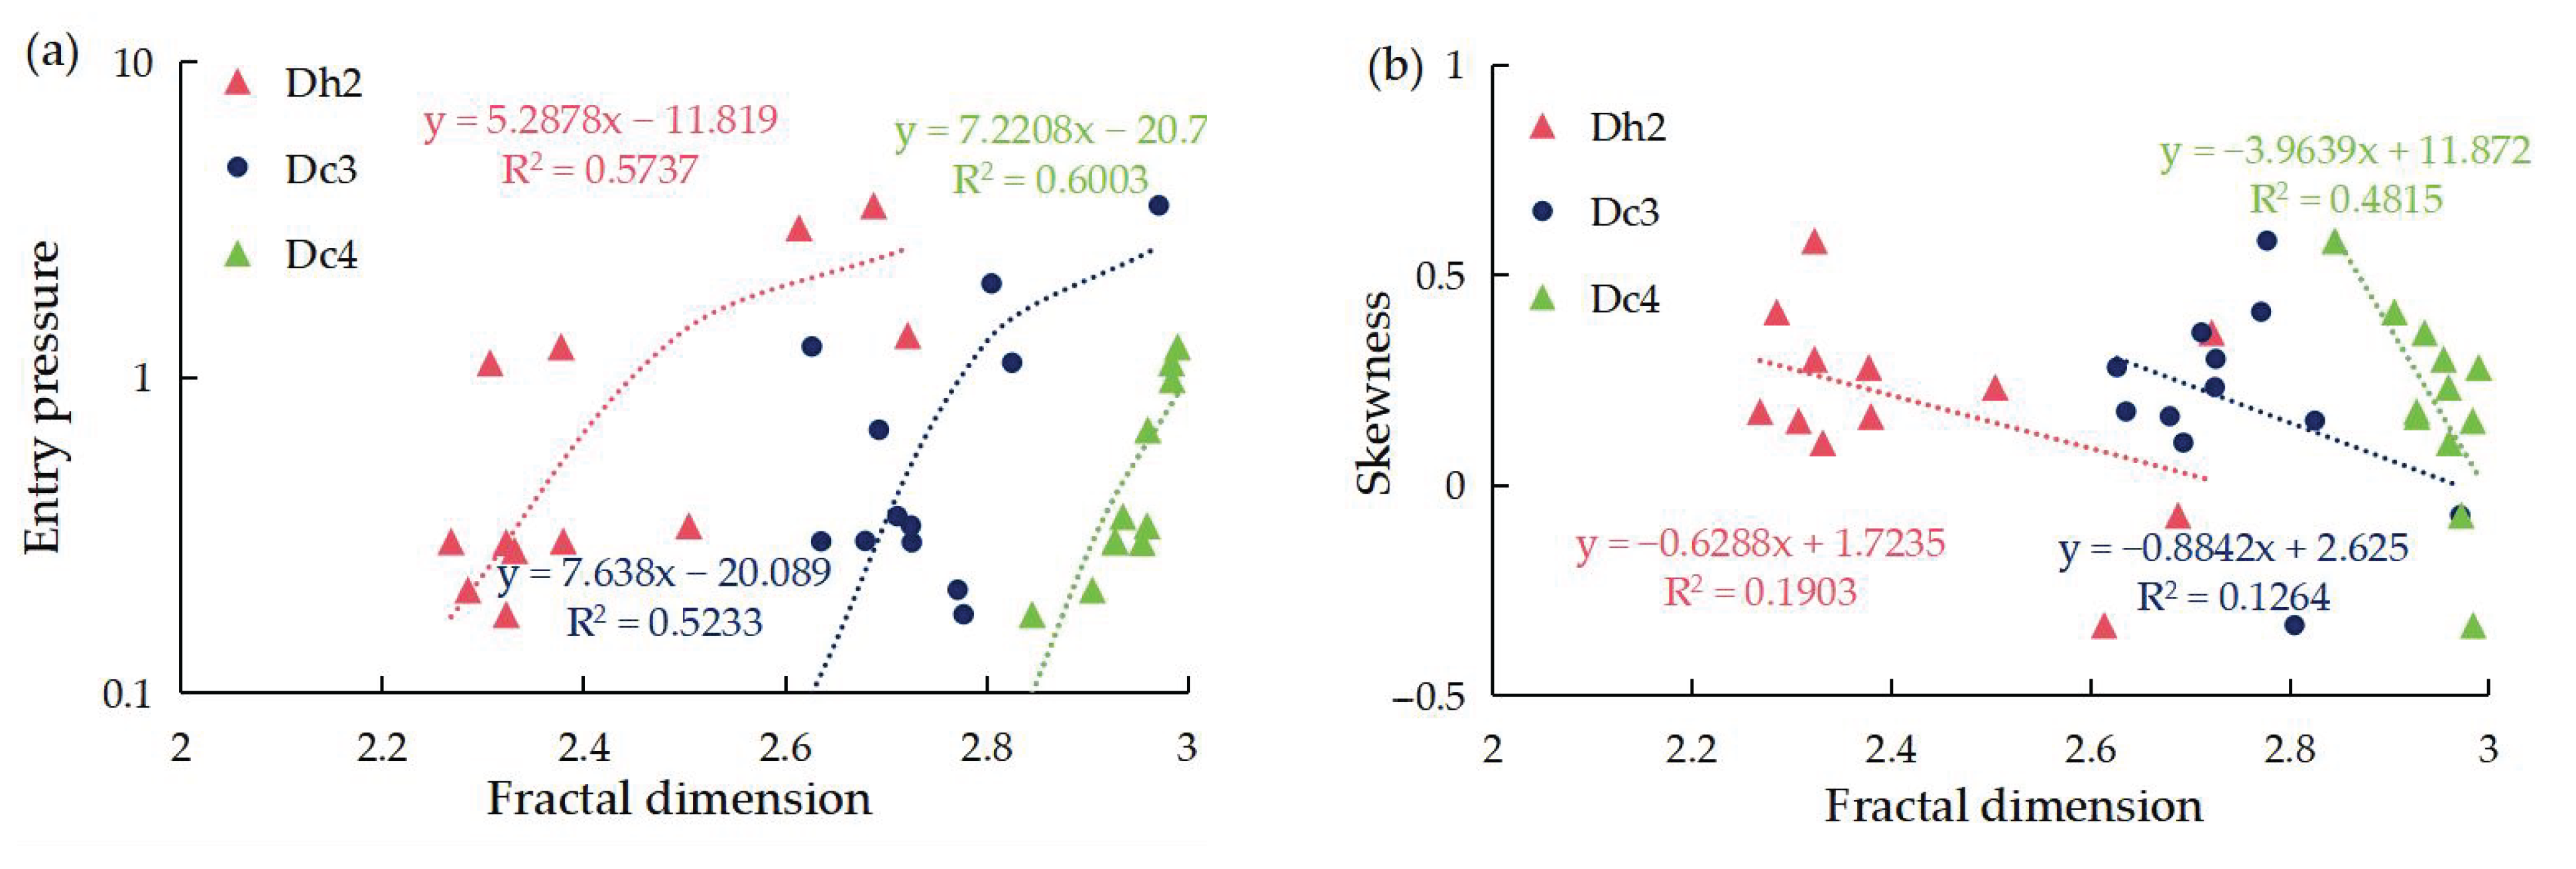
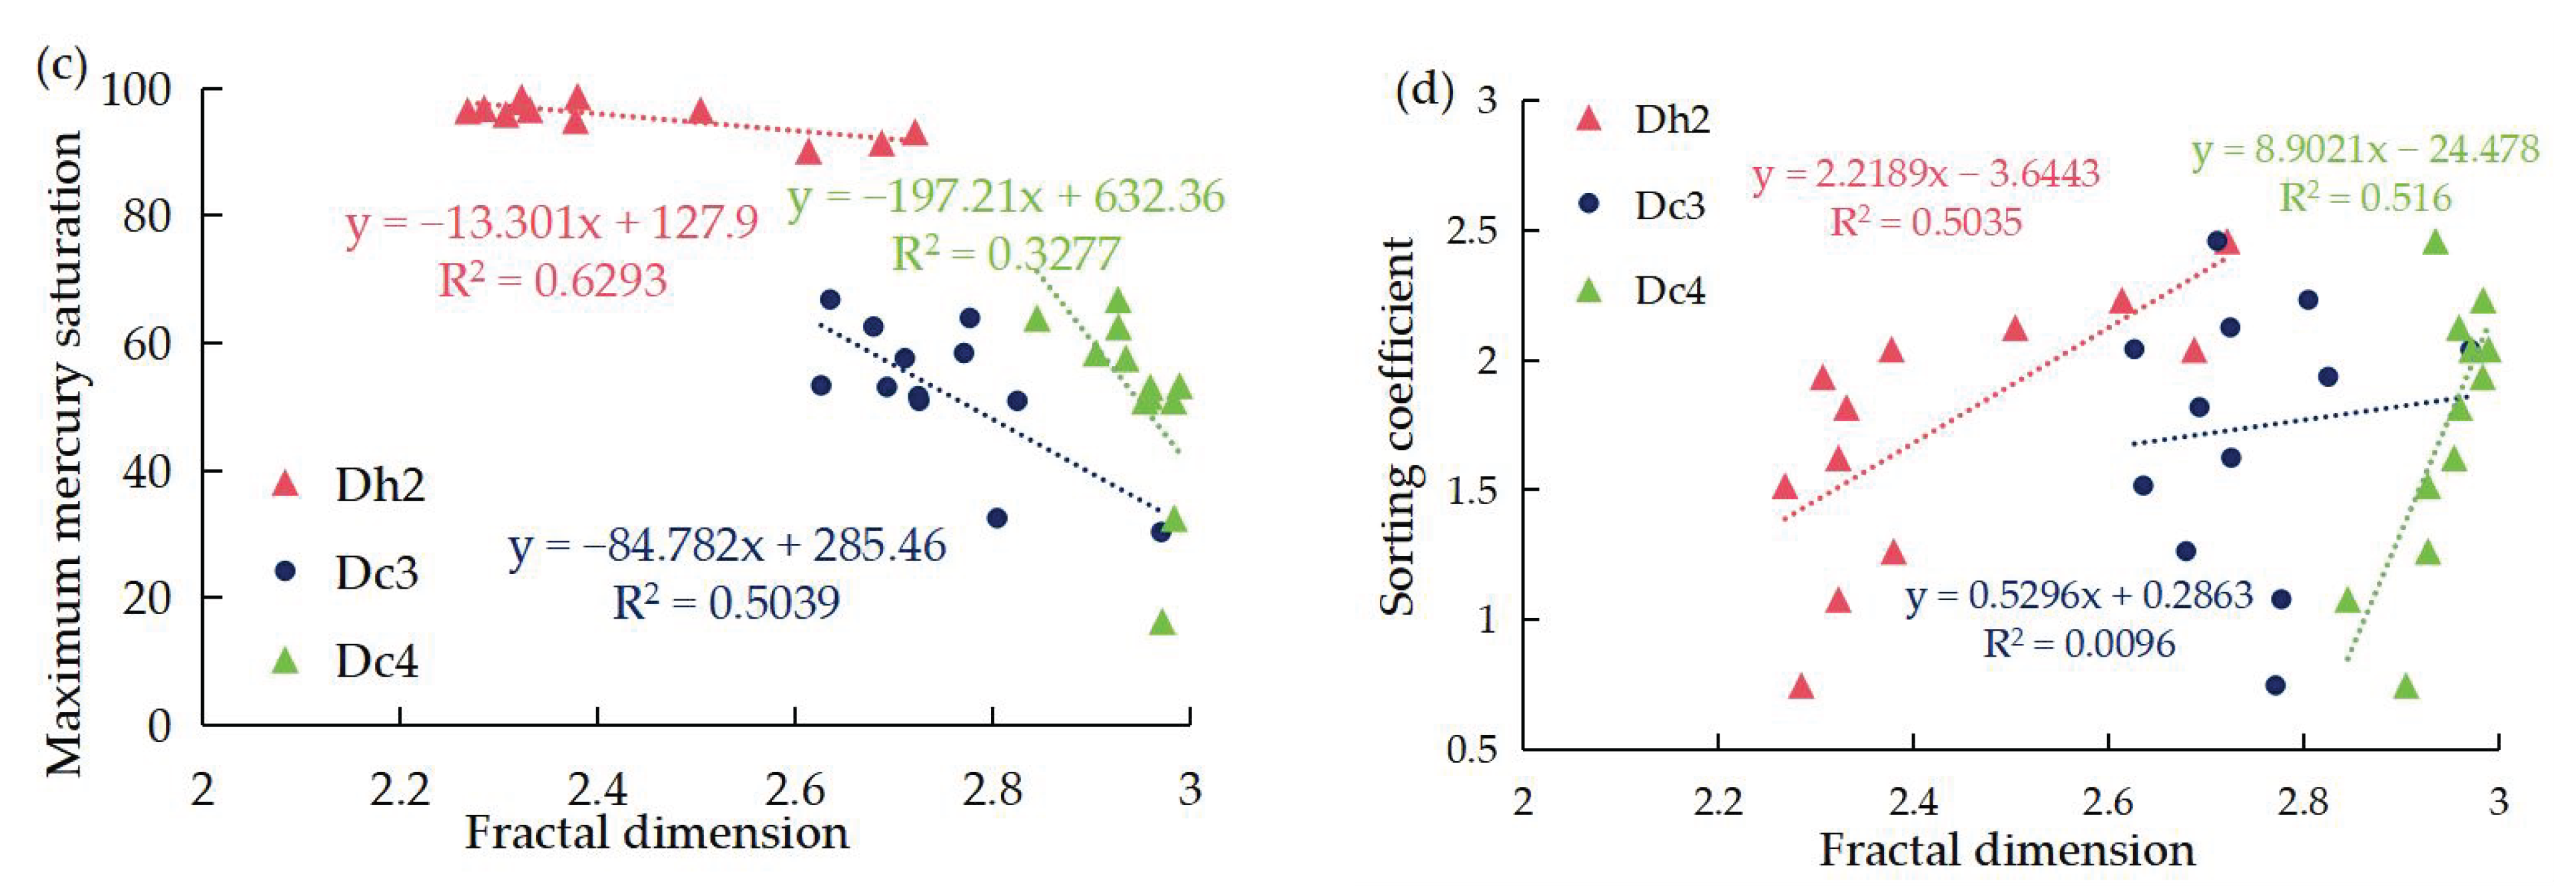
5.1. Relationships Between Fractal Dimension and Pore-Throat Structure Parameters
5.2. The Main Controls on the Fractal Dimension
5.2.1. Sedimentation
5.2.2. Diagenesis
- (1)
- Compaction
- (2)
- Cementation
- (3)
- Dissolution
5.3. Reservoir Type Classification
6. Conclusions
- (1)
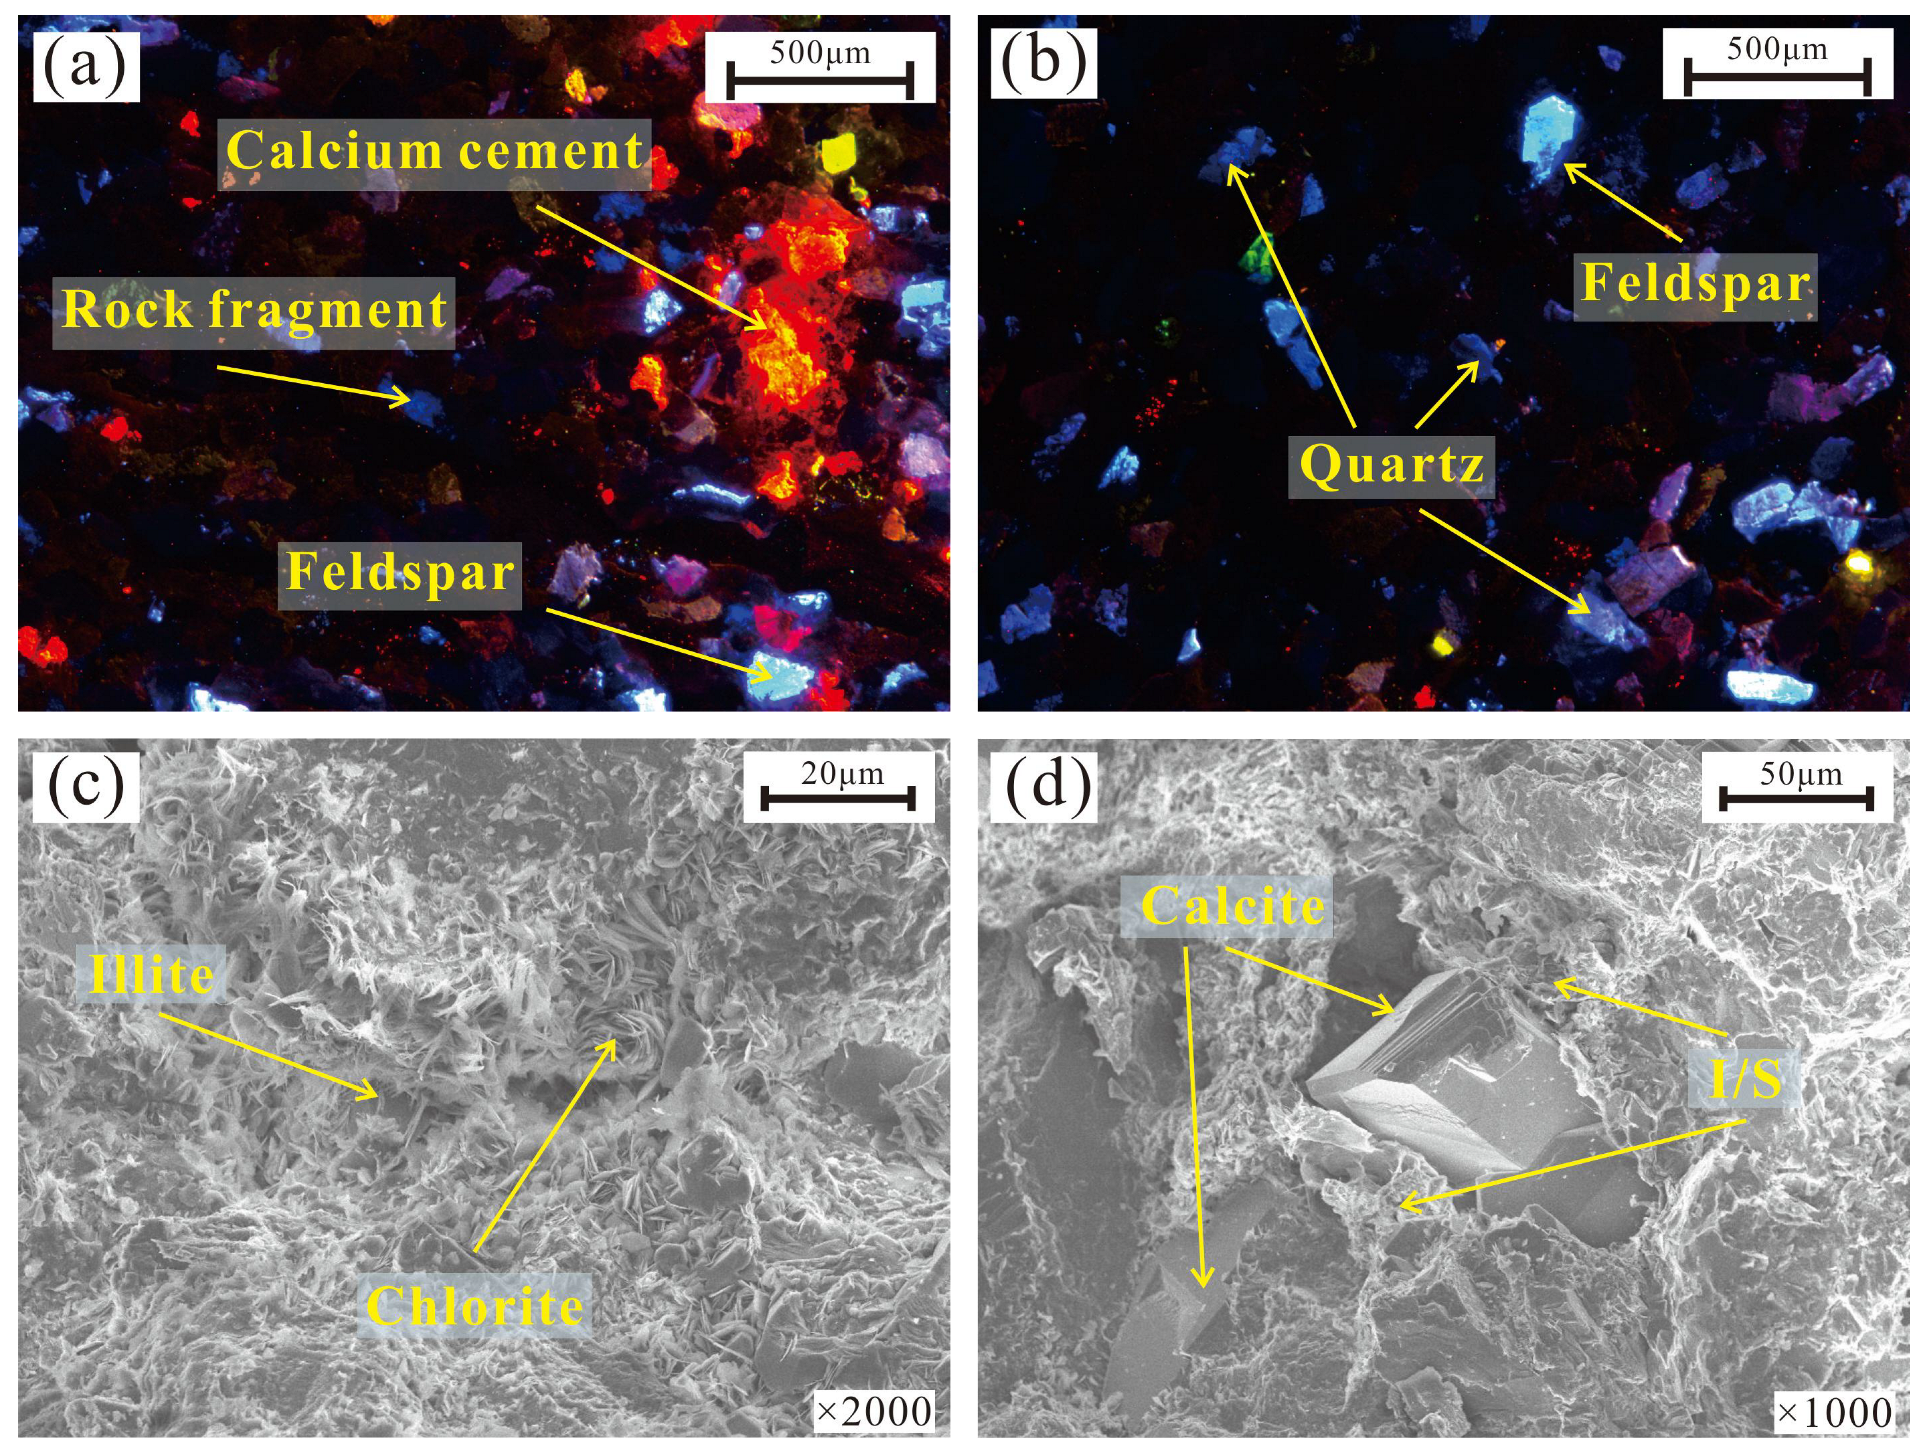
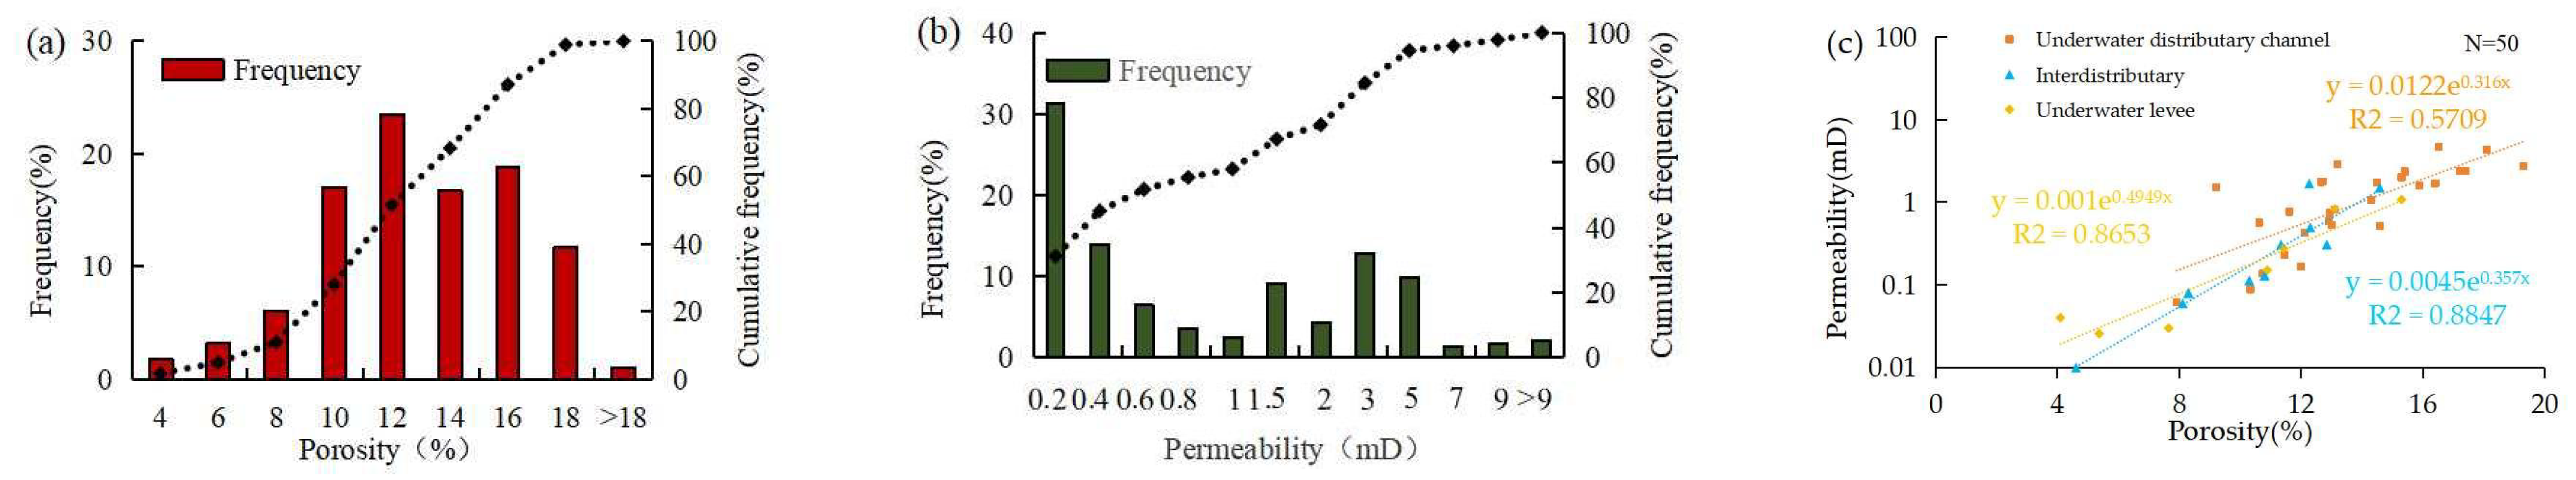
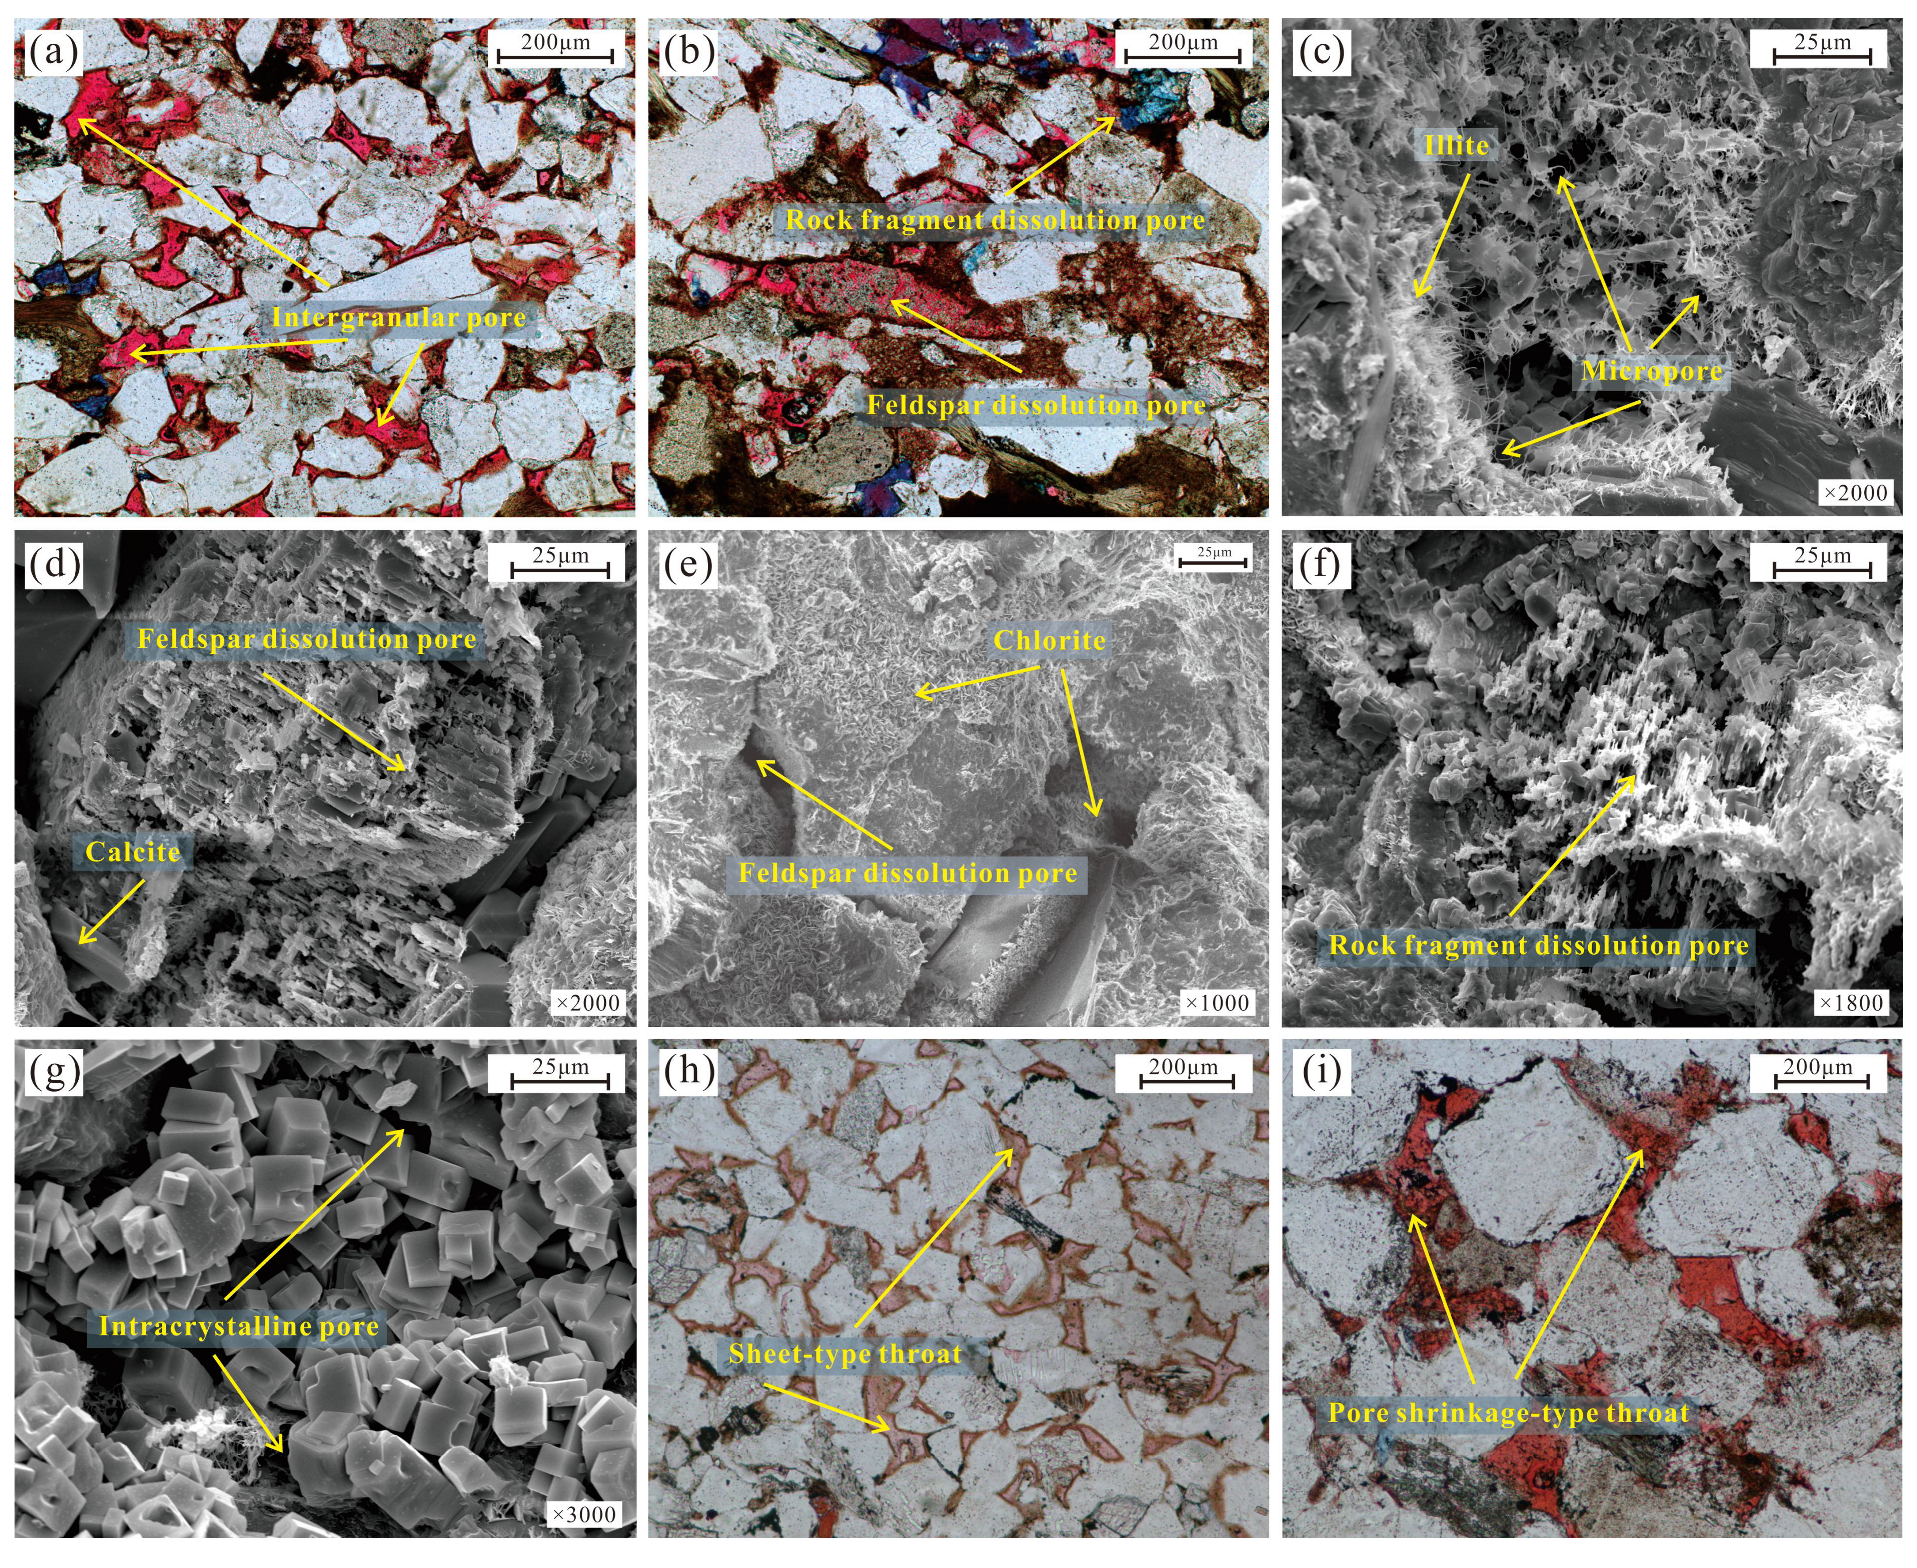
- The lithology of the Chang 3 reservoir in the study area mainly consists of arkose and a small amount of lithic arkose. It is characterized by simple sediment composition, medium to good sorting, poor rounding, intense diagenesis, and strong heterogeneity. The porosity of the reservoir ranges from 10% to 18%, with an average value of 12%. Permeability ranges from 0.2 to 2 mD, with an average value of 1.54 mD, making it a typical low-porosity, extremely low-permeability reservoir. Common pore types in the study area include intergranular pores, intragranular dissolution pores, and micropores. The main fillings are chlorite and illite. Throat types are predominantly tabular, followed by constricted and bundled throats.
- (2)
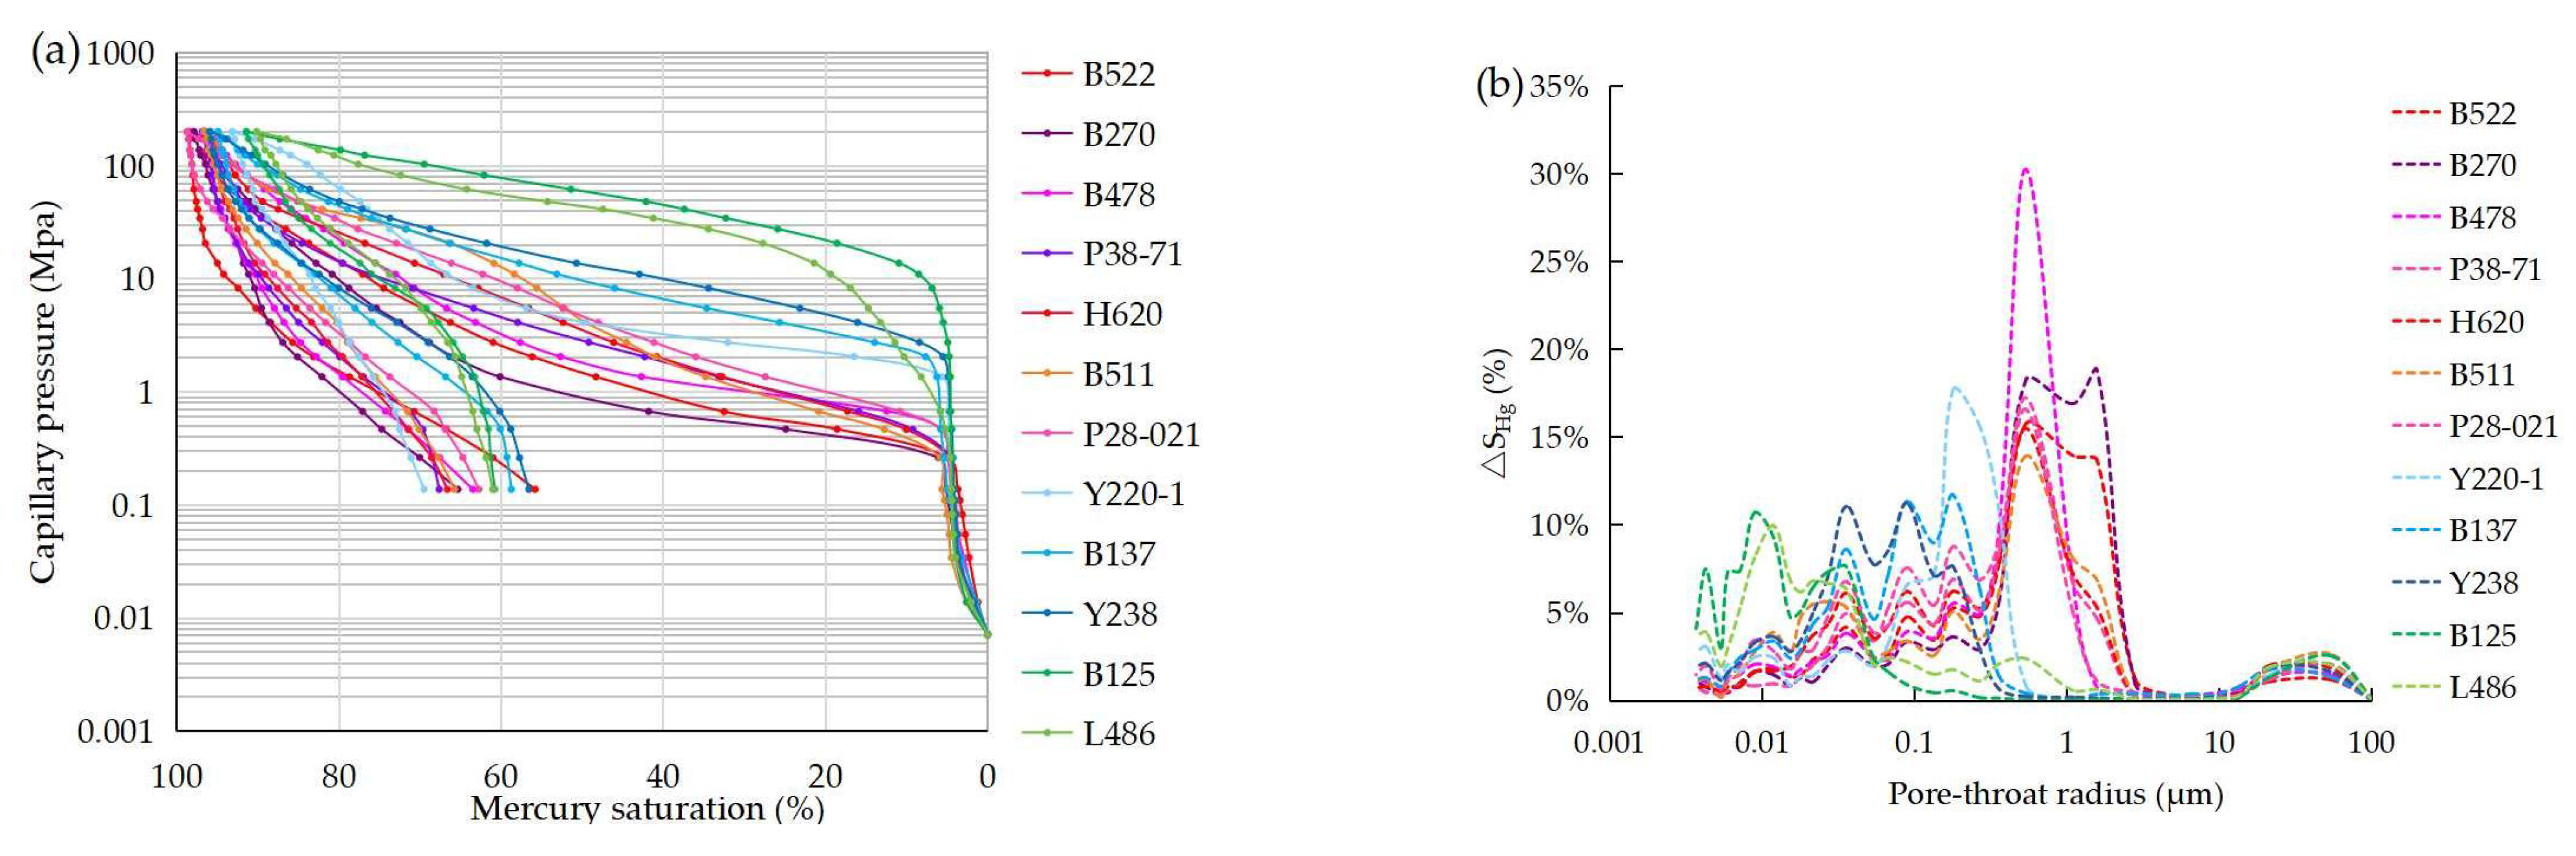
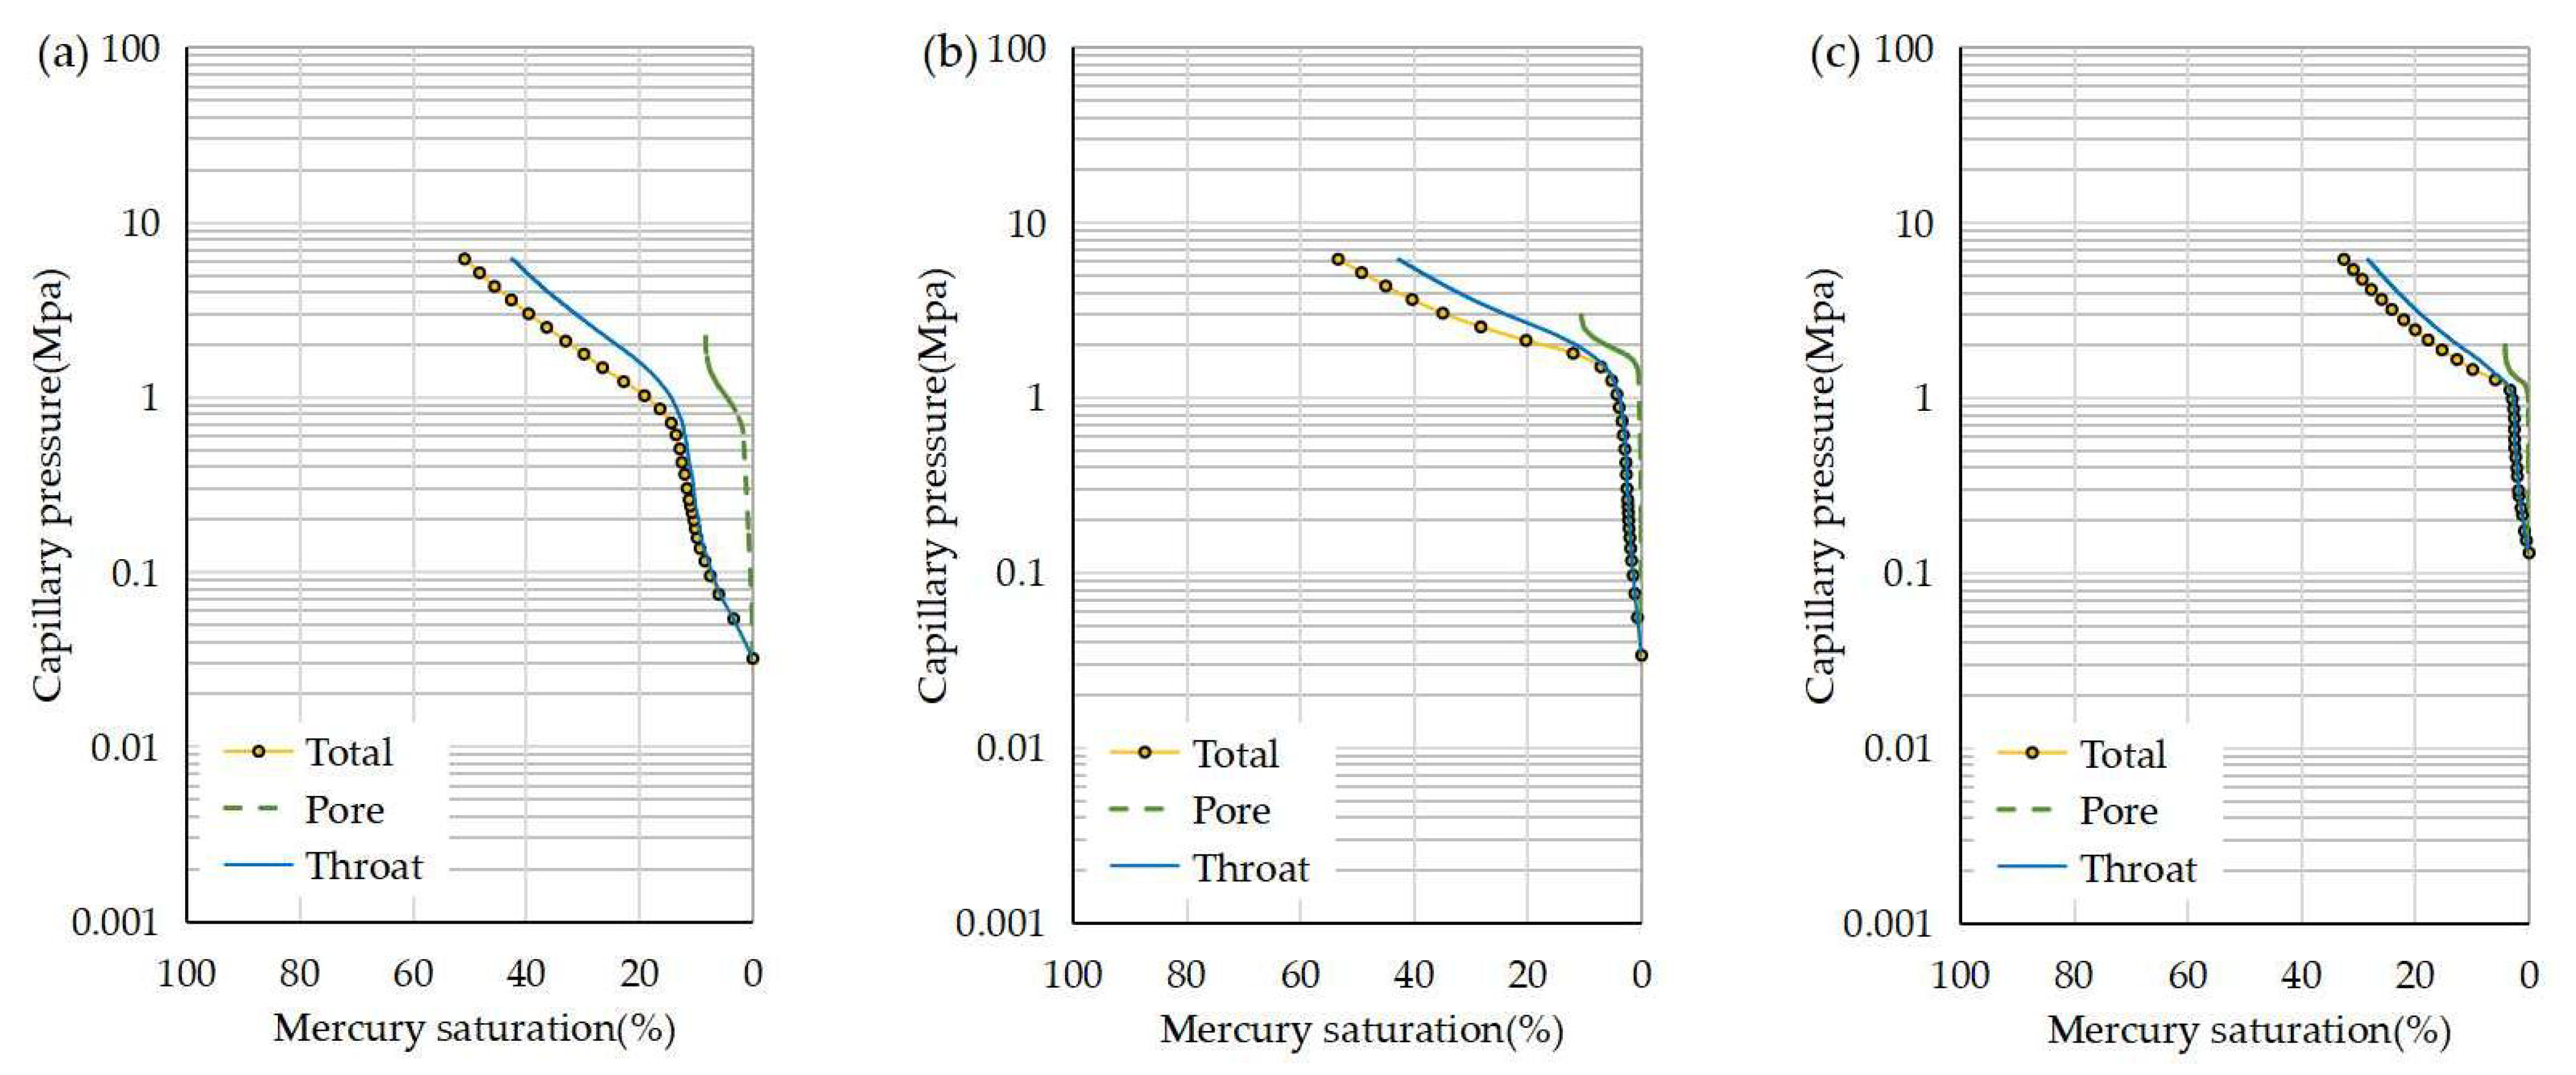
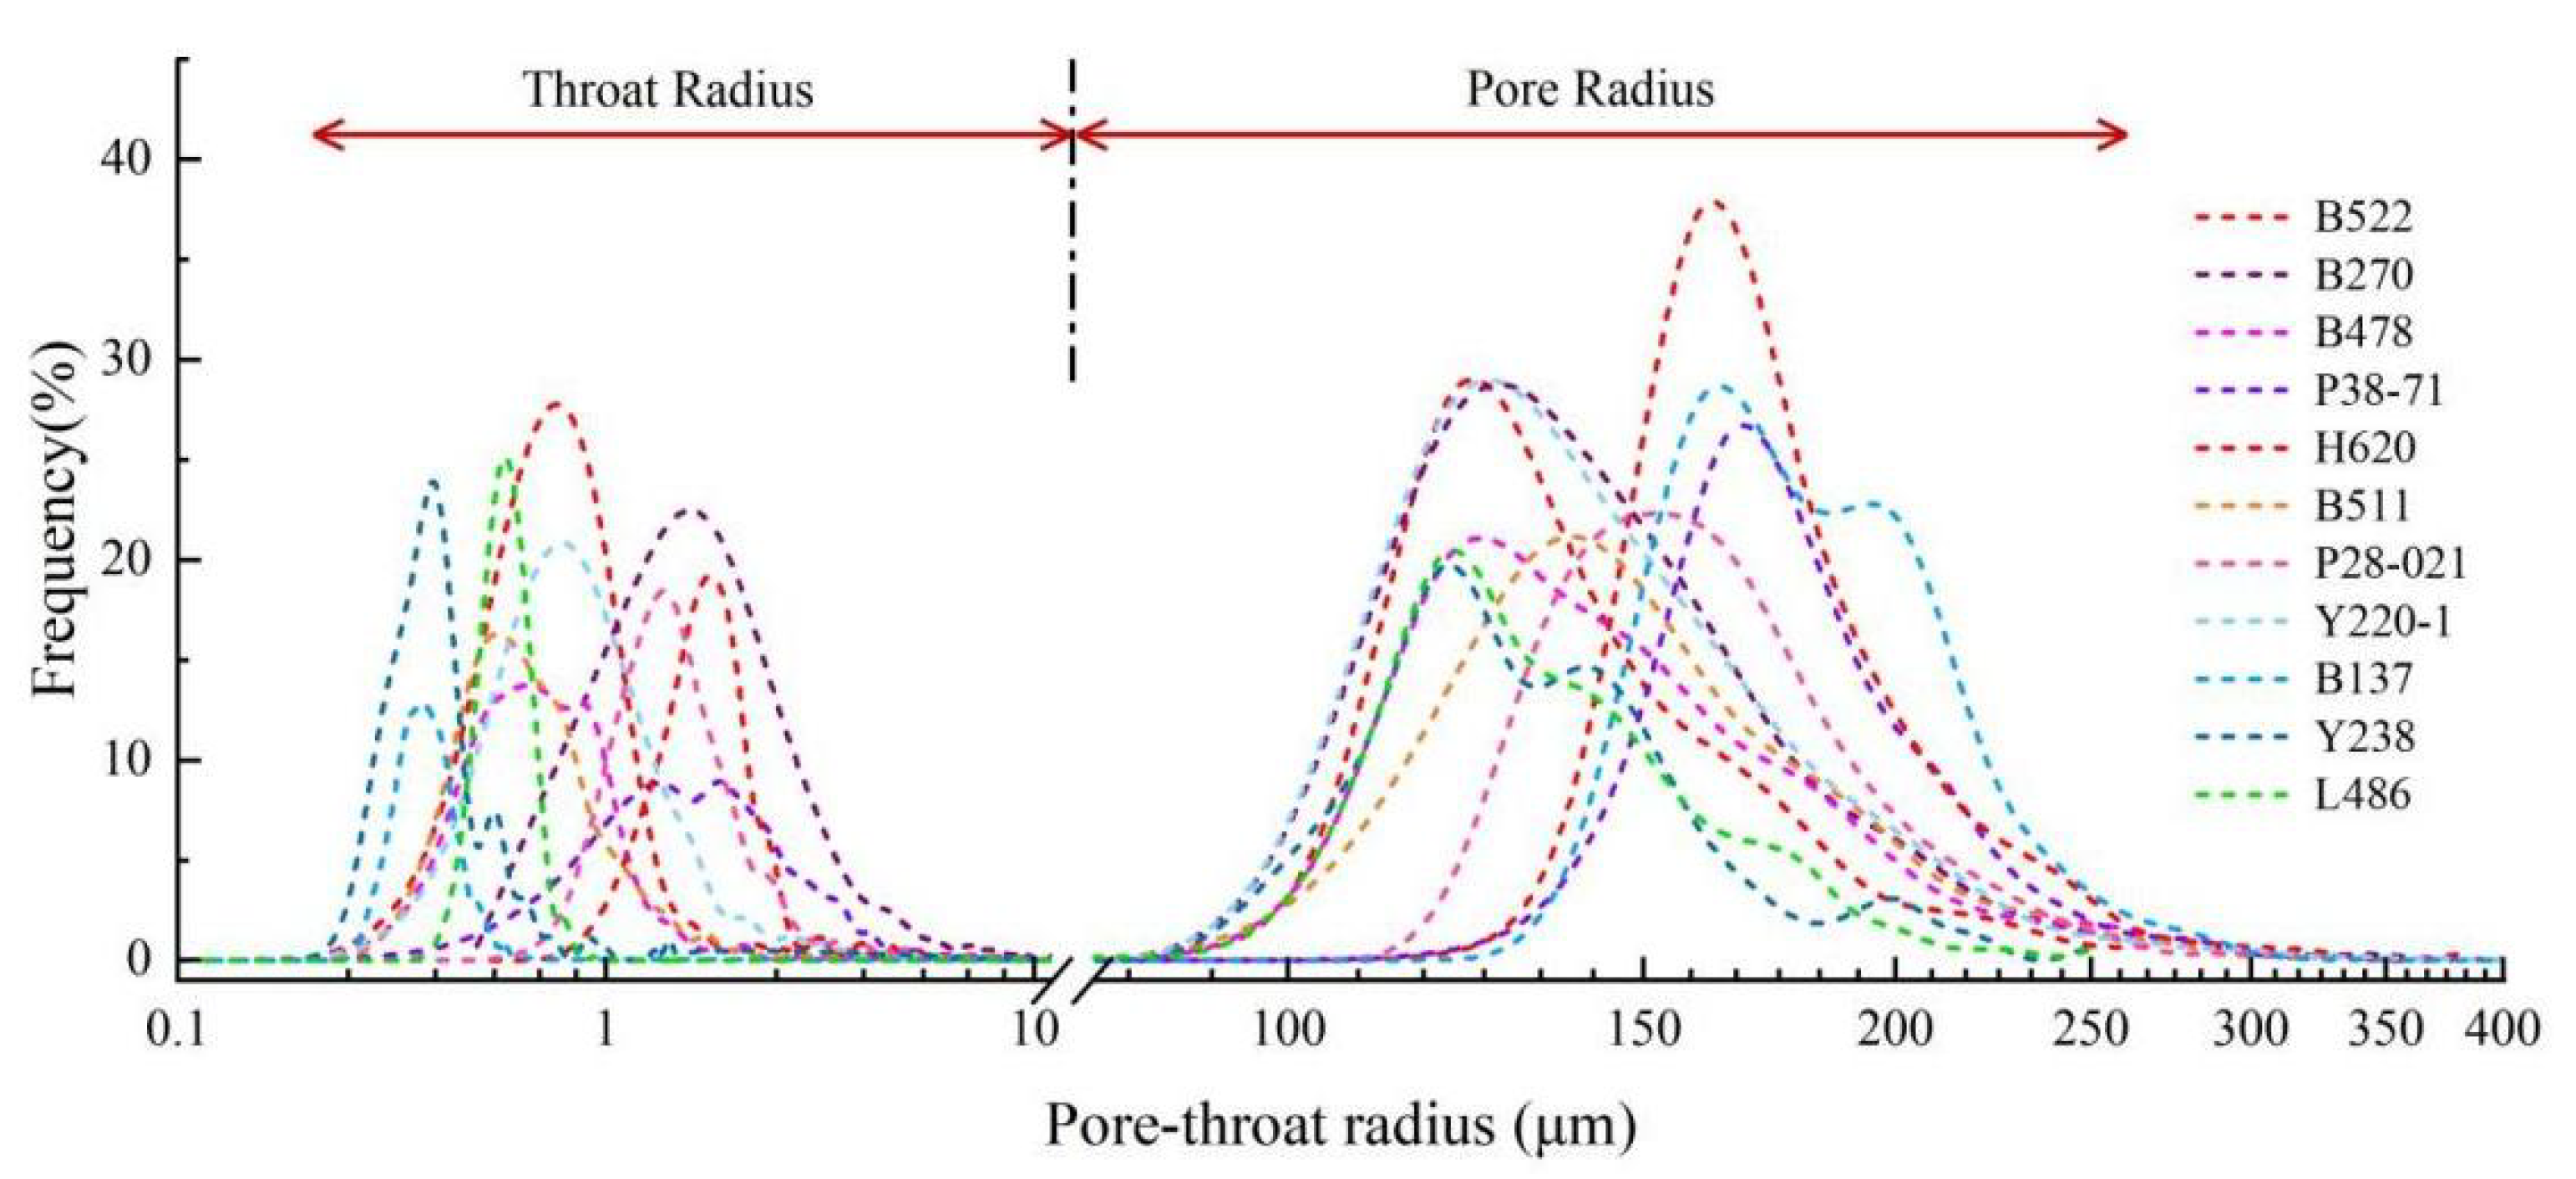
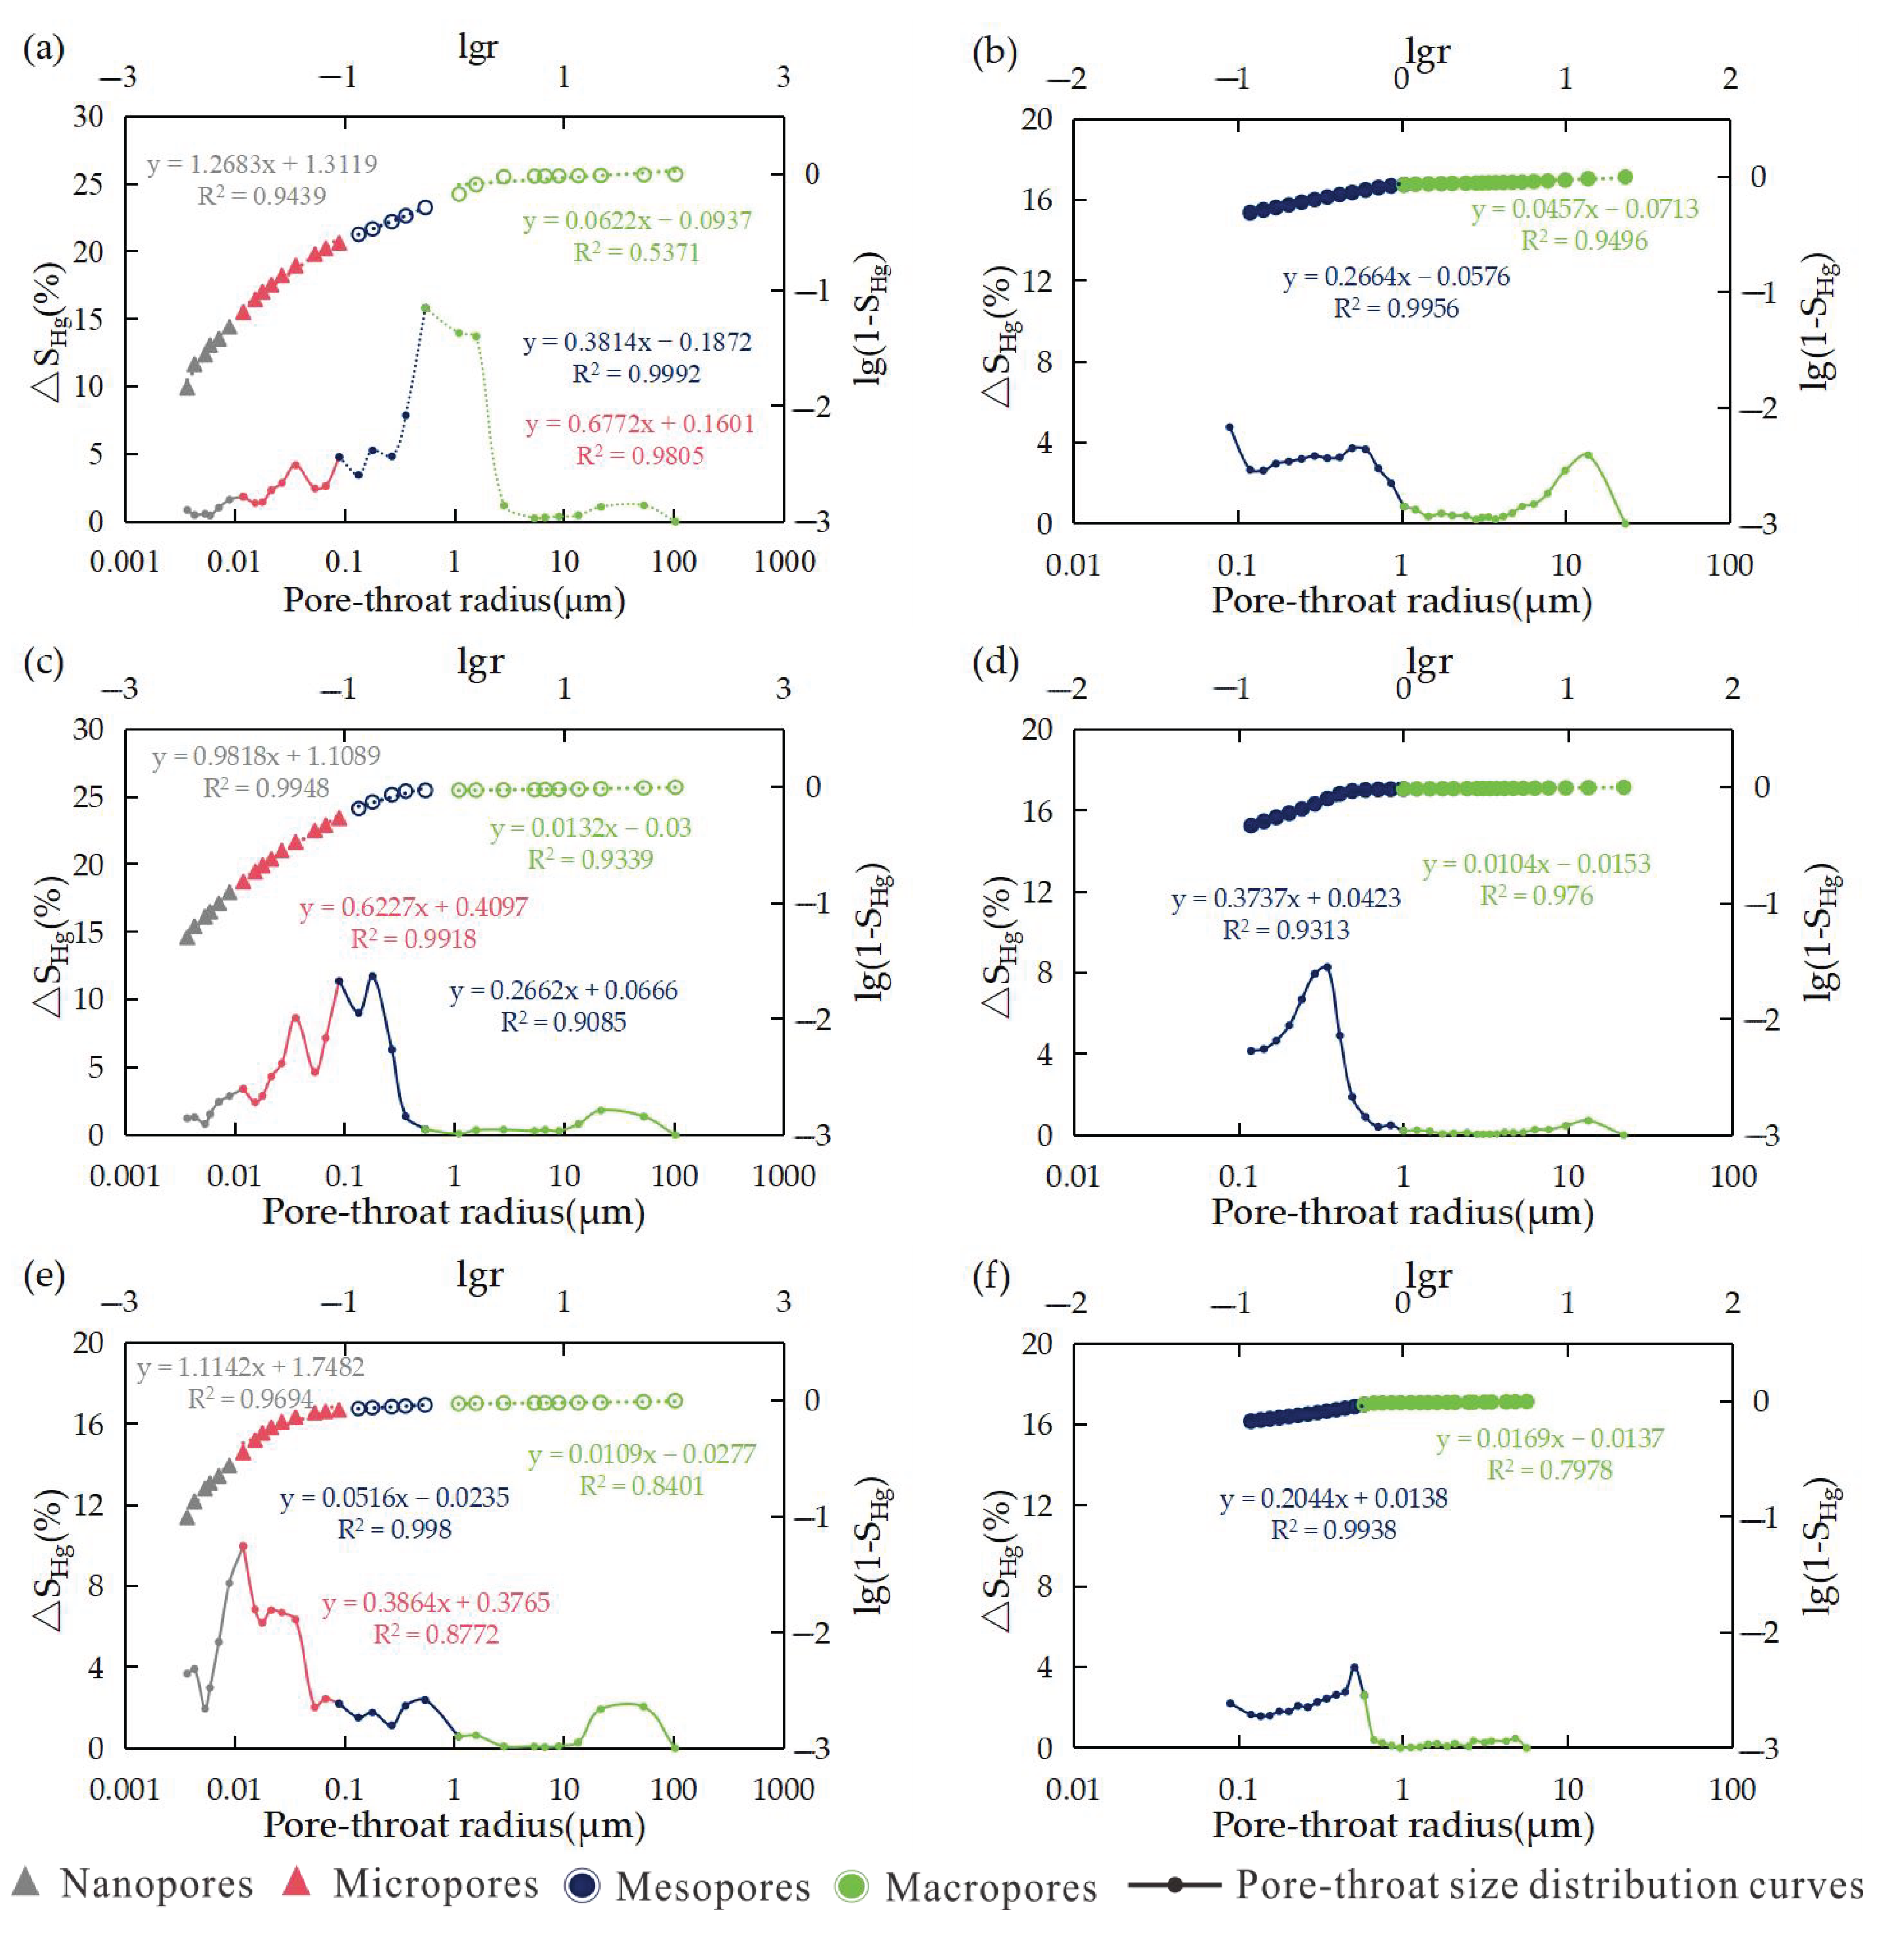
- By splicing the pore-throat sizes obtained from high-pressure mercury injection (HPMI) and constant rate mercury injection (CRMI), the full-size pore radius distribution characteristics were derived. This method addresses the technical shortcomings of CRMI, which cannot characterise pores smaller than 0.12 μm in radius, and HPMI, which cannot finely characterise larger pore-throats. Based on fractal theory, the segmented fractal dimensions were calculated for each sample. The average fractal dimensions for micropores (Dh2), mesopores (Dc3), and macropores (Dc4) are 2.43, 2.75, and 2.95, respectively. This indicates that the larger the pore-throat size, the rougher the surface, and the more complex the structure.
- (3)
- Dc4 shows significant correlation with displacement pressure, skewness, sorting coefficient, and maximum mercury injection saturation. Dh2 and Dc3 only have a clear correlation with maximum mercury injection saturation. This indicates that the heterogeneity and permeability of the reservoir are more significantly influenced by the development degree and surface roughness of macropores. The connectivity of micropores and mesopores has a certain impact on the storage capacity of the reservoir. Therefore, modifying larger pore-throats helps to increase the storage space and flow capacity of the reservoir.
- (4)
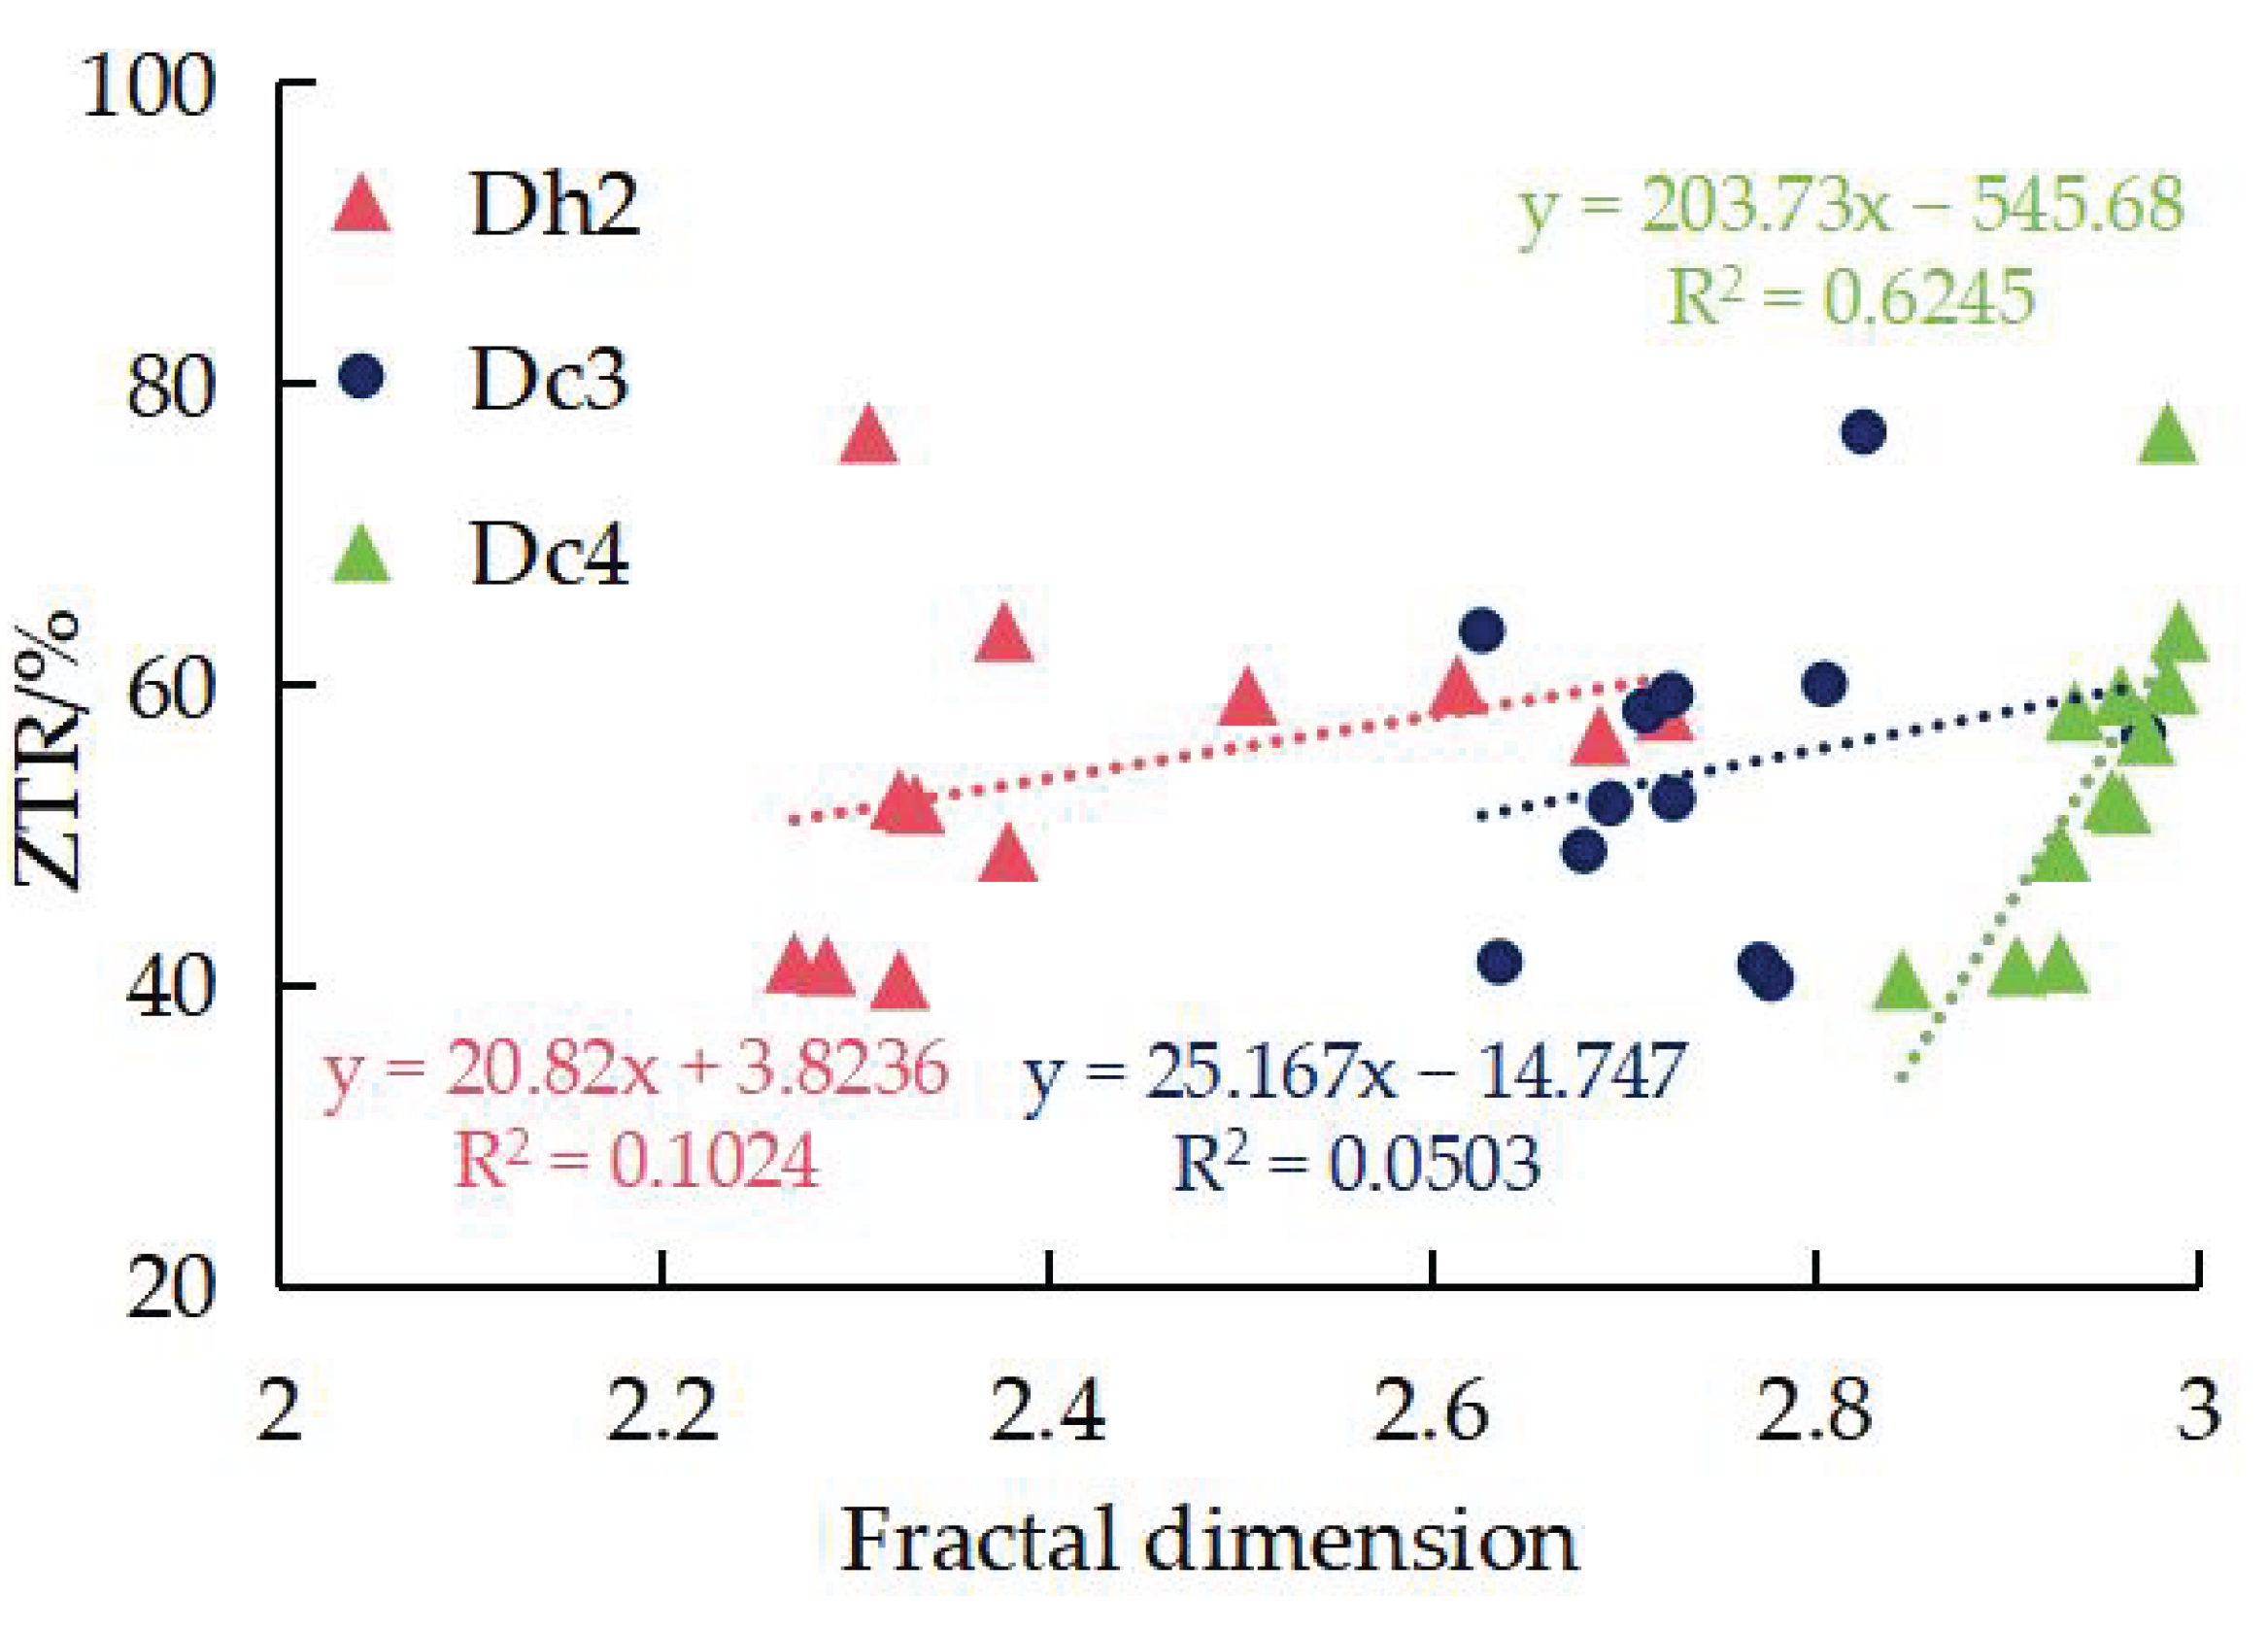
- The sedimentary environment and diagenetic processes directly control the pore-throat structure of the reservoir, thereby influencing its fractal dimension. The fractal dimension of large pores and throats (Dc4) shows a positive correlation with compositional maturity (ZTR). As the transportation distance increases, the content of heavy minerals such as zircon, tourmaline, and rutile rises, further enhancing the complexity of the large pore-throat structure. The study area is subjected to compaction, cementation, and dissolution. Smaller pores and throats are less affected by diagenetic processes, with their structures remaining almost undeformed and having smaller fractal dimensions. Large pores and throats, on the other hand, are strongly influenced by diagenetic processes, resulting in significant deformation of their structures and larger fractal dimensions.
- (5)
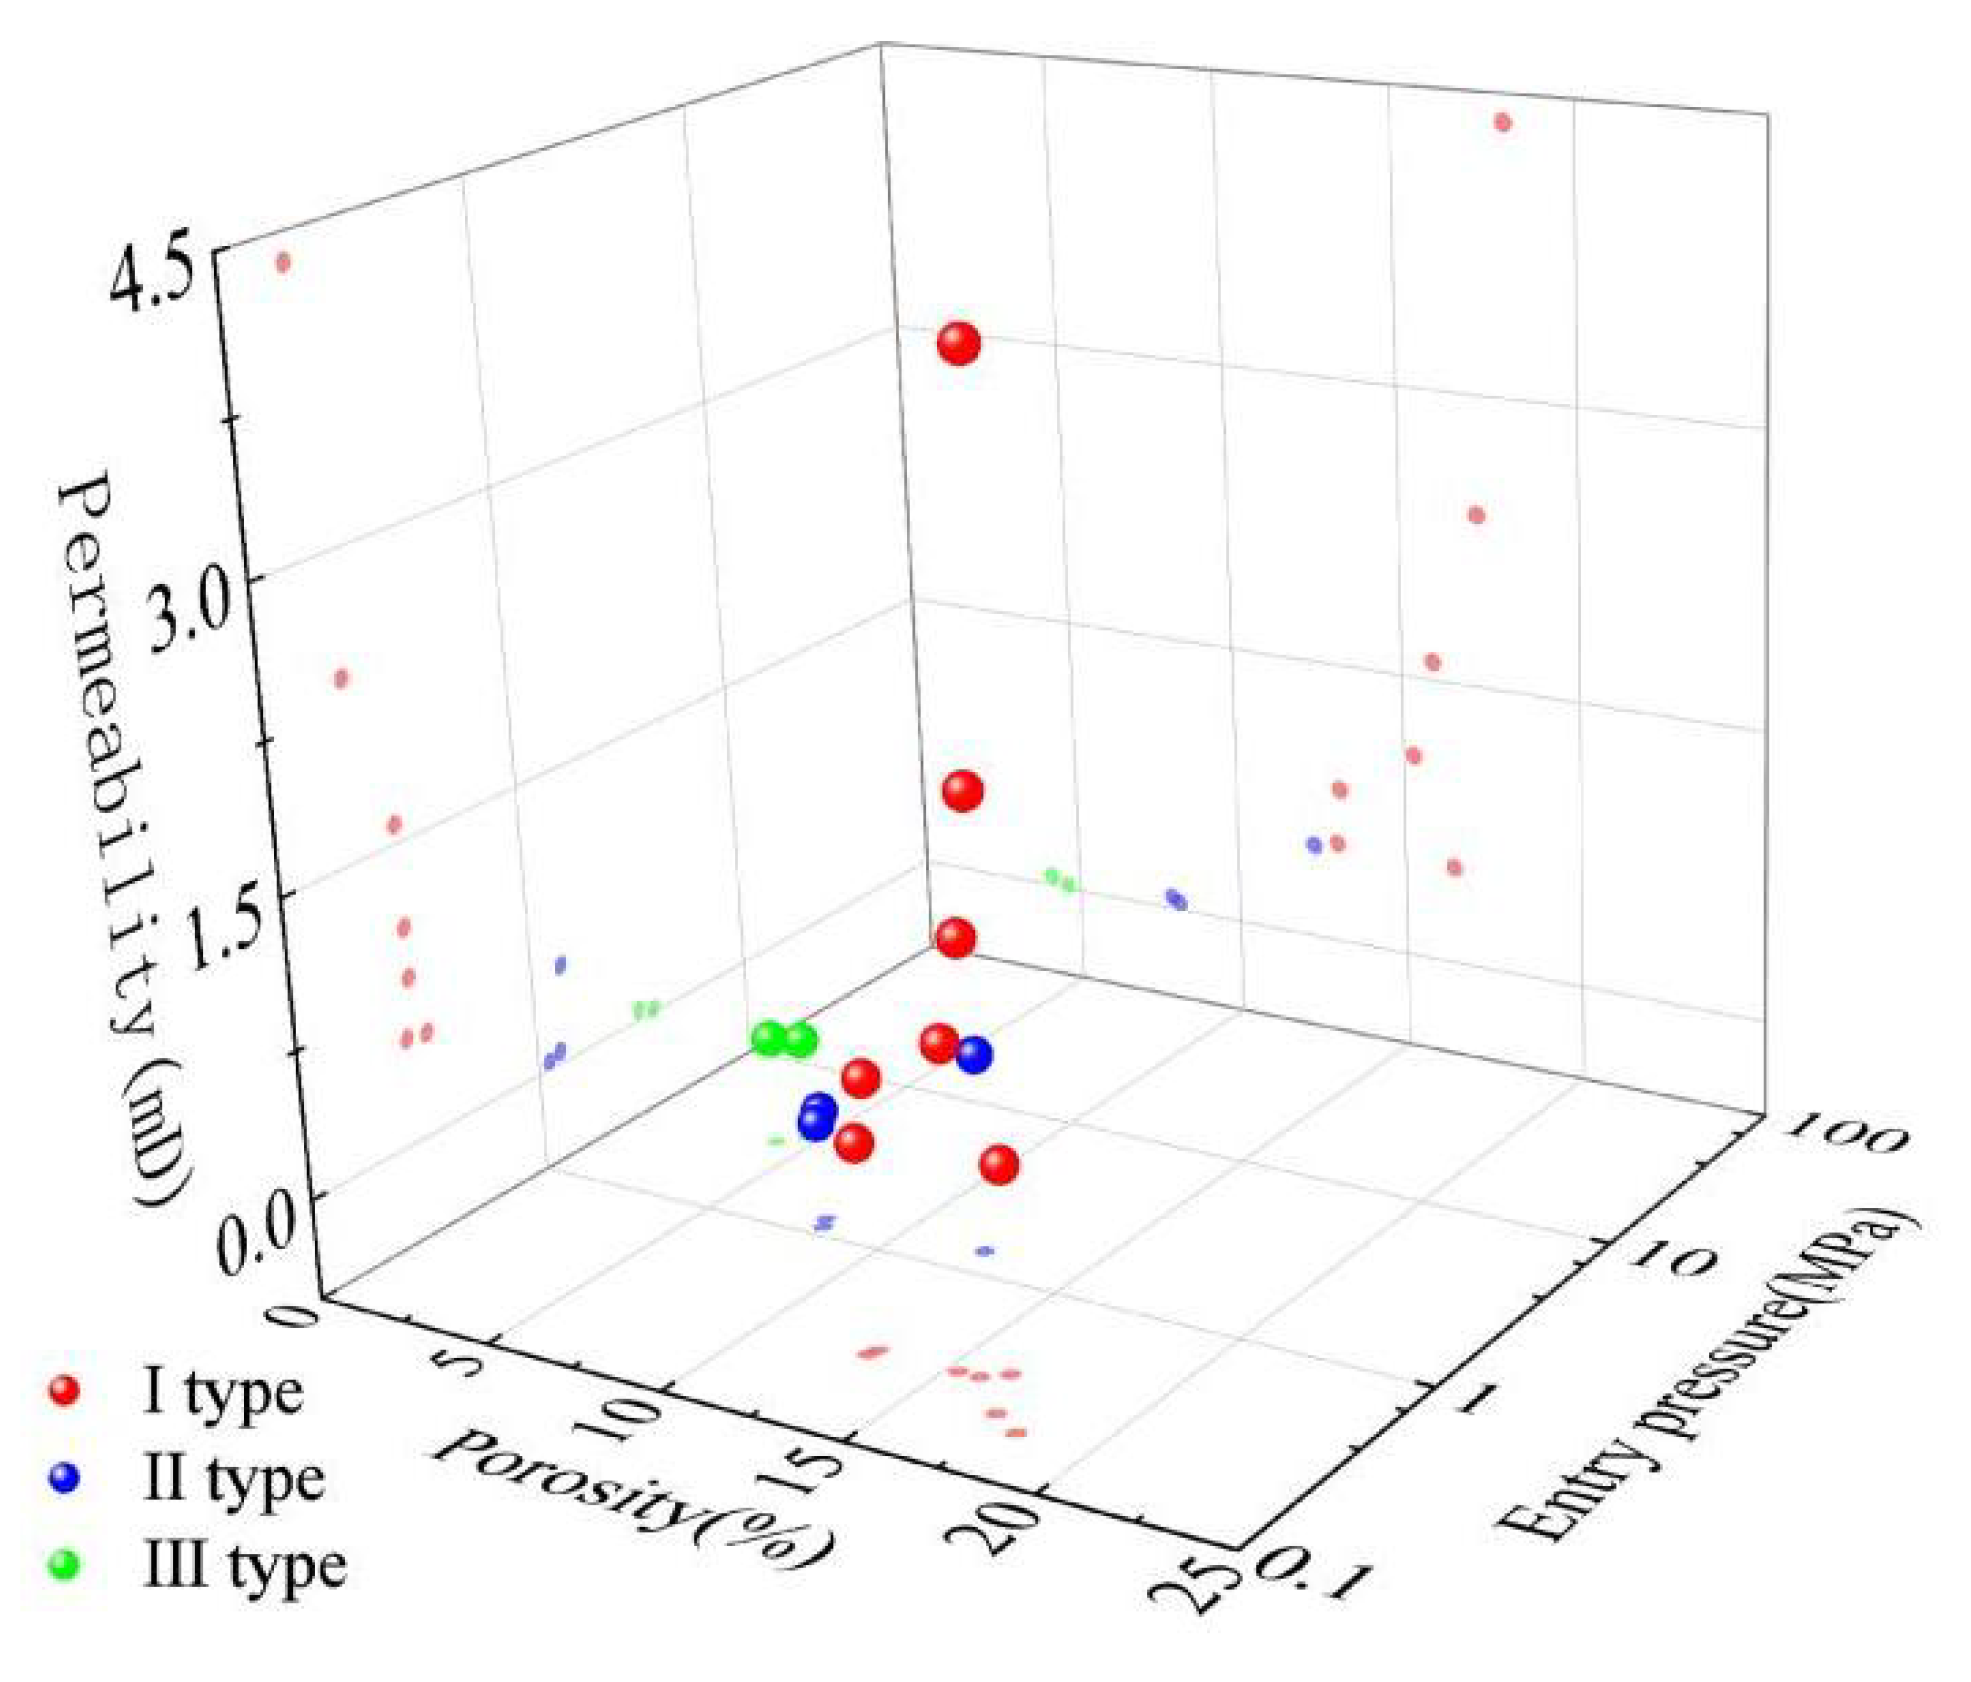
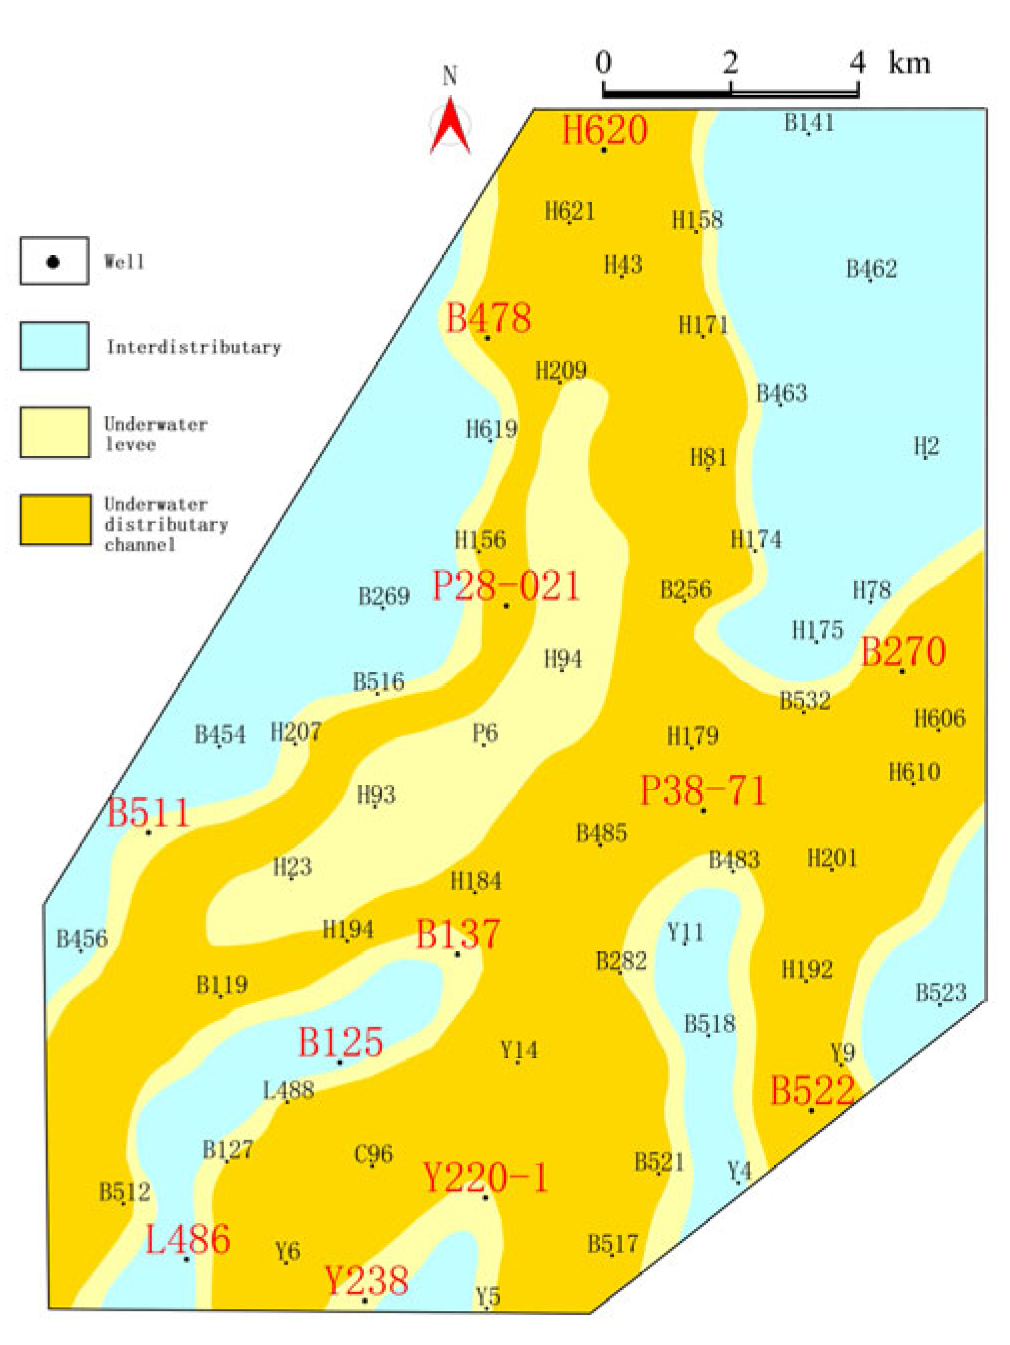
- The extremely low-permeability sandstone reservoirs in the study area are classified based on sedimentary characteristics, reservoir space types, pore-throat structural parameters, and the characteristics of mercury injection curves. Type I, type II, and type III reservoirs show distinct differences in physical properties, pore-throat size distribution, and mercury injection curve morphology. A classification basis for the Chang 3 reservoir in the Huachi area has been established, providing a theoretical basis for predicting sweet spots in oil and gas exploration in the study area. In addition, it will be necessary to further clarify and validate the basis for reservoir classification by combining fractal theory with full-pore-size analysis of a large number of samples.
Author Contributions
Funding
Data Availability Statement
Acknowledgments
Conflicts of Interest
References
- Ji, B.; Fang, J. An overview of efficient development practices at low permeability sandstone reservoirs in China. Ener. Geo. 2023, 4, 100179. [Google Scholar] [CrossRef]
- Ouyang, S.; Sun, W.; Wu, Y.; Meng, Z.; Li, G.; Zhao, D. Seepage characteristics and infliuencing factors of low permeability-ultra low permeability reservoir: A case of Chang 6 reservoir in Houshi-Xinghe area of Ansai oilfield in Ordos Basin. Geol. Sci. Technol. Inf. 2019, 38, 199–207. [Google Scholar]
- Zeng, L.; Liu, H. Influence of fractures on the development of low-permeability sandstone reservoirs: A case study from the Taizhao district, Daqing Oilfield, China. J. Pet. Sci. Eng. 2010, 72, 120–127. [Google Scholar] [CrossRef]
- Chen, J.; Yao, J.; Mao, Z.; Li, Q.; Luo, A.; Deng, X.; Shao, X. Sedimentary and diagenetic controls on reservoir quality of low-porosity and low-permeability sandstone reservoirs in Chang101, upper triassic Yanchang Formation in the Shanbei area, Ordos Basin, China. Mar. Pet. Geol. 2019, 105, 204–221. [Google Scholar] [CrossRef]
- Zhang, S.; Fang, Z. Permeability damage micro-mechanisms and stimulation of low-permeability sandstone reservoirs: A case study from Jiyang Depression, Bohai Bay Basin, China. Pet. Explor. Dev. 2020, 47, 374–382. [Google Scholar] [CrossRef]
- Schmitt, M.; Fernandes, C.; Neto, J.; Wolf, F.; Santos, V. Characterization of pore systems in seal rocks using Nitrogen Gas Adsorption combined with Mercury Injection Capillary Pressure techniques. Mar. Pet. Geol. 2013, 39, 138–149. [Google Scholar] [CrossRef]
- Wang, L.; Zhao, N.; Sima, L.; Meng, F.; Guo, Y. Pore Structure Characterization of the Tight Reservoir: Systematic Integration of Mercury Injection and Nuclear Magnetic Resonance. Energ. Fuel. 2018, 32, 7471–7484. [Google Scholar] [CrossRef]
- Rezaee, R.; Saeedi, A.; Clennell, B. Tight gas sands permeability estimation from mercury injection capillary pressure and nuclear magnetic resonance data. J. Pet. Sci. Eng. 2012, 88–89, 92–99. [Google Scholar] [CrossRef]
- Zhang, M.; Duan, C.; Li, G.; Fu, X.; Zhong, Q.; Liu, H.; Dong, Z. Determinations of the multifractal characteristics of the pore structures of low-, middle-, and high-rank coal using high-pressure mercury injection. J. Pet. Sci. Eng. 2021, 203, 108656. [Google Scholar] [CrossRef]
- Kong, X.; Xiao, D.; Jiang, S.; Lu, S.; Sun, B.; Wang, J. Application of the combination of high-pressure mercury injection and nuclear magnetic resonance to the classification and evaluation of tight sandstone reservoirs: A case study of the Linxing Block in the Ordos Basin. Nat. Gas Ind. B 2020, 7, 433–442. [Google Scholar] [CrossRef]
- Wei, Y.; Li, J.; Du, Y.; Liu, S.; Li, W.; Yang, J.; Feng, W.; Song, Z.; Zhang, Y. Classification Evaluation of Gas Shales Based on High-Pressure Mercury Injection: A Case Study on Wufeng and Longmaxi Formations in Southeast Sichuan, China. Energ. Fuel. 2021, 35, 9382–9395. [Google Scholar] [CrossRef]
- Zhang, F.; Jiang, Z.; Sun, W.; Li, Y.; Zhang, X.; Zhu, L.; Wen, M. A multiscale comprehensive study on pore structure of tight sandstone reservoir realized by nuclear magnetic resonance, high pressure mercury injection and constant-rate mercury injection penetration test. Mar. Pet. Geol. 2019, 109, 208–222. [Google Scholar] [CrossRef]
- Wang, J.; Zhang, J.; Shen, W.; Liu, H. Comparison of the Pore Structure of Ultralow-Permeability Reservoirs Between the East and West Subsags of the Lishui Sag Using Constant-Rate Mercury Injection. J. Ocean. U. China 2019, 20, 315–328. [Google Scholar] [CrossRef]
- Lin, Y.; Zhang, J.; Liu, X.; Zhou, H. Pore structure features of reservoirs at late high water-cut stage, Lamadian Oilfield, Daqing, China. Pet. Explor. Dev. 2008, 35, 215–219. [Google Scholar] [CrossRef]
- Chen, F.; Zhou, Y.; Ynag, D.; Wan, H. Study of pore structure of tight sandstone reservoir based on fractal theory: A case study from Chang 7tight sandstone of Yanchang formation in Qingcheng area, Ordos Basin. J. China. U. Min. Techno. 2022, 51, 941–955. [Google Scholar]
- Wu, C.; Zhan, Z.; Li, W.; Wang, N.; Wu, L. The combination methods of mercury intrusion to characterize pore-throat characteristics in tight oil reservoir: A case study of Yanchangzu Chang 7 reservoir in Dingbian area of Shanbei. Chin. J. Geol. 2023, 58, 710–722. [Google Scholar]
- Peng, P.; Ning, Z.; Qi, L.; He, B.; Zhao, H.; Niu, T. Research method of pore structure in tight reservoir. Res. Eval. Dev. 2014, 4, 26–32. [Google Scholar]
- Huang, H.; Chen, L.; Sun, W.; Xiong, F.; Ji, W.; Jia, J.; Tang, X.; Zhang, S.; Gao, J.; Luo, B. Pore-throat structureand fractal characteristicsof shihezi formation tight gassandstone in the ordos basin, China. Fractals 2018, 26, 1840005. [Google Scholar] [CrossRef]
- Zhang, H.; Guo, L.; Wu, Z.; Ma, J. Pore-throat structure, fractal characteristics and permeability prediction of tight sandstone: The Yanchang Formation, Southeast Ordos Basin. Sci. Rep. 2024, 14, 27913. [Google Scholar] [CrossRef]
- Li, W.; Mu, L.; Zhao, L.; Li, J.; Wang, S.; Fan, Z.; Shao, D.; Li, C.; Shan, F.; Zhao, W.; et al. Pore-throat structure characteristics and its impact on the porosity and permeability relationship of Carboniferous carbonate reservoirs in eastern edge of Pre-Caspian Basin. Pet. Explor. Dev. 2020, 47, 1027–1041. [Google Scholar] [CrossRef]
- Wang, W.; Lin, C.; Zhang, X. Fractal dimension analysis of pore throat structure in tight sandstone reservoirs of Huagang formation: Jiaxing area of east china sea basin. Fractal Fract. 2024, 8, 374. [Google Scholar] [CrossRef]
- Jamil, M.; Siddiqui, N.A.; Rahman, A.H.B.A.; Ibrahim, N.A.; Ismail, M.S.B.; Ahmed, N.; Usman, M.; Gul, Z.; Imran, Q.S. Facies Heterogeneity and Lobe Facies Multiscale Analysis of Deep-Marine Sand-Shale Complexity in the West Crocker Formation of Sabah Basin, NW Borneo. Appl. Sci. 2021, 11, 5513. [Google Scholar] [CrossRef]
- Zhang, X. The control of sandbody architecture on reservoir heterogeneities from the Shaximiao Formation of western Sichuan depression. Ph.D. Dissertation, Chengdu University of Technology, Chengdu, China, 2021. [Google Scholar]
- Tian, L.; Song, F.; Zhang, S.; Yang, Y. Heterogeneity characteristics of deep tight sandstone reservoir and its controlling factors: A case study of Jurassic Qigu Formation in Yongjin Area, Junggar Basin. J. Northeast. Pet. Univ. 2024, 48, 29–40. [Google Scholar]
- Mo, J. Particularly low permeability reservoir characteristics comprehensive evaluation of Chang3 reservoir in Huachi area, Ordos basin. Master’s Dissertation, Northwest University, Xi’an, China, 2010; pp. 1–97. [Google Scholar]
- Li, X.; Wei, W.; Wang, L.; Cai, J. Fractal dimension of digital 3D rock models with different pore structures. Energies 2022, 15, 7461. [Google Scholar] [CrossRef]
- Jouini, M.; Alabere, A.; Alsuwaidi, M.; Morad, S.; Bouchaala, F.; Jallad, O. Experimental and digital investigations of heterogeneity in lower cretaceous carbonate reservoir using fractal and multifractal concepts. Sci. Rep. 2023, 13, 20306. [Google Scholar] [CrossRef]
- Liu, M.; Xie, R.; Li, C.; Li, X.; Jin, G.; Guo, J. Determining the segmentation point for calculating the fractal dimension from mercury injection capillary pressure curves in tight sandstone. J. Geophys. Eng. 2018, 15, 1350–1362. [Google Scholar] [CrossRef]
- Wu, Y.; Tahmasebi, P.; Lin, C.; Zahid, M.; Dong, C.; Golab, A.; Ren, L. A comprehensive study on geometric, topological and fractal characterizations of pore systems in low-permeability reservoirs based on SEM, MICP, NMR, and X-ray CT experiments. Mar. Pet. Geol. 2019, 103, 12–28. [Google Scholar] [CrossRef]
- Rahner, M.; Halisch, M.; Fernandes, C.; Weller, A.; Santos, V. Fractal dimensions of pore spaces in unconventional reservoir rocks using X-ray nano- and micro-computed tomography. J. Nat. Gas Sci. Eng. 2018, 55, 298–311. [Google Scholar] [CrossRef]
- Gao, Y. Research on Brittleness Evaluation and Main Controlling Factors of Tight Oil Reservoirs—A Case Study from Triassic Yanchang Formation Chang 7 Oil Formation in Dingbian Dongrengou Oilfield, Ordos Basin. Master’s Dissertation, Northwest University, Xi’an, China, 2022; pp. 1–89. [Google Scholar]
- Li, A.; Qiang, Q.; Xu, L.; Zhang, W.; Yin, S.; Xie, H. Chemical characteristics of formation water of Chang 2 oil formation of Yanchang Formation in Zhaike area, Ordos Basin and its indication to dense oil reservoir. Nat. Gas Geosci. 2022, 33, 1637–1647. [Google Scholar]
- Wang, L.; Li, W.; Liu, Q.; Wang, D.; Zhang, M.; Bai, B. Lithofacies characteristics and sedimentary environment of Chang 7 black shale in the Yanchang Formation, Ordos Basin. J. Palaeogr. 2023, 25, 598–613. [Google Scholar]
- Lv, Q.; Xin, H.; Wang, L.; Luo, S.; Dan, W.; Feng, S. Sedimentary types, characteristics and model of lacustrine fine-grained gravity flow in the Member 7 of Trassic Yanchang Formation in Ningxian area, Ordos Basin. J. Palaeogeogr. 2023, 25, 823–840. [Google Scholar]
- Zhang, H. Study on the sedimentary facies of the member 4+5 and 3 of Triassic Yanchang Formation in Huachi area. Master’s Dissertation, Northwest University, Xi’an, China, 2010; pp. 1–94. [Google Scholar]
- Long, S.; Hou, Y.; Yang, C.; Guo, Y.; Zhang, J.; Zeng, Y.; Gao, N.; Li, S. Sequence stratigraphy and evolution of Triassic Chang 7 to Chang 3 members in Qingcheng area, southwestern Ordos Basin. Lith. Res. 2024, 36, 145–156. [Google Scholar]
- Dong, S.; Zeng, L.; Xu, C.; Dowd, P.; Gao, Z.; Mao, Z.; Wang, A. A novel method for extracting information on pores from cast thin-section images. Comput. Geosci. 2019, 130, 69–83. [Google Scholar] [CrossRef]
- Lindquist, W.; Venkatarangan, A.; Dunsmuir, J.; Wong, T. Pore and throat size distributions measured from synchrotron X-ray tomographic images of Fontainebleau sandstones. J. Geophys. Res. Solid. Earth. 2000, 105, 21509–21527. [Google Scholar] [CrossRef]
- Yan, Q.; Zhang, Y.; Fu, H.; Jian, M.; Wang, J.; Sui, S.; Fu, H.; Hao, R.; Guo, M. High pressure mercury injection and scanning electron microscopy applied to characterize micro-and nano-scale pore throats in tight sandstone reservoirs: A case study of the fourth member of Shahejie Formation in Yi176 block, Zhanhua Sag, Bohai Bay Basin. Pet. Geo. Exper. 1999, 104, 292–301. [Google Scholar]
- Coenen, T.; Haegel, N. Cathodoluminescence for the 21st century: Learning more from light. Appl. Phys. Rev. 2017, 4, 031103. [Google Scholar] [CrossRef]
- Shao, X.; Pang, X.; Jiang, F.; Li, L.; Huyan, Y.; Zheng, D. Reservoir Characterization of Tight Sandstones Using Nuclear Magnetic Resonance and Incremental Pressure Mercury Injection Experiments: Implication for Tight Sand Gas Reservoir Quality. Energ. Fuel. 2017, 31, 10420–10431. [Google Scholar] [CrossRef]
- SY/T 5368-2000; Thin Section Examination of Rock. Standards Press of China: Beijing, China, 2000.
- SY/T 5163-2018; Thin Section Examination of Rock. Standards Press of China: Chengdu, China, 2018.
- SY/T 5162-2014; Analytical Method of Rock Sample by Scanning Electron Microscope. Standards Press of China: Dongying, China, 2014.
- SY/T 5916-2013; Identification Method of Rocks and Minerals by Cathode Luminescence. Standards Press of China: Beijing, China, 2013.
- SY/T 5336-2006; Recommend Practices for Core Analysis. Standards Press of China: Beijing, China, 2006.
- SY/T 5346-2005; Rock Capillary Pressure Measurement. Standards Press of China: Beijing, China, 2005.
- Guo, R.; Xie, Q.; Qu, X.; Chu, M.; Li, S.; Ma, D.; Ma, X. Fractal characteristics of pore-throat structure and permeability estimation of tight sandstone reservoirs: A case study of Chang 7 of the Upper Triassic Yanchang Formation in Longdong area, Ordos Basin, China. J. Pet. Sci. Eng. 2020, 184, 106555. [Google Scholar] [CrossRef]
- Zhong, X.; Zhu, Y.; Jiao, T.; Qi, Z.; Luo, J.; Xie, Y.; Liu, L. Microscopic pore throat structures and water flooding in heterogeneous low-permeability sandstone reservoirs: A case study of the Jurassic Yan’an Formation in the Huanjiang area, Ordos Basin, Northern China. J. Asian Earth Sci. 2021, 219, 104903. [Google Scholar] [CrossRef]
- Wu, Y.; Liu, C.; Ouyang, S.; Luo, B.; Zhao, D.; Sun, W.; Awan, R.; Lu, Z.; Li, G.; Zang, Q. Investigation of pore-throat structure and fractal characteristics of tight sandstones using HPMI, CRMI, and NMR methods: A case study of the lower Shihezi Formation in the Sulige area, Ordos Basin. J. Pet. Sci. Eng. 2022, 210, 110053. [Google Scholar] [CrossRef]
- Qu, Y.; Sun, W.; Tao, R.; Luo, B.; Chen, L.; Ren, D. Pore-throat structure and fractal characteristics of tight sandstones in Yanchang Formation, Ordos Basin. Mar. Pet. Geol. 2020, 120, 104573. [Google Scholar] [CrossRef]
- Han, Z.; Zhou, Y.; Wei, F.; Zhang, Q.; Fan, P.; Deng, C.; Gong, J.; Cheng, X.; Ma, E.; Wu, H. Pore-Throat Structure and Fractal Characteristics of Tight Sandstones: A Case Study from the Chang 63 Sublayer, Southeast Ordos Basin. Geofluids. 2023, 2023, 3832452. [Google Scholar] [CrossRef]
- Zhang, W.; Shi, Z.; Tian, Y.; Xie, D.; Li, W. The combination of high-pressure mercury injection and rate-controlled mercury injection to characterize the pore-throat structure in tight sandstone reservoirs. FBOGF 2021, 28, 14–20. [Google Scholar] [CrossRef]
- Xoaoth, B. Song, S., Wang, Y., Eds. and Translators; Coal and Gas Outburst; China Industry Press: Beijing, China, 1966. [Google Scholar]
- Zou, R.; Wang, L.; Luo, R.; Zhang, L.; Deng, H.; Meng, Z.; Zou, R.; Zhang, Y. Full—Range pore throat radius distribution and fractal characteristics of different types of reservoirs in deep carbonate gas reservoirs: A case study of Deng—4Member in Gaoshiti—Moxi Area, Sichuan Basin. J. China. U. Min. Techno. 2024, 53, 1218–1236. [Google Scholar]
- Chen, F.; Zhang, X.; Liu, R.; Zhang, S.; Zhai, Z. Pore structure characteristics of deep Upper Paleozoic coal measure tight sandstone reservoirs in northeast Qinshui Basin and its reservoir geological significance. J. Coal Sci. Eng. 2024, 1–16. Available online: https://link.cnki.net/urlid/11.2402.td.20241111.1527.007 (accessed on 21 April 2025).
- Yang, G.; Wu, K.; Zhang, B.; Yin, Z.; Wang, J.; Wang, M.; He, X.; Xing, H.; Deng, L.; Zhang, K.; et al. Application of U-Pb isotopic dating and heavy mineral assemblage to source-sink system analysis of the Paleogene in western margin of Qaidam Basin. Mar. Ori. Pet. Geo. 2023, 30, 177–185. [Google Scholar]
- Zhang, H.; Li, X.; Liu, J.; Wang, Y.; Guo, L.; Wu, Z.; Tian, Y. A Fractal Characteristics Analysis of the Pore Throat Structure in Low-Permeability Sandstone Reservoirs: A Case Study of the Yanchang Formation, Southeast Ordos Basin. Fractal Fract. 2025, 9, 224. [Google Scholar] [CrossRef]
- Cai, L.; Yang, T.; Tian, J.; Yi, J.; Ren, Q. Advances in Studies of Development and Growth Mechanisms of Clay Minerals in Tight Sandstone Reservoirs. J. Pet. Sci. Eng. 2023, 41, 1859–1889. [Google Scholar]

| Sample | Well Name | Depth/m | Lithology |
|---|---|---|---|
| B125 | B125 | 1742.5 | Fine-grained arkose |
| B127-1 | B127 | 1584.9 | Medium-fine-grained arkose |
| B137 | B137 | 1598.4 | Medium-fine-grained arkose |
| B269-1 | B269 | 1699.7 | Fine-grained arkose |
| B269-2 | B269 | 1699.8 | Fine-grained arkose |
| B269-3 | B269 | 1700 | Fine-grained arkose |
| B269-4 | B269 | 1700.2 | Fine-grained arkose |
| B270 | B270 | 1801.12 | Very fine, fine-grained arkose |
| B270-1 | B270 | 1741 | Very fine, fine-grained arkose |
| B270-2 | B270 | 1741.1 | Fine-grained arkose |
| B270-4 | B270 | 1800.7 | Fine-grained arkose |
| B270-6 | B270 | 1801.8 | Fine-grained arkose |
| B280 | B280 | 1714.02 | Fine-grained arkose |
| B282 | B282 | 1802.4 | Fine-grained lithic arkose |
| B283-1 | B283 | 1704.9 | Fine-grained arkose |
| B283-3 | B283 | 1705.6 | Fine-grained arkose |
| B283-4 | B283 | 1705.9 | Fine-grained arkose |
| B283-6 | B283 | 1718.6 | Fine-grained arkose |
| B478 | B478 | 1837 | Fine-grained arkose |
| B478-3 | B478 | 1837.7 | Fine-grained arkose |
| B483-1 | B483 | 1812.5 | Fine-grained arkose |
| B483-2 | B483 | 1812.9 | Fine-grained arkose |
| B483-3 | B483 | 1814 | Medium fine-grained arkose |
| B483-4 | B483 | 1816.1 | Fine-grained arkose |
| B511 | B511 | 1832.1 | Fine-grained arkose |
| B511-2 | B511 | 1833 | Very fine. fine-grained arkose |
| B511-3 | B511 | 1833.1 | Very fine, fine-grained arkose |
| B512-1 | B512 | 1761.2 | Very fine, fine-grained arkose |
| B512-2 | B512 | 1762.7 | Medium-grained arkose |
| B521-1 | B521 | 1600.8 | Fine-grained feldspathic siltstone |
| B521-2 | B521 | 1601.5 | Fine-grained feldspathic siltstone |
| B522 | B522 | 1652.3 | Very fine, fine-grained arkose |
| B523-1 | B523 | 1820.6 | Very fine, fine-grained arkose |
| B523-2 | B523 | 1821 | Fine-medium grained arkose |
| B523-3 | B523 | 1822.3 | Argillaceous very fine, fine-grained lithic arkose |
| B523-5 | B523 | 1822.7 | Fine-grained arkose |
| H172-1 | H172 | 1797.5 | Fine-grained arkose |
| H172-2 | H172 | 1801.5 | Medium fine-grained arkose |
| H172-3 | H172 | 1803.5 | Medium-grained arkose |
| H184 | H184 | 1815.6 | Fine-grained arkose |
| H620 | H620 | 1813.5 | Very fine, fine-grained arkose |
| H620-1 | H620 | 1820.8 | Fine-grained arkose |
| H620-2 | H620 | 1821.6 | Medium fine-grained arkose |
| H620-3 | H620 | 1822.6 | Medium fine-grained arkose |
| L486 | L486 | 1622.8 | Argillaceous very fine, fine-grained lithic arkose |
| P28-021 | P28-021 | 1750.4 | Fine-grained arkose |
| P38-71 | P38-71 | 1679.8 | Fine-grained arkose |
| Y220-1 | Y220-1 | 1705.9 | Fine-grained lithic arkose |
| Y238 | Y238 | 1757.13 | Medium fine-grained feldspathic litharenite |
| Y53-1 | Y53 | 1493 | Fine-grained feldspathic litharenite |
| Sample | Porosity (%) | Permeability (mD) | Sorting Coefficient | Skewness | Structural Coefficient (φ) | HMIP | CMIP | ||
|---|---|---|---|---|---|---|---|---|---|
| Entry Pressure (MPa) | Maximum Mercury Saturation (%) | Entry Pressure (MPa) | Maximum Mercury Saturation (%) | ||||||
| B522 | 15.297 | 1.080 | 1.62 | 0.30 | 1100.96 | 0.30 | 98.56 | 0.30 | 50.95 |
| B270 | 18.100 | 4.360 | 1.08 | 0.58 | 1252.07 | 0.18 | 97.92 | 0.18 | 63.95 |
| B478 | 16.400 | 1.700 | 2.43 | 0.23 | 383.55 | 0.34 | 96.60 | 0.34 | 51.67 |
| P38-71 | 17.200 | 2.390 | 0.75 | 0.41 | 534.49 | 0.21 | 96.85 | 0.21 | 58.46 |
| H620 | 15.886 | 1.594 | 1.52 | 0.18 | 357.57 | 0.30 | 96.48 | 0.30 | 66.85 |
| B511 | 13.000 | 0.532 | 1.82 | 0.10 | 372.36 | 0.28 | 96.68 | 0.68 | 53.11 |
| P28-021 | 13.105 | 0.828 | 1.26 | 0.16 | 161.94 | 0.30 | 98.74 | 0.30 | 62.59 |
| Y220-1 | 12.300 | 0.500 | 2.46 | 0.36 | 17.45 | 1.36 | 93.15 | 0.36 | 57.63 |
| B137 | 7.905 | 0.062 | 2.04 | 0.28 | 11.85 | 1.26 | 94.95 | 1.26 | 53.37 |
| Y238 | 8.109 | 0.060 | 1.94 | 0.15 | 16.52 | 1.12 | 95.93 | 1.12 | 50.95 |
| B125 | 4.608 | 0.010 | 2.04 | −0.07 | 0.15 | 3.51 | 91.44 | 3.51 | 16.37 |
| L486 | 4.096 | 0.040 | 2.23 | −0.33 | 7.93 | 2.99 | 90.17 | 1.99 | 32.55 |
| Sample | Dh1 | R2 | Dh2 | R2 | Dc3 | R2 | Dc4 | R2 |
|---|---|---|---|---|---|---|---|---|
| B522 | 1.732 | 0.944 | 2.323 | 0.981 | 2.726 | 0.999 | 2.954 | 0.950 |
| B270 | 1.732 | 0.944 | 2.323 | 0.981 | 2.777 | 0.998 | 2.845 | 0.844 |
| B478 | 1.990 | 0.975 | 2.504 | 0.985 | 2.725 | 0.995 | 2.959 | 0.981 |
| P38-71 | 2.260 | 0.973 | 2.285 | 0.999 | 2.771 | 0.999 | 2.905 | 0.707 |
| H620 | 2.195 | 0.982 | 2.268 | 0.980 | 2.636 | 0.997 | 2.927 | 0.738 |
| B511 | 1.990 | 0.974 | 2.331 | 0.922 | 2.693 | 0.992 | 2.960 | 0.987 |
| P28-021 | 0.967 | 0.900 | 2.380 | 0.988 | 2.679 | 0.998 | 2.928 | 0.830 |
| Y220-1 | 1.957 | 0.923 | 2.722 | 0.995 | 2.711 | 0.999 | 2.935 | 0.935 |
| B137 | 2.018 | 0.995 | 2.377 | 0.992 | 2.626 | 0.931 | 2.990 | 0.972 |
| Y238 | 1.731 | 0.951 | 2.307 | 0.995 | 2.825 | 0.994 | 2.984 | 0.965 |
| B125 | 1.323 | 0.969 | 2.688 | 0.927 | 2.971 | 0.823 | 2.972 | 0.966 |
| L486 | 1.886 | 0.969 | 2.614 | 0.877 | 2.805 | 0.987 | 2.984 | 0.954 |
| Parameters | Type I | Type II | Type III |
|---|---|---|---|
| Sedimentation | Underwater distributary channel | Underwater levee | Interdistributary |
| Pore types | Large intergranular pores, dissolution pores | Small-medium intergranular pores, dissolution pores | Intercrystalline pores, intraparticle pores |
| Throat types | Pore shrinkage-type, wide sheet-type throats | Narrow sheet-type, neck-shaped throats | Tubular throats |
| Permeability (mD) | >0.5 | 0.05~0.5 | <0.05 |
| Porosity (%) | >12 | 7~12 | <7 |
| Entry pressure (MPa) | <1 | 1~2 | >2 |
| Maximum mercury saturation (%) | >96 | 92~96 | <92 |
| Full-size pore-throat distribution characteristics and fractal dimension fitting curves | 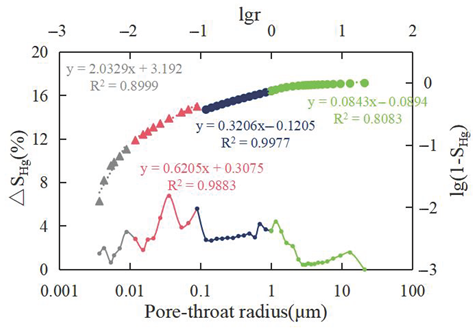 | 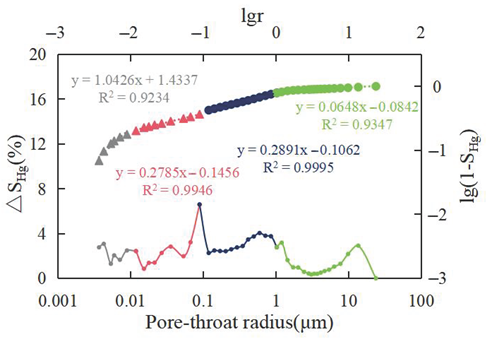 | 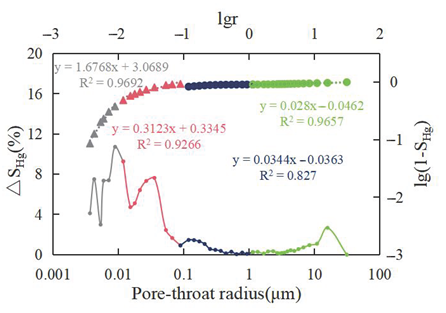 |
| Typical HPMI curve | 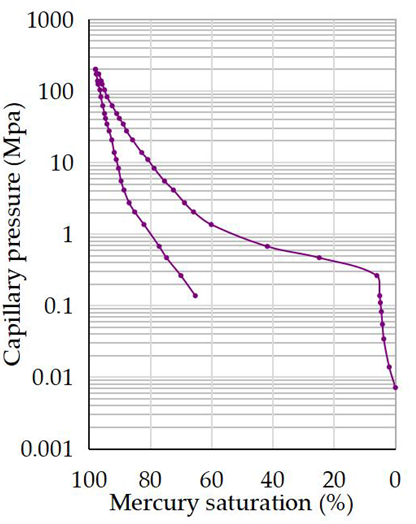 | 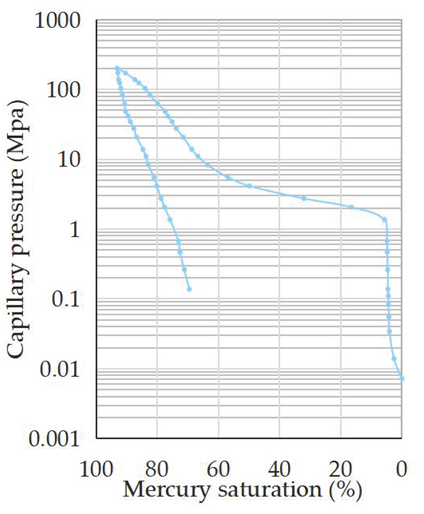 | 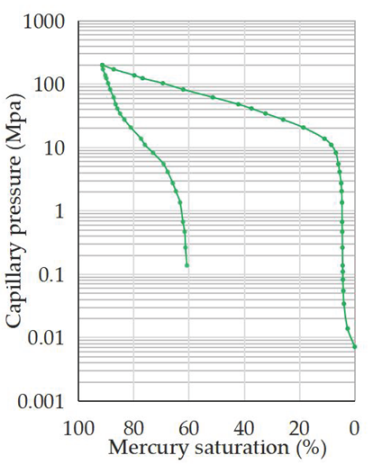 |
| Typical CRMI curve | 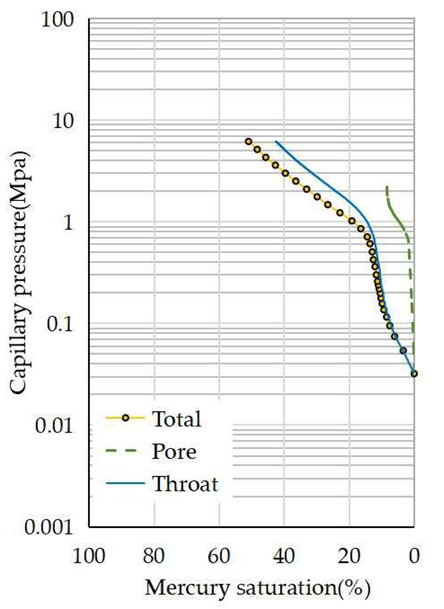 | 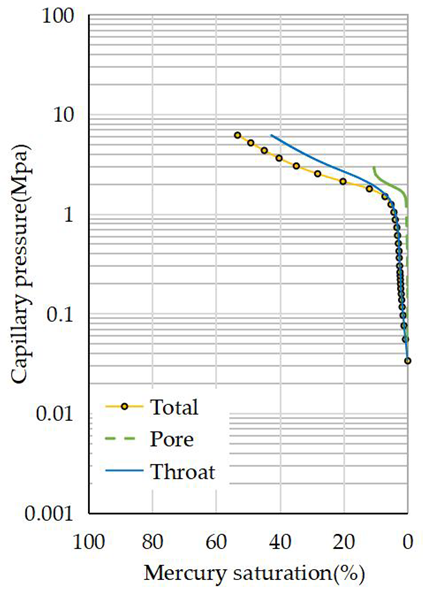 | 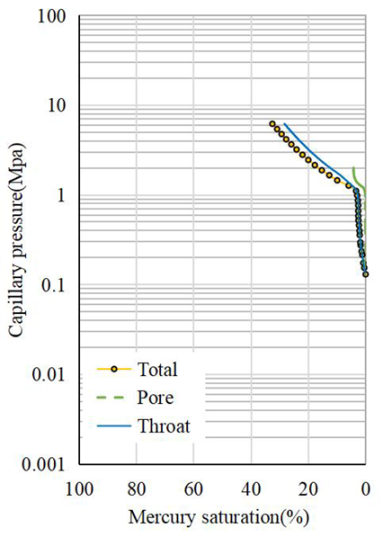 |
Disclaimer/Publisher’s Note: The statements, opinions and data contained in all publications are solely those of the individual author(s) and contributor(s) and not of MDPI and/or the editor(s). MDPI and/or the editor(s) disclaim responsibility for any injury to people or property resulting from any ideas, methods, instructions or products referred to in the content. |
© 2025 by the authors. Licensee MDPI, Basel, Switzerland. This article is an open access article distributed under the terms and conditions of the Creative Commons Attribution (CC BY) license (https://creativecommons.org/licenses/by/4.0/).
Share and Cite
Zhang, H.; Wang, C.; Sui, J.; Lv, Y.; Guo, L.; Wu, Z. Pore-Throat Structure, Fractal Characteristics, and Main Controlling Factors in Extremely Low-Permeability Sandstone Reservoirs: The Case of Chang 3 Section in Huachi Area, Ordos Basin. Fractal Fract. 2025, 9, 439. https://doi.org/10.3390/fractalfract9070439
Zhang H, Wang C, Sui J, Lv Y, Guo L, Wu Z. Pore-Throat Structure, Fractal Characteristics, and Main Controlling Factors in Extremely Low-Permeability Sandstone Reservoirs: The Case of Chang 3 Section in Huachi Area, Ordos Basin. Fractal and Fractional. 2025; 9(7):439. https://doi.org/10.3390/fractalfract9070439
Chicago/Turabian StyleZhang, Huanmeng, Chenyang Wang, Jinkuo Sui, Yujuan Lv, Ling Guo, and Zhiyu Wu. 2025. "Pore-Throat Structure, Fractal Characteristics, and Main Controlling Factors in Extremely Low-Permeability Sandstone Reservoirs: The Case of Chang 3 Section in Huachi Area, Ordos Basin" Fractal and Fractional 9, no. 7: 439. https://doi.org/10.3390/fractalfract9070439
APA StyleZhang, H., Wang, C., Sui, J., Lv, Y., Guo, L., & Wu, Z. (2025). Pore-Throat Structure, Fractal Characteristics, and Main Controlling Factors in Extremely Low-Permeability Sandstone Reservoirs: The Case of Chang 3 Section in Huachi Area, Ordos Basin. Fractal and Fractional, 9(7), 439. https://doi.org/10.3390/fractalfract9070439