

Fractal–Fractional Synergy in Geo-Energy Systems: A Multiscale Framework for Stress Field Characterization and Fracture Network Evolution Modeling


Abstract
1. Introduction
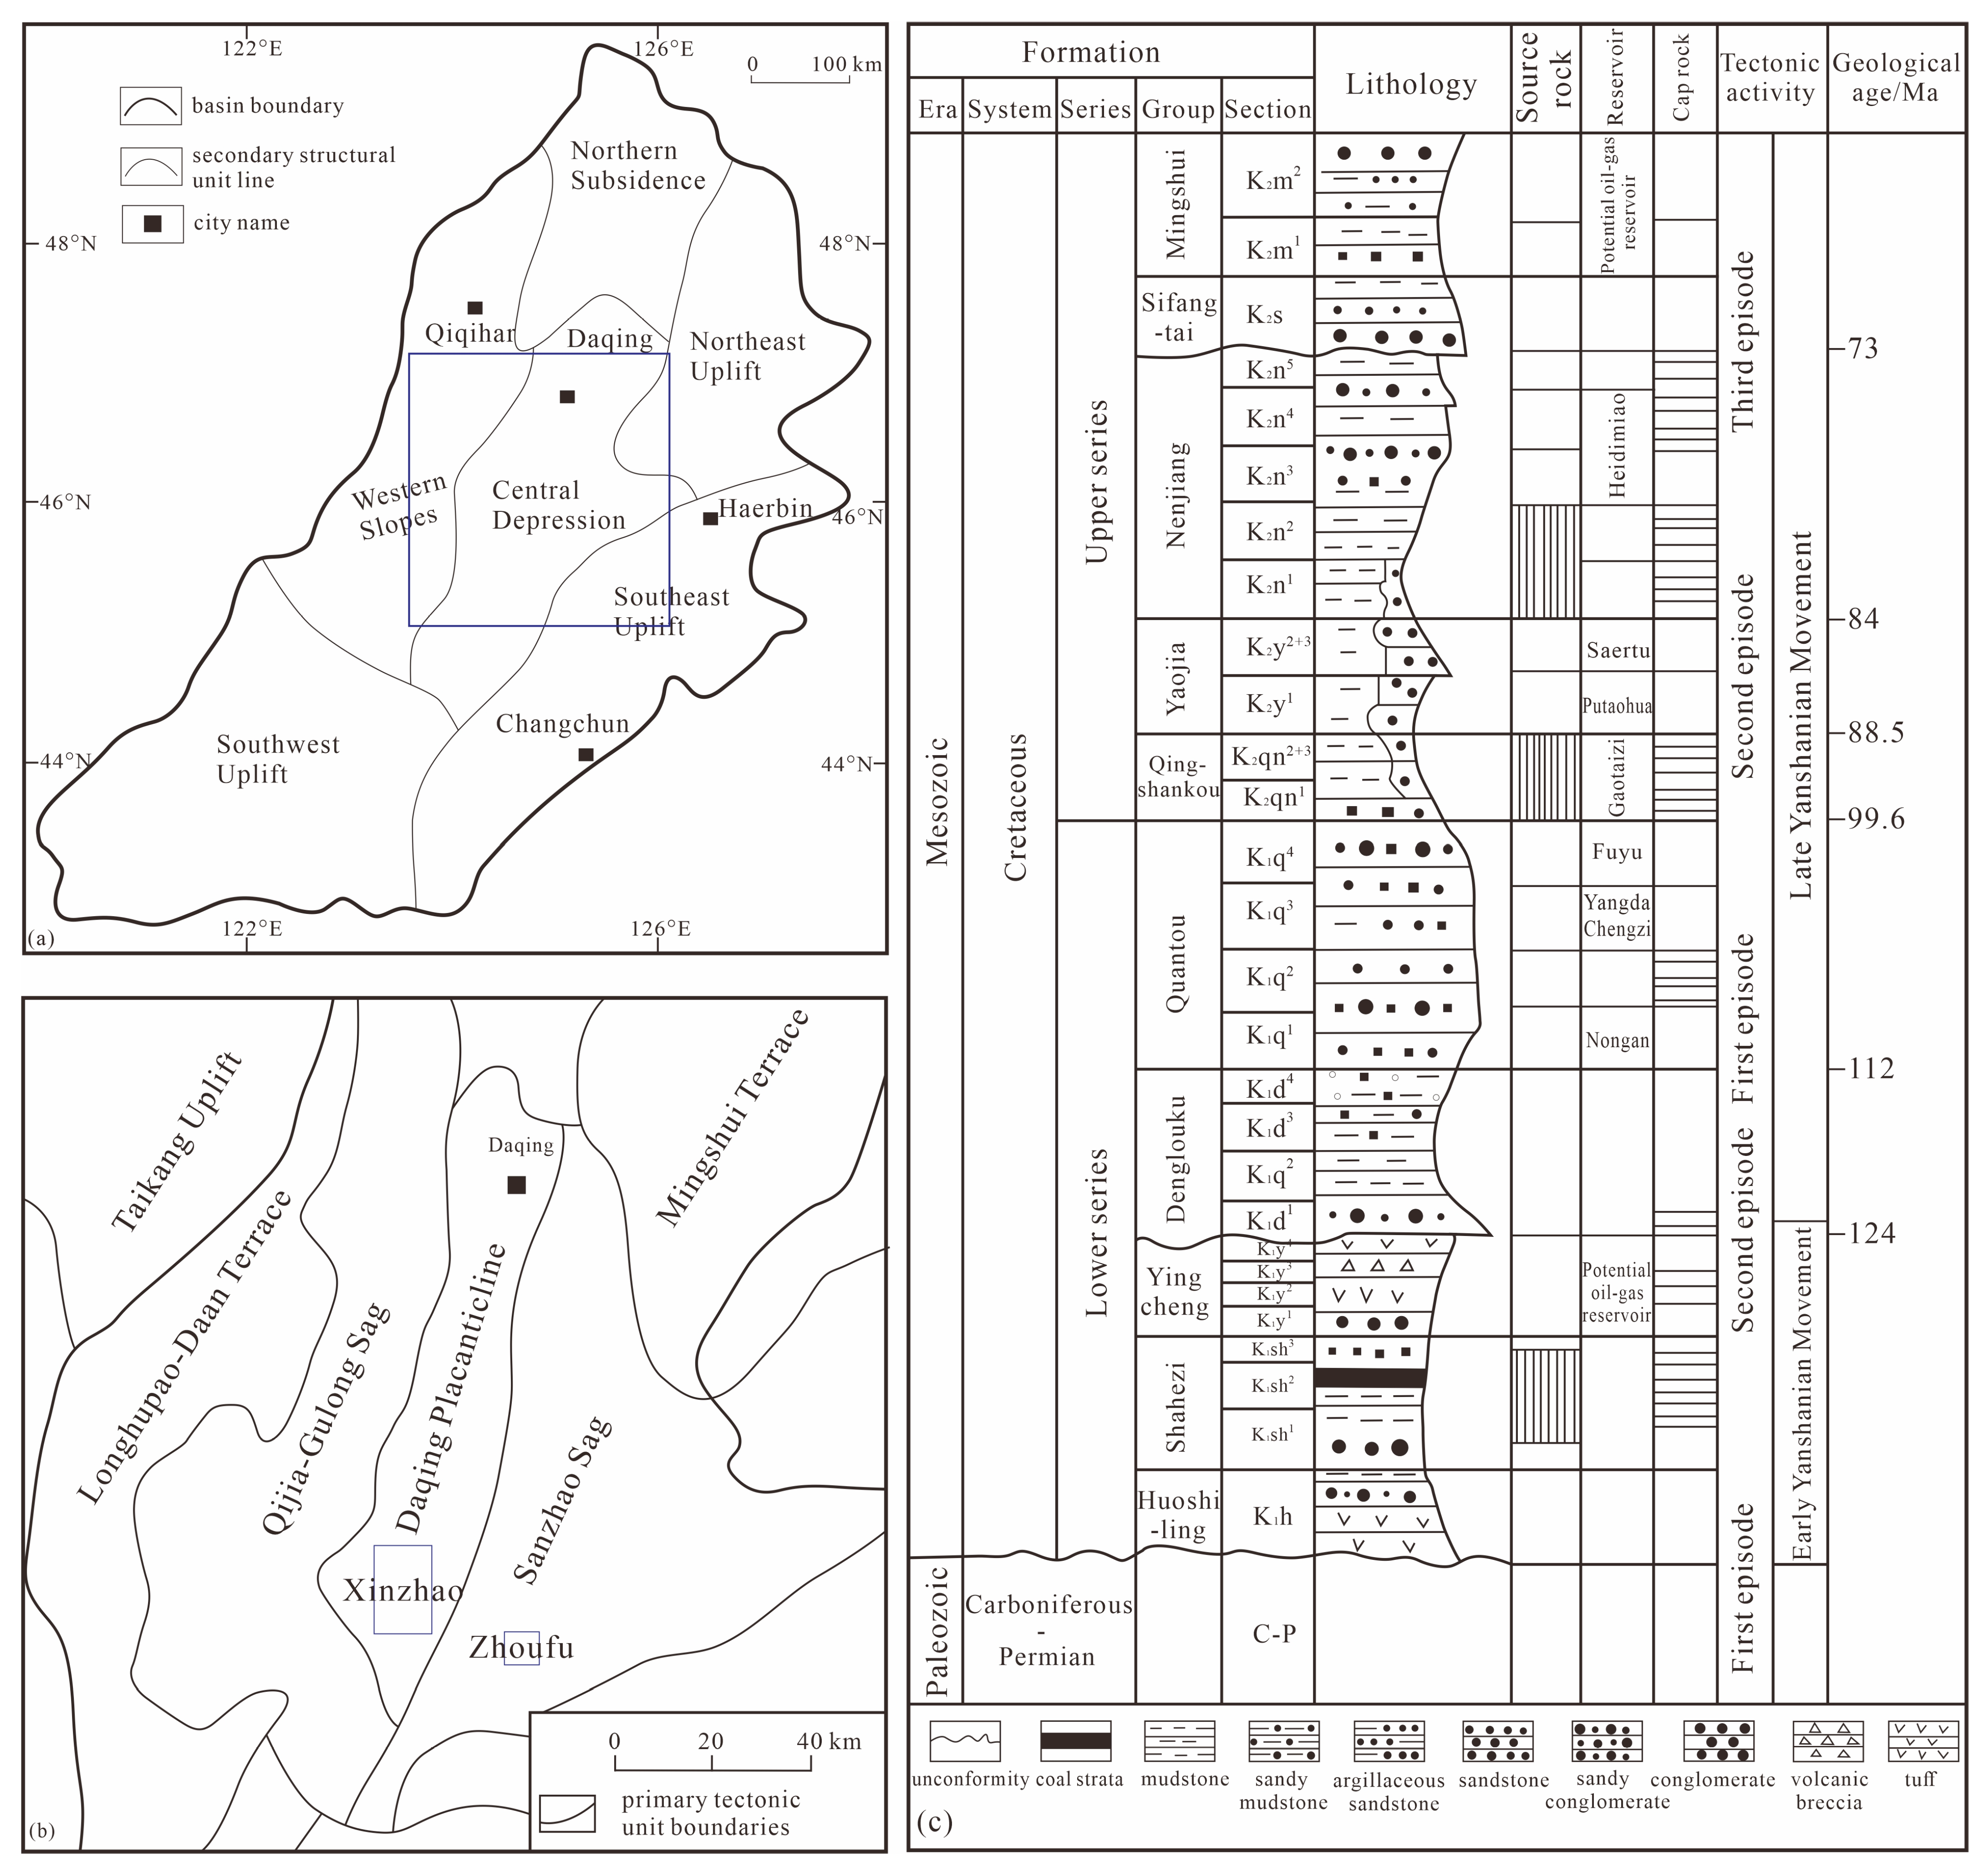
2. Geologic Setting
3. Methods and Techniques
3.1. Fractal-Informed Core Observations and Multiscale Sampling
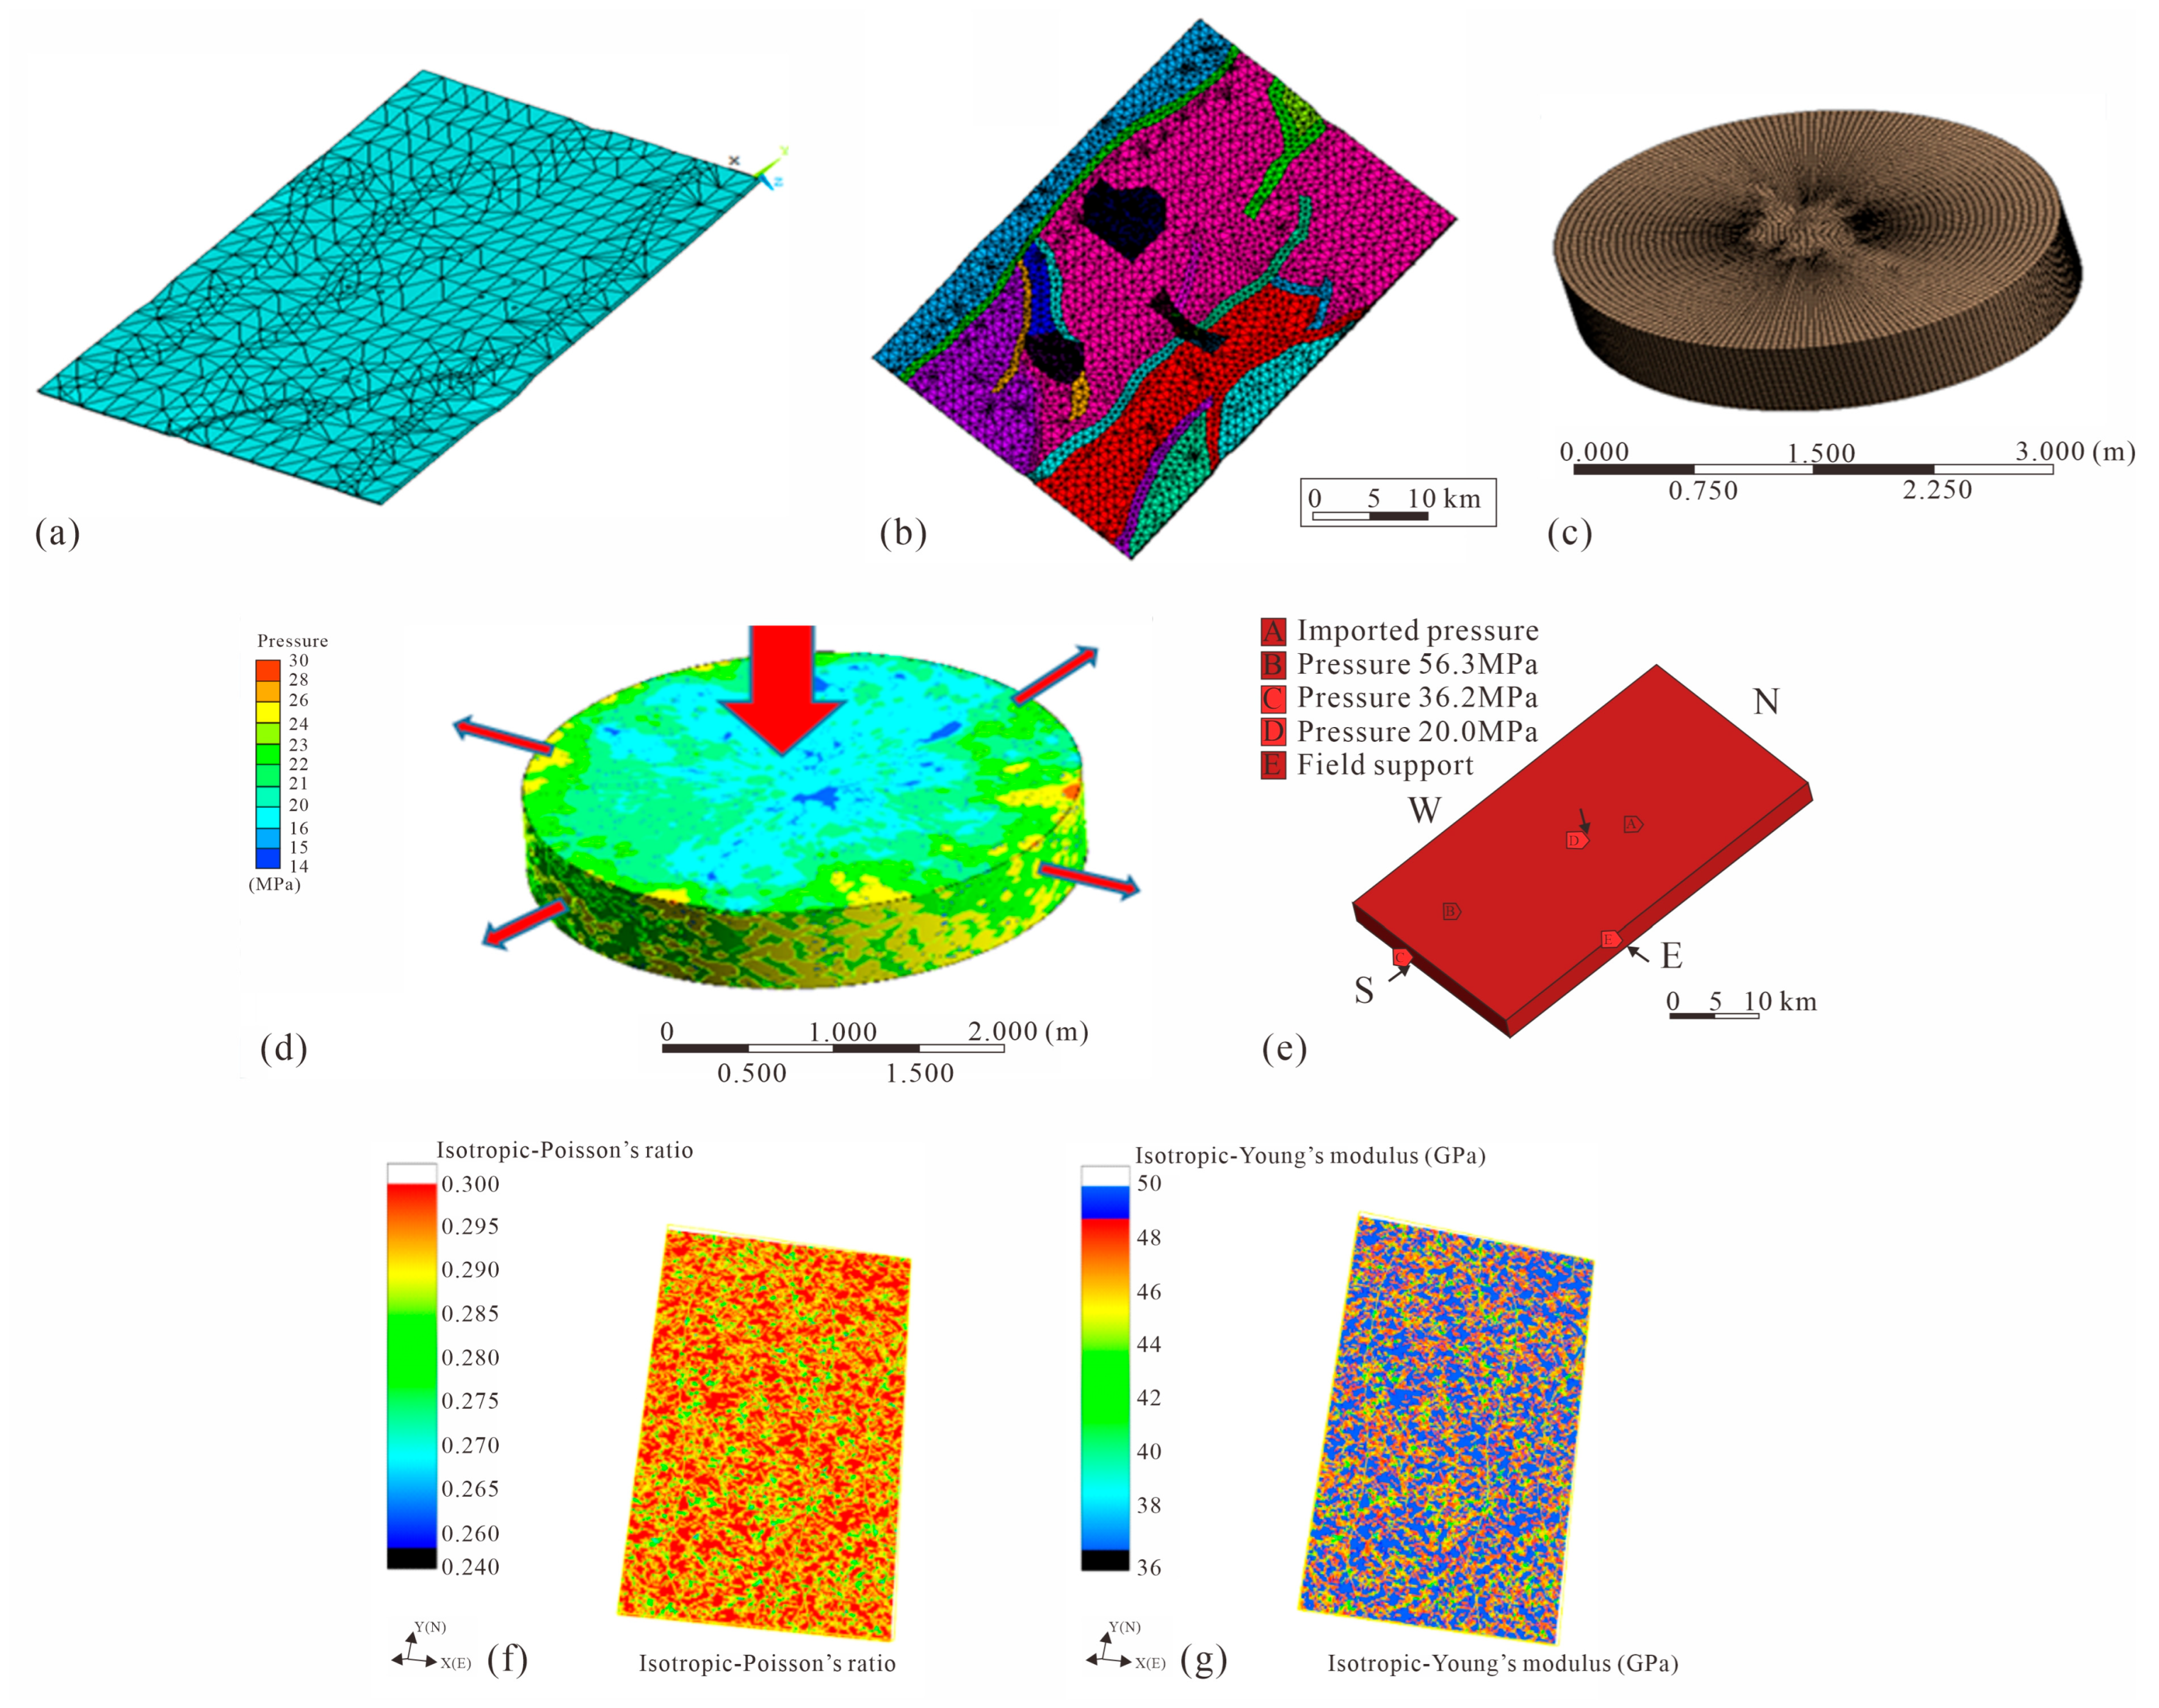
3.2. Fractional-Order Rock Mechanical Characterization
3.3. Fractal–Fractional Synergy in 3D Heterogeneous Parameter Field Construction
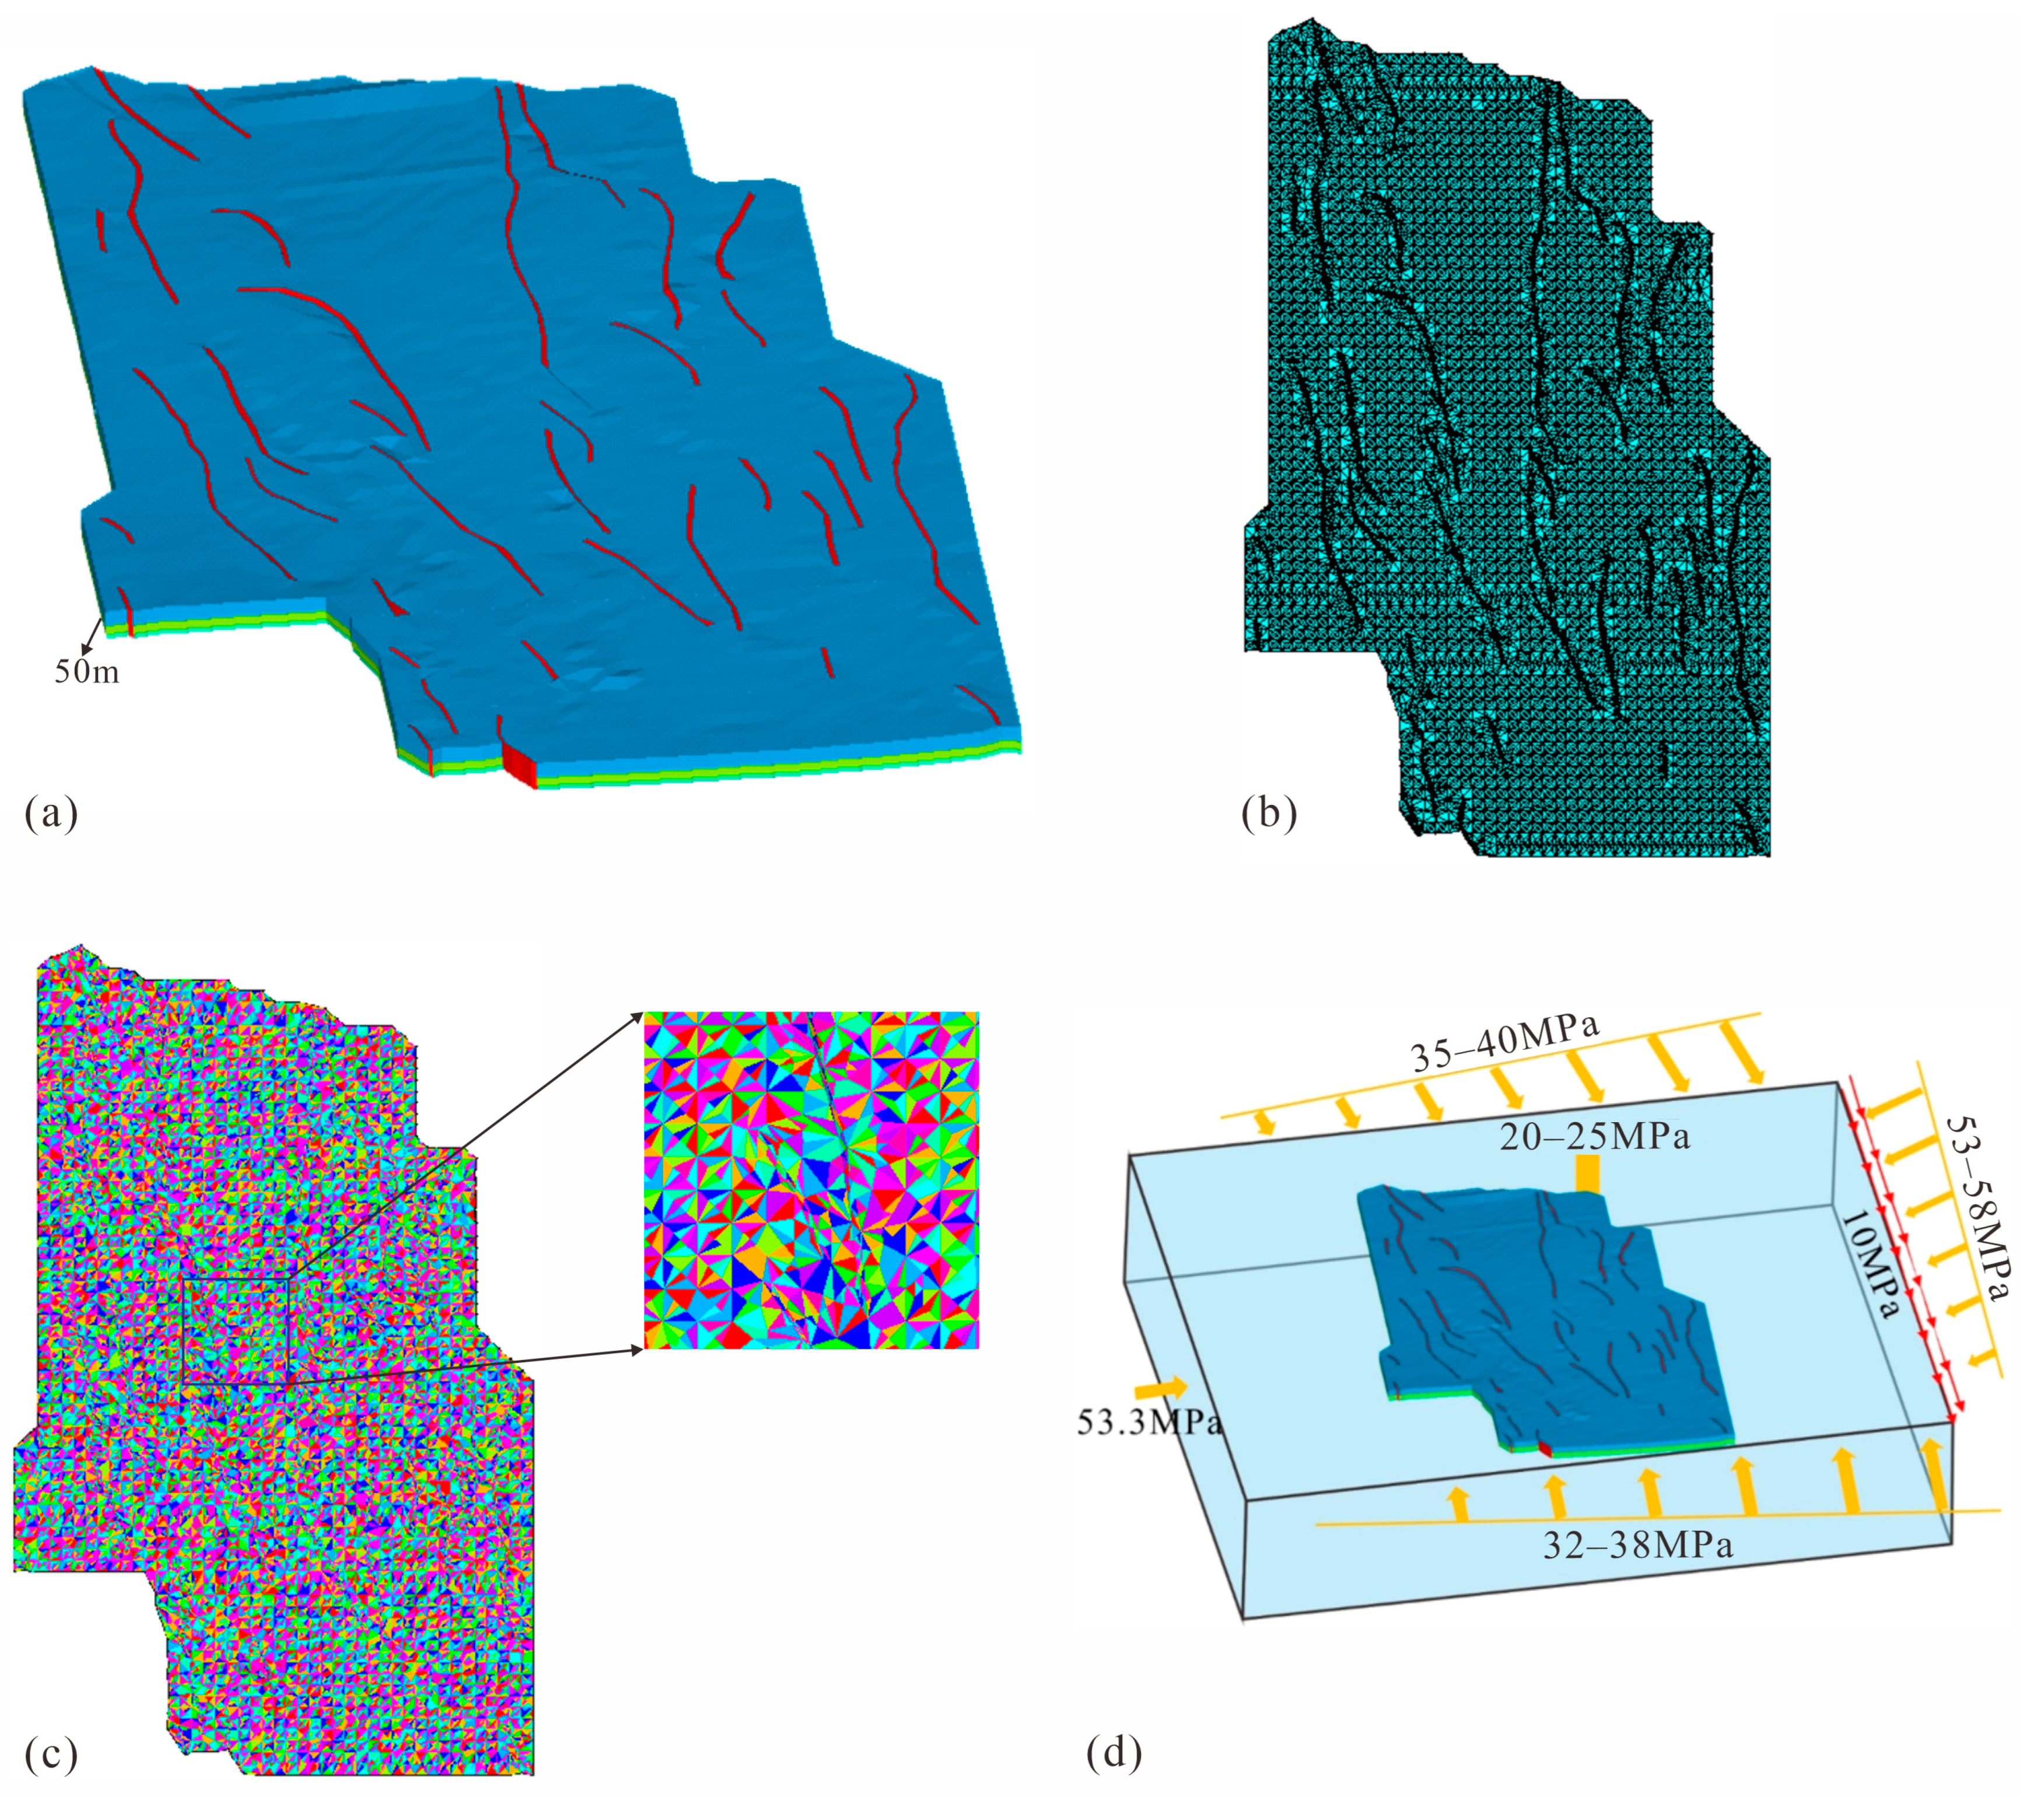
3.4. In Situ Stress Simulation and Fracture Prediction via Fractal–Fractional Multiscale Modeling
- (1)
- If σ3 > 0, the volume and linear density of the fracture can be calculated as follows:
- (2)
- If σ3 < 0, two situations can be distinguished.
3.5. Numerical Simulation of Fluid–Structure Interaction Driven by Fractal–Fractional Methods
4. Results
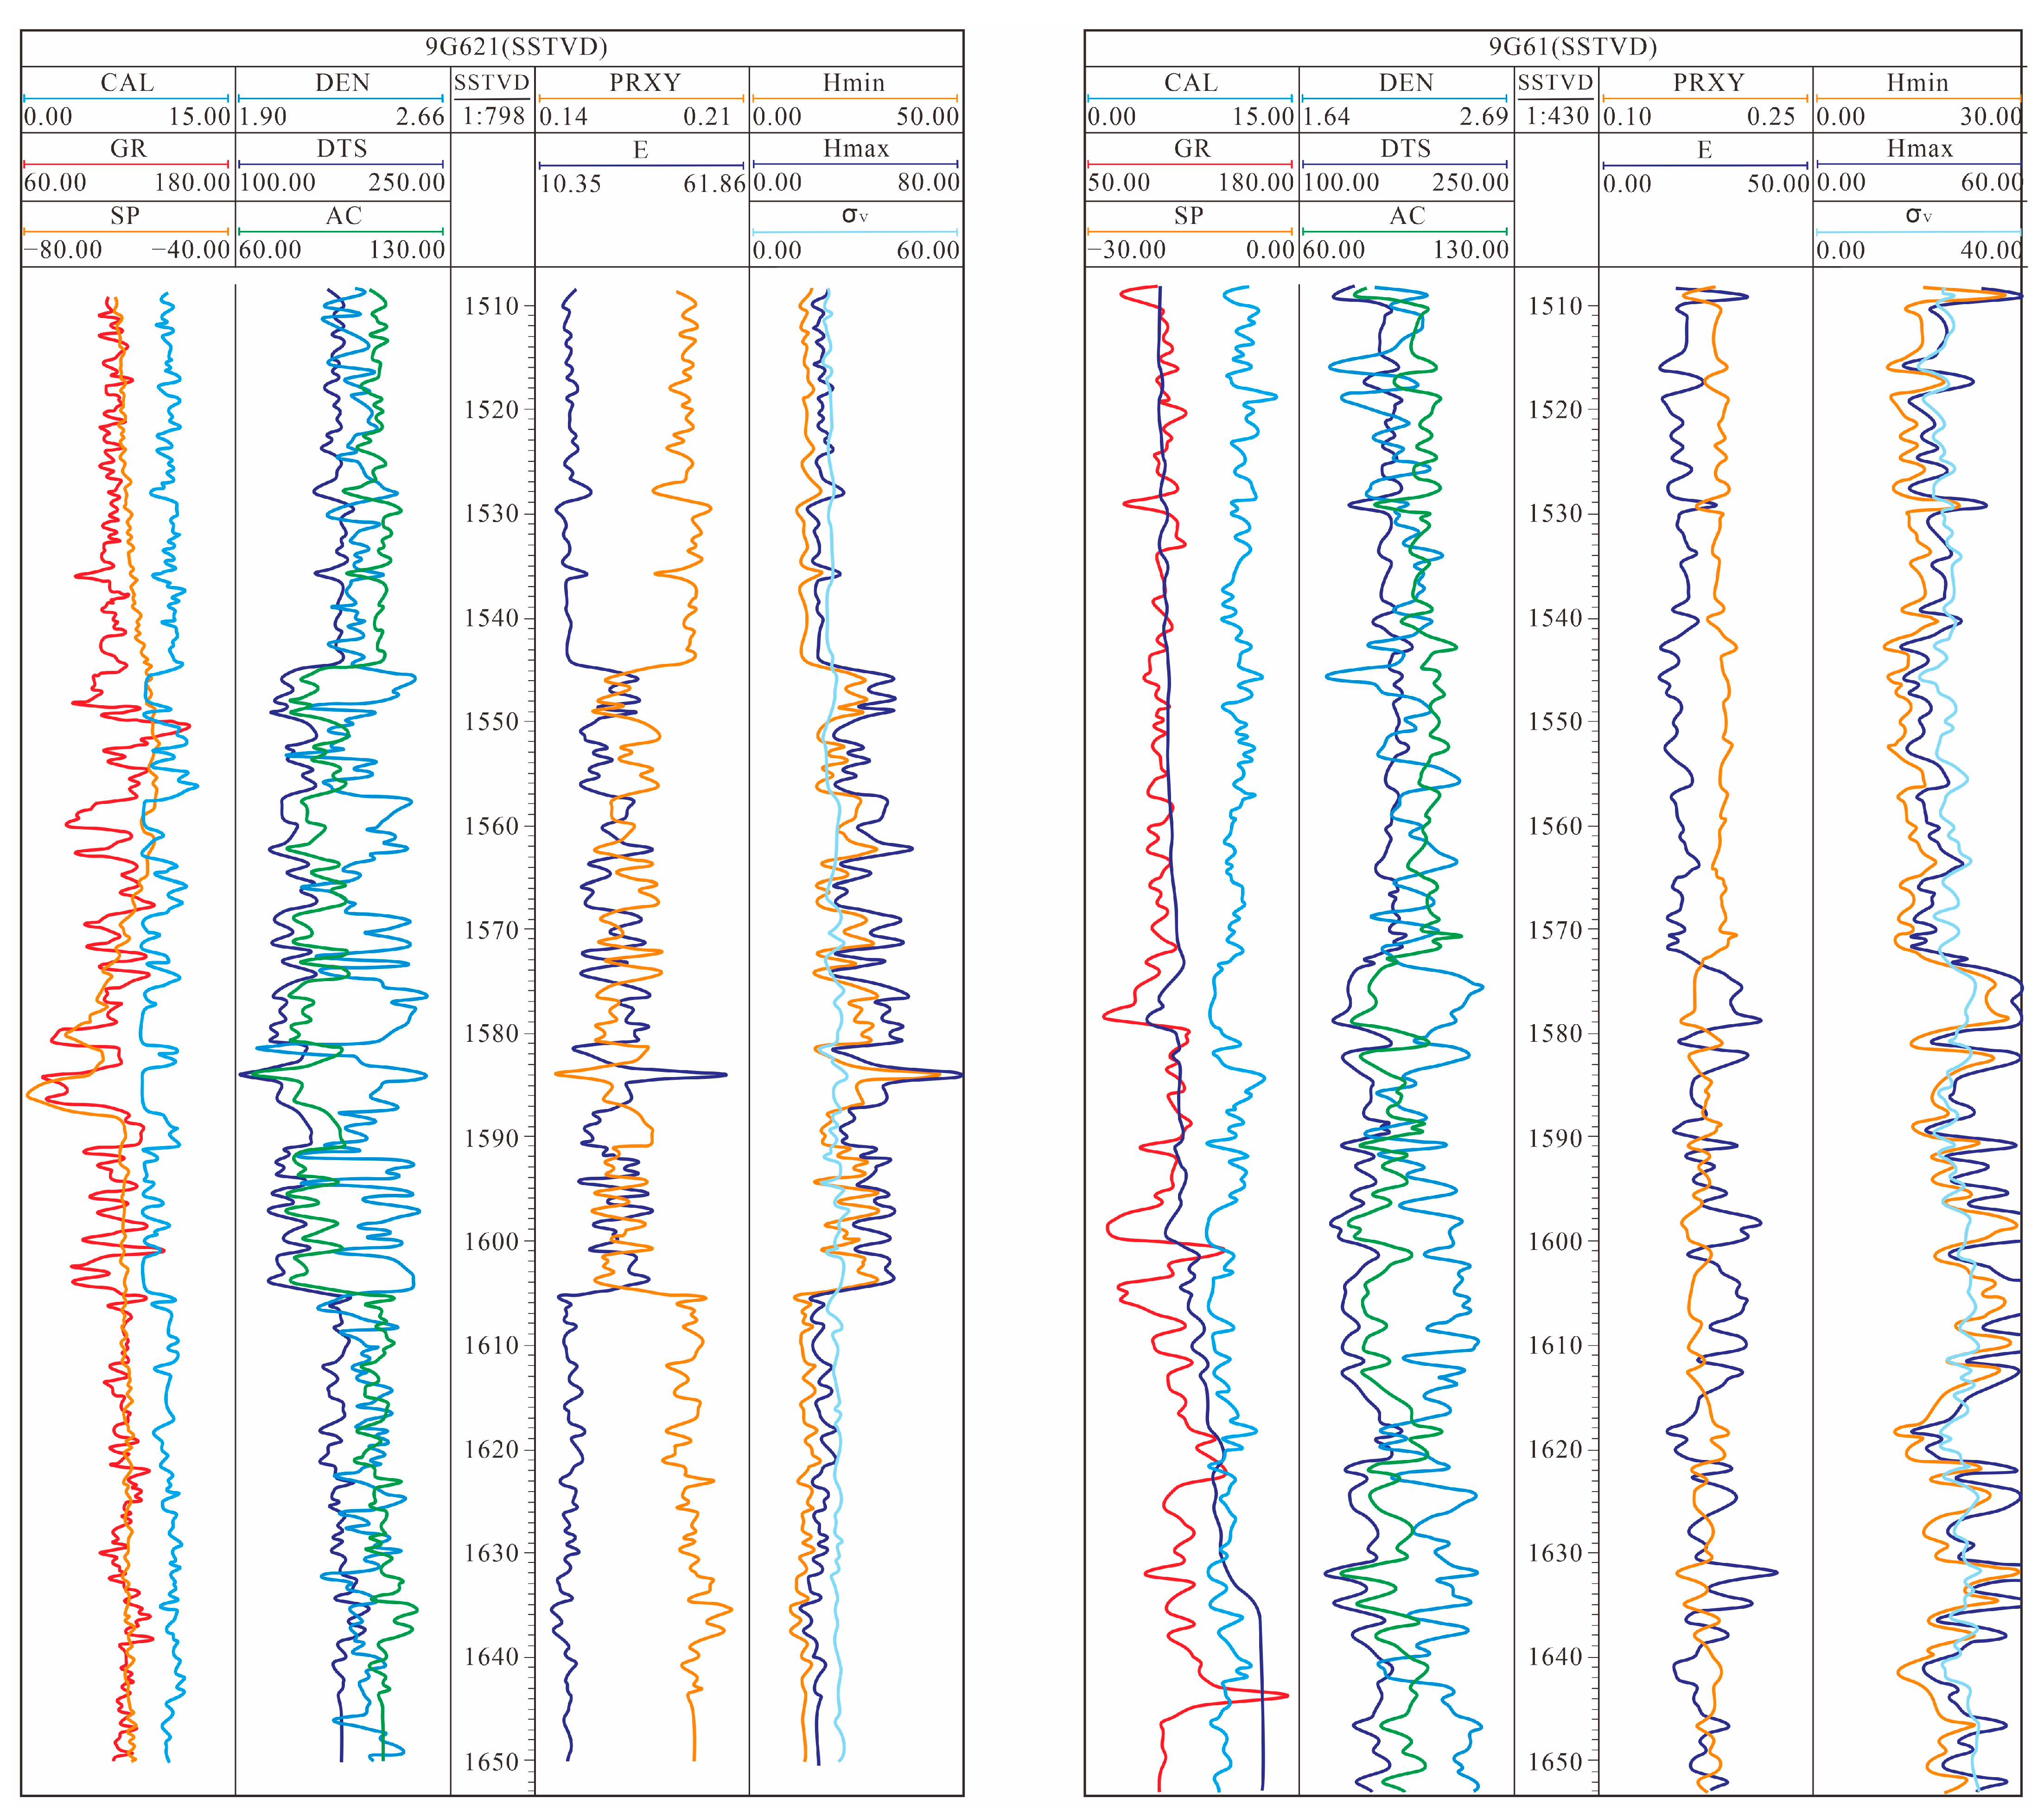
4.1. Fractal–Fractional Analysis of Mechanical Parameters and Multiscale In Situ Stress Characteristics in Single-Well Systems
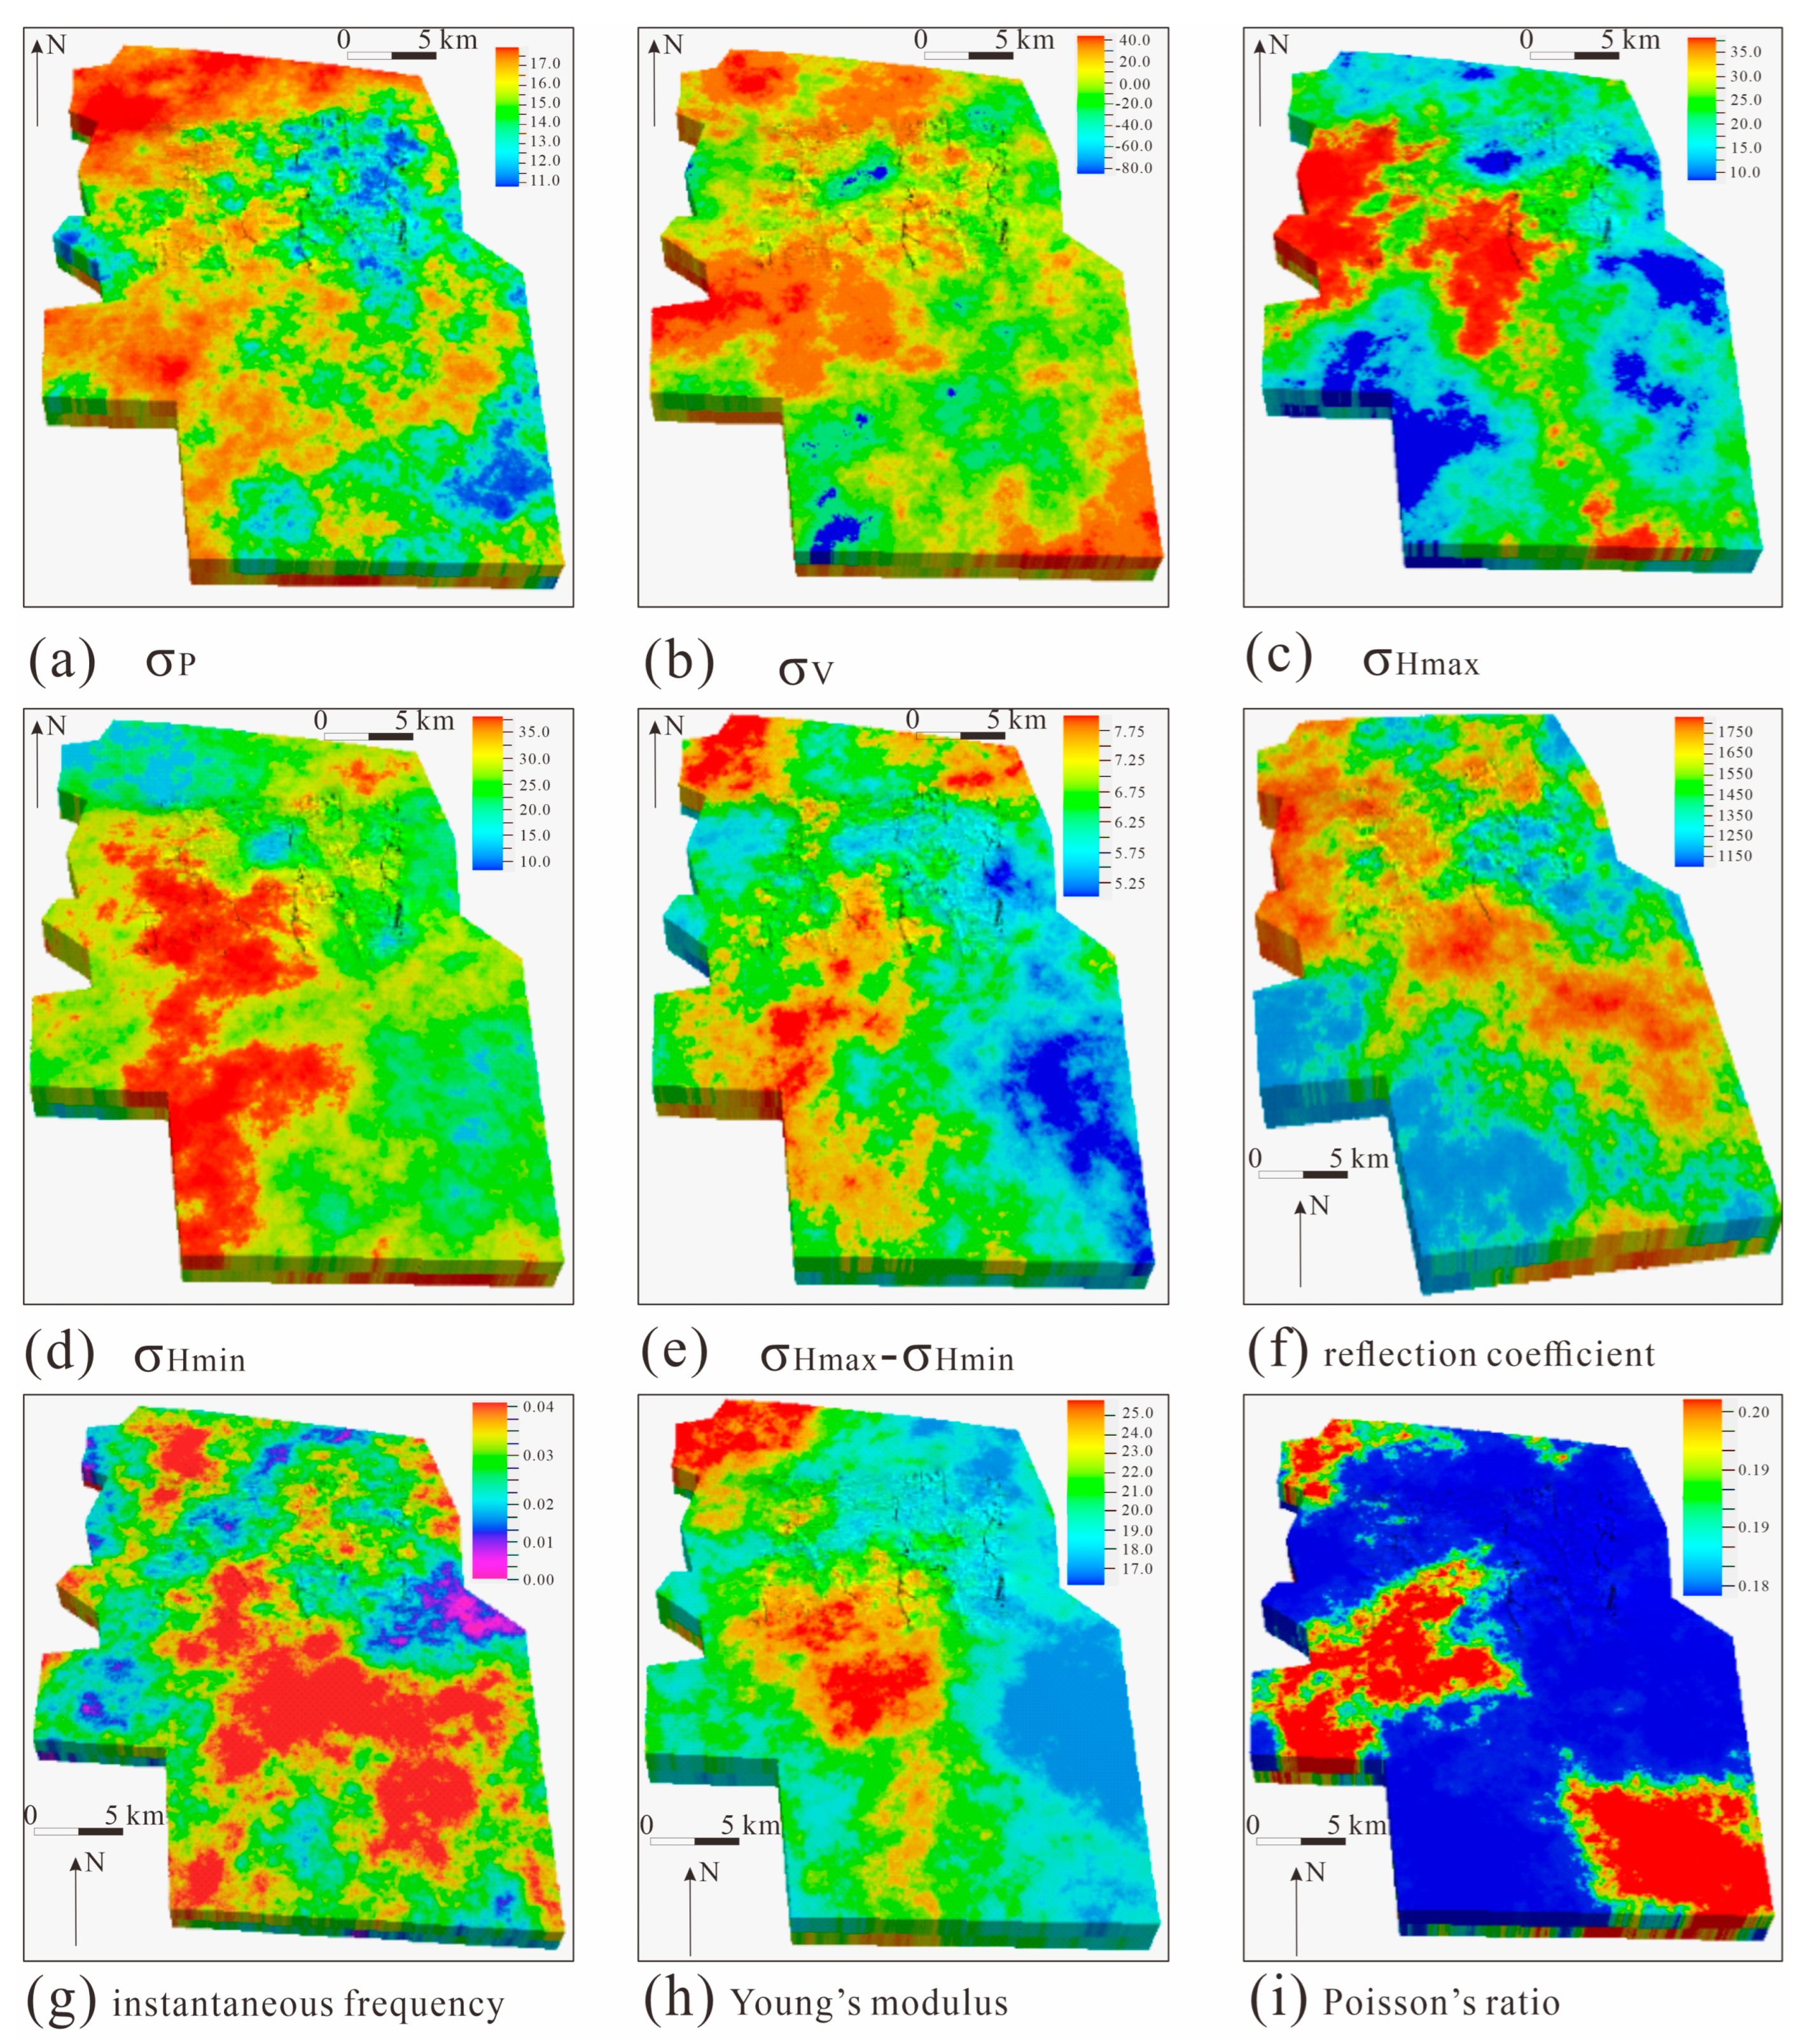
4.2. Multiscale Fractal–Fractional Analysis of Mechanical Parameters and In Situ Stress
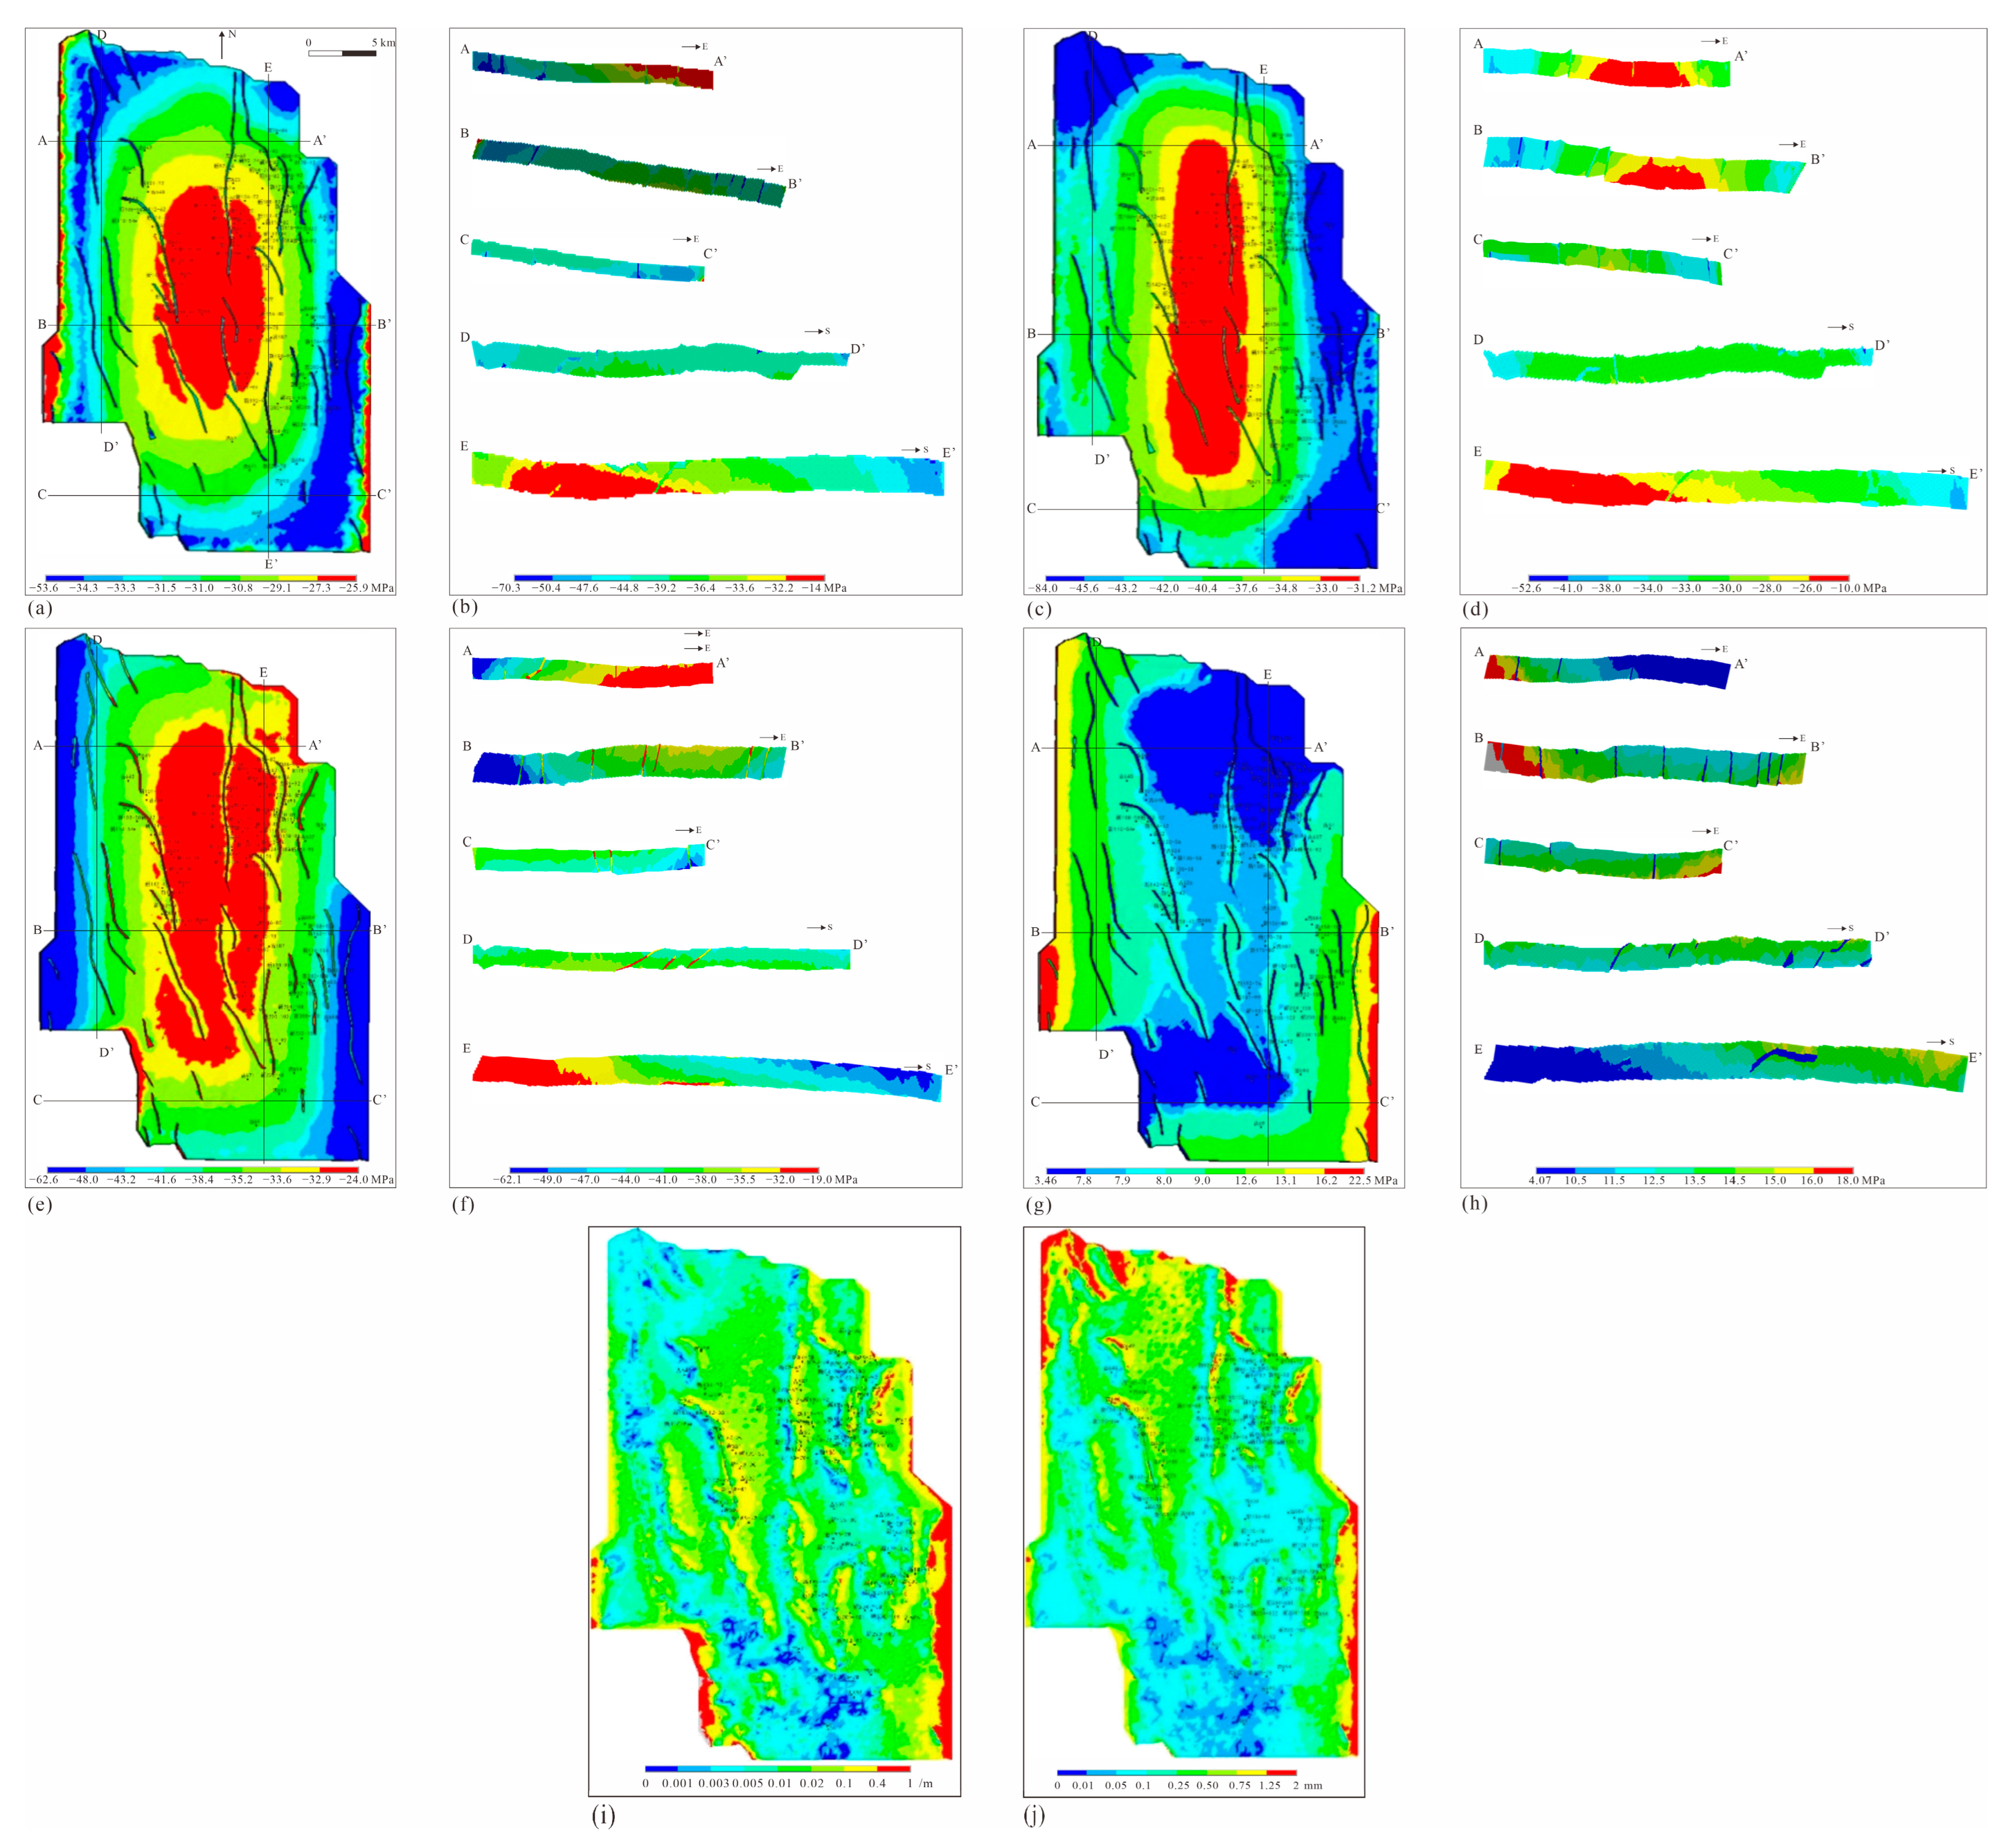
4.3. Fractal–Fractional Stress Dynamics and Multiscale Fracture Prediction
5. Discussions
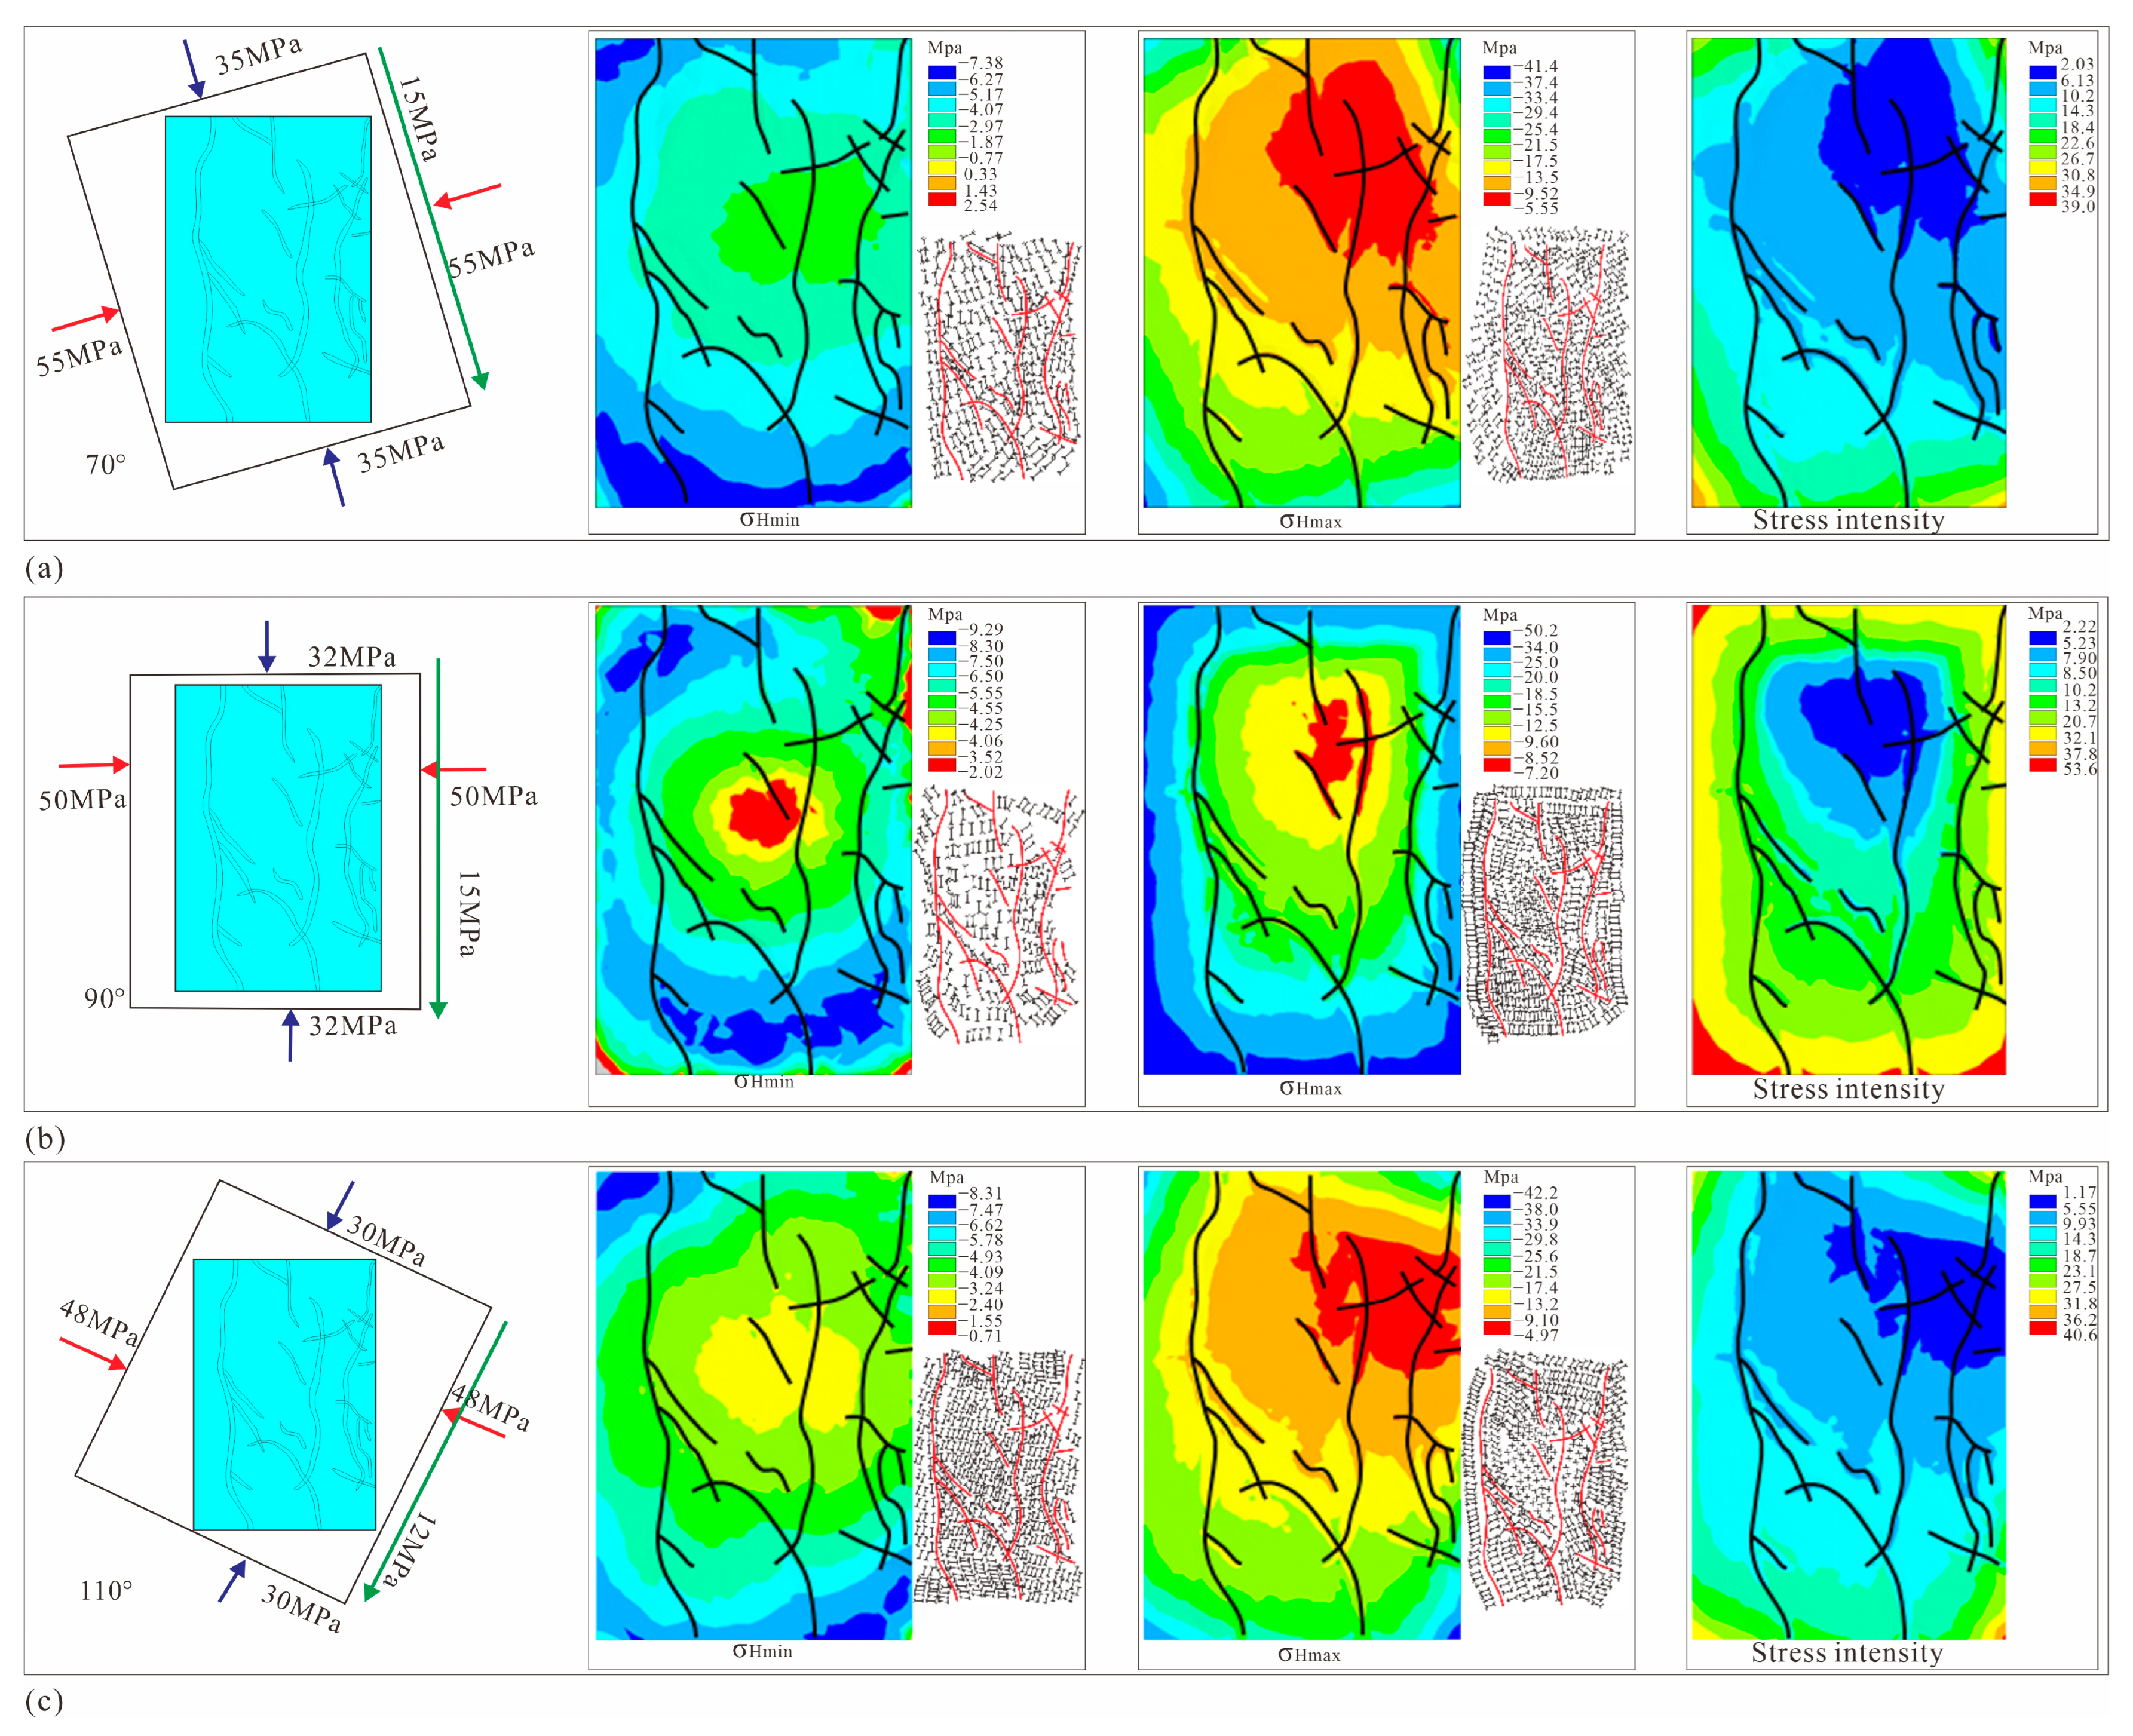
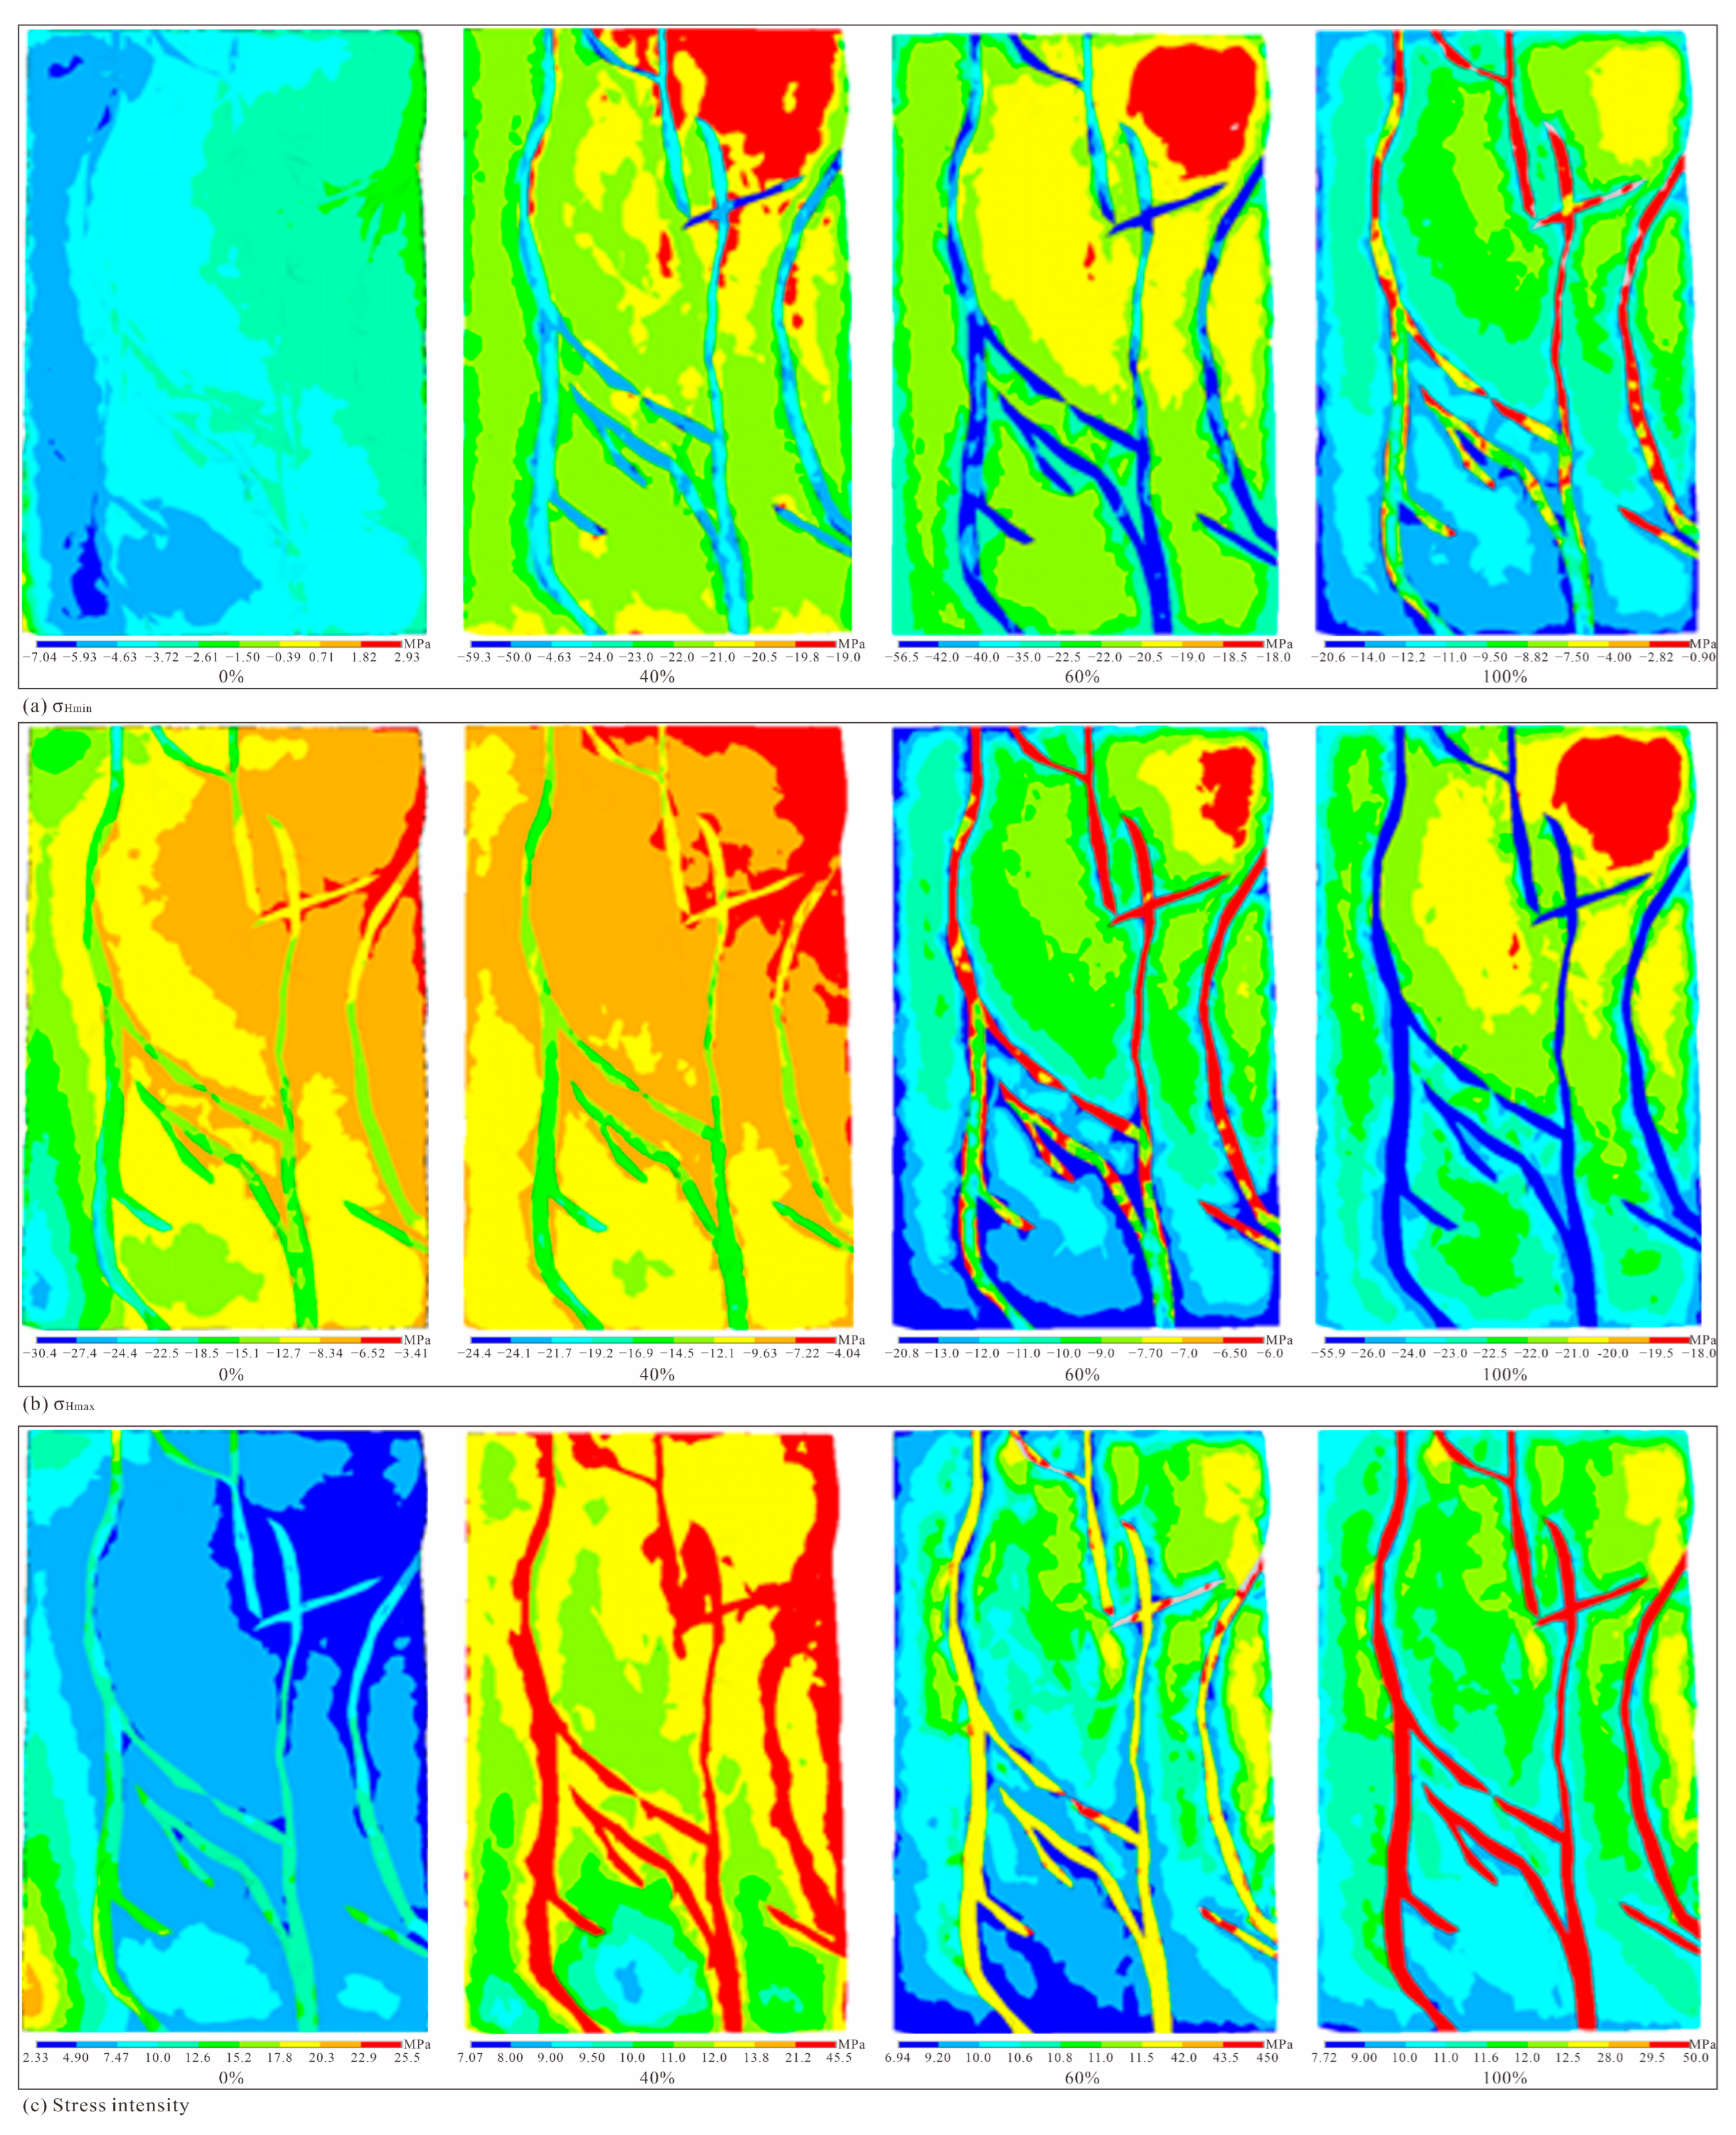
5.1. Fractal–Fractional Analysis of Stress Direction Impacts on Geo-Energy Quality
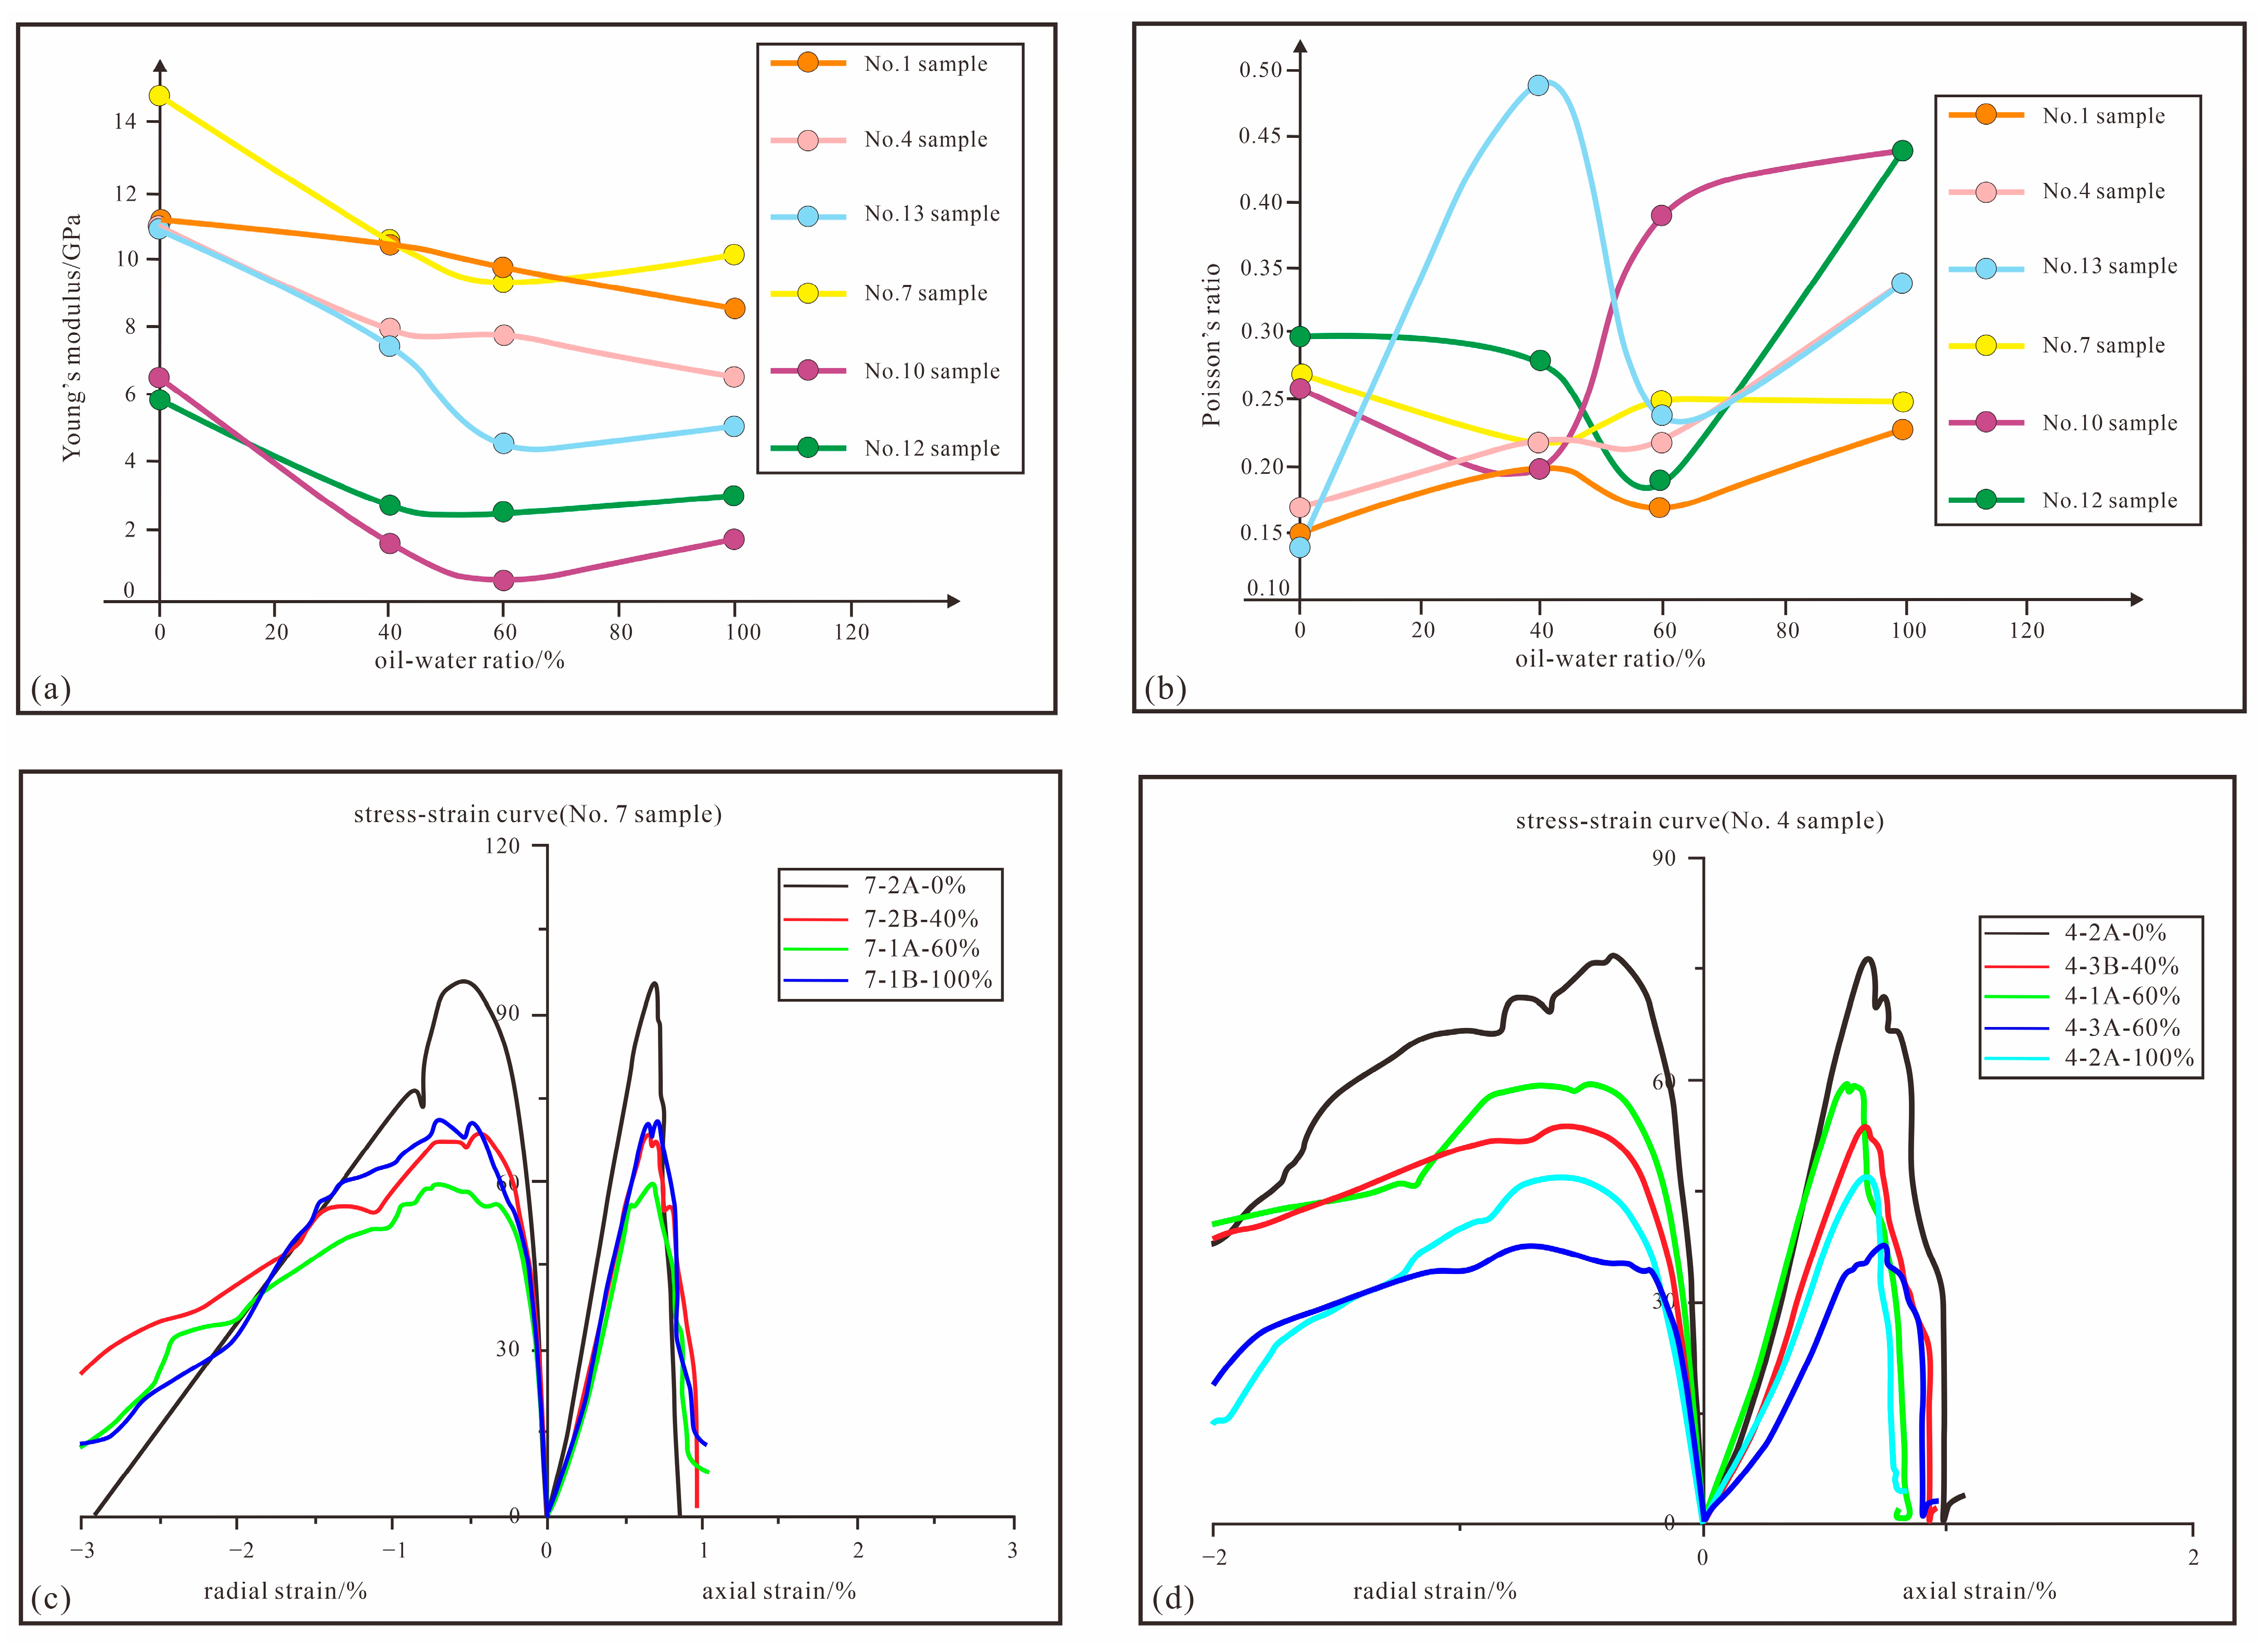
5.2. Fractal–Fractional Analysis of OWR-Dependent Geo-Energy Quality
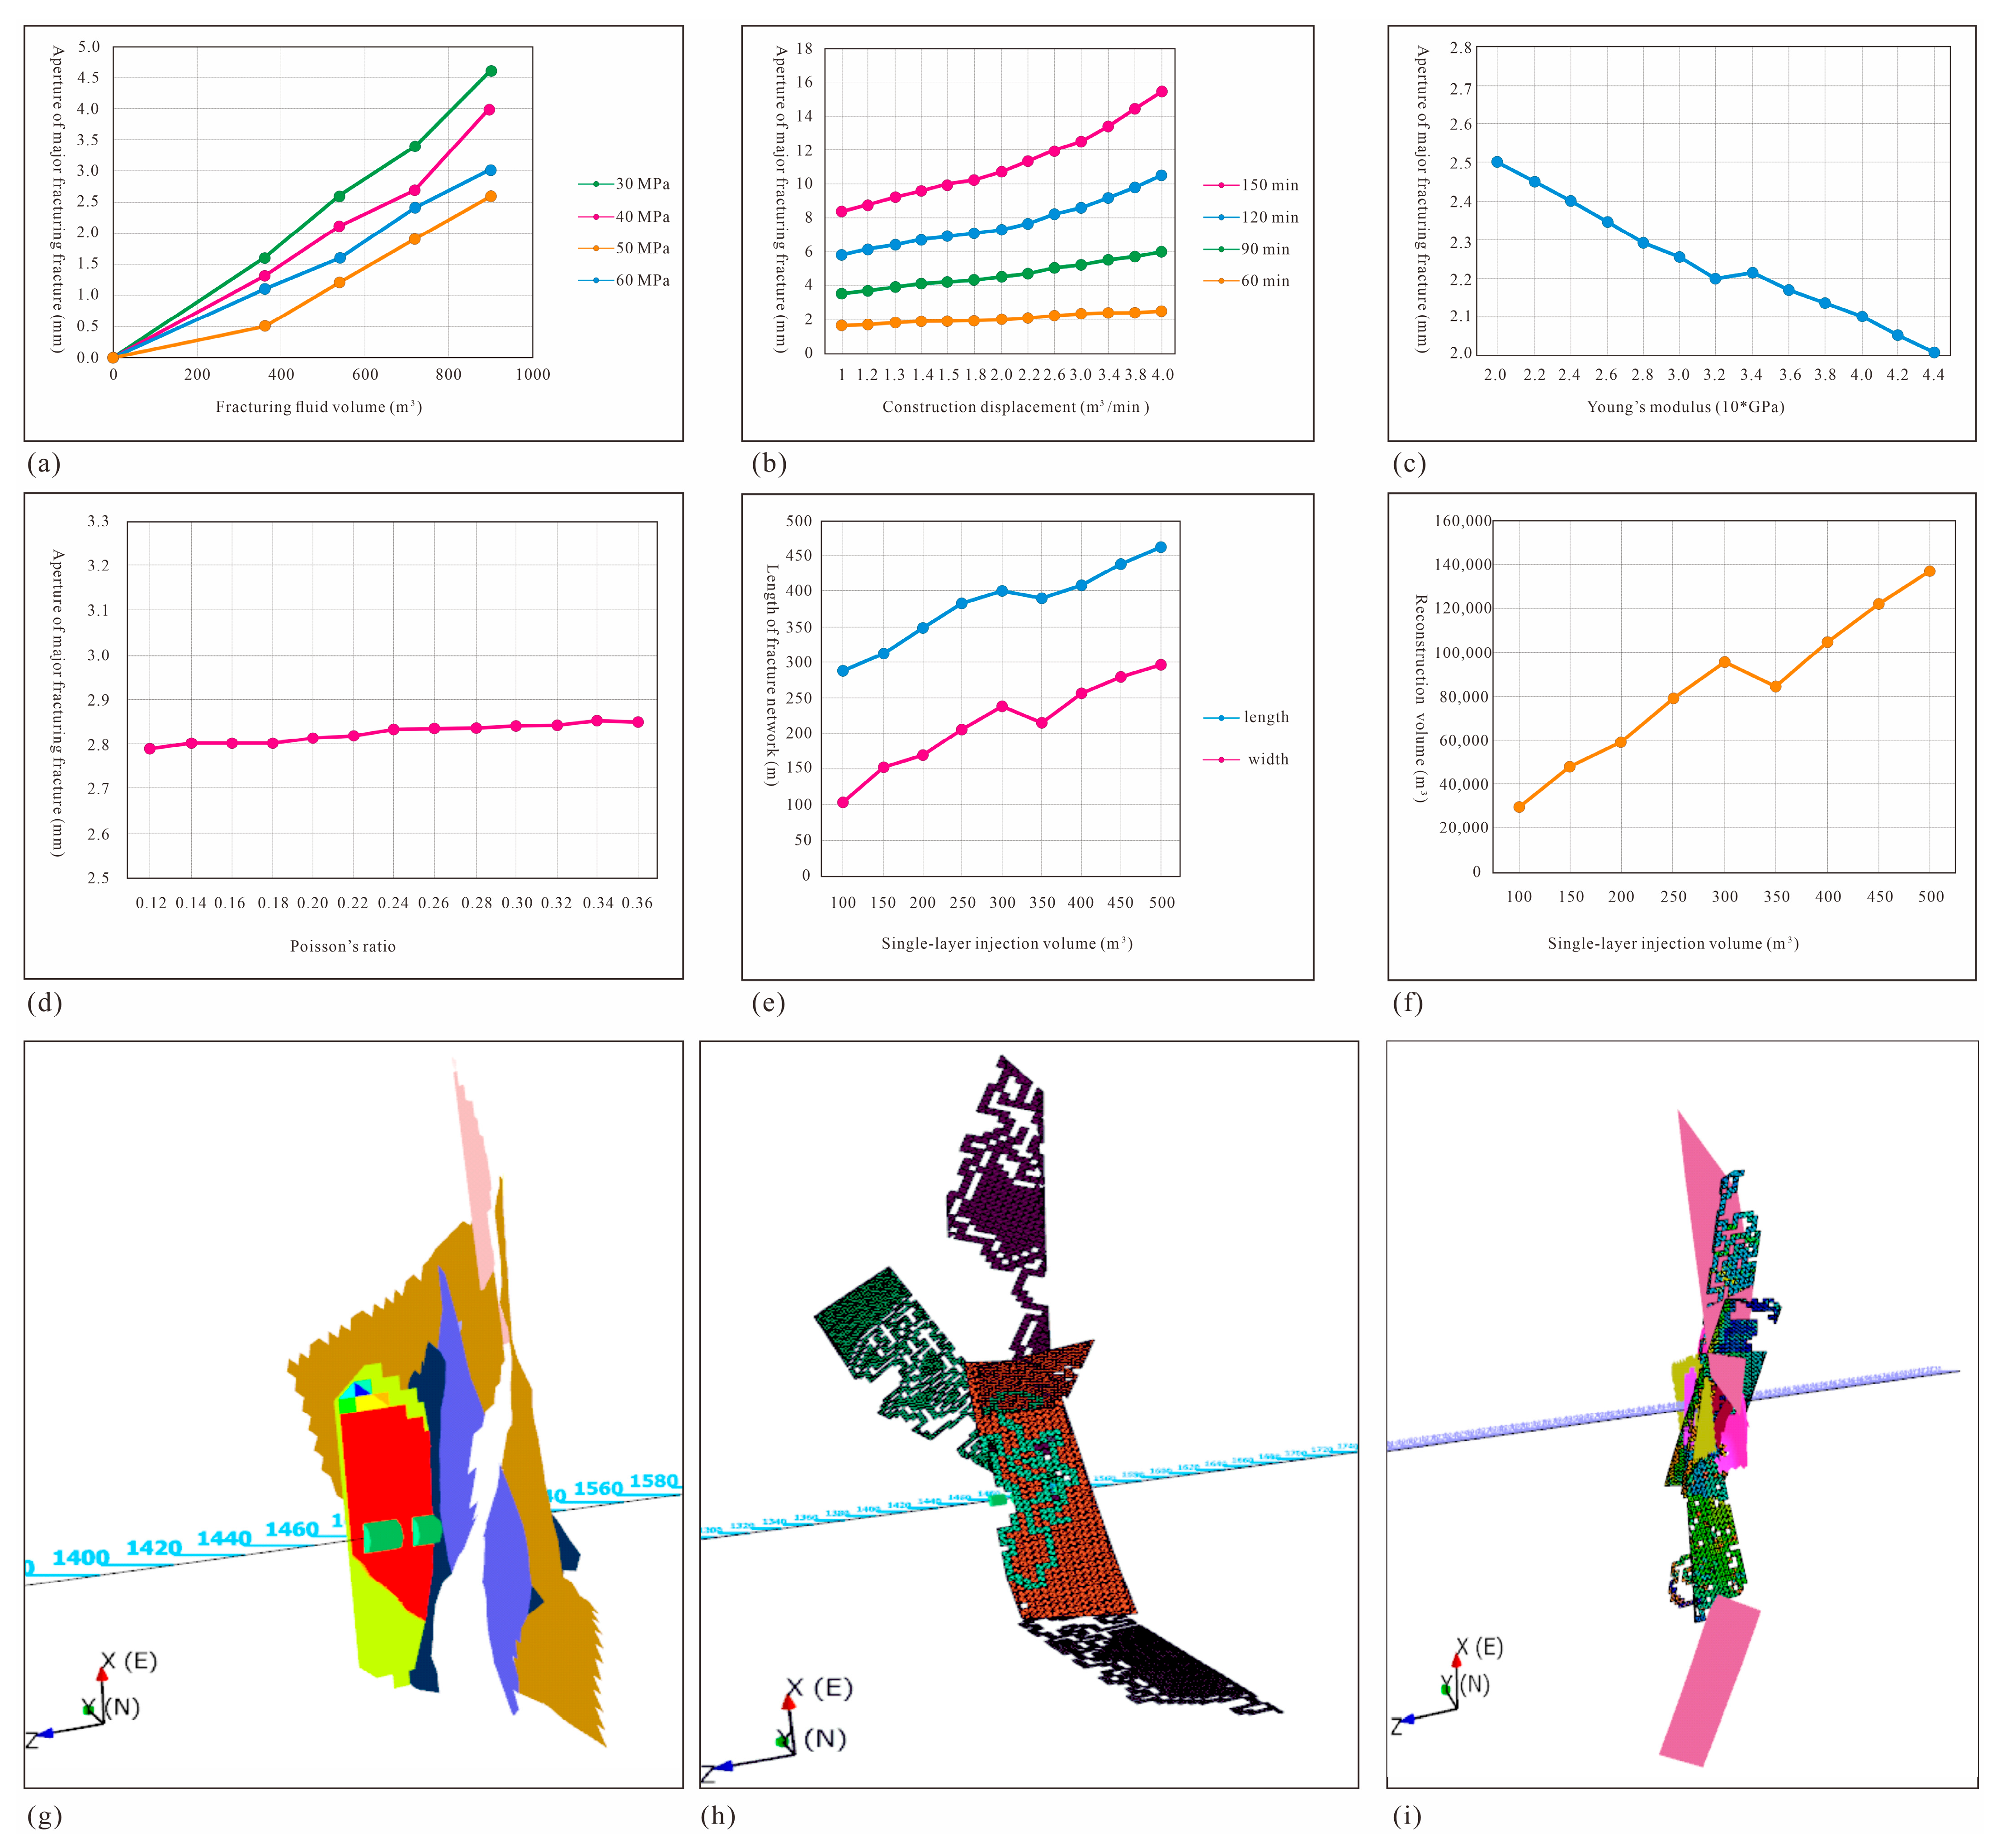
5.3. Fractal–Fractional Dynamics in Fracture Extension and Stress Field Coupling
5.4. Fractal–Fractional Dynamics in Stress Sensitivity Evaluation of Rock Permeability
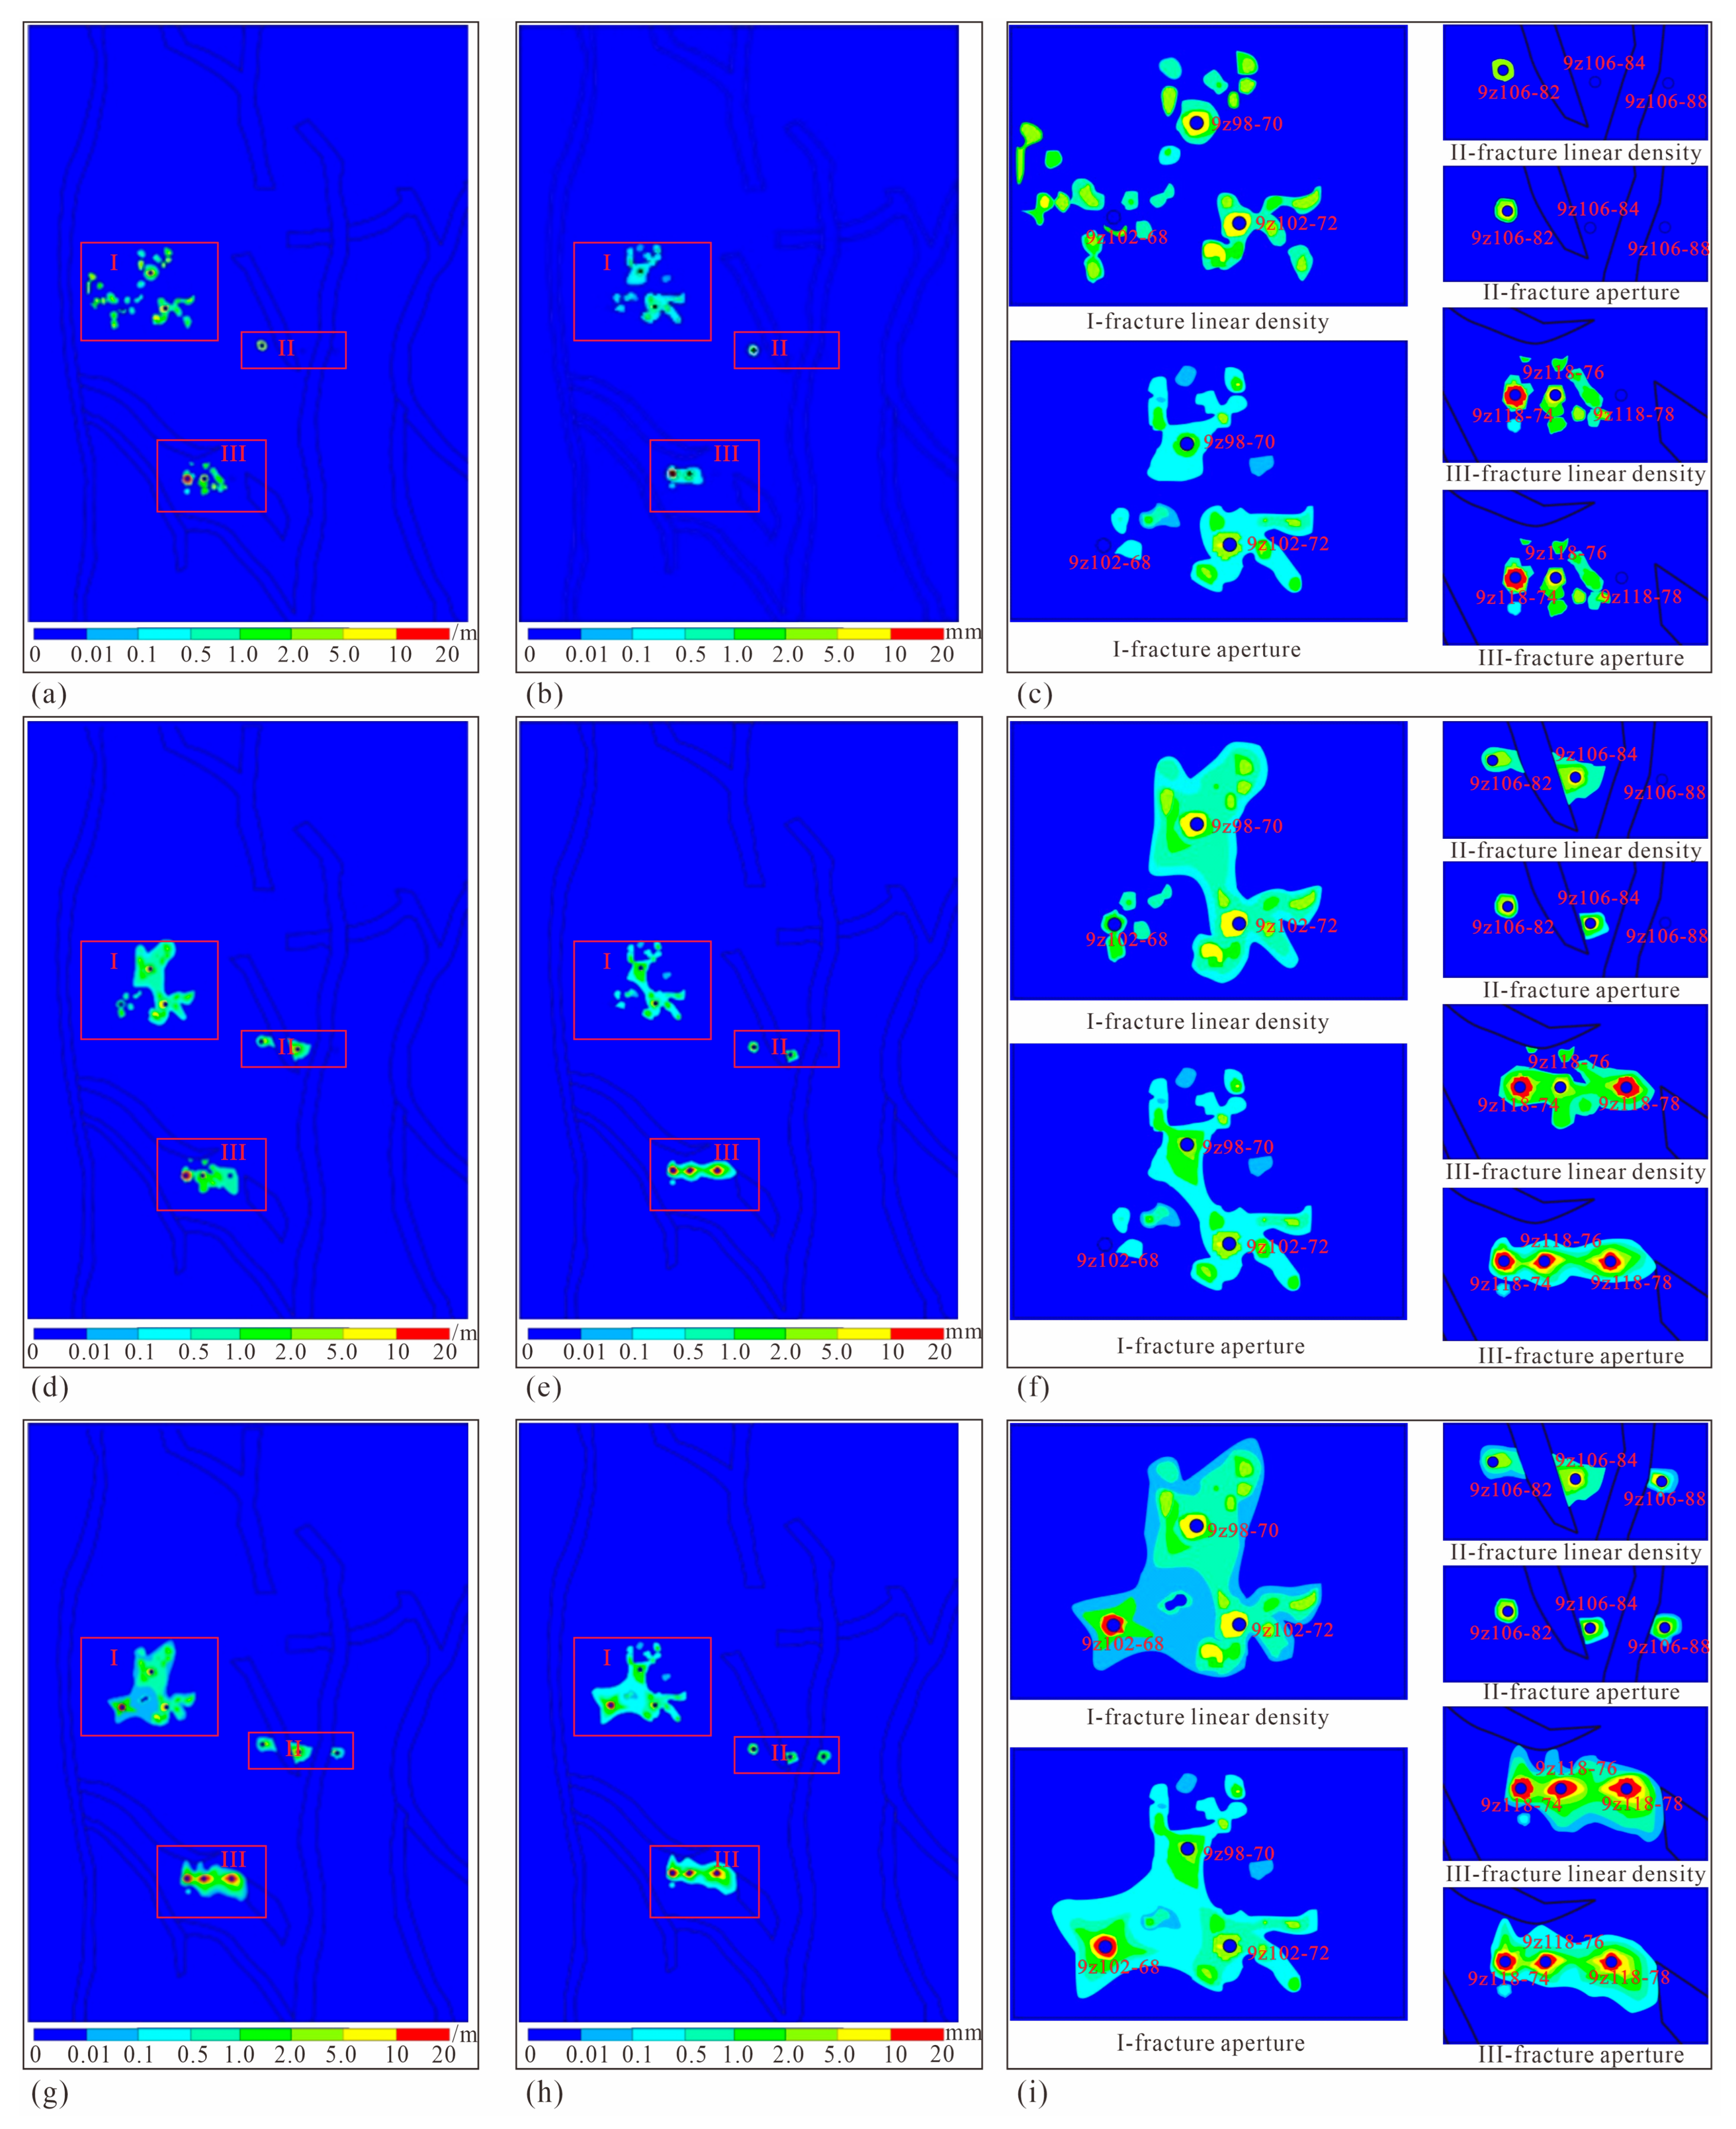
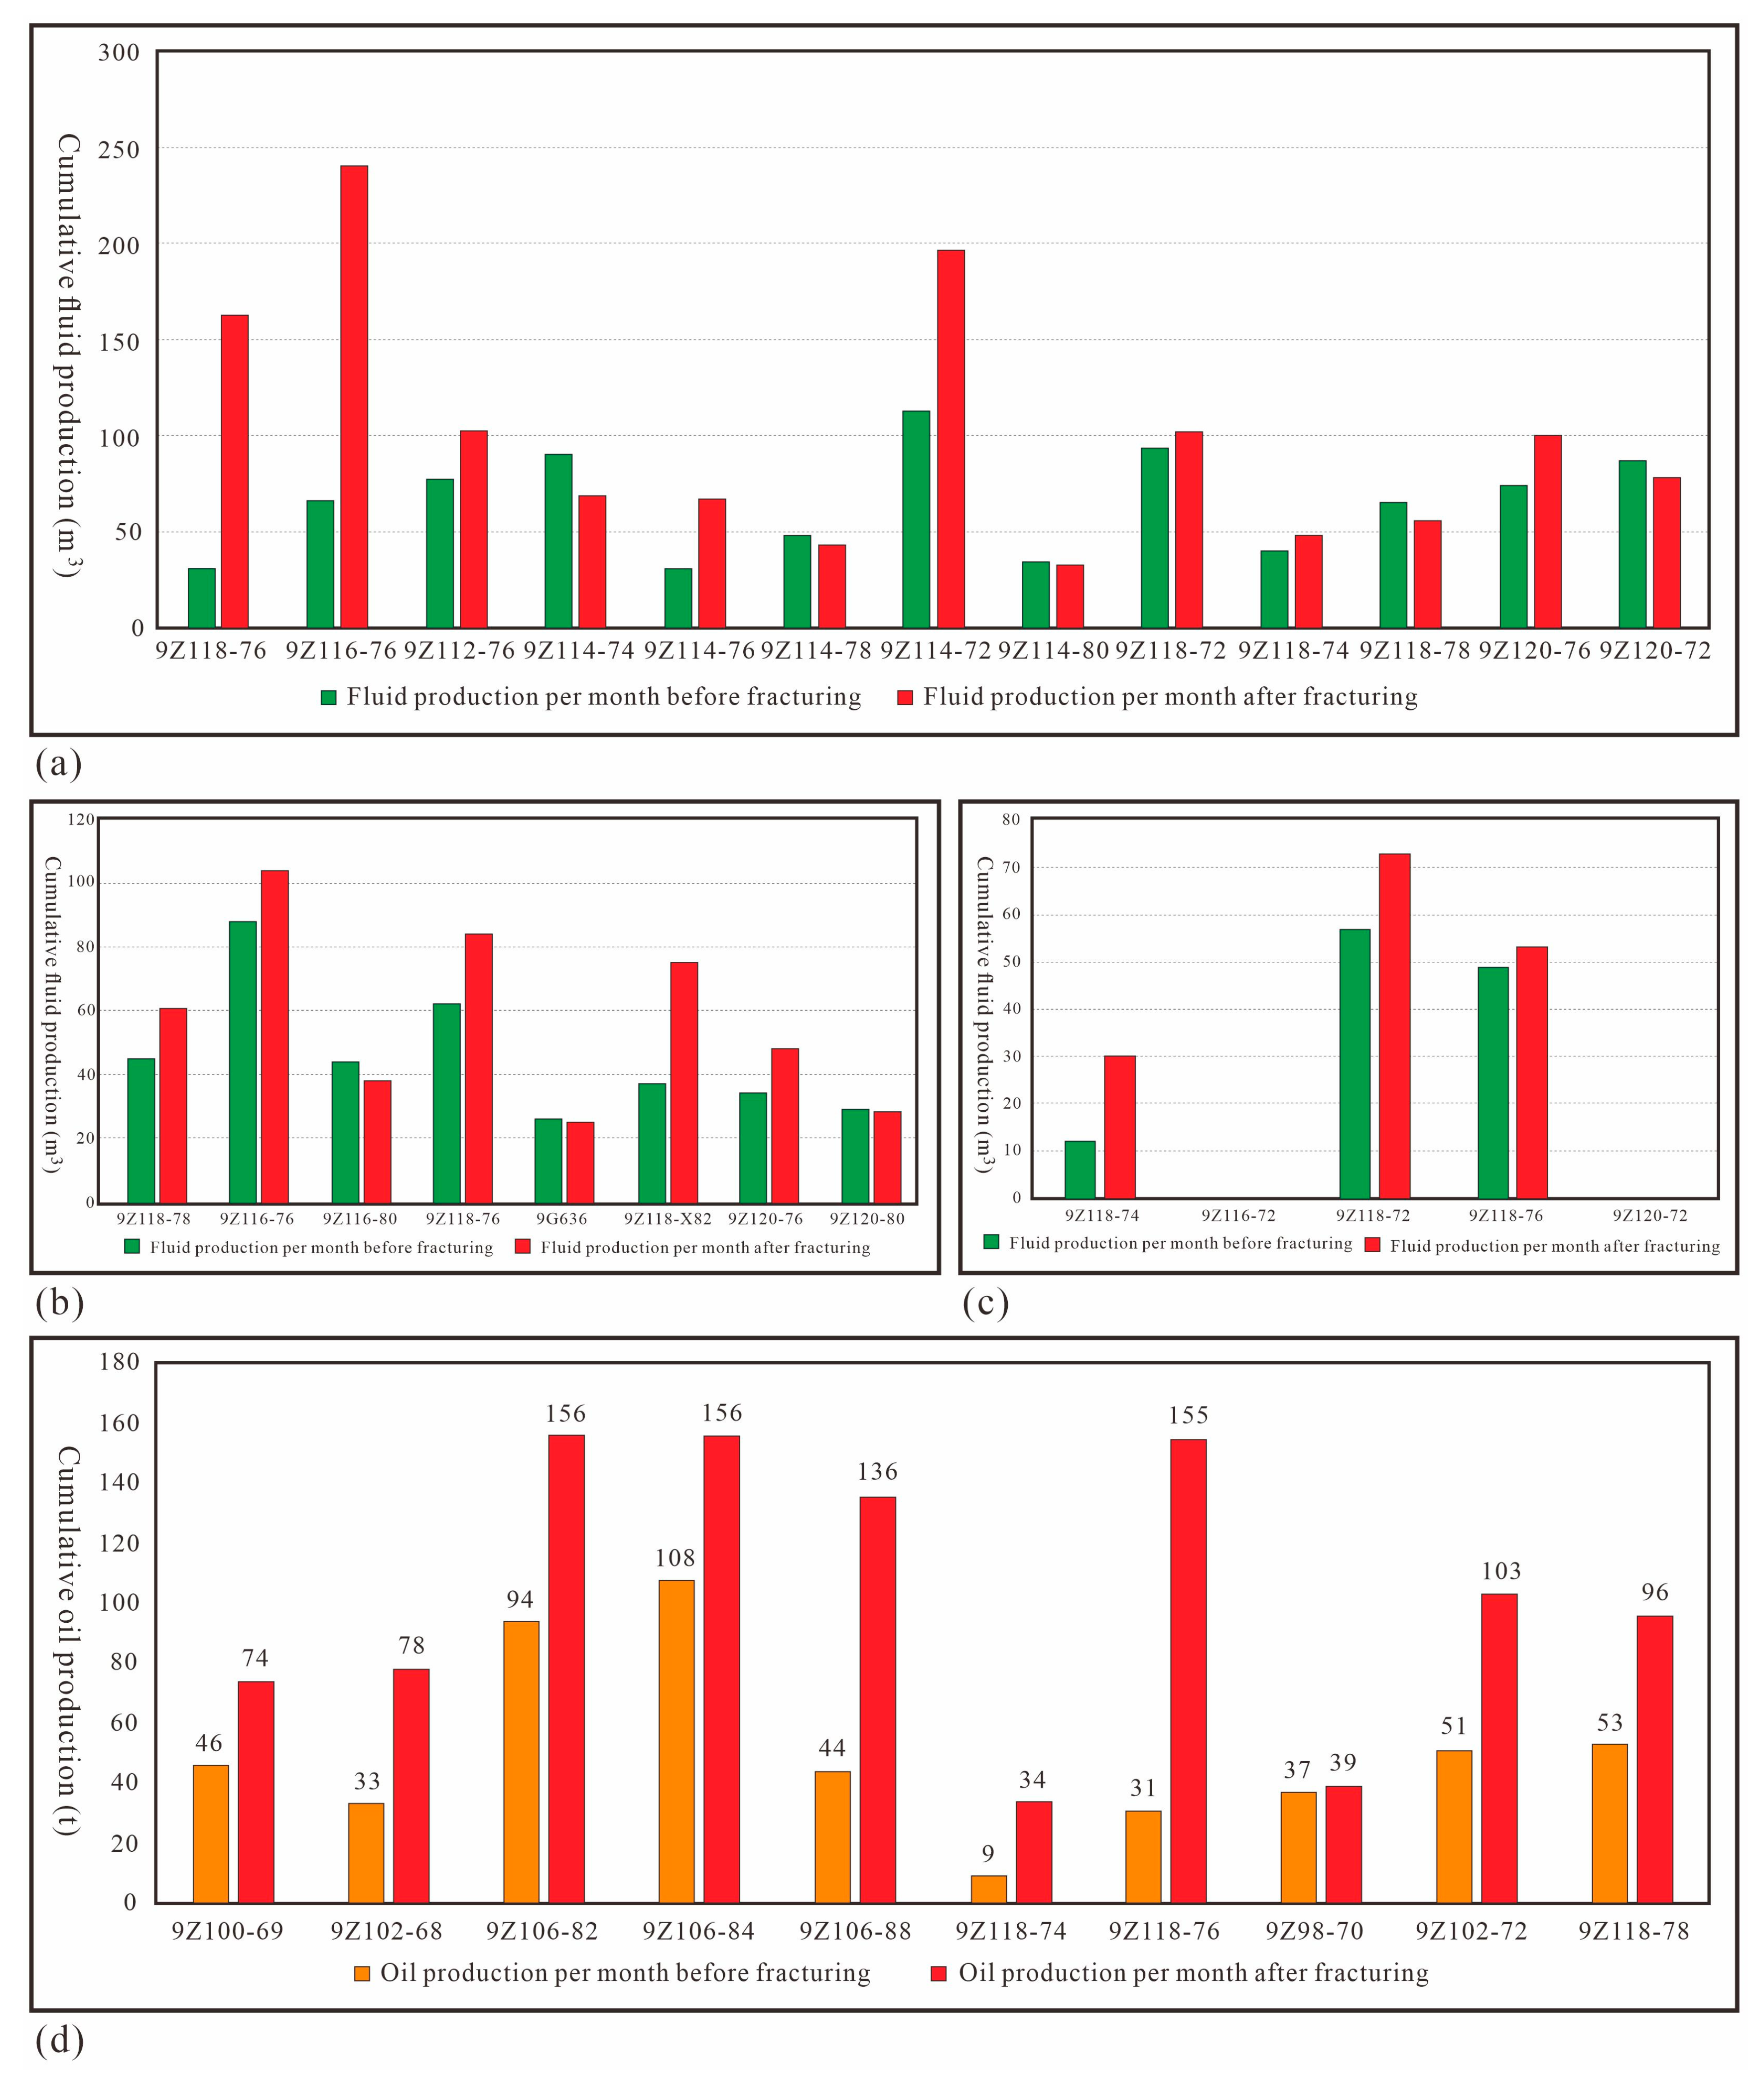
5.5. Fractal–Fractional Analysis of Fluid–Structure Coupling in Fracture Network Evolution
6. Conclusions
Author Contributions
Funding
Data Availability Statement
Acknowledgments
Conflicts of Interest
References
- Pollastro, R.M. Total petroleum system assessment of undiscovered resources in the giant Barnett Shale continuous (unconventional) gas accumulation, Fort Worth Basin, Texas. AAPG Bull. 2007, 91, 551–578. [Google Scholar] [CrossRef]
- Ren, Q.; Jin, Q.; Feng, J.; Li, M. Simulation of stress fields and quantitative prediction of fractures distribution in upper Ordovician biological limestone formation within Hetianhe field, Tarim Basin, NW China. J. Pet. Sci. Eng. 2019, 173, 1236–1253. [Google Scholar] [CrossRef]
- Huang, Y.; Wang, R. Characterization of natural fractures in tight sandstone reservoirs in Yuanba area, northern Sichuan Basin. Unconv. Resour. 2023, 3, 155–163. [Google Scholar] [CrossRef]
- Wu, Z.W.; Li, X.H.; Cui, C.Z.; Qian, Y.; Wang, Y.D.; Trivedi, J.J. The imbibition mechanism and the calculation method of maximum imbibition length during the hydraulic fracturing. Int. J. Energy Res. 2024, 2024, 8371615. [Google Scholar] [CrossRef]
- Zoback, M.D. Reservoir Geomechanics; Cambridge University Press: Cambridge, UK, 2010. [Google Scholar]
- Fisher, K.; Warpinski, N. Hydraulic-Fracture-Height Growth: Real Data. SPE Prod. Oper. 2012, 27, 8–19. [Google Scholar] [CrossRef]
- Hu, S.; Wu, Y.; Yan, Y.; Huo, T.; Xu, Z.; Li, Y.; He, J.; Zhang, W.; Wang, D. Parameter optimization study of three-dimensional well network-fracture network coupled fracturing in jimsar shale oil. Unconv. Resour. 2024, 4, 100102. [Google Scholar] [CrossRef]
- Kang, Z.; Jiang, X.; Wang, L.; Yang, D.; Ma, Y.; Zhao, Y. Comparative investigation of in situ hydraulic fracturing and high-temperature steam fracturing tests for meter-scale oil shale. Energy 2023, 281, 128343. [Google Scholar] [CrossRef]
- Morley, C.K.; von Hagke, C.; Hansberry, R.; Collins, A.; Kanitpanyacharoen, W.; King, R. Review of major shale-dominated detachment and thrust characteristics in the diagenetic zone: Part II, rock mechanics and microscopic scale. Earth-Sci. Rev. 2018, 176, 19–50. [Google Scholar] [CrossRef]
- Ren, L.; Yu, Z.; Zhao, J.; Lin, R.; Wu, J.; Wu, J.; Song, Y. Hydraulic fractures simulation in non-uniform stress field of horizontal shale gas well. J. Pet. Sci. Eng. 2022, 216, 110843. [Google Scholar] [CrossRef]
- Wang, S.; Wang, G.-W.; Li, D.; Wu, X.-N.; Chen, X.; Wang, Q.-Q.; Cao, J.-T.; Zhang, Y.-L. Comparison between double caliper, imaging logs, and array sonic log for determining the in-situ stress direction: A case study from the ultra-deep fractured tight sandstone reservoirs, the Cretaceous Bashijiqike Formation in Keshen8 region of Kuqa depression, Tarim Basin, China. Pet. Sci. 2022, 19, 2601–2617. [Google Scholar] [CrossRef]
- Shen, J.; He, H.; Li, Y.; Zou, L.; Wang, Y.; Zhu, Z.; Guo, L.; Fu, S. An investigation of data analysis method for hydraulic fracturing based on the water hammer effect. Unconv. Resour. 2023, 3, 284–290. [Google Scholar] [CrossRef]
- Vermylen, J.P.; Zoback, M.D. Hydraulic fracturing, microseismic magnitudes, and stress evolution in the Barnett Shale, Texas, USA. In Proceedings of the SPE Hydraulic Fracturing Technology Conference, The Woodlands, TX, USA, 24–26 January 2011. [Google Scholar]
- Bhattacharya, S.; Nikolaou, M. Comprehensive Optimization Methodology for Stimulation Design of Low-Permeability Unconventional Gas Reservoirs. SPE J. 2016, 21, 0947–0964. [Google Scholar] [CrossRef]
- Li, R.; Wang, M.; Wang, R.; Tang, Y. Sensitivity and application of pseudo-steady-state constant for refracturing horizontal wells with fracture reorientation in anisotropic tight oil reservoirs. Unconv. Resour. 2023, 3, 123–133. [Google Scholar] [CrossRef]
- Chang, X.; Xu, E.; Guo, Y.; Yang, C.; Hu, Z.; Guo, W. Experimental study of hydraulic fracture initiation and propagation in deep shale with different injection methods. J. Pet. Sci. Eng. 2022, 216, 110834. [Google Scholar] [CrossRef]
- Haimson, B.C. The hydrofracturing stress measuring method and recent field results. Int. J. Rock Mech. Min. Sci. Geomech. Abstr. Pergamon 1978, 15, 167–178. [Google Scholar] [CrossRef]
- Freeman, C.M.; Moridis, G.J.; Blasingame, T.A. A Numerical Study of Microscale Flow Behavior in Tight Gas and Shale Gas Reservoir Systems. Transp. Porous Media 2011, 90, 253–268. [Google Scholar] [CrossRef]
- Bunger, A.P.; Kear, J.; Jeffrey, R.G.; Prioul, R.; Chuprakov, D. Investigation of hydraulic fracture growth through weak discontinuities with active ultrasound monitoring. In Proceedings of the 13th ISRM International Congress of Rock Mechanics, Montreal, QC, Canada, 10–13 May 2015. [Google Scholar]
- Dong, S.; Yu, X.; Zeng, L.; Ye, J.; Wang, L.; Ji, C.; Fu, K.; Wang, R. Relationship between box-counting fractal dimension and properties of fracture networks. Unconv. Resour. 2024, 4, 100068. [Google Scholar] [CrossRef]
- Pope, C.D.; Palisch, T.; Saldungaray, P. Improving completion and stimulation effectiveness in unconventional reservoirs-field results in the eagle ford shale of north America. In Proceedings of the SPE/EAGE European Unconventional Resources Conference and Exhibition-Form Potential to Production, Vienna, Austria, 20–22 March 2012. [Google Scholar]
- Zhang, Q.; Zhang, X.-P.; Sun, W. A review of laboratory studies and theoretical analysis for the interaction mode between induced hydraulic fractures and pre-existing fractures. J. Nat. Gas Sci. Eng. 2021, 86, 103719. [Google Scholar] [CrossRef]
- Tan, J.; Hu, C.; Lyu, Q.; Feng, G.; Chen, S. Experimental investigation on the effects of different fracturing fluids on shale surface morphology. J. Pet. Sci. Eng. 2022, 212, 110356. [Google Scholar] [CrossRef]
- Dehghanpour, H.; Zubair, H.A.; Chhabra, A.; Ullah, A. Liquid Intake of Organic Shales. Energy Fuels 2012, 26, 5750–5758. [Google Scholar] [CrossRef]
- Chang, X.; Guo, Y.; Zhou, J.; Song, X.; Yang, C. Numerical and Experimental Investigations of the Interactions between Hydraulic and Natural Fractures in Shale Formations. Energies 2018, 11, 2541. [Google Scholar] [CrossRef]
- Lyu, Q.; Tan, J.; Dick, J.M.; Liu, Q.; Pathegama Gamage, R.; Li, L.; Wang, Z.; Hu, C. Stress–strain modeling and brittleness variations of low-clay shales with CO2/CO2-water imbibition. Rock Mech. Rock Eng. 2019, 52, 2039–2052. [Google Scholar] [CrossRef]
- Diaz, M.B.; Kim, K.Y.; Jung, S.G. Effect of frequency during cyclic hydraulic fracturing and the process of the fracture development in laboratory experiments. Int. J. Rock Mech. Min. Sci. 2020, 134, 104474. [Google Scholar] [CrossRef]
- Westwood, R.F.; Toon, S.M.; Styles, P.; Cassidy, N.J. Horizontal respect distance for hydraulic fracturing in the vicinity of existing faults in deep geological reservoirs: A review and modelling study. Géoméch. Geophys. Geo-Energy Geo-Resour. 2017, 3, 379–391. [Google Scholar] [CrossRef]
- Hou, B.; Chang, Z.; Fu, W.; Muhadasi, Y.; Chen, M. Fracture Initiation and Propagation in a Deep Shale Gas Reservoir Subject to an Alternating-Fluid-Injection Hydraulic-Fracturing Treatment. SPE J. 2019, 24, 1839–1855. [Google Scholar] [CrossRef]
- Fatah, A.; Ben Mahmud, H.; Bennour, Z.; Hossain, M.; Gholami, R. Effect of supercritical CO2 treatment on physical properties and functional groups of shales. Fuel 2021, 303, 121310. [Google Scholar] [CrossRef]
- Miehe, C.; Hofacker, M.; Schänzel, L.M.; Aldakheel, F. Phase field modeling of fracture in multi-physics problems. Part II. Coupled brittle-to-ductile failure criteria and crack propagation in thermo-elastic–plastic solids. Comput. Methods Appl. Mech. Eng. 2015, 294, 486–522. [Google Scholar] [CrossRef]
- Ren, Q.; Jin, Q.; Feng, J.; Li, Z.; Du, H. Geomechanical models for the quantitatively prediction of multi-scale fracture distribution in carbonate reservoirs. J. Struct. Geol. 2020, 135, 104033. [Google Scholar] [CrossRef]
- Zhang, T.; Tang, M.; Wang, M.; Zheng, K.; Zhu, G.; Xie, Z.; Wang, W.; Yuan, L. Experimental study on dynamic pore-fracture evolution and multiphase flow in oil-saturated coal considering the influence of in-situ stress. Geoenergy Sci. Eng. 2023, 230, 212208. [Google Scholar] [CrossRef]
- Zhao, H.; Liu, Z.; Sun, Y.; Lan, J. Quantitative analysis of the effect of acidification on in-situ residual fracture openings in laboratory fracturing simulation tests. Eng. Fract. Mech. 2024, 298, 109925. [Google Scholar] [CrossRef]
- Rabczuk, T.; Gracie, R.; Song, J.H.; Belytschko, T. Immersed particle method for fluid–structure interaction. Int. J. Numer. Methods Eng. 2010, 81, 48–71. [Google Scholar] [CrossRef]
- Wick, T. Coupling fluid–structure interaction with phase-field fracture. J. Comput. Phys. 2016, 327, 67–96. [Google Scholar] [CrossRef]
- Zhu, H.; Tang, X.; Song, Y.; Li, K.; Xiao, J.; Dusseault, M.B.; McLennan, J.D. An Infill Well Fracturing Model and Its Microseismic Events Barrier Effect: A Case in Fuling Shale Gas Reservoir. SPE J. 2021, 26, 113–134. [Google Scholar] [CrossRef]
- Liu, J.; Mei, L.; Ding, W.; Xu, K.; Yang, H.; Liu, Y. Asymmetric propagation mechanism of hydraulic fracture networks in continental reservoirs. GSA Bull. 2022, 135, 678–688. [Google Scholar] [CrossRef]
- Gale, J.F.W.; Laubach, S.E.; Olson, J.E.; Eichhubl, P.; Fall, A. Natural fractures in shale: A review and new observations Natural Fractures in Shale: A Review and New Observations. AAPG Bull. 2014, 98, 2165–2216. [Google Scholar] [CrossRef]
- Nguyen-Le, V.; Shin, H. Artificial neural network prediction models for Montney shale gas production profile based on reservoir and fracture network parameters. Energy 2022, 244, 123150. [Google Scholar] [CrossRef]
- Rege, K.; Lemu, H.G. A review of fatigue crack propagation modelling techniques using FEM and XFEM. In IOP Conference Series: Materials Science and Engineering; IOP Publishing: Bristol, UK, 2017; Volume 276, p. 012027. [Google Scholar]
- Aimene, Y.; Hammerquist, C.; Ouenes, A. Anisotropic damage mechanics for asymmetric hydraulic fracture height propagation in a layered unconventional gas reservoir. J. Nat. Gas Sci. Eng. 2019, 67, 1–13. [Google Scholar] [CrossRef]
- Ren, Q.; Feng, J.; Johnston, S.; Zhao, L. The influence of argillaceous content in carbonate rocks on the 3D modeling and characterization of tectonic fracture parameters—Example from the carboniferous and ordovician formations in the hetianhe gas field, Tarim Basin, NW China. J. Pet. Sci. Eng. 2021, 203, 108668. [Google Scholar] [CrossRef]
- Zhao, Z.; Liu, Z.; Lu, C.; He, T.; Chen, M. Brittleness evaluation based on shale fracture morphology. J. Nat. Gas Sci. Eng. 2022, 104, 104679. [Google Scholar] [CrossRef]
- Zhou, T.; Wang, H.; Li, F.; Li, Y.; Zou, Y.; Zhang, C. Numerical simulation of hydraulic fracture propagation in laminated shale reservoirs. Pet. Explor. Dev. 2020, 47, 1117–1130. [Google Scholar] [CrossRef]
- Piao, S.; Huang, S.; Wang, Q.; Ma, B. Experimental and numerical study of measuring in-situ stress in horizontal borehole by hydraulic fracturing method. Tunn. Undergr. Space Technol. 2023, 141, 105363. [Google Scholar] [CrossRef]
- Lorenz, J.C.; Hill, R.E. Subsurface fracture spacing: Comparison of inferences from slant/horizontal and vertical cores. SPE Form. Eval. 1994, 9, 66–72. [Google Scholar] [CrossRef]
- Hooker, J.N.; Cartwright, J.; Stephenson, B.; Silver, C.R.P.; Dickson, A.J.; Hsieh, Y.-T. Fluid evolution in fracturing black shales, Appalachian Basin. AAPG Bull. 2017, 101, 1203–1238. [Google Scholar] [CrossRef]
- Ranjith, P.G.; Wanniarachchi, W.A.M.; Perera, M.S.A.; Rathnaweera, T.D. Investigation of the effect of foam flow rate on foam-based hydraulic fracturing of shale reservoir rocks with natural fractures: An experimental study. J. Pet. Sci. Eng. 2018, 169, 518–531. [Google Scholar] [CrossRef]
- Su, A.; Chen, H.; Feng, Y.-X.; Zhao, J.-X.; Nguyen, A.D. Multistage fracturing history in the Paleocene lacustrine shale oil reservoirs of the Subei Basin, Eastern China. Mar. Pet. Geol. 2022, 144, 105835. [Google Scholar] [CrossRef]
- Hu, Y.; Gan, Q.; Hurst, A.; Elsworth, D. Hydraulic fracture propagation and interaction with natural fractures by coupled hydro-mechanical modeling. Géoméch. Geophys. Geo-Energy Geo-Resour. 2022, 8, 4. [Google Scholar] [CrossRef]
- Laubach, S.E. Practical approaches to identifying sealed and open fractures. AAPG Bull. 2003, 87, 561–579. [Google Scholar] [CrossRef]
- Stumpf, H.; Makowski, J.; Hackl, K. Dynamical evolution of fracture process region in ductile materials. Int. J. Plast. 2009, 25, 995–1010. [Google Scholar] [CrossRef]
- Guglielmi, Y.; McClure, M.; Burghardt, J.; Morris, J.P.; Doe, T.; Fu, P.; Knox, H.; Vermeul, V.; Kneafsey, T.; Ajo-Franklin, J.; et al. Using in-situ strain measurements to evaluate the accuracy of stress estimation procedures from fracture injection/shut-in tests. Int. J. Rock Mech. Min. Sci. Géoméch. Abstr. 2023, 170, 105521. [Google Scholar] [CrossRef]
- Mathews, J.P.; Campbell, Q.P.; Xu, H.; Halleck, P. A review of the application of X-ray computed tomography to the study of coal. Fuel 2017, 209, 10–24. [Google Scholar] [CrossRef]
- Chen, Y.; Yin, T.; Li, X.; Li, Q.; Yang, Z.; Li, M.; Wu, Y. Experimental investigation on dynamic mechanical behavior and fracture evolution of fissure-filled red sandstone after thermal treatment. Eng. Geol. 2021, 295, 106433. [Google Scholar] [CrossRef]
- Niu, C.; Zhu, Z.; Zhou, L.; Li, X.; Ying, P.; Dong, Y.; Deng, S. Study on the microscopic damage evolution and dynamic fracture properties of sandstone under freeze-thaw cycles. Cold Reg. Sci. Technol. 2021, 191, 103328. [Google Scholar] [CrossRef]
- Zhou, Y.; You, L.; Kang, Y.; Xie, B.; Cheng, Q. Experimental study of the fracture initiation through the synergy of spontaneous imbibition and hydration of residual fracturing fluids in shale gas reservoirs. J. Nat. Gas Sci. Eng. 2022, 102, 104577. [Google Scholar] [CrossRef]
- Bostrom, N.; Chertov, M.; Pagels, M.; Willberg, D.; Chertova, A.; Davis, M.; Zagorski, W. The time-dependent permeability damage caused by fracture fluid. In Proceedings of the SPE International Symposium and Exhibition on Formation Damage Control, Lafayette, LA, USA, 26–28 February 2014. [Google Scholar]
- Weinberg, K.; Wieners, C. Dynamic phase-field fracture with a first-order discontinuous Galerkin method for elastic waves. Comput. Methods Appl. Mech. Eng. 2022, 389, 114330. [Google Scholar] [CrossRef]
- Williams, V.; McCartney, E.; Nino-Penaloza, A. Far-Field Diversion in Hydraulic Fracturing and Acid Fracturing: Using Solid Particulates to Improve Stimulation Efficiency. In Proceedings of the SPE Asia Pacific Hydraulic Fracturing Conference, Beijing, China, 24–26 August 2016. [Google Scholar]
- Kim, J.; Um, E.S.; Moridis, G.J. Integrated simulation of vertical fracture propagation induced by water injection and its borehole electromagnetic responses in shale gas systems. J. Pet. Sci. Eng. 2018, 165, 13–27. [Google Scholar] [CrossRef]
- Su, Q.; Ma, Q.; Ma, D.; Yuan, P. Dynamic mechanical characteristic and fracture evolution mechanism of deep roadway sandstone containing weakly filled joints with various angles. Int. J. Rock Mech. Min. Sci. Géoméch. Abstr. 2021, 137, 104552. [Google Scholar] [CrossRef]
- He, J.C.; Zhang, K.S.; Liu, H.B.; Tang, M.R.; Zheng, X.L.; Zhang, G.Q. Laboratory investigation on hydraulic fracture propagation in sandstone-mudstone-shale layers. Pet. Sci. 2022, 19, 1664–1673. [Google Scholar] [CrossRef]
- Wu, F.Y.; Sun, D.Y.; Li, H.M.; Wang, X.L. The nature of basement beneath the Songliao Basin in NE China: Geochemical and isotopic constraints. Phys. Chem. Earth Part A Solid Earth Geod. 2001, 26, 793–803. [Google Scholar] [CrossRef]
- Hou, Q.J.; Wei, Z.S.; Zhao, Z.Y.; Song, L.Z.; Mao, C.L. Deep basin reservoir in Songliao basin. Pet. Explor. Dev. 2006, 33, 406–411, (In Chinese with English abstract). [Google Scholar]
- Feng, Z.Q.; Jia, C.Z.; Xie, X.N.; Shun, Z.; Zi-Hui, F.; Cross, T.A. Tectonostratigraphic units and stratigraphic sequences of the nonmarine Songliao basin, northeast China. Basin Res. 2010, 22, 79–95. [Google Scholar]
- Feng, Z.J.; Zhang, S.; Fu, X.L. Depositional evolution and accumulation response of Yaojia-Nenjiang Formation in Songliao Basin. Earth Sci. Front. 2012, 19, 78. [Google Scholar]
- Zhao, B.; Liu, C.; Wang, S.Y.; Li, P.; Liu, Y. The modalities and recognition methods of reversal construct in Daqing placanticline. J. Jilin Univ. Earth Sci. Ed. 2006, 36, 101–103, (In Chinese with English abstract). [Google Scholar]
- Huang, L.; Tong, H.M.; Yang, D.H. A new model for the formation and evolution of middle-shallow faults in the Daqing placanticline, Songliao Basin. Acta Geol. Sin. 2019, 93, 597–605. [Google Scholar]
- Wang, T.T.; Ramezani, J.; Wang, C.S.; Wu, H.C.; He, H.Y.; Bowring, S.A. High-precision U–Pb geochronologic constraints on the Late Cretaceous terrestrial cyclostratigraphy and geomagnetic polarity from the Songliao Basin, Northeast China. Earth Planet. Sci. Lett. 2016, 446, 37–44. [Google Scholar] [CrossRef]
- Xia, Q. Oil-water distribution laws and main controlling factors of Putaohua reservoirs in Block Gu628 of Xinzhao Oilfield. Pet. Geol. Oilfield Dev. Daqing 2020, 39, 25–33. [Google Scholar]
- Liu, Z.B.; Lyu, Y.F.; Fu, X.F.; Fu, G.; Li, D.; Li, X.W. Sedimentary characteristics and hydrocarbon accumulation model of Fuyu Reservoir in Sanzhao Depression. J. Jilin Univ. Earth Sci. Ed. 2009, 39, 998–1006. [Google Scholar]
- Deng, Q.J.; Hu, M.Y.; Hu, Z.Q.; Wu, Y. Sedimentary characteristics of shallow-water delta distributary channel sand bodies: A case from II-I Formation of Fuyu oil layer in the Sanzhao depression, Songliao Basin. Oil Gas Geol. 2015, 36, 118–127. [Google Scholar]
- Fu, X.F.; Song, Y. Nontectonic mechanism of polygonal “T11” faults in the Sanzhao sag of Songliao Basin. Acta Geol. Sin. 2008, 82, 738–749. [Google Scholar]
- Zhang, X.W.; Li, J.J.; Lu, S.F. Effects of structural deformation on shale pore structure and adsorption. Spec. Oil Gas Reserv. 2018, 25, 31–36. [Google Scholar]
- Chen, W.; Li, P.; Peng, C.W.; Zhang, B.R. Characteristics and controlling factors of pore features in the Putaohua oil reservoir in the Block Zhao-35, Daqing oilfield. Oil Gas Geol. 2010, 31, 802–809. [Google Scholar]
- Sun, Y.H.; Bai, L.; Fu, X.F. Genetic mechanism of T2 reflector fault dense zones in northern Songliao basin. Earth Sci.-J. China Univ. Geosci. 2013, 38, 797–806, (In Chinese with English abstract). [Google Scholar]
- Li, Y.; Zhu, X.M.; Song, Y.Q.; Fen, L.I.; Chao, L.I. Sedimentary characteristics and evolution of shallow-water delta of the Lower Cretaceous Fuyu Reservoir in the Yushulin Oilfield, Songliao Basin. Geol. J. China Univ. 2013, 1, 23–31. [Google Scholar]
- Cai, Q.S.; Hu, M.Y.; Hu, Z.Q.; Yang, J.; Yue, X.; Qiu, X. Sedimentary evolution and distribution of sand bodies of retrogradational shallow-water delta: A case study from 4th member of the Cretaceous Quantou Formation in the Lingjiang area, Songliao Basin. Oil Gas Geol. 2016, 37, 903–914. [Google Scholar]
- Li, Z.; Zhang, J. In-Situ Stress and Exploration and Development of Oil and Gas; Petroleum Industry Press: Beijing, China, 1997. [Google Scholar]
- Griffith, A.A. The phenomena of rupture and flow in solids. Philos. Trans. R. Soc. Lond. 1992, 221, 163e198. [Google Scholar]
- Kravchenko, S.G.; Kravchenko, O.G.; Sun, C.T. A two-parameter fracture mechanics model for fatigue crack growth in brittle materials. Eng. Frac Mech. 2014, 119, 132e147. [Google Scholar] [CrossRef]
- Feng, J.; Shi, S.; Zhou, Z.; Li, X.; Luo, P. Characterizing the influence of interlayers on the development and distribution of fractures in deep tight sandstones using finite element method. J. Struct. Geol. 2019, 123, 81–95. [Google Scholar] [CrossRef]
- Bhatti, M.M.; Marin, M.; Ellahi, R.F.I.M. Insight into the dynamics of EMHD hybrid nanofluid (ZnO/CuO-SA) flow through a pipe for geothermal energy applications. J. Therm. Anal. Calorim. 2023, 148, 14261–14273. [Google Scholar] [CrossRef]
- Yadav, A.K.; Carrera, E.; Marin, M.; Othman, M.I.A. Reflection of hygrothermal waves in a Nonlocal Theory of coupled thermo-elasticity. Mech. Adv. Mater. Struct. 2024, 31, 1083–1096. [Google Scholar] [CrossRef]


| Geological Body | Young’s Modulus (GPa) | Poisson’s Ratio | Density (kg/m3) |
|---|---|---|---|
| Mudstone with siltstone | 27 | 0.20 | 2400 |
| Argillaceous siltstone | 25 | 0.25 | 2000 |
| Silty mudstone | 21 | 0.33 | 1600 |
| Mudstone | 20 | 0.35 | 1400 |
| Siltstone | 28 | 0.20 | 2400 |
| Fault | 15 | 0.38 | 2100 |
| Area | No. | Type | Sock Time | Oil-Water Ratio | d /mm | h /mm | m /g | Density g/m3 | Strength /MPa | E GPa | μ |
|---|---|---|---|---|---|---|---|---|---|---|---|
| Zhou 6 area | 1-1A | Uni- | 30 | 40 | 24.89 | 36.52 | 44.81 | 2.52 | 49.42 | 13.11 | 0.134 |
| 1-1B | 60 | 24.88 | 36.39 | 44.60 | 2.52 | 60.02 | 10.88 | 0.101 | |||
| 1-2A | 100 | 24.88 | 37.26 | 45.60 | 2.52 | 62.19 | 14.93 | 0.204 | |||
| 1-2B | 0 | 24.88 | 36.21 | 44.36 | 2.52 | 66.06 | 10.50 | 0.170 | |||
| 2-1 | Tri-dry sample | 24.89 | 50.37 | 58.71 | 2.40 | 153.83 | 19.96 | 0.236 | |||
| 2-2 | 24.88 | 50.21 | 58.63 | 2.40 | 173.58 | 16.34 | 0.240 | ||||
| 3-1A | Uni- | 30 | 60 | 24.87 | 36.23 | 41.78 | 2.37 | 60.85 | 8.96 | 0.220 | |
| 3-1B | 100 | 24.86 | 36.04 | 41.70 | 2.38 | 57.11 | 8.58 | 0.246 | |||
| 3-2A | 40 | 24.88 | 36.84 | 42.90 | 2.40 | 54.95 | 8.01 | 0.264 | |||
| 3-2B | 0 | 24.88 | 37.04 | 43.32 | 2.41 | 76.81 | 11.90 | 0.126 | |||
| 4-1A | Uni- | 30 | 60 | 24.86 | 38.75 | 46.04 | 2.45 | 59.66 | 10.52 | 0.318 | |
| 4-2A | 100 | 24.88 | 36.84 | 42.90 | 2.40 | 46.77 | 6.69 | 0.348 | |||
| 4-2B | 0 | 24.88 | 37.04 | 43.32 | 2.41 | 76.49 | 10.99 | 0.172 | |||
| 4-3A | 60 | 24.87 | 37.27 | 43.56 | 2.41 | 37.60 | 5.24 | 0.236 | |||
| 4-3B | 40 | 24.89 | 36.41 | 42.71 | 2.41 | 53.86 | 8.03 | 0.277 | |||
| 5-1A | Uni- | 30 | 60 | 24.94 | 37.09 | 43.05 | 2.38 | 33.33 | 5.63 | 0.240 | |
| 5-1B | 40 | 24.88 | 35.60 | 41.54 | 2.40 | 32.78 | 5.36 | 0.223 | |||
| 6-1 | Tri-dry sample | 24.80 | 50.50 | 57.51 | 2.36 | 122.37 | 5.63 | 0.354 | |||
| 6-2 | 24.80 | 50.43 | 57.19 | 2.35 | 143.86 | 5.36 | 0.225 | ||||
| 6-3 | 24.80 | 40.14 | 57.22 | 2.36 | 169.47 | 25.69 | 0.187 | ||||
| 13-1A | Uni- | 30 | 100 | 24.90 | 33.81 | 39.29 | 14.65 | 39.49 | 5.49 | 0.367 | |
| 13-1B | 60 | 24.88 | 34.05 | 39.47 | 16.93 | 41.71 | 4.81 | 0.247 | |||
| 13-2A | 40 | 24.89 | 37.36 | 43.20 | 2.38 | 52.12 | 7.66 | 0.481 | |||
| 13-2B | 0 | 24.87 | 38.09 | 44.02 | 2.38 | 99.90 | 10.99 | 0.133 | |||
| Xinzhao area | 7-1A | Uni- | 30 | 60 | 24.85 | 37.01 | 44.15 | 2.46 | 59.72 | 9.72 | 0.247 |
| 7-1B | 100 | 24.85 | 36.56 | 43.86 | 2.47 | 70.87 | 10.57 | 0.249 | |||
| 7-2A | 0 | 24.84 | 38.39 | 45.56 | 2.45 | 95.74 | 14.91 | 0.268 | |||
| 7-2B | 40 | 24.83 | 38.41 | 45.54 | 2.45 | 68.92 | 10.74 | 0.224 | |||
| 8-1A | Uni- | 30 | 100 | 24.78 | 37.71 | 39.14 | 2.15 | / | / | / | |
| 8-1B | 60 | 24.77 | 37.51 | 38.89 | 2.15 | 11.86 | 0.79 | 0.393 | |||
| 8-2A | 0 | 24.80 | 37.56 | 38.13 | 2.10 | 27.22 | 6.55 | 0.329 | |||
| 8-2B | 40 | 24.81 | 38.26 | 38.62 | 2.09 | 17.93 | 2.78 | 0.245 | |||
| 9-1 | Tri-dry sample | 24.84 | 50.49 | 51.54 | 2.11 | 85.54 | 12.84 | 0.226 | |||
| 9-2 | 24.63 | 50.63 | 52.42 | 2.17 | 81.04 | 8.46 | 0.168 | ||||
| 9-3 | 24.77 | 49.38 | 55.65 | 2.34 | 69.83 | 6.74 | 0.167 | ||||
| 10-1A | Uni- | 30 | 0 | 24.86 | 38.01 | 42.89 | 2.32 | 34.17 | 6.45 | 0.277 | |
| 10-1B | 40 | 24.85 | 38.69 | 43.53 | 2.32 | 18.08 | 1.97 | 0.196 | |||
| 10-2A | 100 | 24.85 | 32.35 | 35.56 | 2.27 | 17.60 | 2.12 | 0.434 | |||
| 10-2B | 60 | 24.83 | 36.44 | 40.26 | 2.28 | 11.67 | 0.69 | 0.495 | |||
| 11-1 | Tri-dry sample | 24.87 | 48.88 | 52.07 | 2.19 | 139.58 | 18.86 | 0.117 | |||
| 11-2 | 24.86 | 50.45 | 53.97 | 2.20 | 153.61 | 19.21 | 0.286 | ||||
| 12-1A | Uni- | 30 | 0 | 24.90 | 35.80 | 37.43 | 2.15 | 38.27 | 5.88 | 0.299 | |
| 12-1B | 40 | 24.89 | 37.01 | 38.59 | 2.14 | 19.05 | 2.65 | 0.277 | |||
| 12-2A | 60 | 24.89 | 36.01 | 37.37 | 2.13 | 19.94 | 2.39 | 0.188 | |||
| 12-2B | 100 | 24.91 | 34.46 | 35.65 | 2.12 | 21.37 | 3.28 | 0.437 | |||
| Oil-Water Ratio | 0% | 40% | 60% | 100% |
|---|---|---|---|---|
| Young’s modulus (GPa) | 9.3 | 7.3 | 4.9 | 5.43 |
| Poisson’s ratio | 0.28 | 0.24 | 0.36 | 0.37 |
Disclaimer/Publisher’s Note: The statements, opinions and data contained in all publications are solely those of the individual author(s) and contributor(s) and not of MDPI and/or the editor(s). MDPI and/or the editor(s) disclaim responsibility for any injury to people or property resulting from any ideas, methods, instructions or products referred to in the content. |
© 2025 by the authors. Licensee MDPI, Basel, Switzerland. This article is an open access article distributed under the terms and conditions of the Creative Commons Attribution (CC BY) license (https://creativecommons.org/licenses/by/4.0/).
Share and Cite
Ren, Q.; Gao, T.; Jiang, R.; Wang, J.; Li, M.; Feng, J.; Du, H. Fractal–Fractional Synergy in Geo-Energy Systems: A Multiscale Framework for Stress Field Characterization and Fracture Network Evolution Modeling. Fractal Fract. 2025, 9, 322. https://doi.org/10.3390/fractalfract9050322
Ren Q, Gao T, Jiang R, Wang J, Li M, Feng J, Du H. Fractal–Fractional Synergy in Geo-Energy Systems: A Multiscale Framework for Stress Field Characterization and Fracture Network Evolution Modeling. Fractal and Fractional. 2025; 9(5):322. https://doi.org/10.3390/fractalfract9050322
Chicago/Turabian StyleRen, Qiqiang, Tianhao Gao, Rongtao Jiang, Jin Wang, Mengping Li, Jianwei Feng, and He Du. 2025. "Fractal–Fractional Synergy in Geo-Energy Systems: A Multiscale Framework for Stress Field Characterization and Fracture Network Evolution Modeling" Fractal and Fractional 9, no. 5: 322. https://doi.org/10.3390/fractalfract9050322
APA StyleRen, Q., Gao, T., Jiang, R., Wang, J., Li, M., Feng, J., & Du, H. (2025). Fractal–Fractional Synergy in Geo-Energy Systems: A Multiscale Framework for Stress Field Characterization and Fracture Network Evolution Modeling. Fractal and Fractional, 9(5), 322. https://doi.org/10.3390/fractalfract9050322