1. Introduction
In tight reservoirs, water-based fracturing faces challenges such as poor fluid loss control, susceptibility to water blockage, and inadequate flowback rates. Typically, methods such as CO
2 fracturing, chemical fracturing, foam fracturing, and liquid nitrogen fracturing are employed in such reservoirs [
1,
2,
3,
4]. Among them, CO
2 fracturing is a common method for fracturing tight reservoirs [
5]. However, a comprehensive understanding of the impact of pre-injected CO
2 on the formation of fractures in tight reservoirs is crucial for enhancing the efficacy of reservoir modifications. When establishing a hydraulic fracturing model for vertical fracture initiation, it is typically assumed that artificial fractures propagate along a straight line starting from the wellbore on a horizontal plane. However, in actual fracturing processes, fractures macroscopically extend along the direction of the maximum principal stress, whereas numerous microscopic fracture branches are observed near the main fracture [
6,
7,
8]. During CO
2 fracturing, the CO
2 immersion affects tight reservoirs in various ways. Although the interaction between CO
2 and tight reservoirs is widely recognized [
9,
10,
11], computational methods for studying the fracture morphologies formed by CO
2 fracturing are still imperfect. Yang et al. [
12] calculated the impact of pre-injected CO
2 on reservoir properties during hydraulic fracturing using numerical simulation methods and analyzed the reasons for the formation of complex fractures. Hang et al. established a quantitative relationship between changes in reservoir properties and simulated reservoir volume, deriving the relationship between CO
2 immersion time and the brittleness and fracture initiation pressure of shale. Zhu et al. [
13] compared the performance of water-based fracturing fluids and supercritical CO
2 fracturing fluids in sandstone, conglomerate, and shale through laboratory experiments and analyzed the effectiveness of supercritical CO
2 for linking natural fractures. Regarding the description of artificial fracture branches, only studies on the range and scale of branching fractures have been reported [
14,
15]. Regarding CO
2 fracturing, descriptive studies on fracture locations and morphologies have not yet been conducted.
When addressing the complex formation characteristics of branch fractures during CO
2 fracturing and their significant impact on tight reservoir modification effects, the existing simulation methods fall short in characterizing the distribution patterns of branch fractures under varying parameter conditions. To overcome these limitations, we draw inspiration from the L-systems method in fractal graphics generation. Conceived by Aristid Lindenmayer, L-systems provide a mathematical framework for generating complex structures through iterative rules [
16]; this framework is particularly suitable for describing the spatial distribution features of weak discontinuities in tight reservoirs. Furthermore, during model construction, we can identify different branching levels and assign the corresponding mechanical property parameters to each level, thereby providing a robust physical foundation for subsequent simulations.
Therefore, we employed a fractal L-system to establish a method for describing the morphologies and distribution patterns of weak natural discontinuities within rock. Based on fractal similarity, we calculated the shear and tensile strengths of weak discontinuities at various levels during the water-based fracturing fluid and CO2 fracturing processes, as well as the pressure drop gradient within these weak discontinuities. Based on the results, we developed a simulation calculation method for the distribution of fractured branches. This calculation method enables the simulation of water-based and CO2 fracturing processes, resulting in fracture opening morphologies that exhibit fractal characteristics. The research presented in this study provides a theoretical basis for the analysis of complex fracture formations and lays the foundation for fracturing design and the evaluation of fracturing effects.
2. Fractal Description Method for Weak Discontinuities in Tight Reservoirs
Within the internal structures of tight reservoirs, a substantial number of naturally occurring, irregularly distributed, and mechanically weak discontinuities exist. The physical characteristics, including strength, in the vicinity of these planes differ from those of the surrounding rock mass. Based on the varying sizes, orientations, and chaotic locations of these weak discontinuities, the mechanical properties of the entire rock mass become heterogeneous. The chaotic distribution of weak discontinuities within tight reservoirs renders them difficult to describe and replicate [
17,
18,
19]. During the fracturing process, artificial fractures invariably propagate along the most susceptible directions, which are primarily determined by the location, strength, and forces acting on the weak discontinuities [
20,
21,
22]. Although some weak discontinuities may be subjected to lower stress states than other nearby locations, their relatively lower strength may lead to premature fractures, resulting in a certain degree of deflection in the extension direction of the artificial fractures or the generation of fracture branches. During CO
2 fracturing, the unique properties of CO
2 fracturing fluid can reduce the fracture initiation pressure, thereby forming more fractures [
23,
24] and leading to a more complex fracture system.
To describe the morphology and distribution characteristics of fractures, we employed a method that involved the prefabrication of weak discontinuities with fractal characteristics. This approach identifies all potential fracture locations within the weak discontinuities of a tight reservoir and determines whether each weak discontinuity undergoes fracture formation during simulation. When weak discontinuity fractures occur during the fracturing process, the resulting stress shadow inhibits the formation of fractures at adjacent locations, and it is only necessary to establish weak discontinuities with the potential for preferential fractures in our model. To describe the morphology and distribution characteristics of fractures, it is assumed that weak discontinuities with fracture potential exhibit strict self-similarity in their distribution. A method utilizing fractal L-systems to generate fractal patterns was employed to describe the planar distribution characteristics of weak discontinuities, treating the system of weak discontinuities in the rock as the final result of multiple iterations of a specific generator.
The L-system, through initial graphics and substitution rules, can scale a graphic composed of multiple line segments based on a single straight line segment, replacing it at the beginning and end of the original line segment. Subsequently, this process is repeated, applying the same operation to each line segment in the preceding graphic. After multiple iterations, the L-system is capable of generating intricate patterns [
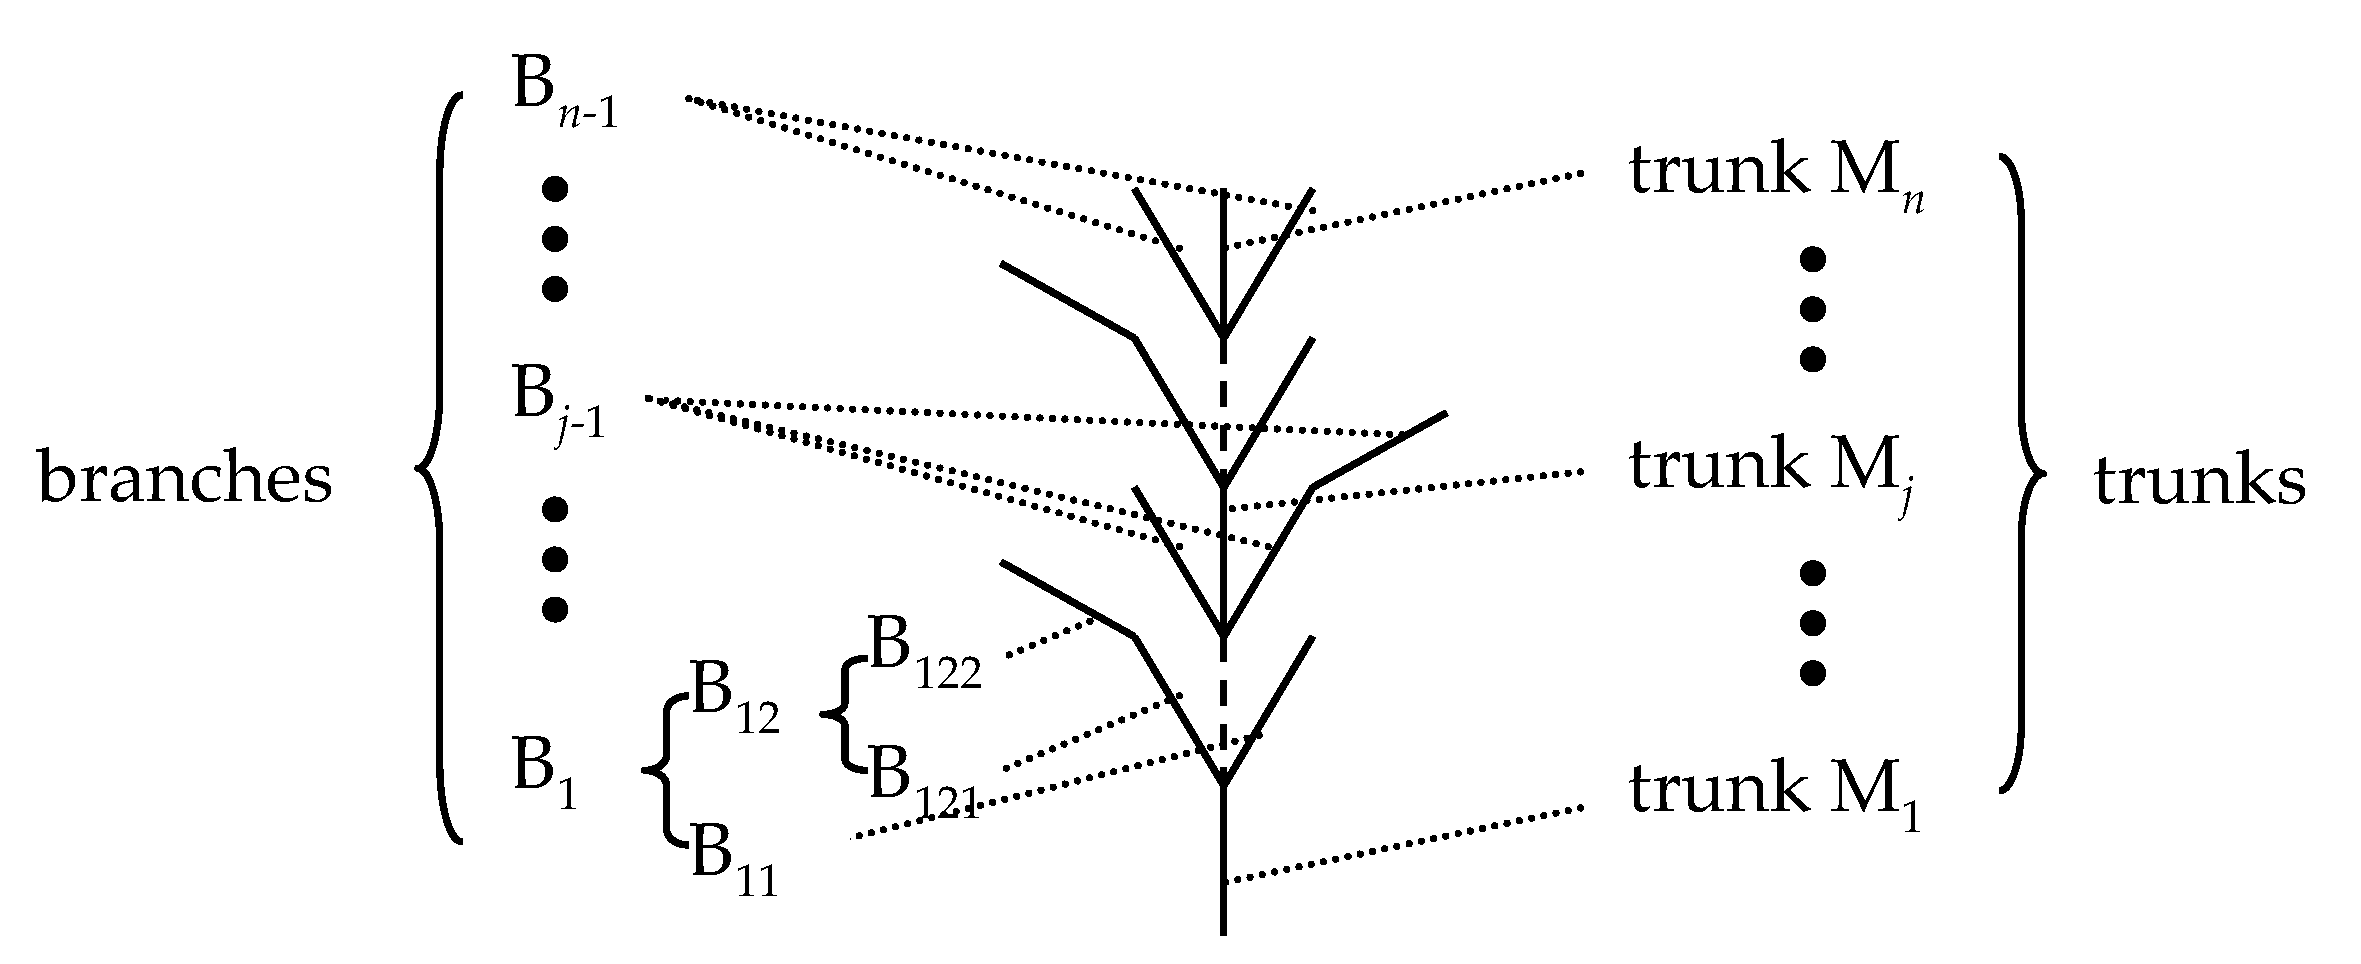
25]. Generators are crucial elements in L-systems, determining the shape of the generated graphics. In some studies, these generators have also been referred to as atomic elements, atomic structures, templates, or branching patterns. Based on the morphological features of weak discontinuities, we propose a tree-like generator, as shown in
Figure 1. This generator features a straight main trunk divided into branches. Between the
jth section and the (
j + 1)th section of the trunk, there are
kj branches, each with multiple sections.
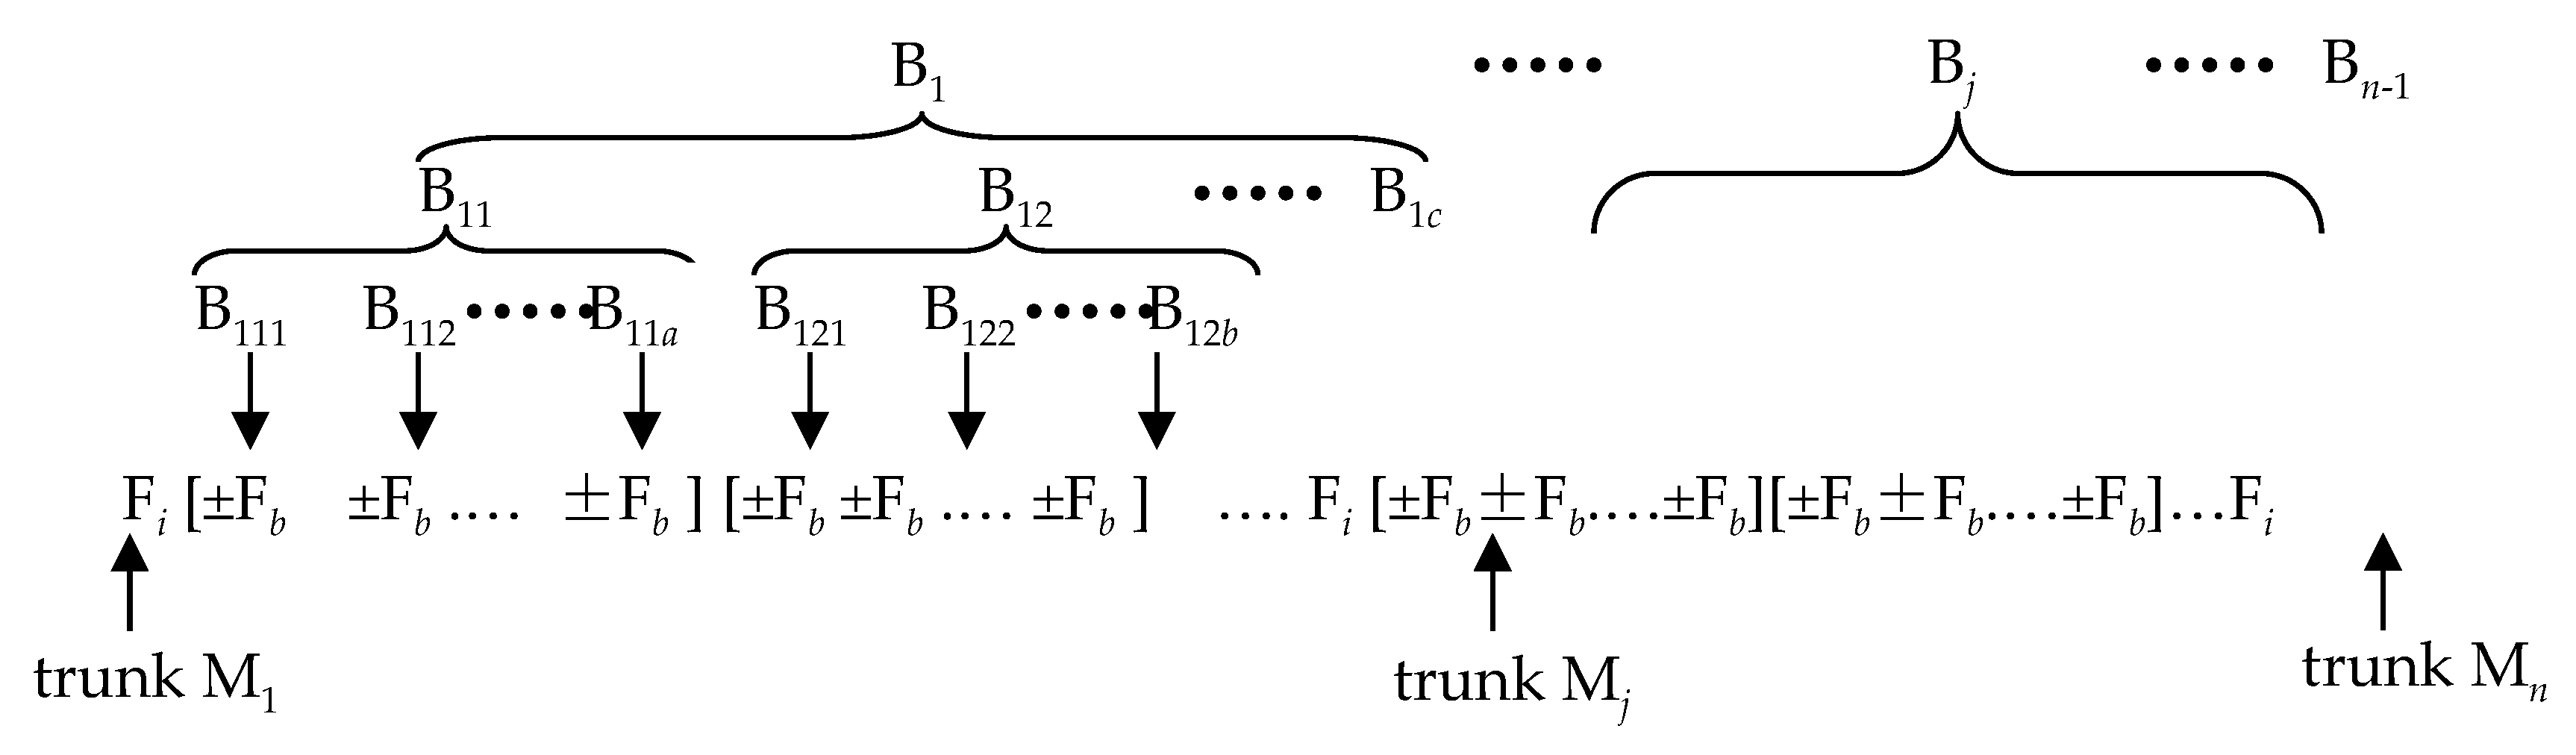
L-systems typically generate graphics in a code-like format by controlling the movement and turning of a turtle. This code, through multiple iterations using predefined generators, forms intricate patterns. Consequently, the style of the generators directly influences the morphology of the final graphics. Based on the hypothesis of the generator form in
Figure 1, the corresponding general formula for the generators is illustrated in
Figure 2.
In
Figure 2, F represents the forward symbol within the generators, which have equal step lengths. Typically, generators do not have subscripts. However, in this study, it was necessary to determine the level of each symbol within the iterative expression; hence, subscripts were included.
i denotes the branching level or weak discontinuity level;
b denotes the pending branching level; + and − correspond to left and right turn symbols, respectively, with a rotation angle of
α; [indicates a record point, and upon reaching], the travel position and angle revert to the corresponding record point. When the fractal L-system is utilized to compute the morphologies of weak discontinuities in dense reservoirs, the initial travel instructions are iteratively replaced multiple times according to the generators. During the iterative replacement process, the pending coefficient
j is assigned to
b after the
jth iteration. The angular index of travel unit F represents the level at which this travel unit forms a weak discontinuity, facilitating distinction during the subsequent computational processes.
The fractal dimension of a weak discontinuity can be calculated as follows [
26]:
where
D is the fractal dimension of the weak discontinuities,
r is the unit of measurement, and
N is number of units. In the iterative process of generating graphics within the L-system, each F symbol is replaced by a generator, and the total length remains unchanged. That is, when the unit of measurement
r is the length of a generator, the number of units
N is the sum of the number of trunks and branches, and the length of a generator corresponds to the number of trunks. Thus, the fractal dimension of the tree-like L-system can be shown as follows:
where
n is the number of main trunks in the generator and
m is the total number of branches.
During the formation of weak discontinuities, several initiators are initially generated randomly. These initiators are then subjected to number-theoretic iteration using the L-system method to establish a progression route. The resulting graphical representation serves as a representation of the weak discontinuities within tight reservoirs, which possess the potential for damage during the fracturing process. The values of the number of main trunks and total number of branches in the fractal L-system generators should be as close as possible to the fractal dimensions of the weak discontinuities and the study area. The fractal parameters and morphological characteristics of the aforementioned weak discontinuities constitute the fundamental attributes of tight reservoirs. The formation of fractures during the fracturing process in weak discontinuities with the potential for opening depends on the characteristics of the fracturing fluid and the state of the crustal stress.
3. Conditions for the Initiation of Weak Discontinuities
Considering the self-similarity of the morphologies of weak discontinuities [
27,
28], the macroscopic length of an
nth-order weak discontinuity in L-system can be represented as
where
ai denotes the macro-linear length of the
ith level of weak discontinuities (m) and
a0 denotes the length of the longest weak discontinuity (m).
From a microscopic perspective, weak discontinuities within tight reservoirs are characterized by their tortuous nature. Based on the fractal self-similarity property, it can be inferred that the total length of the weak discontinuities measured at different resolutions varies. When the resolution is
δ, the expression for measuring the microscopic length of weak discontinuities at a given level can be expressed as
where
Li(
δ) represents the microscopic length of the weak discontinuity with a measurement resolution of the corresponding order of magnitude, m;
L0(
δ) denotes the microscopic length of the longest weak discontinuity with a measurement resolution of the corresponding order of magnitude, m.
During the hydraulic fracturing process, artificial fractures may encounter weak discontinuities within rock. These weak discontinuities exhibit varying degrees of roughness. Their shear and tensile strengths also differ under the influence of the CO
2 fracturing fluid. Assuming that each level of weak discontinuity satisfies the fracture mechanics failure conditions, the expressions for the shear and tensile strengths of the weak discontinuities at level
i can be represented as
where
τic represents the shear strength of the weak discontinuity, MPa;
Ki,IIC denotes the shear fracture toughness of the level-
i weak discontinuity, MPa·m
0.5;
σic denotes the tensile strength of the weak discontinuity, MPa;
Ki,IC denotes the tensile fracture toughness of the level-
i weak discontinuity, MPa·m
0.5.
By rearranging Equations (4)–(6), the following expressions can be obtained:
In the context of conventional water-based fracturing fluid operations, the fracture toughness at various levels within tight reservoirs does not change with the length of the natural weak discontinuities. However, during CO
2 fracturing, CO
2 reduces the fracture initiation pressure, and the magnitude of this reduction is correlated with the length of the fracture. Dong et al. [
29] conducted experiments to determine the impact of CO
2 on the toughness of fractures of various lengths. The variation in fracture toughness across different lengths can be considered as the difference in fracture toughness among fractures of varying fractal grades.
where
Y = 1 when a water-based fracturing fluid is used, whereas
when a CO
2 fracturing fluid is used [
29].
By substituting Equation (2) into Equation (4), then Equation (4) into Equation (11), x
i can be expressed as
Based on the geometric relationships, the shear fracture threshold for weak discontinuities at any location can be derived as
where
σH represents the maximum horizontal principal stress of the reservoir, MPa;
σh denotes the minimum horizontal principal stress of the reservoir, MPa;
θ represents the angle between the hydraulic fracturing fracture and weak discontinuity, °;
τ0c denotes the minimum shear strength of the weak discontinuity, MPa;
σ0c denotes the minimum tensile strength of the weak discontinuity, MPa;
ps is the shear fracture threshold of the weak discontinuity, MPa;
Kf is the wall friction coefficient of the weak discontinuity.
The critical value for the tensile failure of weak discontinuities (
p0) in MPa is calculated as
When the pressure on weak discontinuities reaches the critical point for shear or tensile fracture, the discontinuities undergo failure and initiate fracture formation. Different fracturing fluids can lead to variations in the initiation conditions of weak discontinuities of varying lengths, as manifested in the shear and tensile fracture toughness values in Equations (9) and (10); subsequently, this results in alterations to the critical values for shear and tensile failure, as indicated in Equations (13) and (14). The mechanism by which CO2 reduces the initiation pressure of fractures is complex and is primarily determined through experimental methods. The differences in the Y values of Equations (9) and (10) reflect the distinct properties of water-based fracturing fluids and CO2-based fluids within the fractures, leading to varying levels of weak discontinuity fracture initiation pressures for the two fluids.
To simulate the distribution of hydraulic fracturing branches, the morphological parameters of the weak discontinuities were first determined based on experiments. Subsequently, a model was established for the distribution of weak discontinuities in the rock mass. We then integrated the conditions for initiating weak discontinuities to determine whether the grid was activated. Finally, a grid containing the activated fractures was calculated.
5. Case Analysis
Considering the experimental results of the natural rock cores measured in unpublished thesis [
30] as an example, the scanning results of the weak discontinuities on the rock surface included a fractal dimension of 1.4 for weak discontinuities and a fracture angle of 35.5°. Based on the established treelike model, the fractal dimension was calculated to be 1.4037 when
n = 4 and
m = 3, which is close to the box dimensions of the weak discontinuities measured in [
30]. Our simulation calculation used a 700 × 700 grid with a grid length of 1 m and a generator of “F
0[−F
1--F
1]F
0F
0[+F
1]F
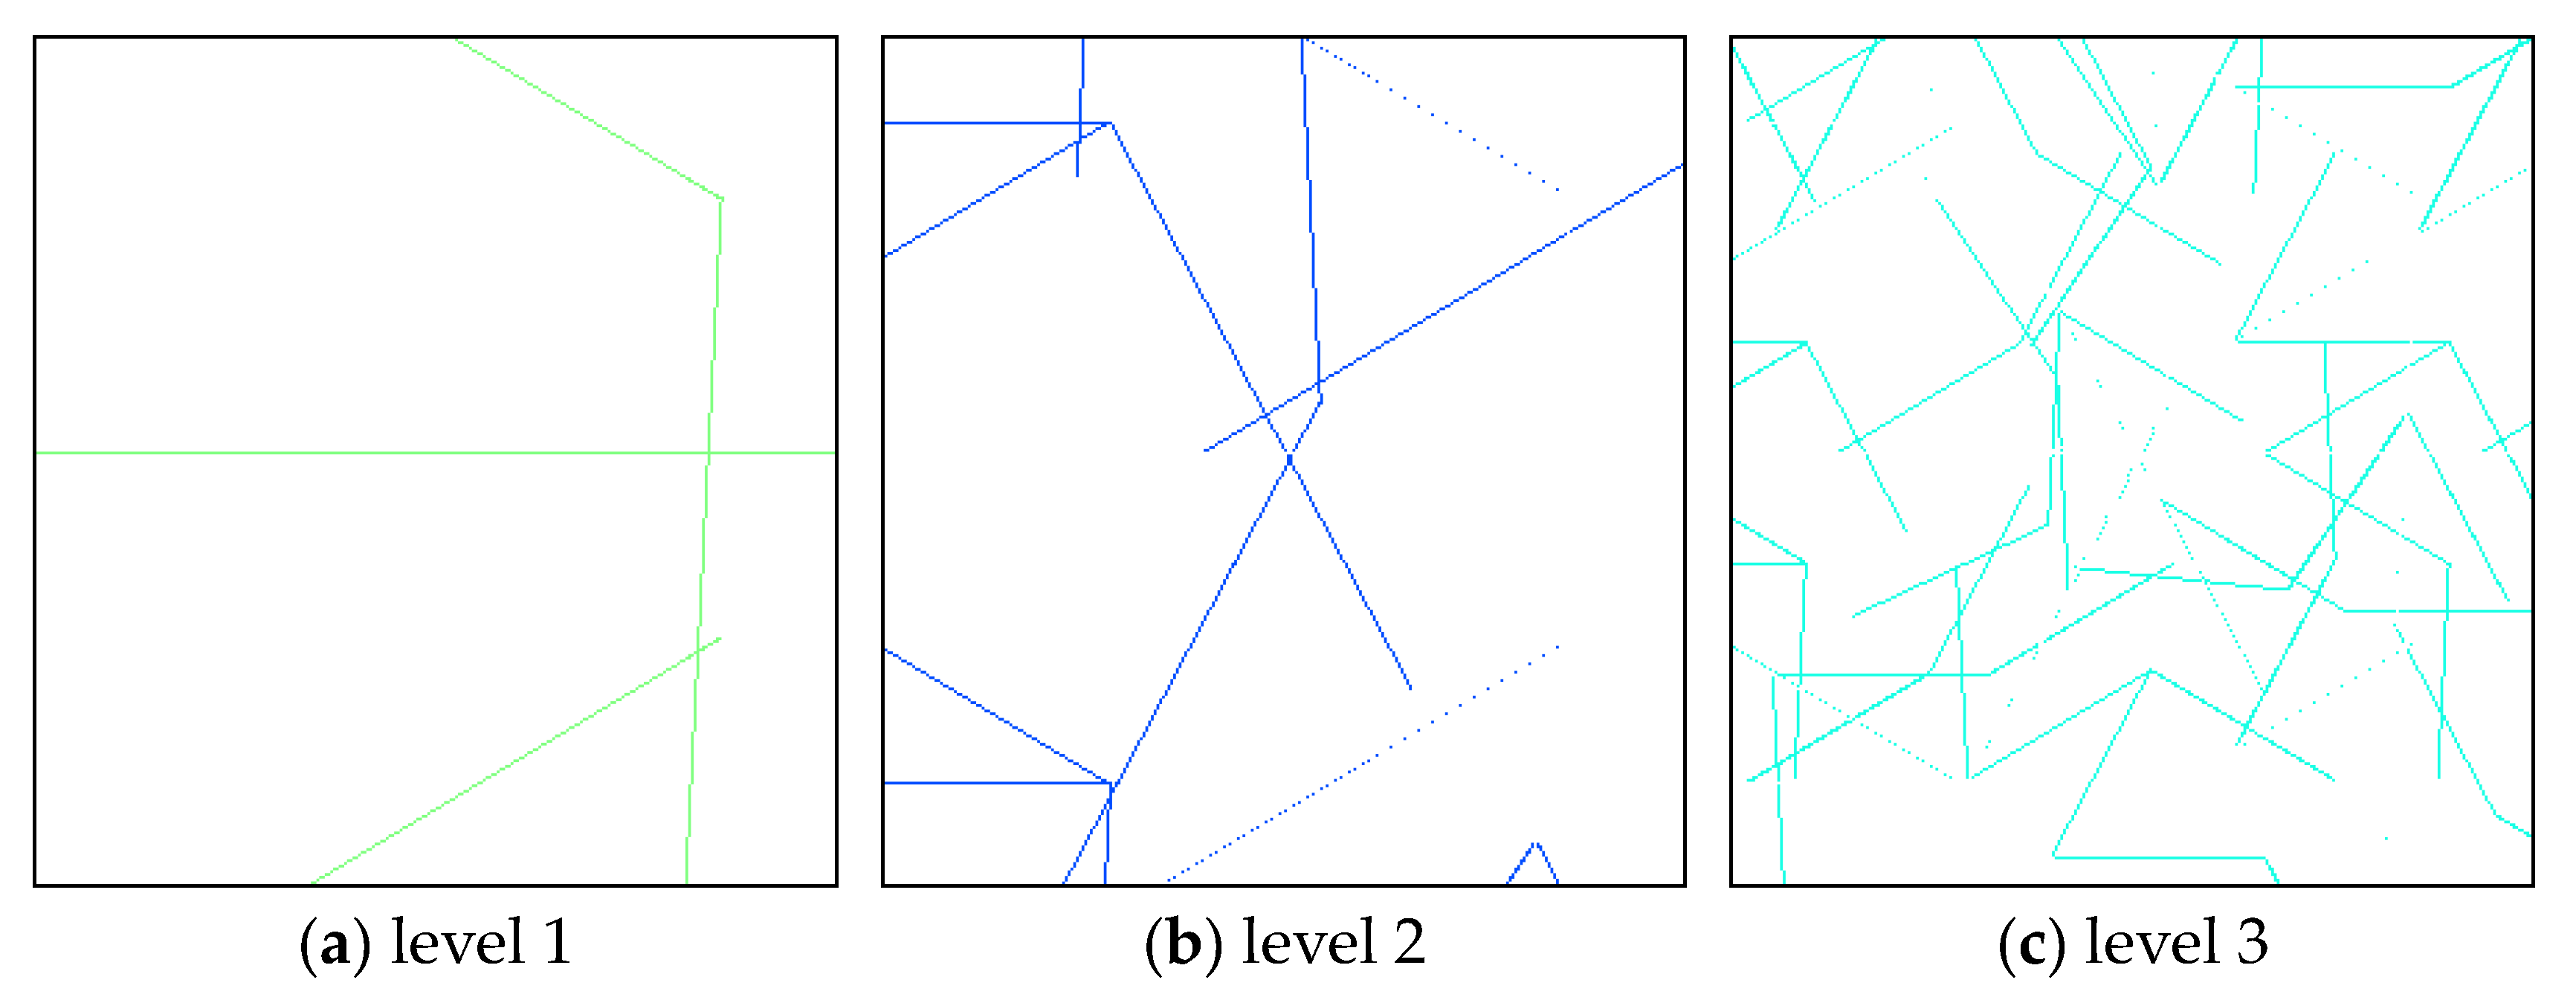
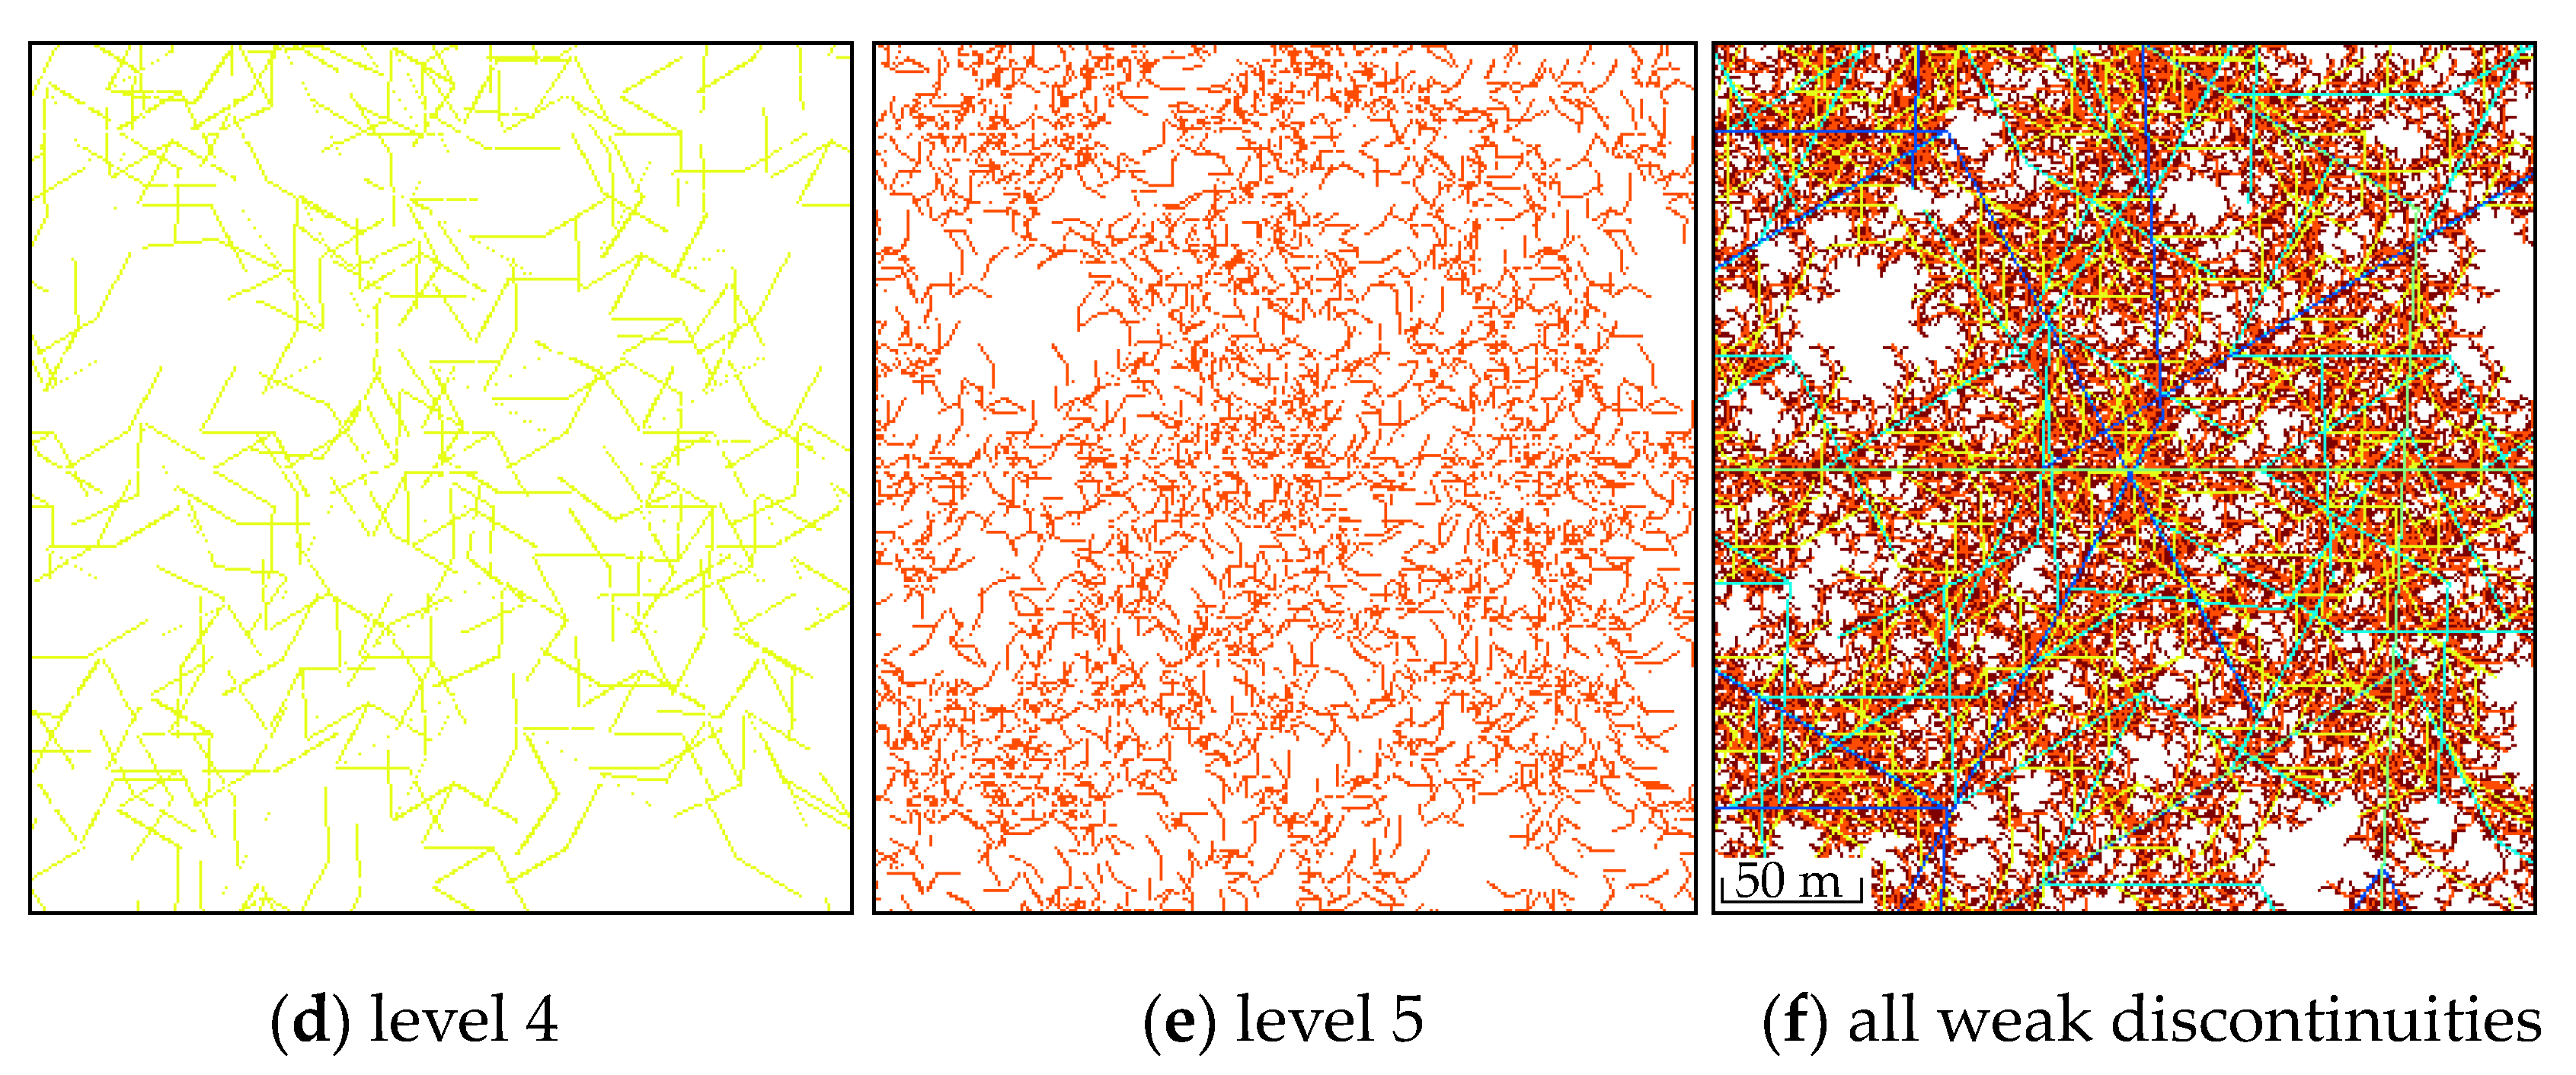
0” and employed six iterations. A program for weak discontinuities and fracturing simulation was developed using Visual Basic 6.0. The spatial distribution patterns of the weak discontinuities at various levels were obtained using the L-system fractal method, as shown in
Figure 3.
Considering that the scale of the level-6 weak discontinuities in this model was significantly smaller than the grid size, only the initiation of fractures on the iterative weak discontinuities of levels 1 to 5 was calculated. The CO
2 fracturing fluid reduces the fracture initiation pressure, causing changes in the fracture toughness during the fracturing process. Wang [
31] experimentally determined the fracture initiation pressure of a CO
2 fracturing fluid relative to that of a water-based fracturing fluid in tight sandstone reservoirs. The instance calculation parameters for the water-based and CO
2-based fracturing fluid conditions as shown in
Table 1.
On average, the fracture initiation pressure of CO
2 fracturing was 46.9% lower than that of the water-based fracturing fluid, which is based on the unpublished thesis [
31]. By calculating the shear and tensile strengths of the fractures on the weak discontinuities at various levels for both ordinary water-based fracturing fluid and CO
2 fracturing fluid using Equations (7), (8) and (17), and combining the results with the experimentally measured reduction in the fracture toughness of the CO
2 fracturing fluid, we obtained the results presented in
Figure 4.
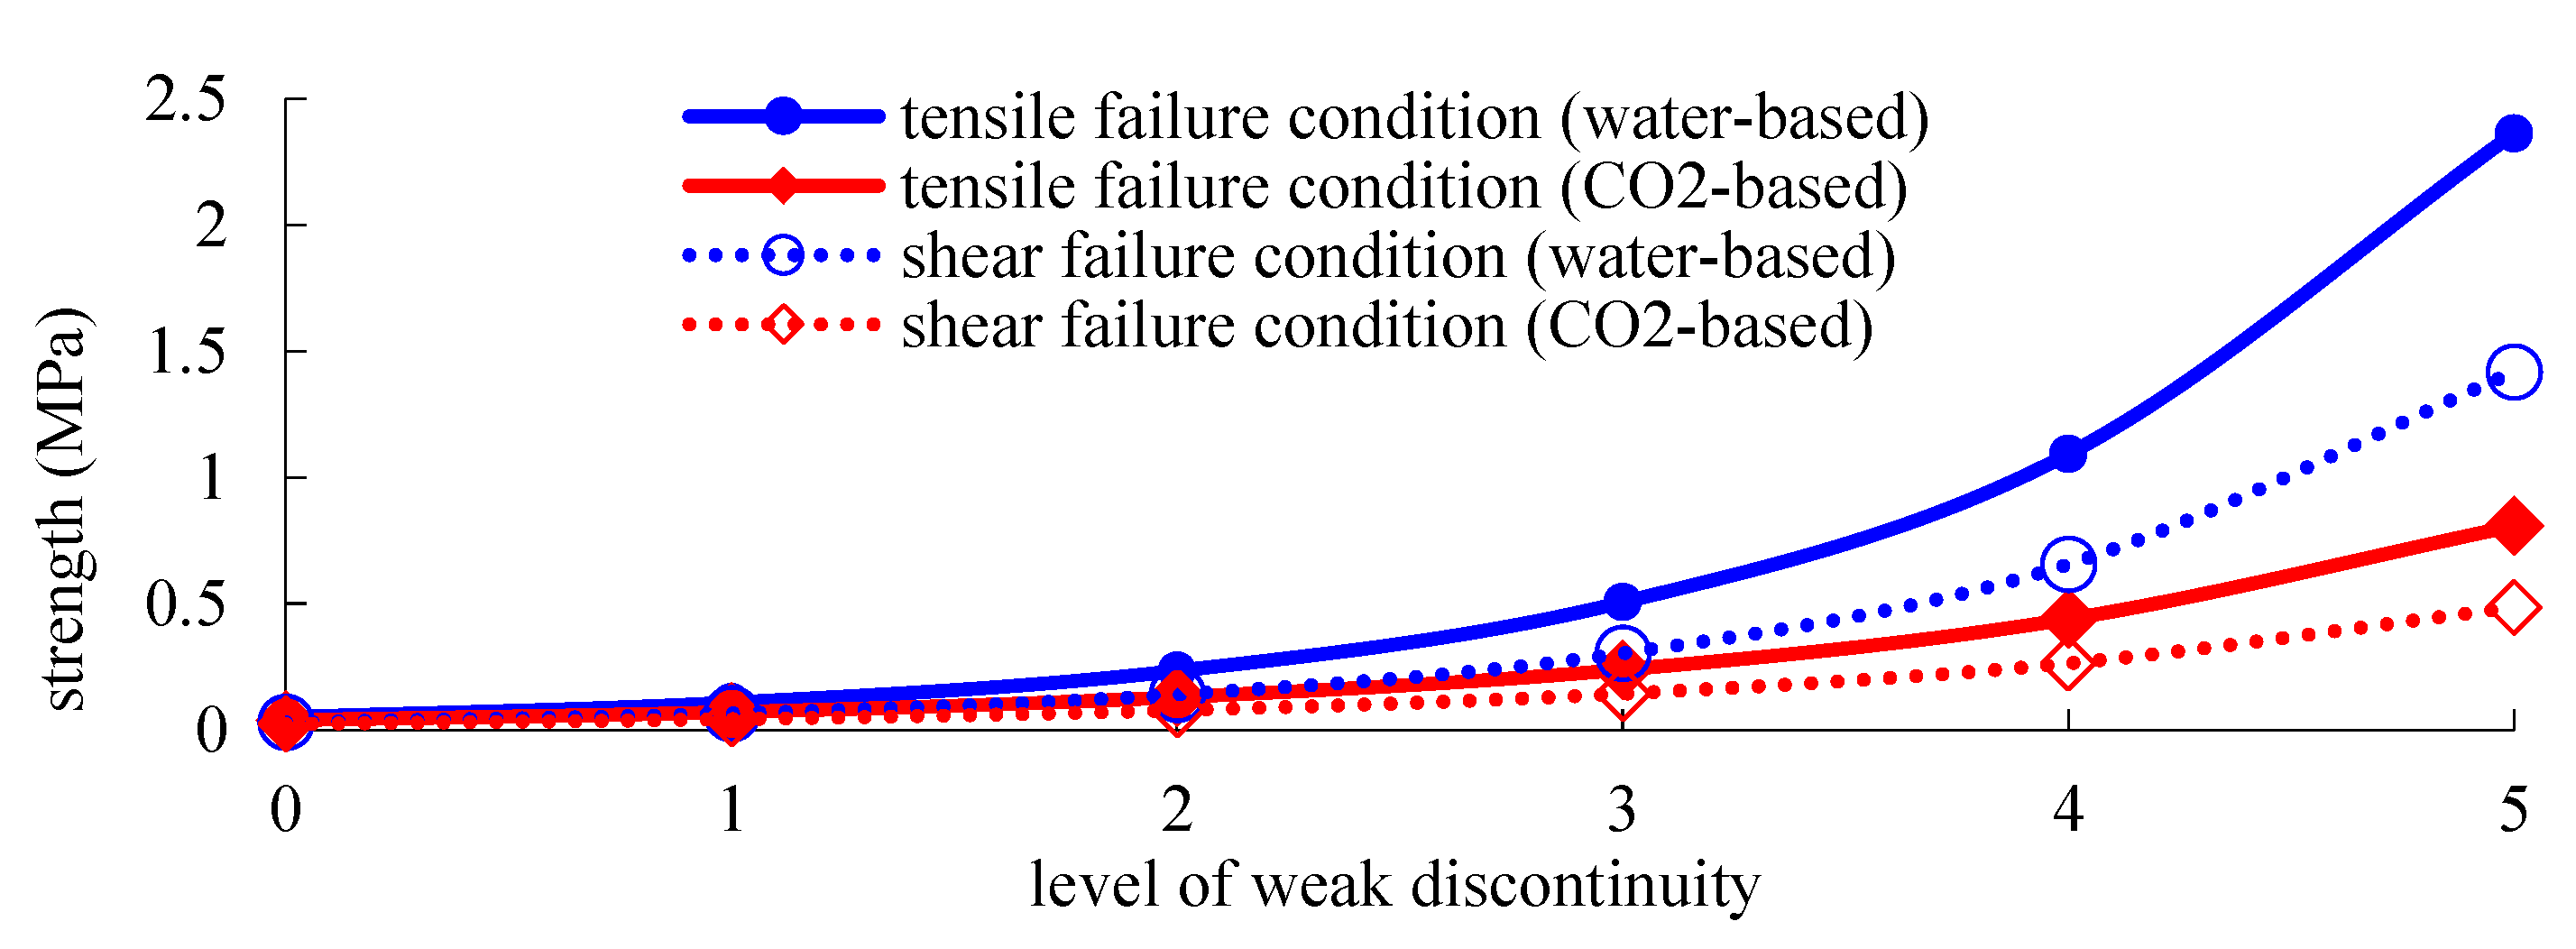
Based on the scale of the target model, the lengths of the weak discontinuities at levels 1 to 5 were 175, 43.75, 10.94, 2.73, and 0.68 m, respectively. The critical values for the fracture of the weak discontinuities at each level progressively increased. Under water-based fracturing conditions, the critical value for the fracture of each weak discontinuity increased by 116.2%, indicating that shorter weak discontinuities are less susceptible to damage. However, during CO
2 fracturing, the critical values for the fracture of the weak discontinuities at each level were lower than those under the water-based fracturing conditions, and the degree of increase in the critical value for the fracture of each weak discontinuity decreased. Specifically, the critical value for the fracture of the weak discontinuity at level 1 under CO
2 fracturing conditions decreased by 23.5% compared with that under water-based conditions, whereas for the weak discontinuity at level 5, the value decreased by 65.8%. These results clearly demonstrate that CO
2 fracturing is more conducive to the formation of secondary fractures. The parameters of simulation is shown in
Table 2.
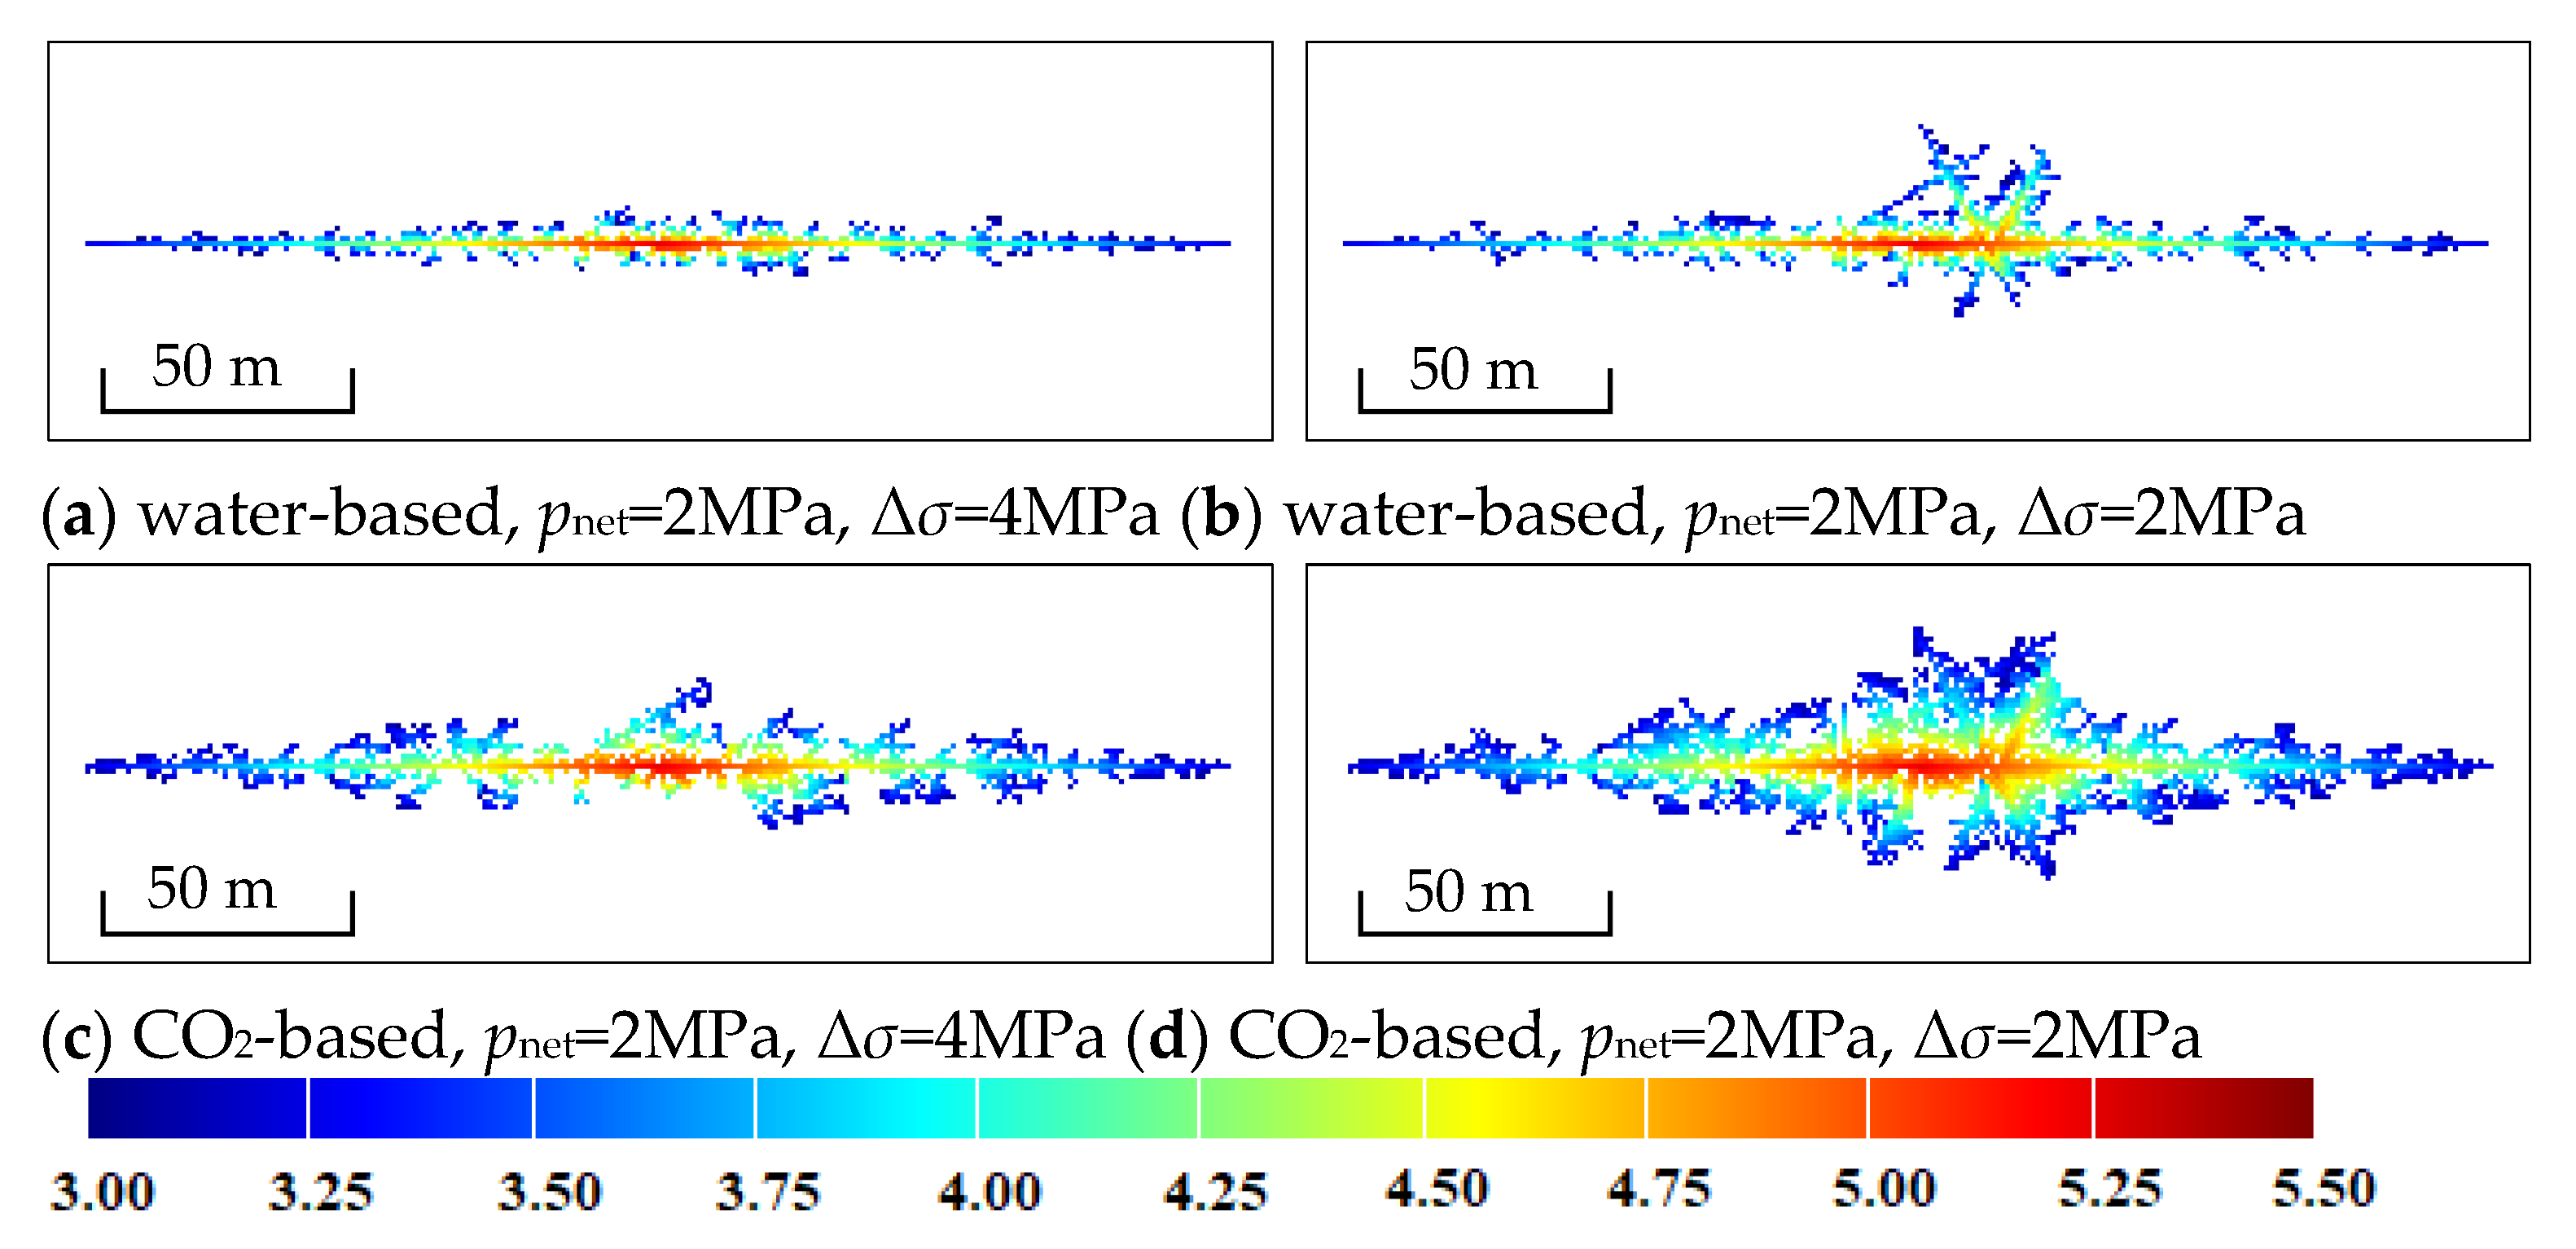
By utilizing the established fractal L-system model for the distribution of weak discontinuities and incorporating the discriminant conditions for the initiation of weak discontinuities, we simulated the fracture initiation conditions and calculated the corresponding results when the net pressure within the fracture at the wellbore was 2 MPa. The maximum and minimum principal stress differences take on various values, as shown in
Figure 5.
As shown in
Figure 5, when the net pressure within the fracture is 2 MPa, the number of weak discontinuity openings gradually increases with the decrease in the principal stress difference, and the network-like degree of the fractures also gradually increases. Regarding fracture levels, as the principal stress difference decreases, the number of branch fractures near the main fracture increases, and the number of smaller branch openings on the branch fractures also increases. When the principal stress difference is 4 MPa, under water-based fracturing fluid conditions, the total cumulative length of the various weak discontinuity openings is 779 m. However, during CO
2 fracturing, the total cumulative length of the various weak discontinuity openings is 1348 m. The total length of the main fractures for the two scenarios differs by only 2 m, and the increase in the cumulative length of the other fractures mainly stems from the opening of weak discontinuities in smaller branches. When the principal stress difference is only 2 MPa, under water-based fracturing fluid conditions, the total cumulative length of the various weak discontinuity openings reaches 1113 m, representing an increase of 42.87%. During CO
2 fracturing, the total cumulative length of the various weak discontinuity openings reaches 2609 m, indicating that a smaller principal stress difference leads to the opening of more secondary small weak discontinuities. The principal stress difference significantly influences the opening of weak discontinuities. A lower principal stress difference leads to an increase in the number and size of weak discontinuity openings, particularly in smaller branches, resulting in higher cumulative lengths and greater networking degree of fractures.
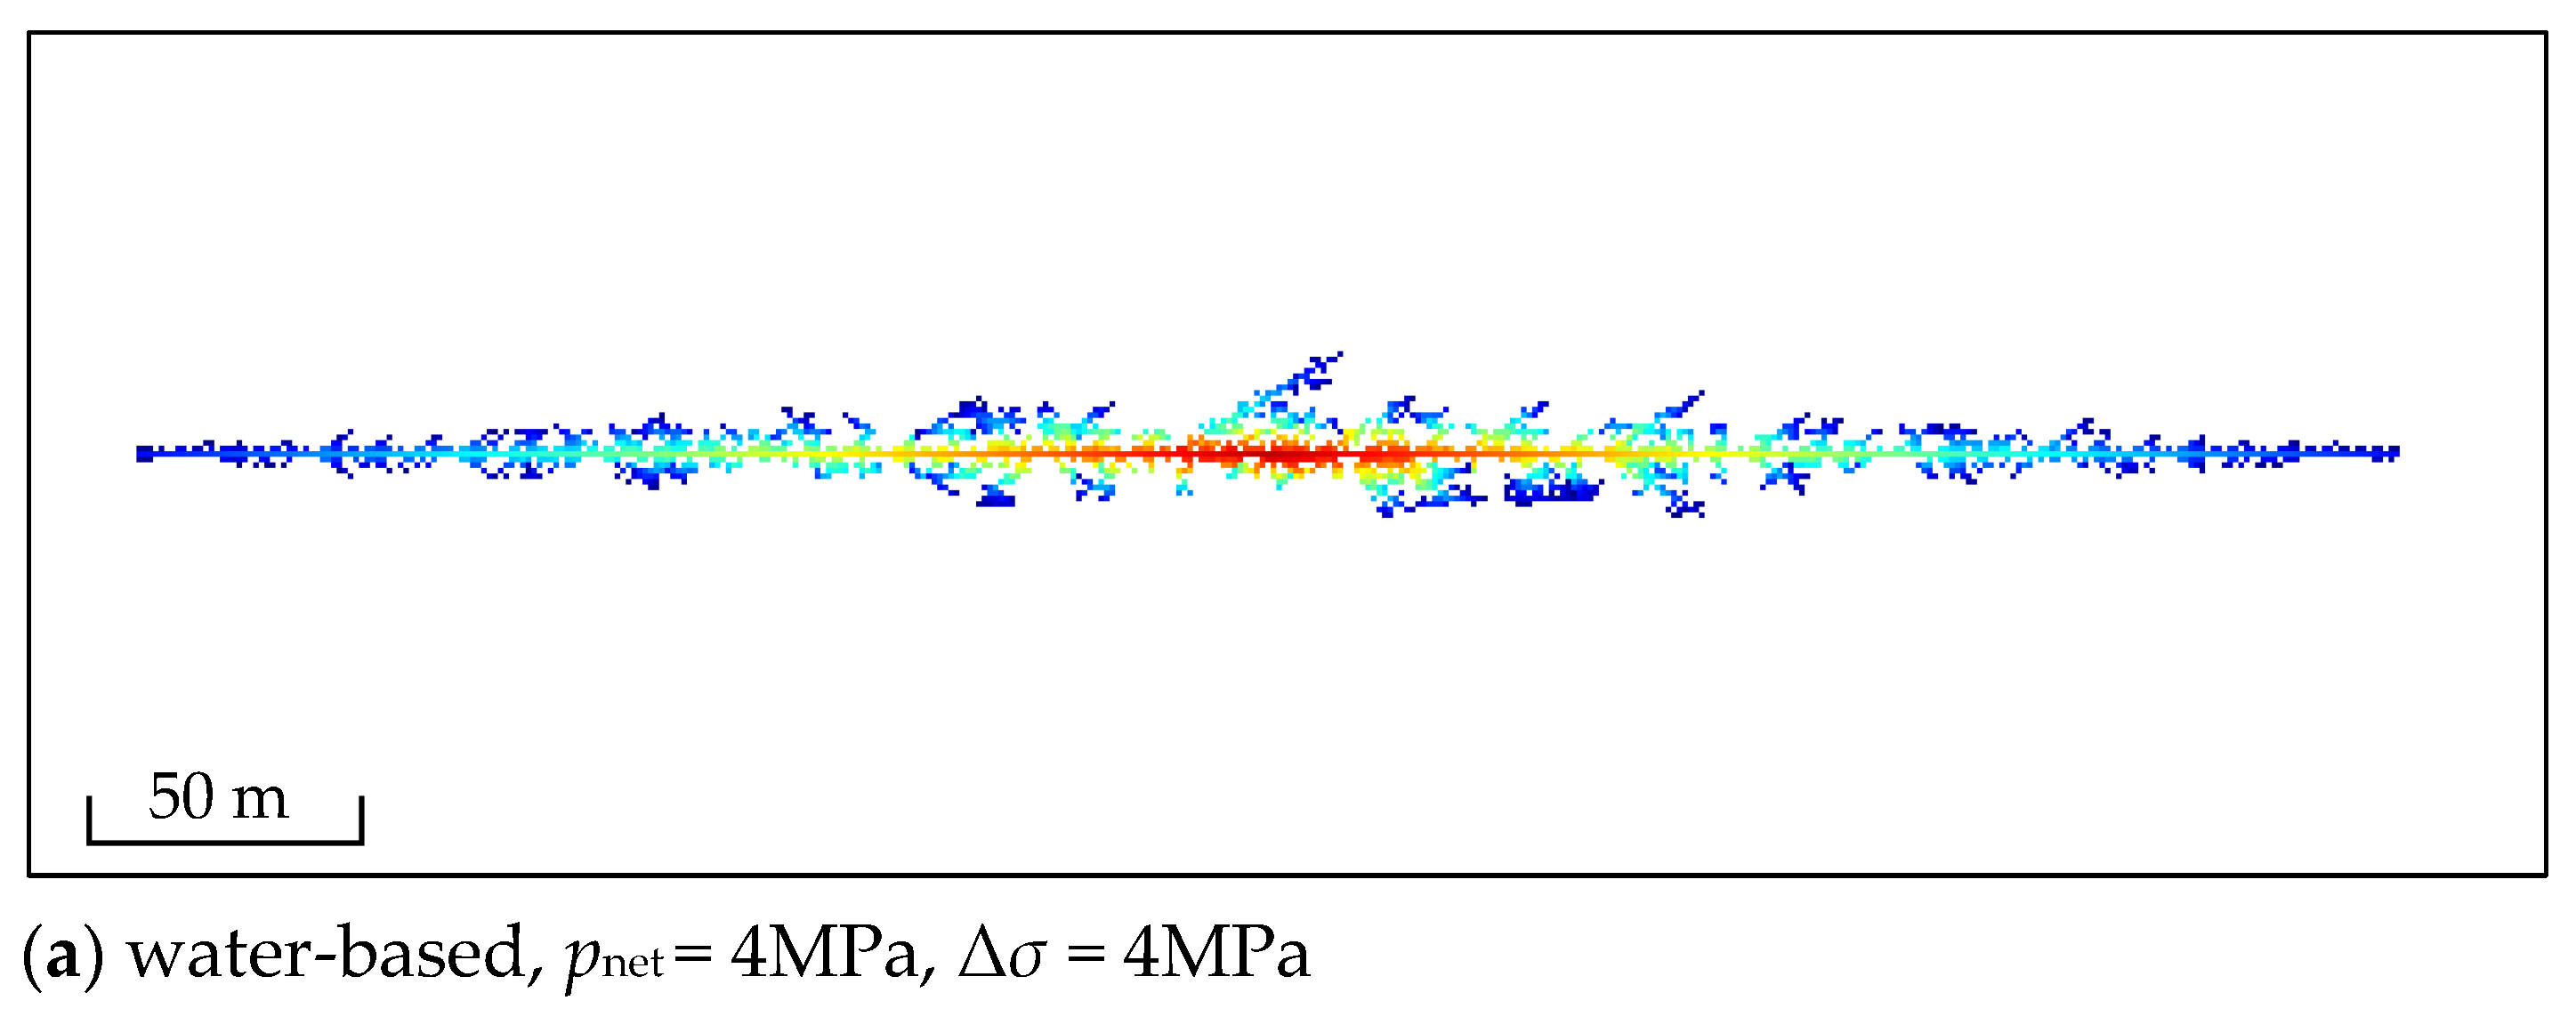
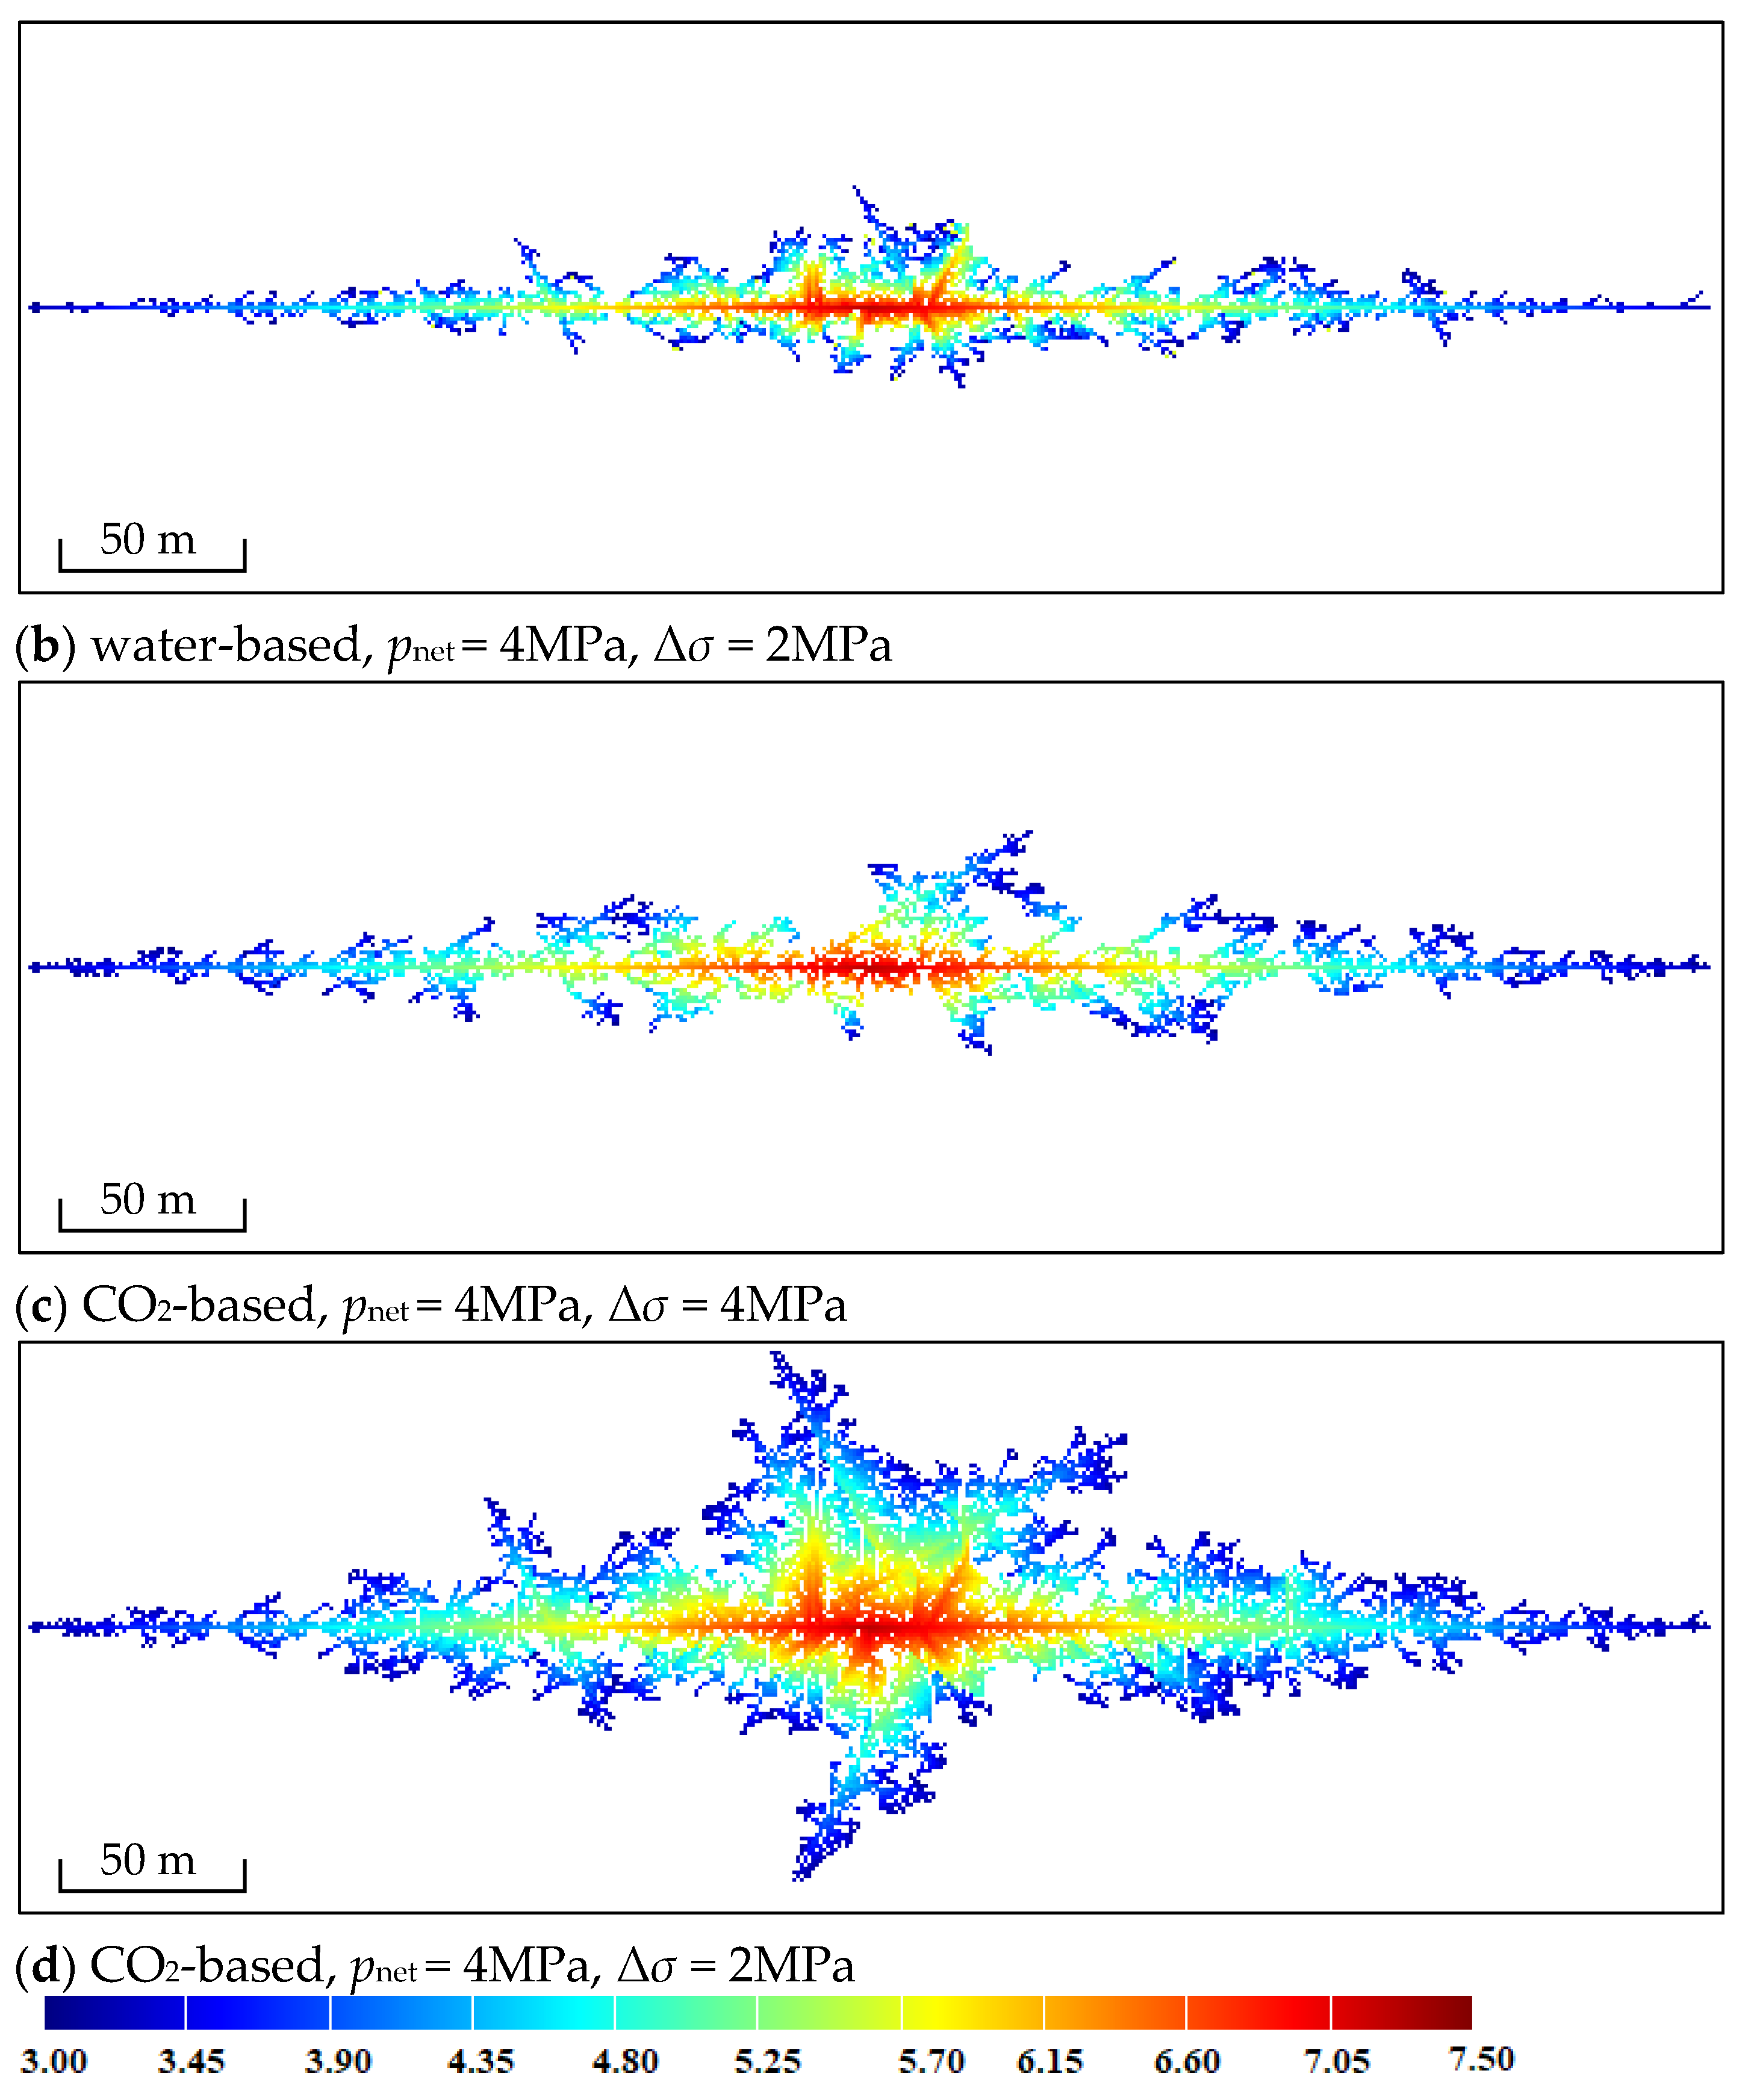
To analyze fracture opening under varying net pressure conditions within the fracture, we computed the fracturing effects of different types of fracturing fluids in tight reservoirs under a net pressure of 4 MPa within the fracture, as shown in
Figure 6.
When the net pressure within the fracture increases, the overall pattern of the fracture opening remains consistent with that at a net pressure of 2 MPa, albeit with a notable enhancement in the number of the various fracture branches and the overall length of the fractures. Under the water-based fracturing fluid conditions, the cumulative total lengths of the various weak discontinuities that open up with principal stress differences of 4 and 2 MPa are 2343 and 3699 m, respectively. For the CO
2 fracturing, these values increase to 3943 and 9940 m, respectively. An increase in the net pressure within the fracture aids in the growth of the various weak discontinuities, particularly short fractures near the wellbore. When comparing
Figure 6a and
Figure 6b there is a minimal difference in the extension length in the direction of the maximum principal stress; however, a decrease in the principal stress difference results in a cumulative increase of 57.87% in the total length of the weak discontinuities. From the simulation results of the fracture opening morphology, it is evident that this increased length occurs primarily near the wellbore, with similar patterns at the front ends of the fractures. In the CO
2 fracturing, this phenomenon is even more pronounced. When comparing
Figure 6b and
Figure 6c the decrease in the principal stress difference results in a cumulative increase of 152.09% in the total length of the weak discontinuities that open up, with similar spatial distribution characteristics near the front end of the principal stress. The principal stress difference influences the structural connectivity of fracture networks. A smaller principal stress difference enhances branching complexity and increases the number of weak discontinuities, particularly in CO
2 fracturing, where this effect is more pronounced. The main direction of the weak discontinuity opening corresponds to the propagation of fractures in the direction of the minimum principal stress and the expansion of branching fractures. The findings of this study, in comparison to those of previous research, such as Zhu [
32] and Yu [
23], which utilized indoor experiments or numerical simulations, all converge on the conclusion that CO
2 effectively enhances the branching fractures and improve the SRV. However, there were limited parameters available to describe the intricacies of branching fractures in the past.
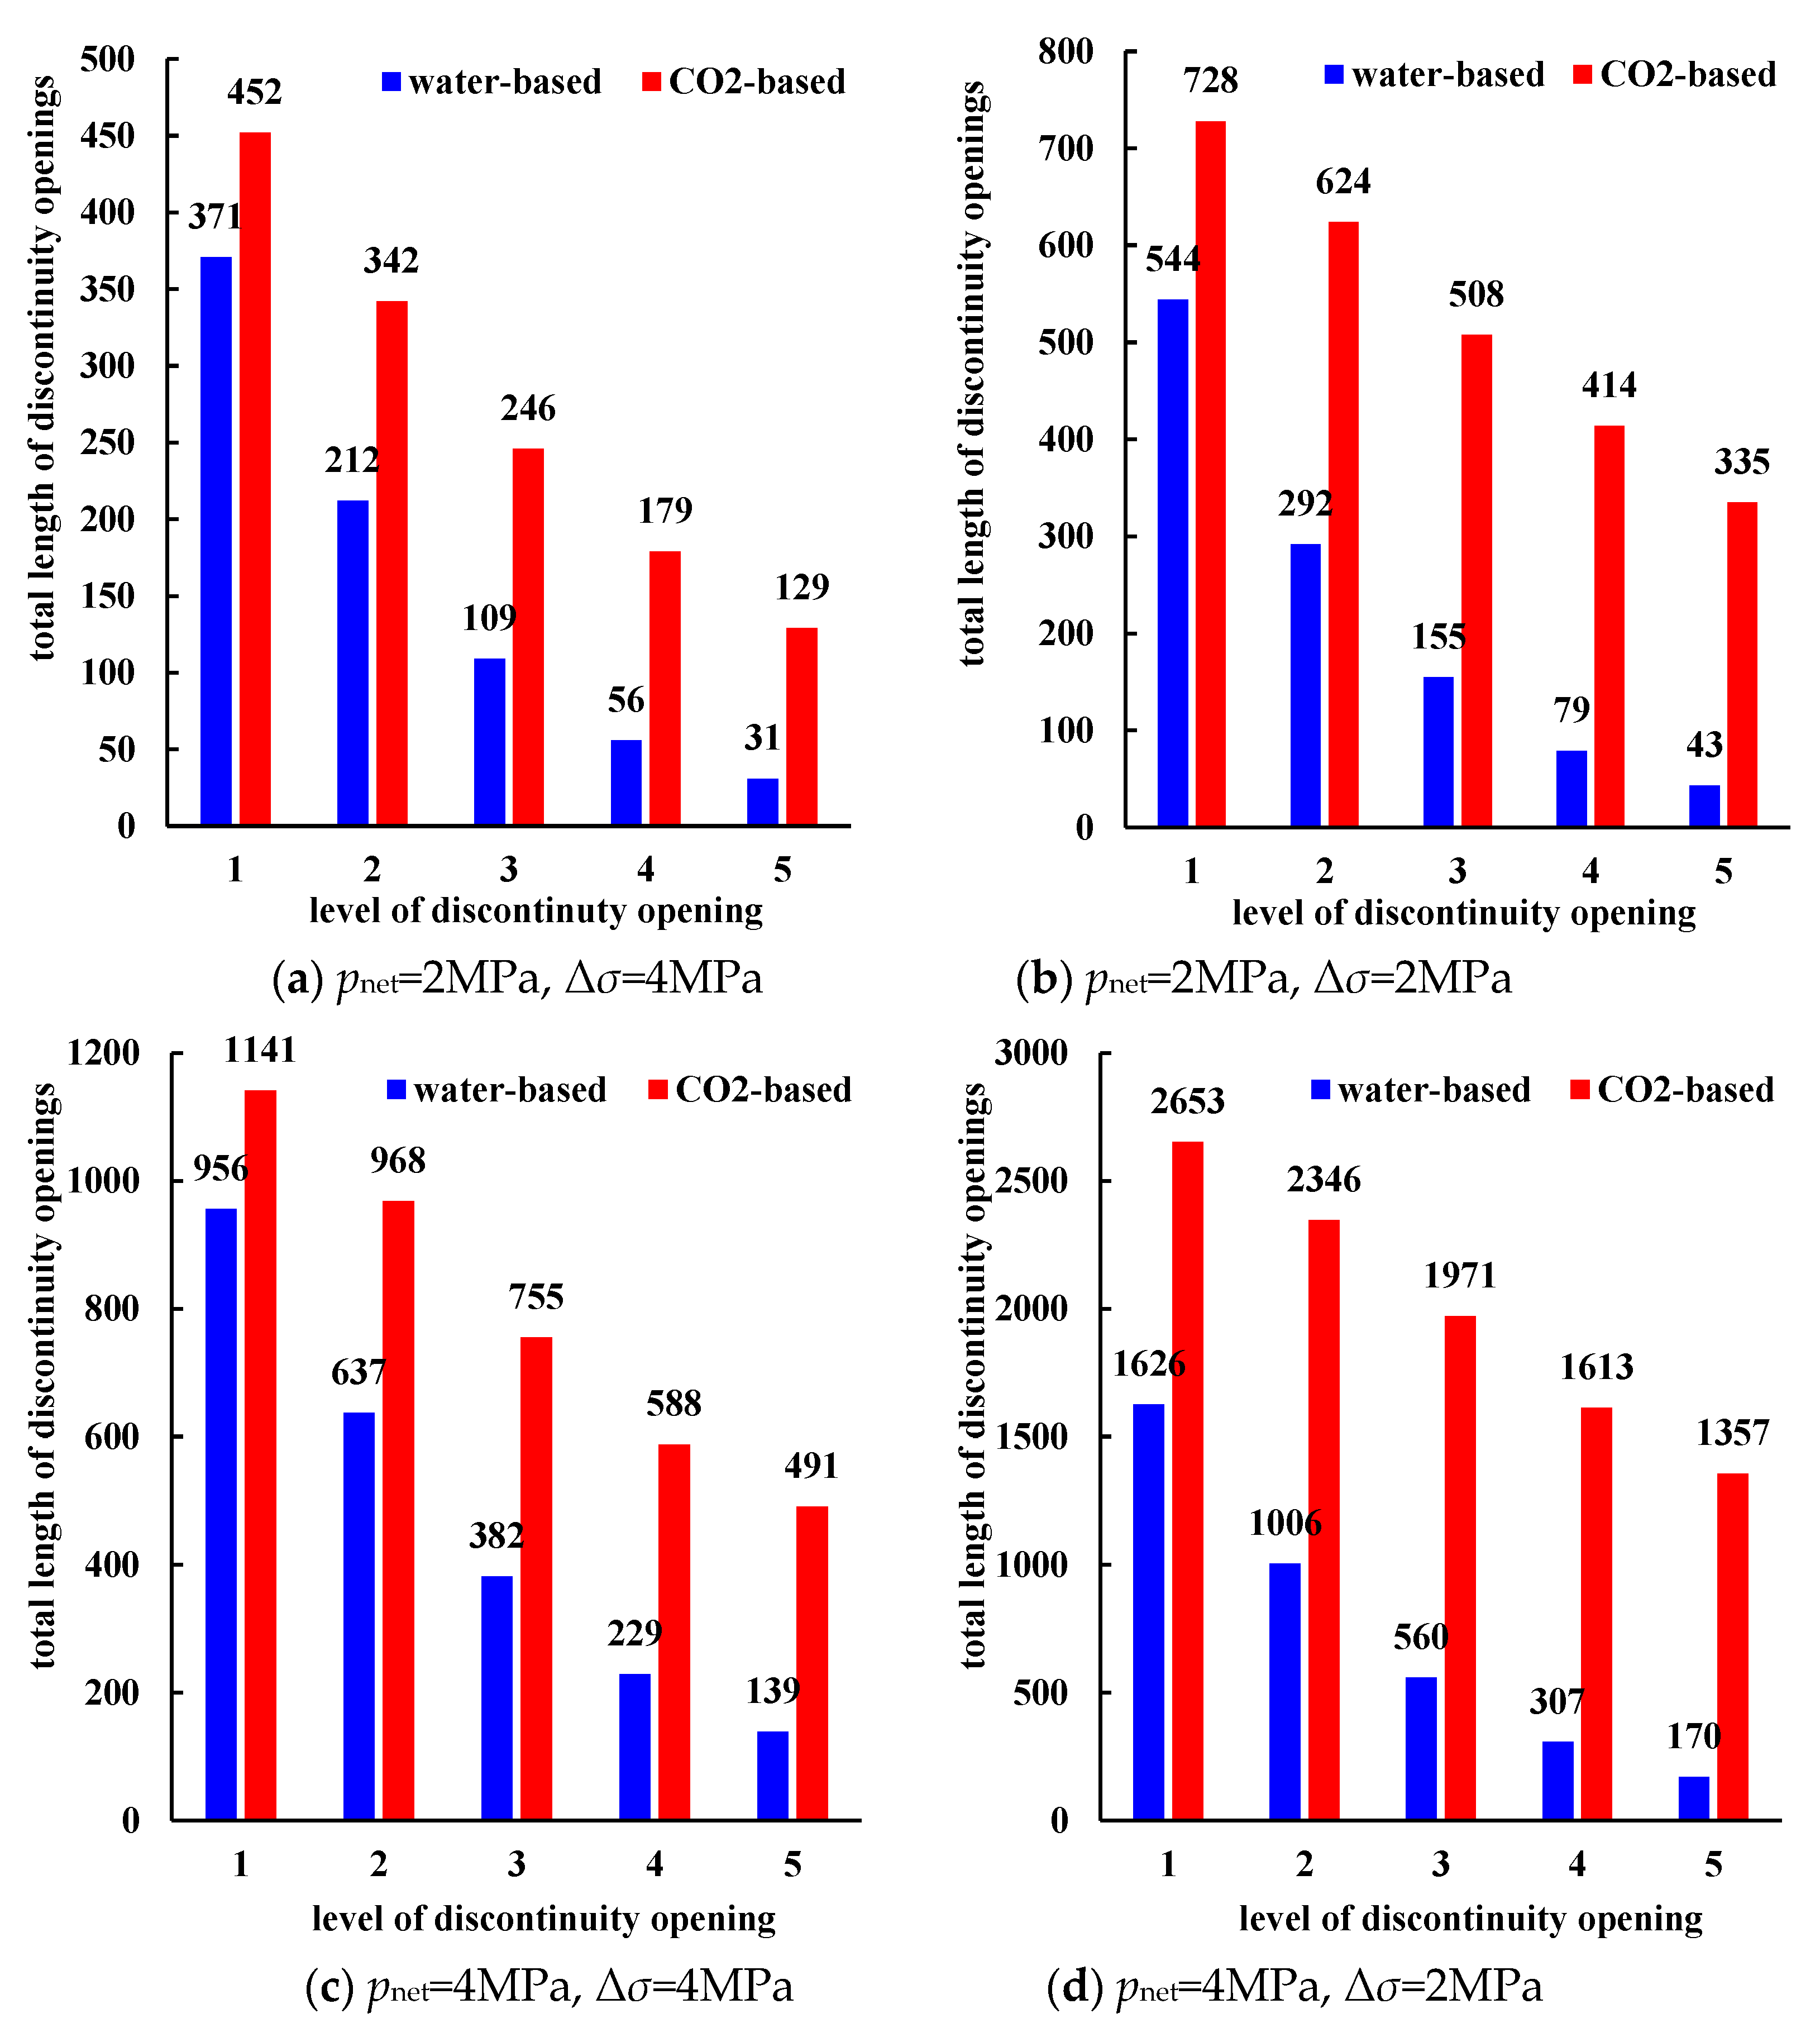
To compare the fracture initiation effects of different fracturing fluid types in tight reservoirs, an analysis of the initiation conditions of fractal fractures at various discontinuity levels was conducted, and a comparative chart of the total length of discontinuity initiated under the aforementioned fracturing conditions is illustrated in
Figure 7.
As shown in
Figure 7, when the net pressure within the fracture is 2 MPa, under water-based fracturing fluid conditions, the cumulative total lengths of the various weak discontinuities that open up with principal stress differences of 4 and 2 MPa are 779 and 1, 113 m, respectively. For the CO
2 fracturing, these values increase to 1, 348 and 2, 609 m, respectively. When the net pressure increases to 4 MPa, the values of the water-based fracturing increase to 2, 343 and 3, 699 m, and for the CO
2 fracturing, these values are 3, 943 and 9, 940 m, respectively. In the fractal fractures of the various levels that are opened, the proportion of the fractal fractures in the higher levels that are opened by CO
2-based fracturing fluid also increases significantly. Higher-level fractal fractures represent finer, shorter, and stronger discontinuities. As shown in
Figure 7a, under the same condition of 2 MPa
pnet and 4 MPa Δ
σ, after replacing the water-based fluid with CO
2 fracturing fluid, the total length of fractal fractures opened at levels 1 to 5 increases by 21.83%, 61.32%, 125.69%, 219.64%, and 316.13%, respectively. The fractal fractures that are opened here are not the weak discontinuities with fractal characteristics that appear inside the tight reservoir due to fracturing. Instead, they are the original weak discontinuities with the potential for opening and the fractal characteristics that are opened within the tight reservoir through fracturing. The essence lies in the fact that the conditions for opening higher-level fractal fractures, which are smaller-scale fractures, in CO
2 fracturing are lower, making them more susceptible to the influence of CO
2 fracturing fluid. As the fracturing conditions change, this value increases significantly under the 4 MPa
pnet and 2 MPa Δ
σ (
Figure 7d) condition with a higher number of fractures, with the total length of fractal fractures opened at levels 1 to 5 increasing by 63.16%, 113.20%, 251.96%, 425.40%, and 698.23%, respectively. Higher net pressure within the fractures provides conditions for the extension of lower-level fractures, and the increase in the length of the lower-level weak discontinuities in directions other than the main fracture direction enhances the degree of opening of the higher-level weak discontinuities, resulting in the formation of more secondary fractures. It is evident that CO
2 fracturing can effectively expand the fracture coverage range and increase fracture complexity by enhancing the opening degree of smaller-scale fractures. The simulation results are in good agreement with the formation of network fractures and the actual patterns observed during CO
2 fracturing.
The methodology developed in this study comprehensively considers the distinct roles of various branching weak discontinuities within tight reservoirs during the CO2 fracturing process. The weak discontinuities and their branching systems exhibit fractal self-similarity, rendering the generated weak discontinuity system more representative of actual geological conditions. This approach can be adjusted based on actual formation parameters, and its simulation methodology can be extended to the simulation of branching fractures under different pore and permeability conditions. However, key parameters and equations such as the weak discontinuity failure equation require corresponding adjustments based on specific reservoir types. Additionally, this model has certain limitations, such as the need to use a large number of rectangular grids for modeling results in slower simulation computation speeds; furthermore, the calculation of weak discontinuity failure conditions and the pressure drop formula within fractures are relatively simplified and lack support from laboratory experimental data. These aspects need to be gradually improved and enriched in subsequent research.


