Article

The 3D Multifractal Characteristics of Urban Morphology in Chinese Old Districts

by
Chenyang Zhang
,
Junyan Yang
*,
Xinzhe Liu
,
Dian Shao
,
Zhonghu Zhang
,
Zhihan Zhang
,
Haocheng Sun
,
Yuyue Huang
,
Daijun Chen
and
Xun Zhang
School of Architecture, Southeast University, Nanjing 210096, China
*
Author to whom correspondence should be addressed.
Fractal Fract. 2025, 9(3), 195; https://doi.org/10.3390/fractalfract9030195
Submission received: 15 December 2024 / Revised: 9 March 2025 / Accepted: 18 March 2025 / Published: 20 March 2025
(This article belongs to the Section Geometry)

Abstract

The compactness, diversity, and nested structures of the old districts in Chinese cities, in terms of their three-dimensional (3D) morphology, are particularly distinctive. However, existing multifractal measurement methods are insufficient in revealing these 3D structures. This paper introduces a 3D multifractal approach based on generalized dimension and Rényi entropy. In particular, a local indicator τq(h) is introduced for the analysis of the mapping of 3D units, with the Nanjing Old City serving as a case study. The results indicate the following: (1) The significant fractal characteristics of the Nanjing Old City, with a capacity dimension value of 2.344, indicating its limited 3D spatial occupancy. (2) The fluctuating generalized dimension spectrum ranges from 2.241 to 2.660, which differs from previous studies, suggesting that the 3D morphology does not exhibit typical multifractal characteristics. (3) The 3D map matrix reveals a fragmented open space system, a heterogeneous distribution of high-rise buildings, and cross-scale variations in morphological heterogeneity. This 3D multifractal method aids urban planners in assessing critical issues such as the fragmentation, crowding, and excessive heterogeneity of urban morphology, providing a spatial coordination and scaling of these issues through the 3D map matrix and enhancing the discussion of the broader mechanisms influencing morphological characteristics.

1. Introduction

Due to China’s unique land policies and their variations over different periods, as well as the relatively small area of urban construction land compared to the urban population, Chinese old districts exhibit a distinct characteristic of heterogeneity in their three-dimensional (3D) morphological collage [1,2,3]. In contrast to the relatively homogeneous and contiguous urban morphology of European and American cities [4,5], the compactness, diversity, and nested collage structures of Chinese old districts are particularly unique in terms of 3D morphology [6,7,8]. These characteristics are directly associated with urban morphological issues such as morphological disorder, texture fragmentation, and imbalances in spatial supply and demand [9,10], resulting from the combined effects of density, three-dimensional, and cross-scale characteristics [11,12], which are the sum of local and overall problems.
Moreover, various morphological elements exhibit distinct spatial qualities, functional carrying capacities, economic values, and energy consumption profiles. The spatial distribution patterns of these elements also impact a multitude of benefits, including transportation, ecology, and the urban wind environment [12,13]. Consequently, the 3D morphology of a city constitutes the spatial foundation of the urban system as a whole, with its characteristics indirectly exerting a broad influence on urban development. Among the more significant and academically noted impacts are the spatial differentiation of residential areas by social class, changes in rent differentials during urban renewal processes, the mix and layout of commercial formats, the choice of commuting transportation modes, the ecological network and landscape corridors, and the urban wind environment, along with building energy consumption [7,14,15,16,17,18]. However, the existing research primarily focuses on technical analyses of these specific impacts, rather than interpreting the essence of the urban 3D morphology. The morphological data employed often suffer from insufficient precision, such as that derived from artificial intelligence-based recognition of satellite imagery, or from an inadequate scope, such as analyses confined to the block scale [8,12]. More critically, the interaction between urban 3D morphology and the aforementioned influencing factors generally does not have a characteristic scale; for instance, the relationship between rent and urban morphology operates across scales “from individual building compartments to the entire city”. Therefore, analyses confined to a single unit scale fail to reveal the mechanisms that more closely mirror reality.
Therefore, it is necessary to develop a cross-scale research methodology to systematically measure the 3D morphological characteristics of old urban areas in China [19]. Fractal cities theory, known for explaining the composition and evolutionary processes of urban morphology [20,21,22], also provides a mathematical tool for measuring urban morphology that exhibits cross-scale characteristics [23,24].
Fractals are a concept introduced by Mandelbrot to describe a class of geometrical objects akin to the Peano and von Koch curves. According to Mandelbrot’s definition, a fractal is a shape that exhibits some form of similarity between its parts and the whole [25,26]. In terms of their growth processes, fractals can be primarily categorized into regular and irregular types [27]. Regular fractals, such as those depicted in Figure 1a, follow a consistent growth rule at each step, resulting in an orderly morphological pattern. In contrast, irregular fractals, exemplified by Brownian motion fractals, have growth rules at each step that are independent of the previous ones, often used to simulate naturally occurring forms like coastline (Figure 1c). Fractal cities represent an important branch of fractal theory research, with a unique characteristic: the growth process of cities as fractals lies between the two aforementioned types. Top-down planning interventions impose a degree of order, while bottom-up self-organizing processes introduce randomness [22]. This atypical growth process results in distinctive fractal features and poses certain challenges for their measurement (Figure 1b).
Distinguished by the topological dimension of their research data, existing studies on fractal cities can be categorized into 1D, 2D, and 3D. Characterized by the properties of fractal geometry, the fractal dimension exceeds the topological dimension, and the fractal dimension of urban 1D boundaries is also greater than 1, confirming that urban morphological boundaries belong to fractals with the characteristics of multiple folds and self-organizing evolutionary features [20]. Concurrently, extensive research has focused on the 2D characteristics of cities, utilizing area [22], line [28], and point [29] data within a 2D plane, as well as data combining 2D morphological attributes with additional property dimensions, such as population settlements combined with population numbers [30]. The fractal dimension of the 2D morphology of fractal cities is less than 2, signifying the fragmented and porous features of urban 2D morphology [22,31]. However, existing fractal urban research lacks sufficient use and analysis of 3D morphological data. Although a few studies have employed 3D morphological data to calculate fractal dimensions [19,32], they primarily treat them as an attribute of morphological units, rather than examining the urban 3D morphological system as a whole, using multifractal methods to assess its heterogeneity. Given that the measurement of the fractal dimensions of 2D urban morphology exhibits a high correlation with building density [5], the high fill rate of contemporary urban morphology on the plane limits the discovery of new characteristics through 2D data. The heterogeneity in height makes fractal research based on 3D morphological data imperative [33]; a necessity particularly evident in the study of the morphological characteristics of Chinese old districts.
In the aforementioned 2D and 2+D studies, the multifractal approach assumes distinct fractal dimensions for different urban areas, which aligns more closely with the actual characteristics of urban morphological systems, thereby revealing a greater array of morphological features [34]. However, the multifractal method also encounters limitations in terms of spatial mapping [35], resulting in the measured morphological features being challenging to correlate with specific spatial coordinates [36]. Specifically, the multifractal algorithm primarily relies on global indices such as the generalized dimension and local indices like the Lipschitz–Hölder exponent to reveal morphological characteristics. However, the term “local” in this context does not refer to spatial locality but rather to local variations in numerical values [24]. This means that both global and local indices are measurements of the urban morphology as a whole. Multifractal indices are governed by the order of moment q, which, in the computation of urban morphology, controls the influence of areas with different densities of morphological elements on the calculation outcomes [23,35]. Although multifractals possess a certain degree of spatial mapping ability compared to the capacity dimension, they can only generically associate fractal characteristics with areas of different densities (indeed, areas of different densities in Chinese old districts are nested across scales and cannot be clearly demarcated by density) [7,9]. This approach sacrifices information about spatial coordinates. When applying the multifractal method to the analysis of 3D morphological data, this deficiency becomes even more pronounced. Since most spaces above the ground level are inaccessible to the public [33], the assessment of the overall crowding or sparseness of the morphological system lacks practical significance.
Addressing the practical issues of urban morphology in Chinese old districts and the technological development trajectory of fractal cities, this paper constructs a multifractal measurement and visualization analysis method oriented towards urban 3D morphology. This method is applied in a case study of the high-density, homogeneous 2D, and heterogeneous 3D morphology of the Nanjing Old City. The contributions of this study are primarily reflected in the following three aspects:
(1) Expanding the foundational data for fractal cities research by utilizing refined 3D morphological data and constructing a multifractal computational approach based on cross-scale 3D units, elucidating the morphological implications of capacity dimension, information dimension, correlation dimension, and the generalized dimension spectrum.
(2) Addressing the inadequate mapping capabilities of the multifractal method, this study constructs a local index τq(h) designed to describe the density characteristics of cross-scale 3D units under the control of the order of moment q. This index is developed based on the mapping relationship between Rényi entropy and 3D units, thereby enhancing the multifractal method’s capabilities for 3D visualized spatial analysis.
(3) Revealing the 3D heterogeneity characteristics of the morphological structure in Chinese old districts, expanding the typological research of fractal cities, and analyzing the functional, transportation, and scenic mechanisms that contribute to these characteristics.

2. Materials and Methods
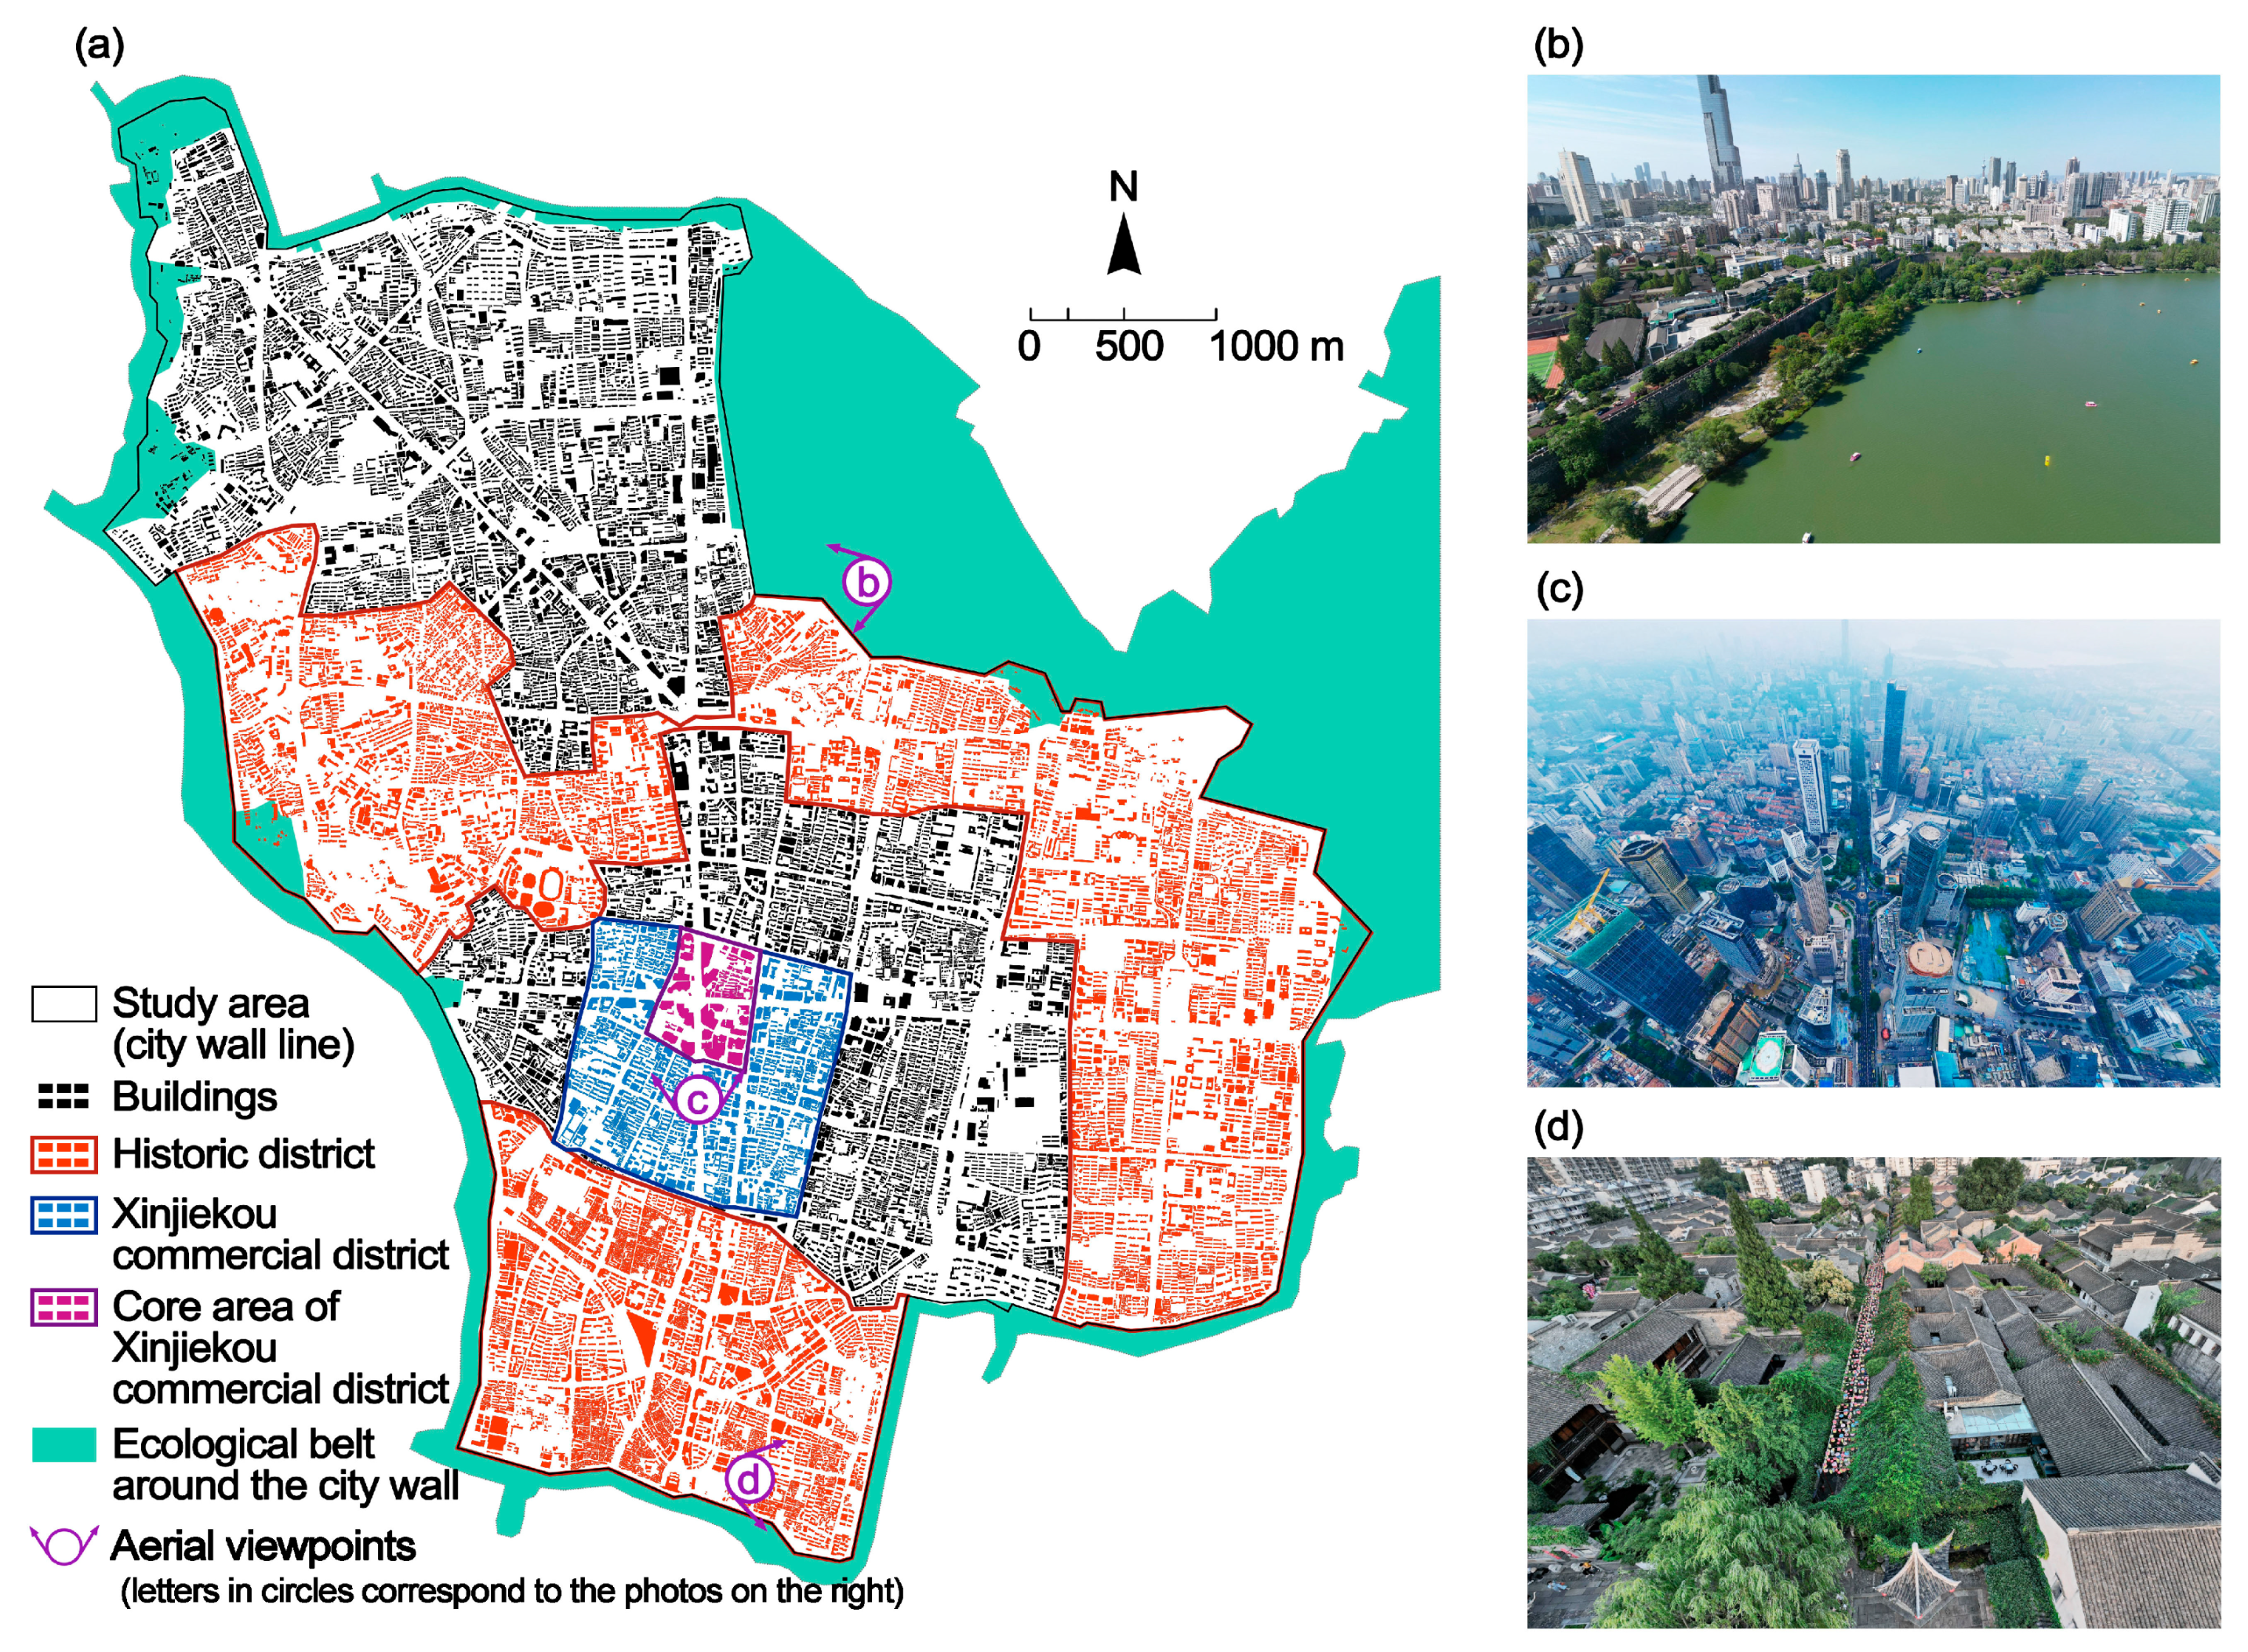
2.1. Study Area

The Nanjing Old City is a typical representation of Chinese old districts (Figure 2a). It boasts a long history, with its boundaries having been established more than six hundred years ago as the city walls of a Chinese capital (Figure 2b). Currently, within the bounds of the Nanjing Old City lies the largest business district in China—the Xinjiekou commercial district (Figure 2c). Throughout its long and dramatically changing history, the Nanjing Old City has developed a highly heterogeneous 3D morphology [37], encompassing both low-rise, finely fragmented historic district patterns (Figure 2d) and large-volume, skyscraper-dominated urban block forms [23,38].
The Nanjing Old City is more representative of the modernization process in old districts compared to the other two more prominent Chinese cities: Shanghai, which is not an ancient capital and lacks extensive city walls; and Beijing—although it has been the capital since the Yuan Dynasty, its similar walls have long since disappeared in the wake of modern urban development, leaving only scattered remnants [11]. In contrast, the Nanjing Old City boasts remarkably intact wall boundaries, with the area within the walls subject to unique morphological control policies [37]. Similar to Nanjing, Suzhou also possesses a large historic district; however, Suzhou has implemented stricter morphological height control policies, prohibiting high-rise buildings within the historic district and its visual corridors, thus its heterogeneity in 3D morphology is not pronounced [39]. In contrast, Nanjing has adopted a more flexible policy, resulting in a proliferation of skyscrapers within its historic district.
It is worth noting that the Nanjing Old City is surrounded by an ecological green belt inside and outside the city walls (Figure 2a), which form a complete and broad area of sparse construction outside the boundaries (Figure 2b). Therefore, although studying data within irregular boundaries using a grid system may produce errors due to the inclusion of data from outside the area, the presence of the ecological belt means that such errors are minimal.

2.2. Data Source

The study is bounded by the ancient city walls of Nanjing, with a research area of 41.56 km2. The 3D morphological data referred to in this study pertain to building massing data, a prevalent data type. The raw data source for this study is from OpenStreetMap “https://www.openstreetmap.org/” (accessed on 1 March 2021). To fulfill the data requirements for high-precision 3D morphological research, the heights of building masses were verified through on-site observations, and their planar contours were cross-checked using Amap Satellite Imagery “https://www.amap.com/” (accessed on 7 August 2021), with these verifications updated to 2021. The complete dataset used in the research includes 20,069 building massing data entries.

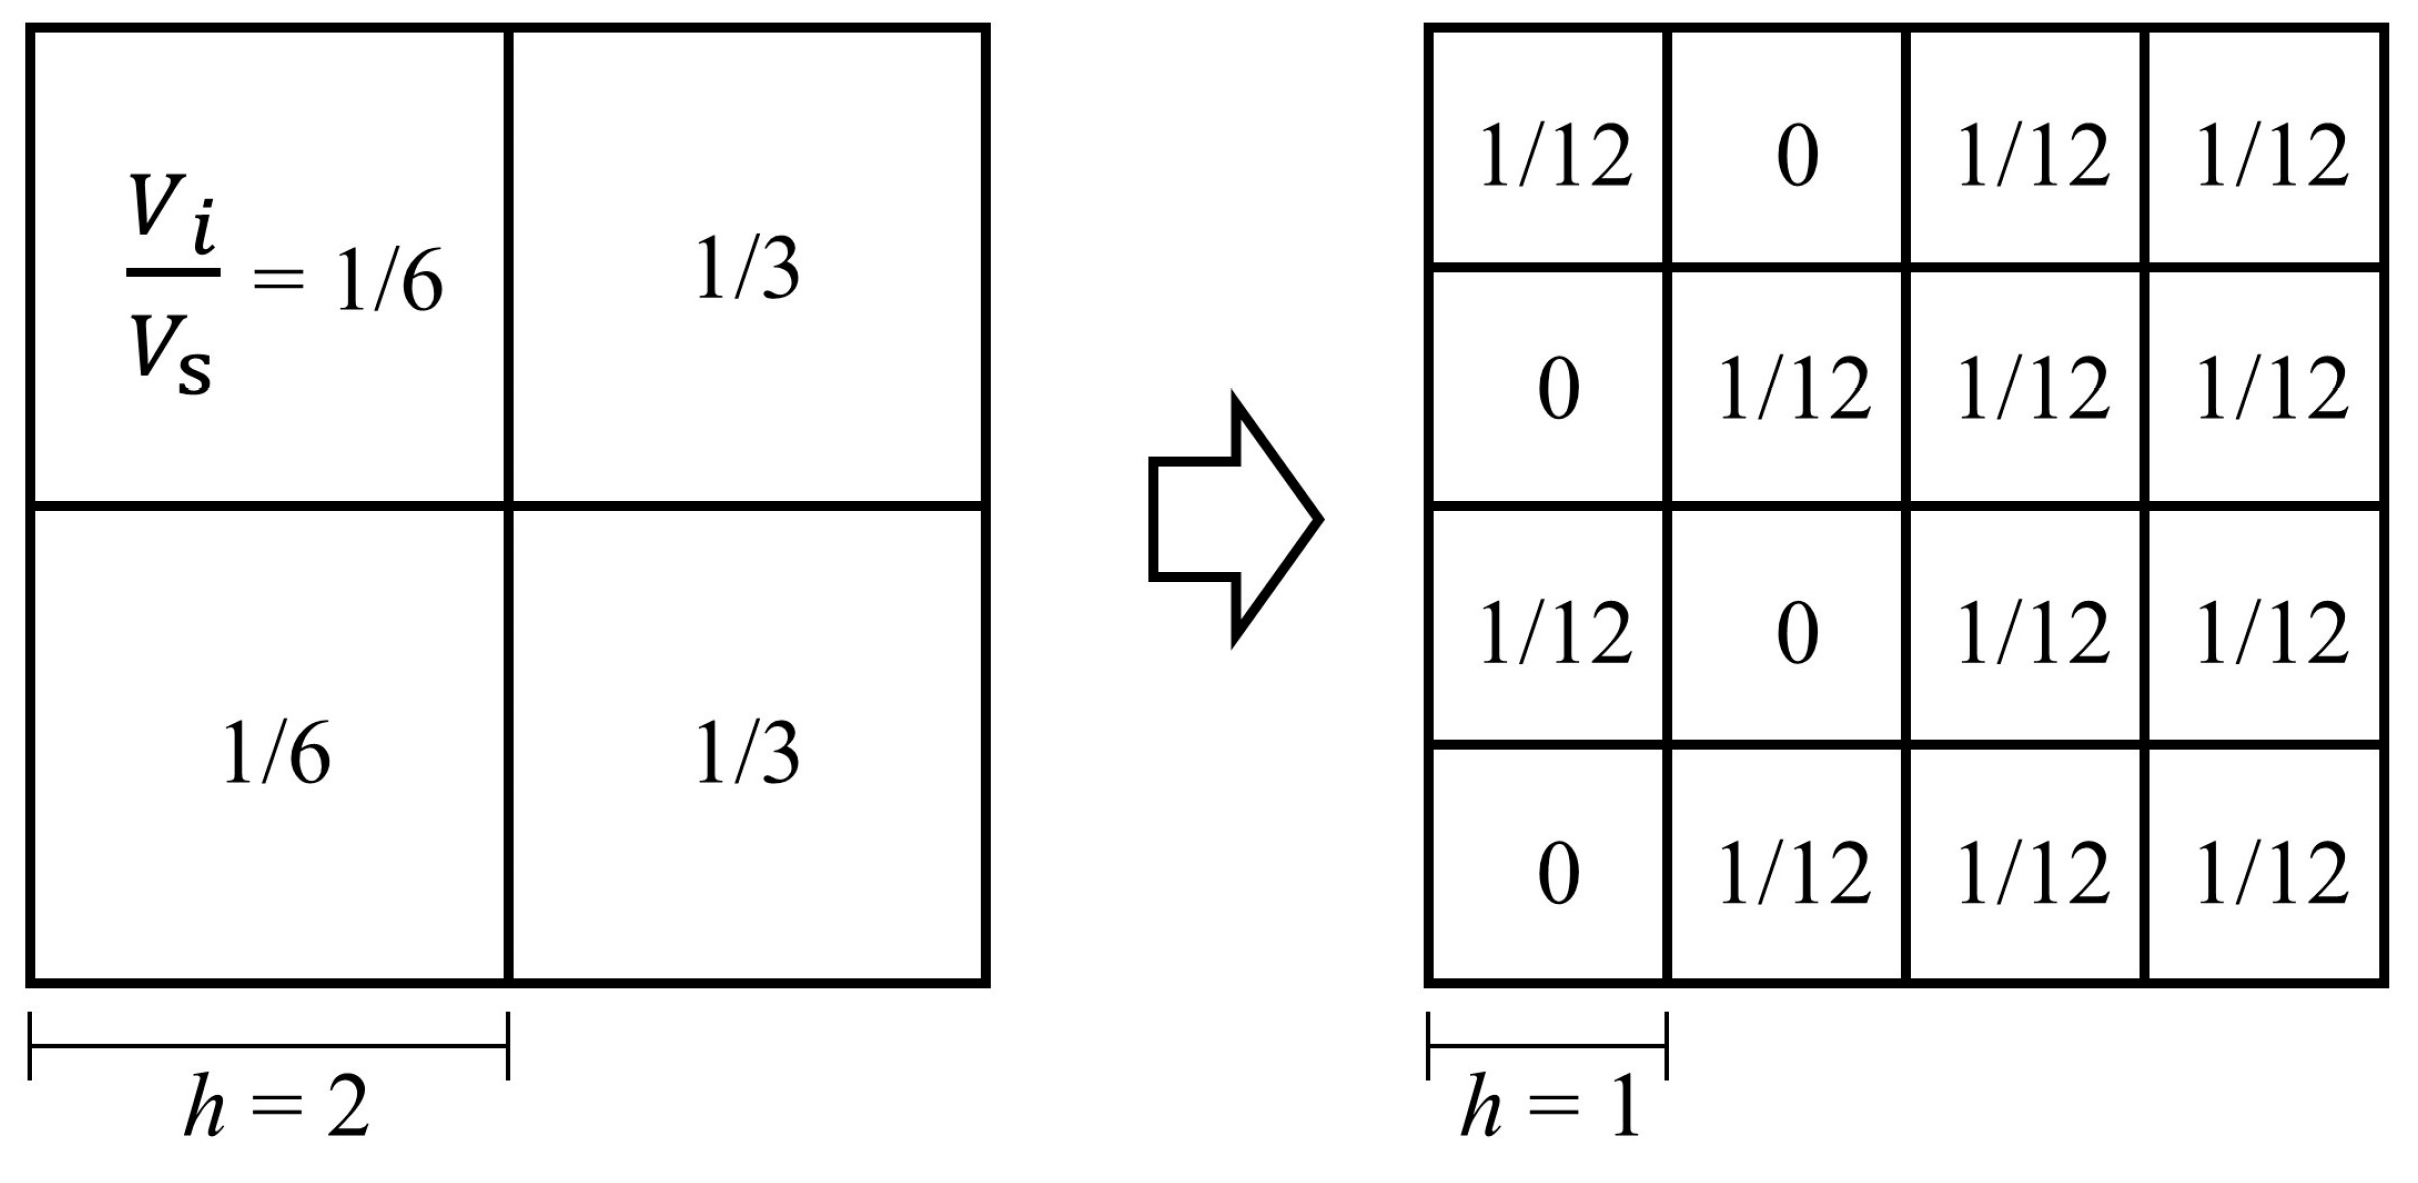
2.3. Cross-Scale 3D Units

To establish a mapping relationship between the measurement results and morphological localities, the box-counting method is used as the data processing foundation for the multifractal algorithm [34]. In this study, the boxes are constructed as cross-scale 3D units through an equal division method [36]. Since urban morphology is not a fractal that can be iterated infinitely in the mathematical sense, but rather such morphologies have their specific scaling intervals where they exhibit fractal characteristics and scale invariance, the size of the 3D units needs to be calculated with a reasonable sequence of scales.
Firstly, the building masses within the study area are completely covered by the smallest cubic box, with an east–west length x of 8513.2 m, a north–south length y of 9836.5 m, and a height h of 339.0 m (the maximum building height). Since the building height data are obtained by multiplying the number of floors by the average floor height of 3.0 m, in order to align the building data with the 3D units in the vertical direction, multiples of 3.0 m are used as the base for the height changes of the cubic boxes, resulting in a sequence of height changes of 1.5 m, 3.0 m, 6.0 m, 12.0 m, 24.0 m. Dividing 339.0 m by the sequence and rounding up to encompass all the building data yields the single-dimensional equidivisions e: 226, 113, 57, 29, 15. Applying this sequence to equidivide the lengths in the east–west and north–south directions of the study area results in all the 3D units. The total number of 3D units, N′, is then counted. Subsequently, the 3D units containing building data, N, are filtered and counted (Table 1).

2.4. Multifractal Feature Verification Method

A large number of studies have confirmed that urban 2D morphology has very significant fractal or multifractal features [34,35], but whether urban 3D morphology has significant or typical multifractal features still needs further exploration.
A fractal is a geometric body with a large amount of detail at the microscale. The smaller the units used to measure the fractal, the more total information should be measured, and there should be a power–law relationship between the size of the fractal units and the amount of information within all the units. Therefore, if the urban 3D morphology is a strict multifractal, it should satisfy the following formula [27]:
i = 1 N V i V s q h h s 1 q D q = 1
where Vi is the total volume of buildings in the 3D unit i, Vs is the total volume of all buildings within the study area, h is the height of the 3D unit, hs is the total height of the study area, q is the moment order, and Dq is the generalized dimension. If the urban 3D morphology is a strict multifractal, when the value of q remains constant and is an integer, measuring the urban morphology with 3D units of different h values within the scaling range, the Dq value remains constant. If the Dq value remains unchanged even when the value of q varies, then the urban morphology is a special case within multifractals, namely a monofractal.
By introducing Rényi entropy to transform Formula (1), since the moment order q changes the weight of three-dimensional units with different morphological densities in the formula calculation, Rényi entropy can be understood as the entropy value of regions with different morphological densities [40]:
I q h = D q ln h + b = ln i = 1 N V i V s q 1 q ,   ( q 1 ) i = 1 N V i V s ln V i V s , ( q = 1 )
where b is the intercept of the linear function. When q = 1, Rényi entropy is equivalent to Shannon information entropy.
Therefore, the question of whether the urban 3D morphology is a multifractal is converted into a linear correlation issue of Iq(h) and lnh. When the linear correlation index R2 is closer to 1, the fractal characteristics are more significant under the calculation condition of the moment order q. If R2 is close to 1 for all values of q, then the urban 3D morphology is a significant and typical multifractal.

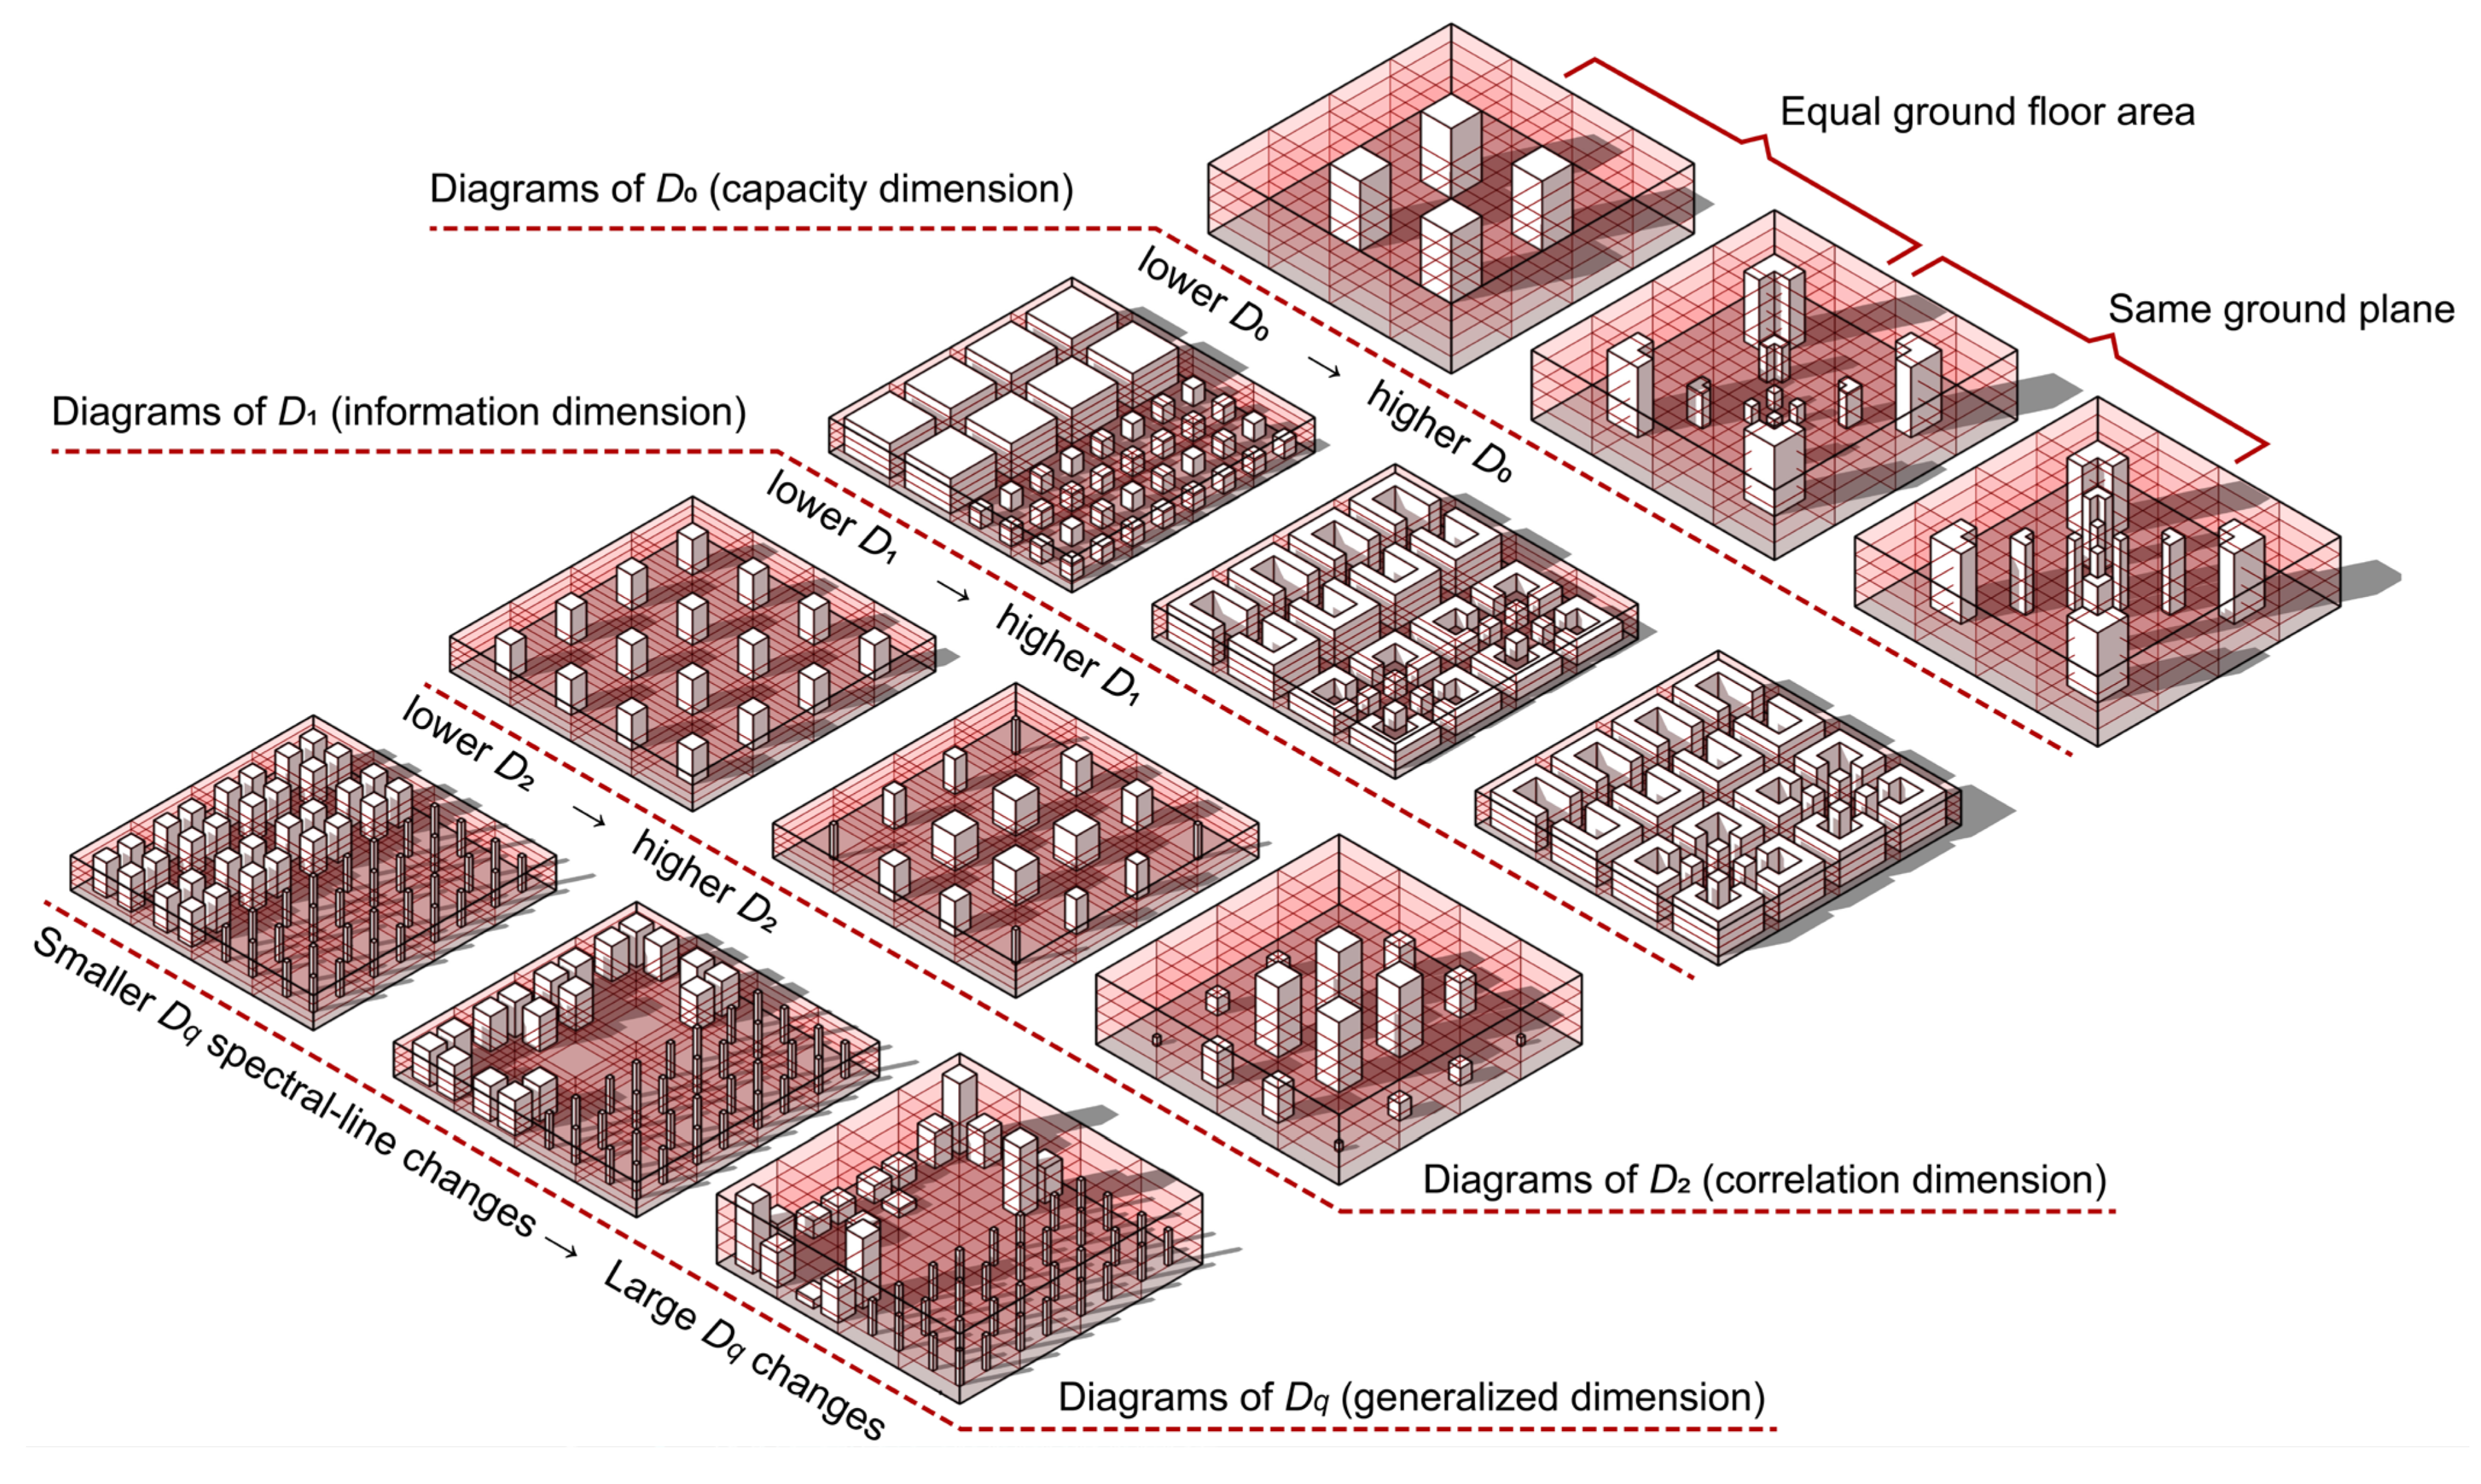
2.5. Multifractal Measurement and Its Morphological Implications

If the linear correlation coefficient R2 between Iq(h) and lnh is close to 1, then Dq can be approximately calculated using the following formula:
D q I q ( h ) ln h
Since the values of Dq and their variations are too abstract, it is difficult to correspond them to the complex 3D characteristics of urban morphology. Therefore, it is necessary to interpret the key values and variation characteristics morphologically (Figure 3).
When q = 0, Dq is the capacity dimension D0. D0 is independent of the probability of the occurrence of building data in the 3D units and is only related to the presence or absence of building data in the 3D units. D0 is the indicator used in most fractal studies and reflects the occupation of space by urban morphology. The 2D capacity dimension can reveal differences in morphological systems with the same base area but different building plans; the more fragmented the building plan, the more fully it occupies space, and the larger the D0 value. The 3D capacity dimension can further reveal differences in the height level of buildings; for morphological systems with the same building plan, the more uniform the height, the larger the D0 value.
When q = 1, Dq is the information dimension D1. D1 takes into account the probability distribution of building data in each 3D unit. For 3D building forms of the same volume, the more evenly distributed they are, the larger the D1 value. The information dimension is usually related to the diversity in morphology; the larger the information dimension, the more thorough the mixing of forms, and the more interaction opportunities and combination types it can provide.
When q = 2, Dq is the correlation dimension D2. D2 amplifies the influence of morphological areas with a high development intensity on the dimension calculation. Therefore, the higher the aggregation of the urban 3D morphology, the larger the D2 value.
Observing the spectrum of q-Dq reflects the overall change characteristics from the lowest development intensity areas (q → −∞) to the highest development intensity areas (q → ∞). For morphological systems with homogeneous structures (e.g., Figure 3, row 4, column 1), the q-Dq spectrum is a horizontal line. For morphological systems with 2D planar heterogeneity (e.g., Figure 3, row 4, column 2), the q-Dq spectrum is usually a monotonically decreasing curve in an inverse S shape. For morphological systems with 3D volumetric heterogeneity (e.g., Figure 3, row 4, column 3), the q-Dq spectrum is the focus of this paper’s investigation. Theoretically, its variation should be more than that of existing studies.

2.6. Map Matrix Based on 3D Units Mapping

The indicators and spectrum of multifractal measures are primarily used for the global analysis of morphological systems. In order to further localize the measurement results to specific spatial locations, a map matrix method based on the mapping of 3D units is constructed [41]. Each 3D unit is assigned a value τq(h) according to the calculation process of Rényi entropy Iq(h). Then, these values are represented by different colors based on the magnitude of τq(h), thereby revealing the contribution mechanism of the 3D units to the multifractal measurement results. The calculation formula for τq(h) is as follows:
τ q h = V i V s q ,   ( q 1 ) 1 V i V s V i ¯ V s , ( q = 1 )
where V i ¯ is the average value of Vi.
The values of τq(h) are visualized using the building massing data from the Nanjing Old City (Figure 4). The scale of the 3D units can be altered by adjusting the value of h. When q = 0, τq(h) reflects the mere presence of building data within the 3D units. When q < 0, τq(h) increases as the building volume within the 3D units decreases, and as the value of q decreases, the 3D units with the smallest building volume contribute more significantly to the higher values of the Rényi entropy Iq(h). Conversely, when q > 0, the trend is opposite to that of q < 0. A special case occurs at q = 1, where 3D units with an average volume exhibit the highest τq(h), while larger or smaller volumes result in a lower τq(h). It is evident that τq(h) is a cross-scale indicator of building volume density, with its significance lying in its association with the computation of Rényi entropy Iq(h).
In the measurement of the Nanjing Old City, q and h constitute a 4 × 4 τq(h) numerical matrix, where q takes the values with typical morphological implications of −1, 0, 1, 2, while h takes 24 m, 12 m, 6 m, 3 m. By writing code in Python 3.10 (Supplementary Materials), the τq(h) values are visualized in the form of a 3D bar chart, thus creating the map matrix. The Pandas 2.2.3 library is used for data reading and processing, loading data from csv files, and performing operations and segmentation on data frames. The NumPy 2.0.0 library is used for numerical calculations, determining the matrix size, and processing arrays. The Matplotlib 3.9.1 library is used for drawing graphics, including 3D graphics and color mappings. In particular, the mpl_toolkits.mplot3d module is used to support 3D plotting, and ListedColormap is used to create a custom color map.

3. Results

3.1. Measurement Results of Multifractal Indicators

The linear correlation index R2 between I0(h) and lnh is 1.000, indicating that the 3D urban morphology of the Nanjing Old City exhibits extremely significant fractal characteristics (Figure 5). This very high degree of correlation is relatively rare in previous studies, proving that the 3D morphology of the Nanjing Old City has developed a complete fractal structure as a whole. This fractal structure is more mature and self-organizing than the fractal characteristics revealed by existing studies on 2D morphological data such as land use, population, and lighting. Meanwhile, the value of D0 is 2.344, which is less than the embedding dimension and topological dimension of the 3D morphological data and greater than the embedding dimension of the 2D morphological data. The relatively small value in the reasonable range indicates the sparsity of the Nanjing Old City urban morphology in the 3D embedding space, meaning that the form has insufficient filling capacity.
To further analyze the multifractal structure of the urban morphology, the important dimensions D−1, D1, D2, and the convergence limit values of Dq are calculated. The results show that Iq(h) decreases monotonically with q, which is consistent with the expectations of existing studies [42]. When q ≥ 0, the linear correlation index R2 between I0(h) and ln h is close to 1.000, with only a slight decrease to 0.999 when q = 30, proving the maturity of the fractal structure in dense areas of building masses, with only minor imperfections in the densest areas. When q < 0, R2 decreases rapidly, indicating that the sparse areas of building masses do not possess significant fractal structure characteristics; moreover, the lnh-I30(h) function appears as a convex polyline, which means that as the scale of the study increases, the rate of decrease of the Rényi entropy is faster. This implies that at small scales, there are a large number of regions with sparse building masses, while at large scales, these sparse regions disappear in large numbers due to mixing with dense regions.

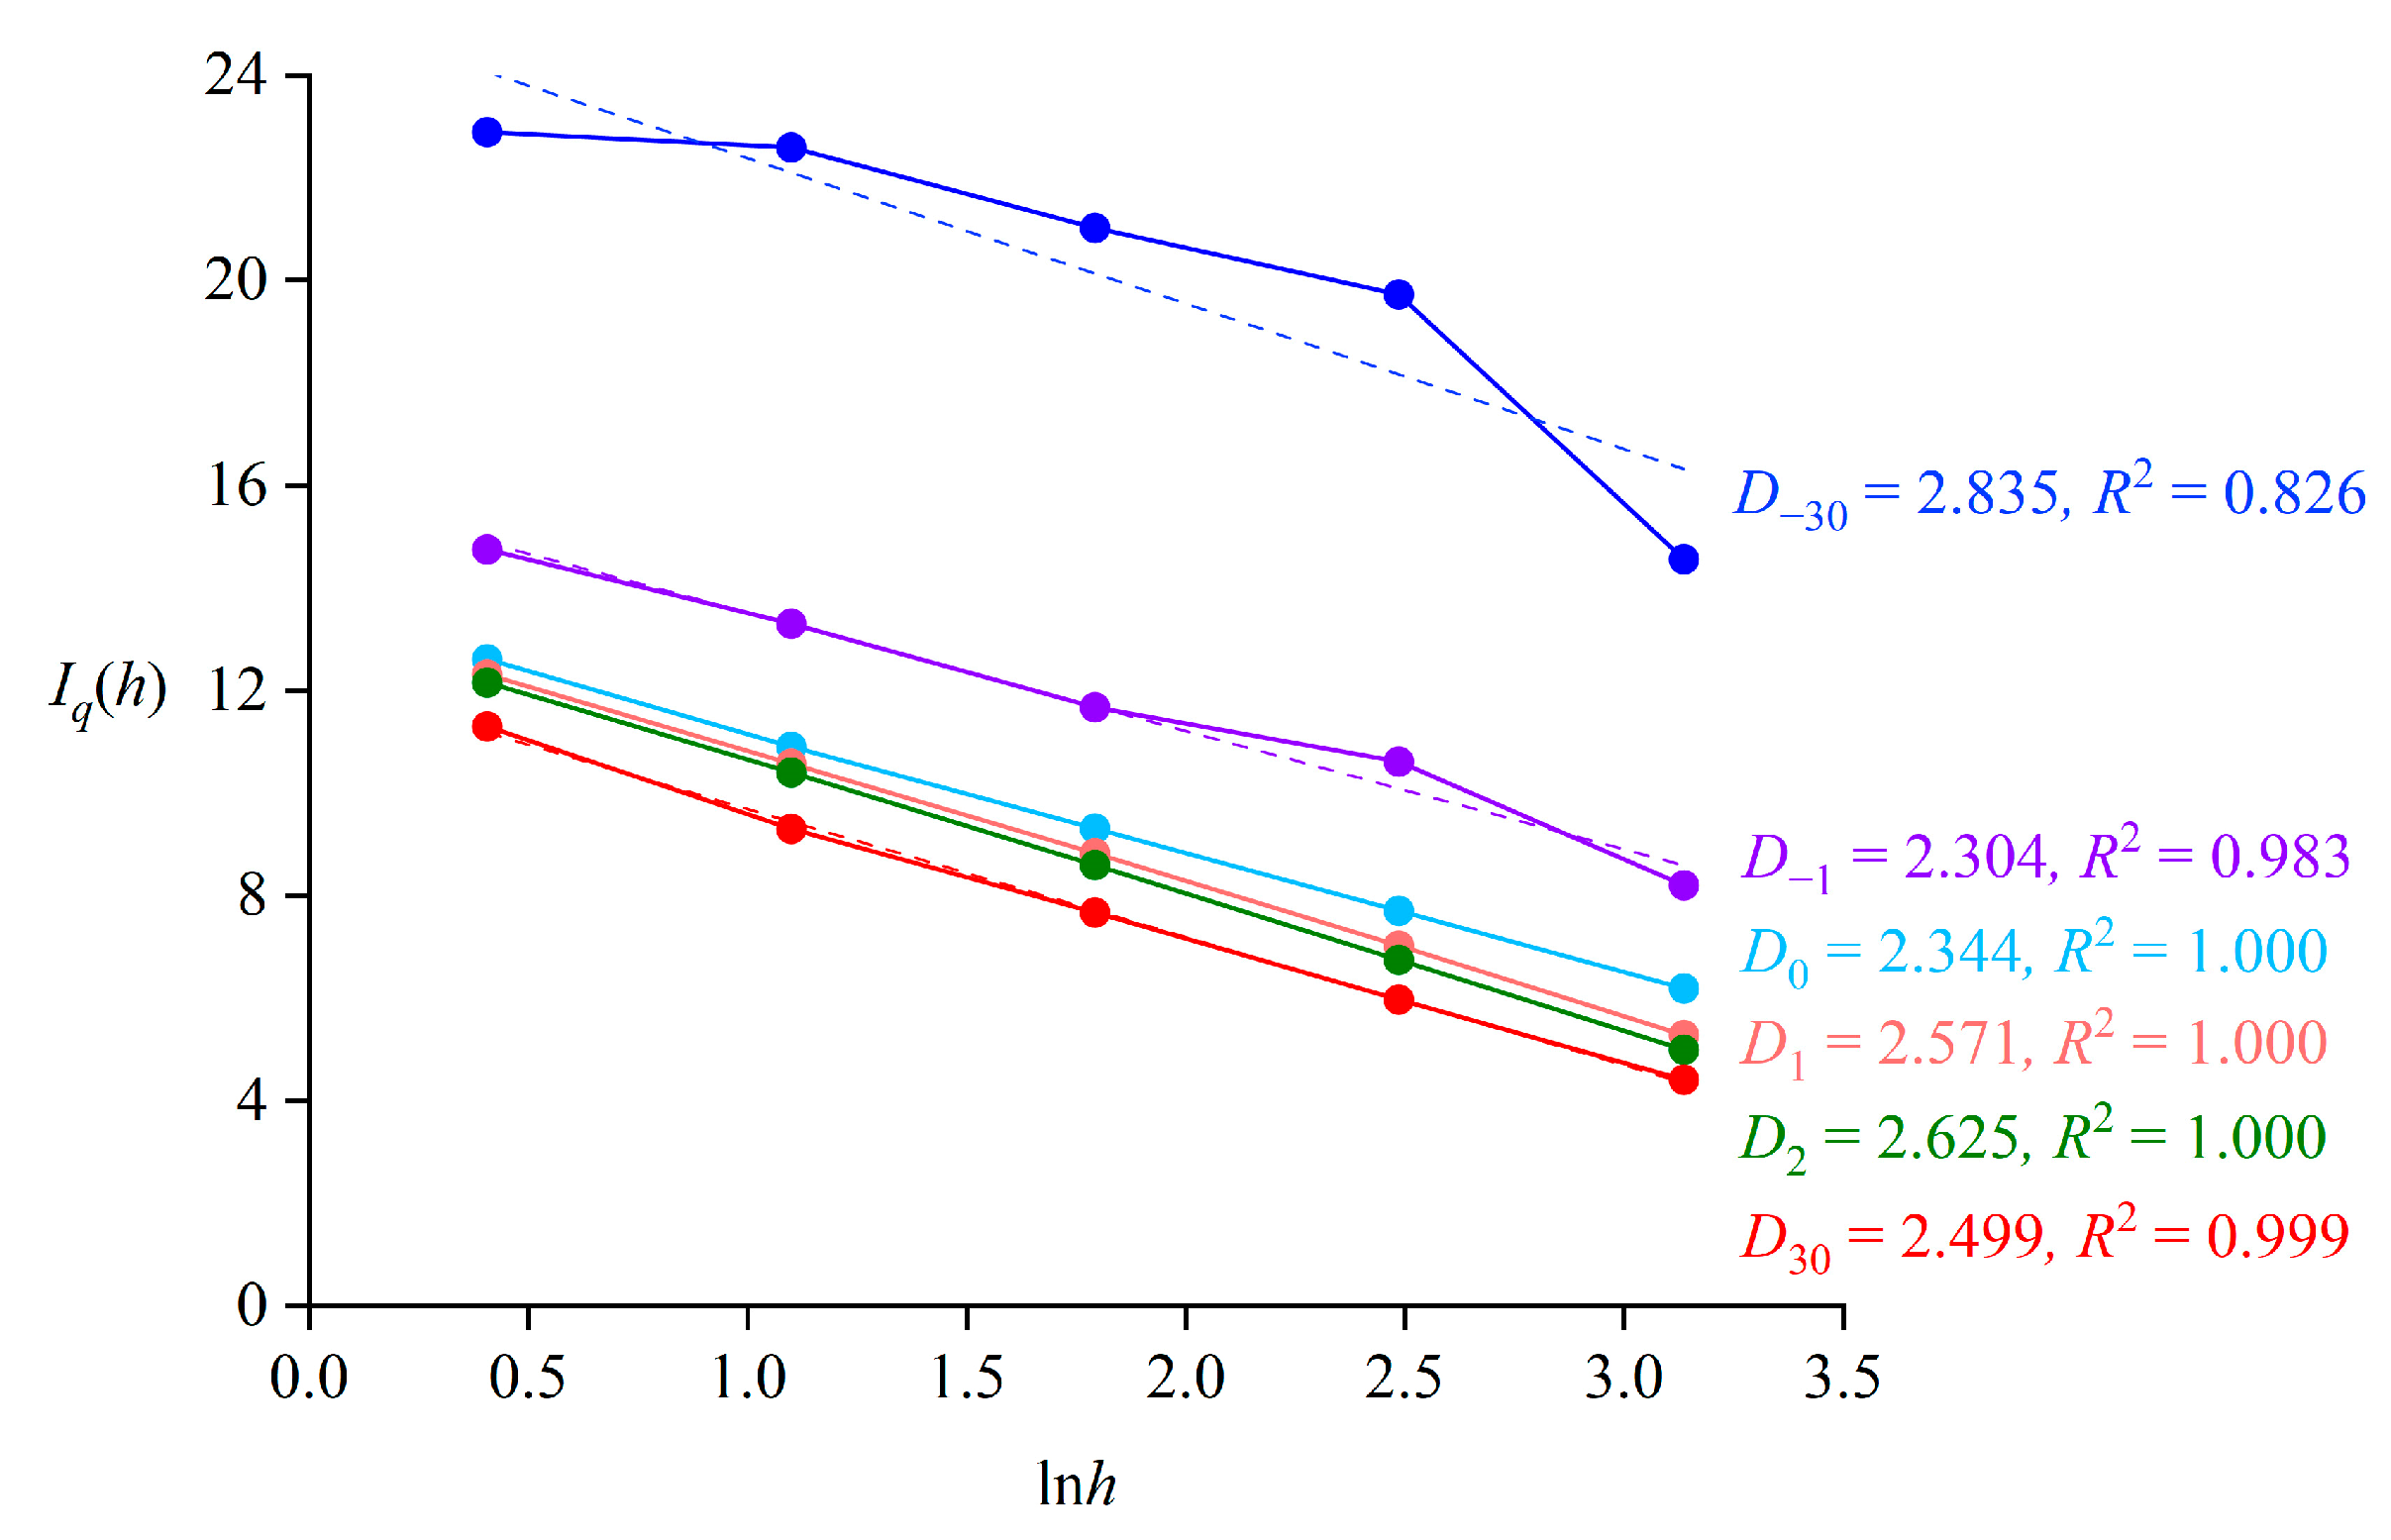
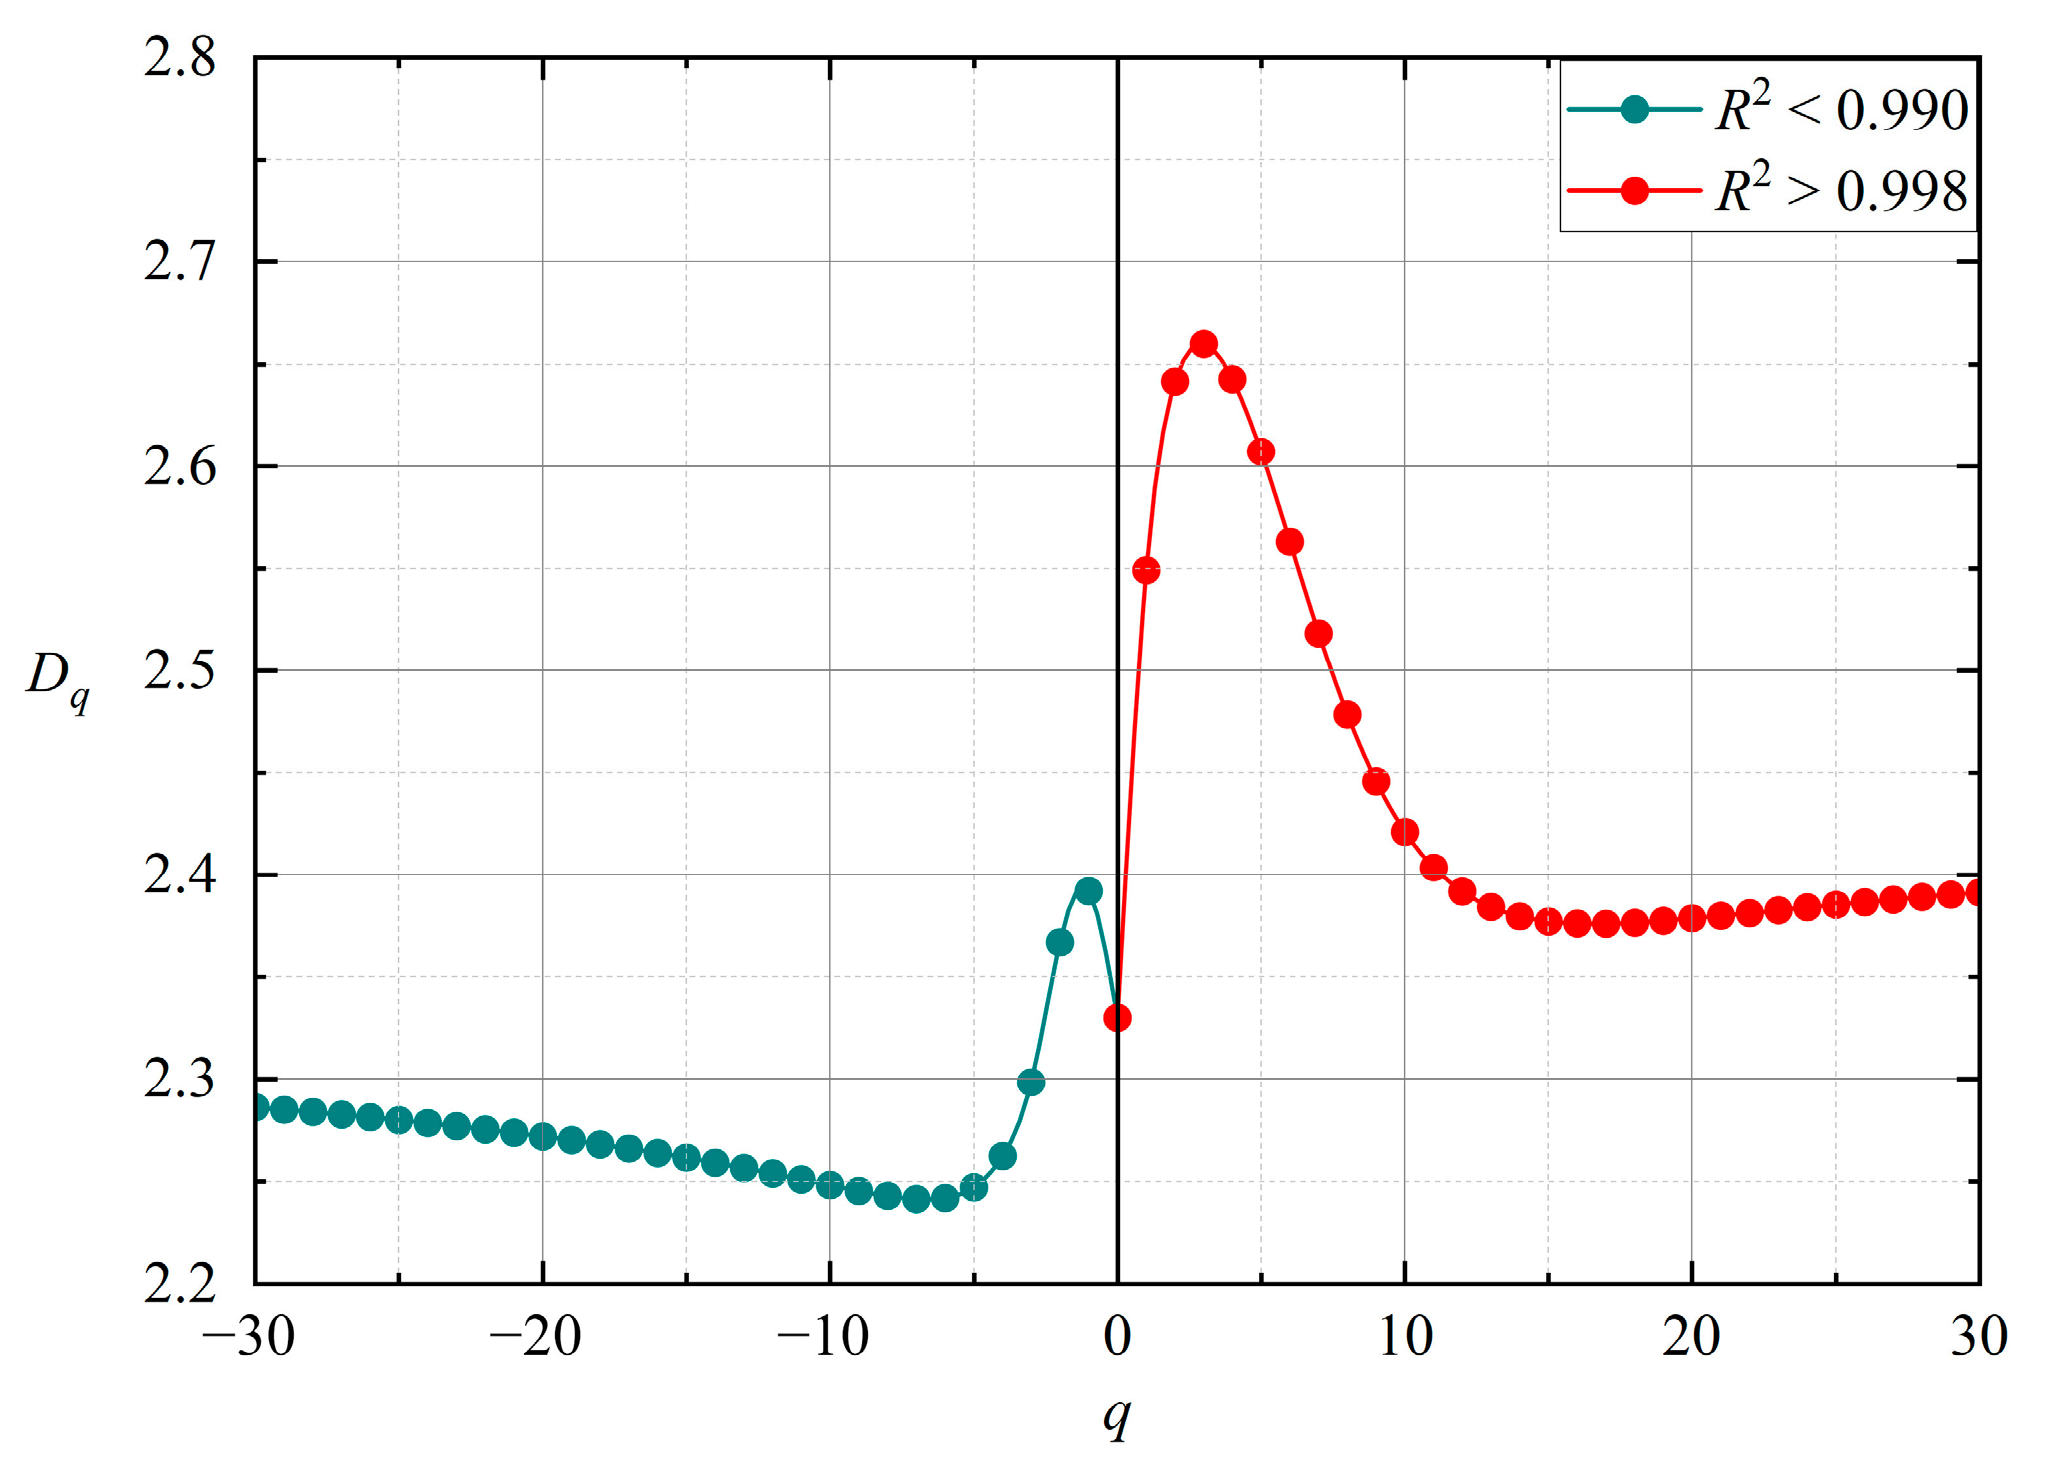
3.2. The Analysis of the Generalized Dimension Spectrum

Figure 5 illustrates that the slopes of all lines between the second and third points are relatively close to the overall slope. Consequently, the corresponding values of h, 3.0 m and 6.0 m, are selected as the calculation scales for the Rényi entropy to obtain the generalized dimension spectrum of q-Dq (Figure 6), which exhibits the following characteristics:
(1) The Dq values range from 2.241 to 2.660, not exceeding the embedding dimension of 3, with a moderate overall fluctuation amplitude. The minimum value occurs at q = −7, and the maximum value at q = 3.
(2) The most significant inflection point in the q-Dq spectrum appears at q = 0, where the D0 value is significantly lower than the expected R2 value at q = 0 for other data. Since D0 is the only dimension value that does not consider the distribution probability of building masses within the unit, it indicates a spatial misalignment between the dense areas of building masses and the areas where building masses exist.
(3) For q ≥ 0, the q-Dq spectrum exhibits a fluctuation pattern of first increasing and then decreasing, suggesting that the fractal structure of the relatively dense areas of building masses is well developed (more mature than the overall fractal structure), whereas the fractal characteristics of the densest areas of building masses are somewhat weakened.
(4) For q < 0, R2 values are all below 0.990, indicating significant disruption of the fractal structure; when −7 ≤ q ≤ −1, the q-Dq spectrum also shows an abnormal rising curve, further confirming the fragmented characteristics of the fractal structure in the sparse areas of building masses.

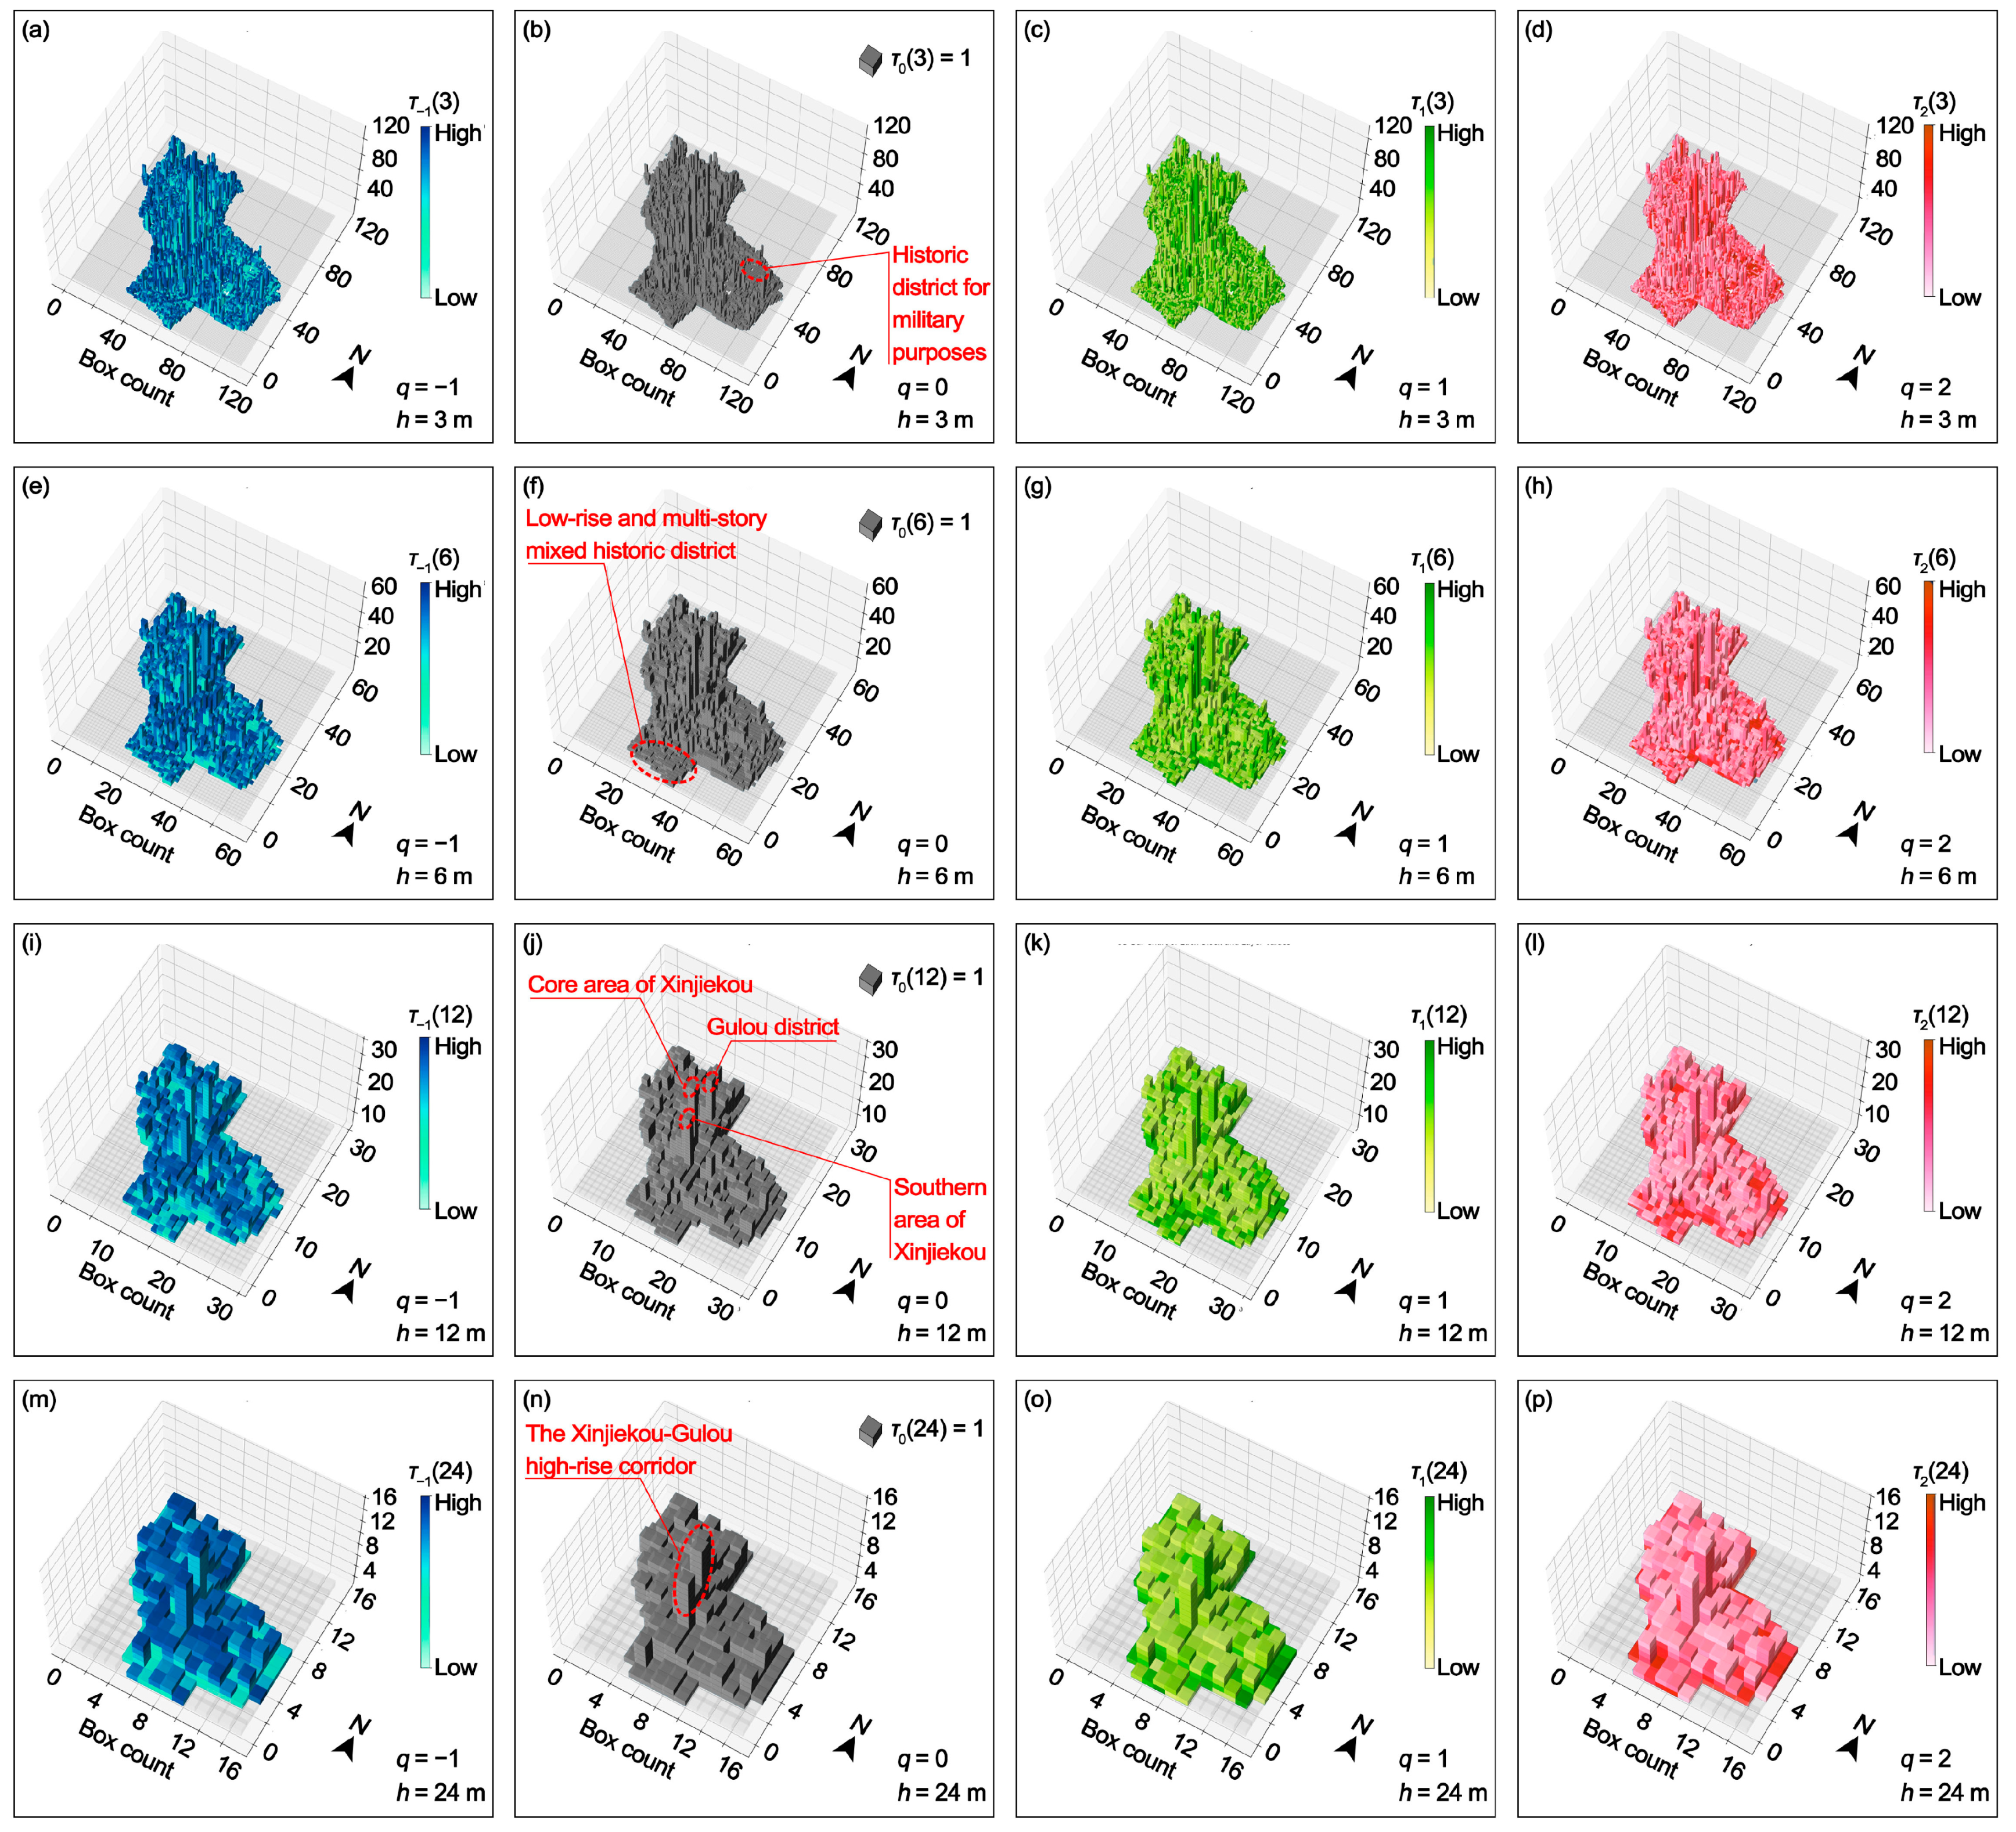
3.3. The Analysis of the 3D Map Matrix

The 3D map matrix further reveals local characteristics across scales and the urban morphological structure composed of these complex local features. The morphological structure characteristics reflected in Figure 7 include the following:
(1) A crowded ground-level urban morphology and the absence of a full-scale structure of open spaces. Even at smaller unit scales, the building masses of the Nanjing Old City occupy nearly the entire ground level of the study area. From a 3D perspective, the few morphological voids are obscured by 3D units of varying heights (Figure 7a). At the ground level, 3D units with sparse building masses are mainly distributed in areas near the city walls, forming a discontinuous annular-like structure. More 3D units with sparse building masses are distributed at the irregular top of the morphological system, indicating insufficient spatial occupation by the urban morphology at non-ground levels (Figure 7a,e,i,m).
(2) A cross-scale differentiation structure of morphological height. As the research units shrink, the height of the urban morphology significantly differentiates. A high-rise corridor extending from Xinjiekou to Gulou is observed at h = 24 m (Figure 7n); at h = 12 m, this corridor differentiates into three relatively independent high-rise areas, the southern area of Xinjiekou, the core area of Xinjiekou, and the Gulou area, while other areas differentiate into a patchwork of high and low morphological features (Figure 7j); at h = 6 m and h = 3 m, numerous high-rise areas appear as local protrusions, and continuous shorter morphological areas emerge in some localities, such as the mixed historical district of southern low-rise and multi-story buildings (Figure 7f) and the flat, low-rise morphological area for military purposes on the northeastern side (Figure 7b). Notably, there are also many high-rise buildings within the designated historical area of the Nanjing Old City, indicating that the distribution of high-rise buildings has not been managed according to zoning regulations.
(3) Large-scale unit density differentiation and small-scale local mixing and agglomeration. The third column of the 3D map matrix represents the variation characteristics of the unit τ1(h) values, where darker-colored units indicate a morphological density closer to the mean; it is evident that at a large scale, the density differentiation is such that most units have a morphological density that is either too high or too low, with very few units close to the mean (Figure 7o). However, as the research scale decreases, the proportion of units close to the mean density increases rapidly (Figure 7c,g,k), which is also confirmed by the maximum rise in the q-Dq spectrum within the range of 0 ≤ q ≤ 1 (Figure 6). This indicates that at small scales, the phenomenon of the uniform mixing of units is quite significant. Morphological agglomeration units form a continuous structure at the ground level (less obvious due to occlusion in the figure), and at each research scale, the distribution of agglomeration units at the ground level is relatively balanced, with a smooth transition between high and low agglomeration areas, showing no obvious heterogeneity (Figure 7d,h,p). Moreover, as the research scale decreases, morphological agglomeration units also begin to appear in non-ground-level areas, and this increment could be a major factor for the continued rise in the q-Dq spectrum within the interval of 1 ≤ q ≤ 3 (Figure 6).

4. Discussion

4.1. Fluctuation Changes of the Generalized Dimension Spectrum

A large number of studies on the multifractality of urban 2D morphology have shown that the generalized dimension q-Dq is monotonically decreasing [31,43]. Some studies even suggest that the capacity dimension is greater than the information dimension, which can serve as a preliminary criterion for determining whether the urban morphology exhibits multifractal characteristics [44]. The q-Dq spectrum typically manifests as a smooth, inverse-S-shaped curve. Theoretically, for 2D morphologies, Dq values fall within the range of 1 to 2, while for 3D morphologies, they are expected within the range of 2 to 3. Deviations from this range indicate the presence of disorder characteristics in the corresponding element density intervals of the urban morphology, thereby signifying a lack of the cross-scale self-similarity typical of fractal structures (Figure 8).
However, this study obtained a fluctuating spectrum, and it is believed that this spectral difference arises from the improvement in the precision of the research data and the unique 3D structure of urban morphology. The correlation R2 of Dq is low when q < 0; this indicates defects in the fractal structure of the sparsely morphological regions or a deviation from the fractal structure, showing more complex and difficult to quantify morphological characteristics [45]. But when q ≥ 0, the correlation R2 of Dq is very close to 1, indicating significant and credible fractal characteristics.
Theoretically, the information dimension D1 can be greater than the capacity dimension D0, as long as its distribution at small scales is more uniform than at large scales. Taking Figure 9 as an example, according to Formula (2) and (3), its capacity dimension is
D 0 = I 0 2 I 0 1 ln 2 ln 1 = ln 1 × 4 ln 1 × 12 ln 2 ln 1 1.585
The corresponding information dimension is
D 1 = I 1 2 I 1 1 ln 2 ln 1 = 2 × 1 3 ln 1 3 2 × 1 6 ln 1 6 12 × 1 12 ln 1 12 ln 2 ln 1 1.667
It can be seen that for the sample in Figure 9, D1 > D0. For the 3D morphology of the Nanjing Old City, where D1 > D0, this reflects that at finer scales, the urban 3D morphology becomes more homogenized. It is simple building elements organized in complex ways that form the complex overall morphology.

4.2. The Dimensional Relationship Between 3D and 2D

The capacity dimension D0 of 3D urban morphology is constrained by the 2D plan of buildings, as the form of buildings is subject to gravitational limitations, with their vertical cross-sectional area generally converging upwards, except for a small number of overhanging structures. Therefore, theoretically, for a given urban 2D building plan, the maximum capacity dimension D0 in 3D should occur when all buildings are of the same height. According to Viczek’s calculation approach [27], if the capacity dimension of the 2D form data is DII0 and the maximum capacity dimension of the 3D is DIII0, the calculation formulas are
D   0 = ln n ln ε
D 0 = ln ε n ln ε = ln ε + ln n ln ε = 1 + ln n ln ε = 1 + D   0
where ε represents the number of division units in each dimension, and n is the number of units with morphological data (Figure 10). Therefore,
D 0 D 0 = 1 + D   0
Using the same method as this study to calculate the 2D building plan in the Nanjing Old City, the obtained capacity dimension DII0 is 1.873. Previous research has employed methods such as diffusion-limited aggregation to simulate the fractal growth process of urban morphology, which have confirmed that the theoretical capacity dimension for 2D morphologies is approximately 1.71 [20,46,47]. Among these, Batty’s calculation yielded a range of 1.676 to 1.726, which suggests that urban 2D morphology is neither excessively dense nor overly sparse [47], thus the 2D building plan of the Nanjing Old City is obviously very crowded.
According to Formula (8), the upper limit value of the capacity dimension of the 3D morphological data of the Nanjing Old City is 2.873, and its actual calculated value is 2.344, which shows a significant gap from the upper limit, proving the heterogeneity in height.
However, the generalized dimension Dq is not applicable to Formula (8). Increasing the height of high-density plane areas can enhance the contribution of high-density areas to the calculation results, so when q > 0, the Dq value rises rapidly; conversely, when q < 0, the Dq value also rises rapidly. Therefore, the Dq spectrum in 3D can exhibit more variations than the Dq spectrum in 2D. The special spectrum shown in Figure 6 can also be understood as the high-density areas being relatively high-rise building areas at the same time, which is why the spectrum line shows an abnormal rise when 0 ≤ q ≤ 3.

4.3. Growth Mechanism of 3D Morphological Structure

The urban 3D morphology, subject to more constraints than the 2D morphology, is not only influenced by the aforementioned gravitational limitations but also driven by functional development, pedestrian traffic, and ecological landscapes. Consequently, this leads to characteristics such as insufficient morphological filling and heterogeneous building heights.
(1) Localized functional mixing mechanism. Chinese old districts have a long history of cellular development, forming relatively complete functional mixed units within established structural frameworks [7]; this system was strengthened during the socialist period, resulting in compound development units with comprehensive production functions and supporting services [3]. This localized functional mixing characteristic creates morphological heterogeneity between units, especially under the influence of special planning policies [48], leading to a full mix of low-rise administrative, military, and historically protected buildings with modern high-rise buildings in the Nanjing Old City. This is an important reason for the distinct morphological differences between Chinese old districts and those in Europe and America. Concurrently, there should also be variations among different Chinese old districts. The existing research suggests that these differences are primarily manifested as a north–south divide in Chinese cities. Southern Chinese cities, including Nanjing, have been more driven by self-organized market forces, whereas northern cities, with a greater direct influence from policy, exhibit more pronounced differences from European and American cities [8,36]. As a representative of Northern Chinese cities, Beijing exhibits a ring-shaped morphological layout comprising the old city, newly built areas, and a fringe belt. Within the old city, the plots are the smallest, with the highest degrees of functional mixing and heterogeneity. However, following the “relocation of non-capital functions” after 2014, a significant number of administrative functions were moved out of the old city, reducing its functional diversity and leading to a trend of homogenization [49]. In terms of the hierarchical characteristics of urban morphology, Beijing shows a deficiency in the organic character of block boundaries, as well as heterogeneity within the blocks [11]. It is evident that Beijing and Nanjing, as representatives of Northern and Southern Chinese cities, respectively, despite having different fractal values under existing comparative studies, share a similar localized functional mixing mechanism that shapes their 3D morphological structures.
(2) Brand value-dominated super-tall building distribution mechanism. The business formats carried by super-tall buildings generally have a high brand value, such as globally chained brand hotels. The existing research indicates that the location of these formats in the central city does not have a significant coordination and relevance with the characteristics of the urban road network [50]. This is because the business formats of super-tall buildings themselves have a strong attraction for public use, leading to their concentration predominantly in the central urban areas, without exhibiting any specific distribution patterns within these centers. Nanjing is a typical single-centered city where the economic, demographic, and cultural focal points are all located within the Nanjing Old City [18]. In contrast to a multi-centered city like Shanghai, the distribution of high-rise buildings in Nanjing Old City demonstrates characteristics of single-center concentration and insufficient 3D filling. The existing research indicates that multi-centered cities exhibit higher filling rates, whereas single-centered cities demonstrate under-filling in peripheral areas, a phenomenon confirmed by this study [17]. Additionally, transect analysis reveals that the urban morphology development of Shanghai presents a multi-centered, wave-like pattern, resulting in fractal characteristics of greater diversity, fragmentation, and configurational complexity when compared to the Nanjing Old City [51,52].
(3) Homogeneous networked landscape penetration mechanism. Using existing or historically present ecological landscape elements (such as lakes, rivers, hills) within old districts to construct an open space system has proven to be an optimization path with low resistance and strong resilience [53]. Due to the expansive area generally enclosed by the ancient city walls in China, a significant portion of the land within was left vacant or used for agriculture for considerable periods [54]. For instance, Pingyao, an ancient commercial city renowned for its well-preserved historical urban area, has a city wall perimeter of 6.2 km, and agricultural activities persisted within its walls until modern times [4,55]. Similarly, the Nanjing Old City, constructed as the capital during the Ming Dynasty, boasts an even larger wall perimeter (35.3 km). Following the Ming Empire’s relocation of the capital to Beijing, the development momentum of Nanjing Old City waned, resulting in many areas remaining as undeveloped green spaces and waterways for an extended duration [37]. However, after the establishment of the capital of the Republic of China in Nanjing in 1927, the city underwent a new phase of rapid development. Nearly a century of construction has led to the current ecological landscape system, which consists merely of small rivers, road greenery, and scattered parks. Meanwhile, the process of building sprawl and the cutting effect of the traffic network further fragment the landscape system of the old city, forming a networked pattern that penetrates from the ring green belt inward. The existing research has shown that ring green belts play a role in curbing the planar sprawl of urban forms, thereby promoting their height increase and morphological differentiation in the third dimension [56].

4.4. Urban Morphological Development Suggestions for Chinese Old Districts

The deficiencies in the 3D morphology of the Nanjing Old City can exert a detrimental impact on urban sustainability [7]. The fragmented system of open spaces precludes the development of high-grade landscape greenery, resulting in numerous micro-green spaces within reach, yet these fail to deliver robust landscape and ecological services [c]. The heterogeneous distribution of high-rise structures leads to the erosion of the old city’s character, with modern high-rise buildings awkwardly juxtaposed against historical low-rise architecture, undermining the city’s historical identity [45]. Additionally, excessive local mixing and agglomeration at a small scale intensify traffic pressures and lead to an imbalance in the distribution of spatial resources [18].
Based on this study, this paper proposes the following suggestions.
(1) The expansion of the old districts’ morphology in 2D is nearly at its limit and should be selectively contracted to ensure the integrity of the open space system. There is still space for the old districts’ morphology to expand in the third dimension. To develop a more regularized urban 3D morphology, planning interventions should be made in the distribution of super-tall buildings, optimizing the incremental layout of high-rise clusters rather than isolated island layouts and appropriately integrating them with the pedestrian traffic network. This can alleviate development intensity at the ground level and facilitate the business development and space utilization of super-tall buildings [33].
(2) To improve the morphological issue of inharmonious combinations of high-rise and low-rise buildings and to form a more organic 3D skyline, multiple functional development centers should be cultivated, fully leveraging the advantages of mixed land use. Particular emphasis should be placed on nurturing secondary central areas beyond Xinjiekou, as a multi-centered development pattern has been demonstrated to be conducive to the creation of a diverse and organically integrated 3D morphology [17]. This contributes to the generation of an urban morphology that utilizes 3D space more efficiently [18].
(3) To facilitate the above optimization process, a mixed and multi-centered functional layout is needed, along with a dense and multi-layered pedestrian network and a high-grade open space system that penetrates inward, relying on the ring green belt, while implementing a land use strategy for mixed green spaces [57]. The concept of “Informal Ruralization” in the central urban area is emerging as a novel solution in China [58]. Establishing urban farms in the Nanjing Old City, particularly on the rooftops of large buildings [16], through spontaneous civic participation could effectively address the issue of the insufficient integration of buildings and green spaces [57], while also promoting energy conservation.

4.5. Limitations and Future Studies

This study is subject to limitations in data sourcing, visualization, and computation. In terms of data, the large-scale, high-precision building morphological data used in this paper are not readily accessible. Although existing AI-based satellite image recognition methods can quickly capture extensive building morphological data, their accuracy is insufficient, particularly in estimating building stories, which primarily relies on optical characteristics such as shadows—a method that lacks an ideal accuracy in densely built-up areas like the Nanjing Old City [12]. The building data presented here were obtained through extensive manual verification, making it challenging to conduct large-scale comparative measurements across hundreds of cities globally under current technological constraints. In terms of visualization, the 3D units of the 3D map matrix face issues of mutual occlusion, and the complexity of the 3D map matrix across scales complicates cross-scale comparative analysis and the integration of numerical and morphological analyses. In terms of computation, the Dq values are calculated within a scale interval of 3.0 m to 6.0 m. Although the lnh-I30(h) plot in Figure 5 suggests that this interval is the most representative, it also introduces some uncertainty into the multifractal calculation results. However, calculating Dq values for all intervals is impractically labor-intensive, and the limited automation of the methods used in this paper makes such an endeavor difficult to achieve.
Therefore, advancements in remote sensing technology based on multi-source data calibration will greatly facilitate comparative validation studies of the method proposed in this paper at a global scale [59]. The development of corresponding software or GIS-based plugins will address the limitations in visualization and computation identified in this study. In particular, we aim to evolve the 3D map matrix into a cross-scale 3D spatial sandbox where not only multifractal morphological indicators can be associated with 3D units but also a broader range of socio-economic factors, enabling more extensive mechanism research and discussion.

5. Conclusions

The 3D multifractal method incorporates several key indicators to uncover the global–local characteristics of urban morphology: (1) The generalized dimension Dq, which highlights cross-scale filling characteristics across different density areas, a feature that is also captured by existing multifractal methods; but with the added dimension of verticality, the method further exposes the heterogeneous distribution of high-rise buildings and the deficiencies in 3D form filling. (2) Rényi entropy Iq(h), which provides insights into morphological density and diversity at various scales. In the case of Nanjing Old City, where the multifractal characteristics are atypical, the linear correlation coefficient between lnh and Iq(h) may not always be close to 1, and such deviations can indicate critical scales of 3D morphological disorder. (3) The local indicator τq(h) for cross-scale building volume density, which facilitates the mapping analysis of 3D units, allowing the visualized 3D map matrix to pinpoint the multifractal characteristics of the urban 3D morphology in terms of spatial coordinates and scale intervals.
Urban 3D morphology serves as the spatial foundation for urban studies and directly interacts with the social, economic, ecological, and environmental aspects of the city during its evolutionary process. Therefore, the findings of this study may inspire a broader research community in the following issues: (1) The distinct collage of building morphological combinations in old districts offers a variety of residential products and commercial services, which may play a crucial positive role in the integration of different social classes and the inclusion of immigrants. (2) The building volume density in old districts does not exhibit a cross-scale power–law distribution, raising the question of whether there is a potential for optimization in the allocation of building development intensity to improve traffic and economic efficiency. (3) The cross-scale structure of ground gaps and vertical spaces in high-density old districts provides construction space for urban greening initiatives such as pocket parks and urban farms. (4) The 3D heterogeneity of building distribution and fragmented open spaces in old districts impact the urban wind environment and surface microclimate.

Supplementary Materials

The Python code mentioned in Section 2.6 for visualizing the expression of τq(h) values has been open-sourced by our team and is available for download at the following link: https://github.com/Leo-Shogun/GIPP (accessed on 7 March 2025).

Author Contributions

Conceptualization, J.Y., C.Z. and D.S.; methodology, C.Z., J.Y., X.L., Z.Z. (Zhonghu Zhang), Z.Z. (Zhihan Zhang) and D.S.; software, X.L., H.S., Y.H. and X.Z.; validation, J.Y. and C.Z.; formal analysis, C.Z., X.L. and Z.Z. (Zhonghu Zhang); investigation, C.Z., J.Y., X.L., D.C. and D.S.; resources, J.Y. and D.S.; data curation, J.Y., C.Z. and D.S.; writing—original draft preparation, C.Z., J.Y., X.L., D.C. and X.Z.; writing—review and editing, C.Z., J.Y., Z.Z. (Zhihan Zhang), H.S., Y.H. and D.S.; visualization, C.Z., X.L. and Z.Z. (Zhonghu Zhang); supervision, J.Y. and D.S.; project administration, J.Y. and C.Z.; funding acquisition, J.Y. and D.S. All authors have read and agreed to the published version of the manuscript.

Funding

This research was funded by the Jiangsu Provincial Department of Science and Technology, grant number BE2023799, and the National Natural Science Foundation of China, grant number 52308051.

Data Availability Statement

The data presented in this study are available upon request to the corresponding author.

Conflicts of Interest

The authors declare no conflicts of interest.

References

  1. Liu, H. Research of the Morphological Types of Blocks in the Old City of Nanjing. In Proceedings of the 24th ISUF 2017—City and Territory in the Globalization Age Spain, Valencia, Spain, 27–29 September 2017. [Google Scholar] [CrossRef]
  2. Song, Y.; Pang, Y. Measuring the Superblock Based on a Hierarchy Matrix of Geometry, Configuration, Network, and Area: The Case of Nanjing. Environ. Plan. B-Urban Anal. City Sci. 2023, 50, 1057–1071. [Google Scholar] [CrossRef]
  3. Zhang, L.; Ding, W. Changing Urban Form in a Planned Economy: The Case of Nanjing. Urban Morphol. 2018, 22, 15–34. [Google Scholar] [CrossRef]
  4. Conzen, M.P.; Gu, K.; Whitehand, J.W.R. Comparing Traditional Urban Form in China and Europe: A Fringe-Belt Approach. Urban Geogr. 2012, 33, 22–45. [Google Scholar] [CrossRef]
  5. Lagarias, A.; Prastacos, P. Comparing the Urban Form of South European Cities Using Fractal Dimensions. Environ. Plan. B-Urban Anal. City Sci. 2020, 47, 1149–1166. [Google Scholar] [CrossRef]
  6. Qiao, W.; Wang, Y.; Ji, Q.; Hu, Y.; Ge, D.; Cao, M. Analysis of the Evolution of Urban Three-Dimensional Morphology: The Case of Nanjing City, China. J. Maps 2019, 15, 30–38. [Google Scholar] [CrossRef]
  7. Ge, X.; Han, D. Sustainability-Oriented Configurational Analysis of the Street Network of China’s Superblocks: Beyond Marshall’s Model. Front. Archit. Res. 2020, 9, 858–871. [Google Scholar] [CrossRef]
  8. Chen, Y.; Huang, L. Modeling Growth Curve of Fractal Dimension of Urban Form of Beijing. Physica A 2019, 523, 1038–1056. [Google Scholar] [CrossRef]
  9. Song, Y.; Zhang, Y.; Han, D. Deciphering Built Form Complexity of Chinese Cities through Plot Recognition: A Case Study of Nanjing, China. Front. Archit. Res. 2022, 11, 795–805. [Google Scholar] [CrossRef]
  10. Gao, C.; Lu, H.; Ding, W.; Larkham, P.J. The Relationship between Urban Form and Land-Use Regulation in China: The Case of Nanjing. Urban Morphol. 2024, 28, 3–26. [Google Scholar] [CrossRef]
  11. Liu, J.; Deguchi, A. The Mechanism of Block Form Diversification in Urban Morphological Transformation: Case Study of Grid Blocks in Beijing, China. Front. Archit. Res. 2024, 13, 928–943. [Google Scholar] [CrossRef]
  12. Cai, Z.; Demuzere, M.; Tang, Y.; Wan, Y. The Characteristic and Transformation of 3D Urban Morphology in Three Chinese Mega-Cities. Cities 2022, 131, 103988. [Google Scholar] [CrossRef]
  13. Frolking, S.; Mahtta, R.; Milliman, T.; Esch, T.; Seto, K.C. Global Urban Structural Growth Shows a Profound Shift from Spreading out to Building Up. Nat. Cities 2024, 1, 555–566. [Google Scholar] [CrossRef]
  14. Zhang, Y.; Luo, F.; Dai, Y.; Zhang, C. Changing Spatial Inclusion of Migrants in Chinese Cities: How Housing Matters. Habitat Int. 2025, 157, 103319. [Google Scholar] [CrossRef]
  15. Dong, J.; Guo, R.; Guo, F.; Cai, J. Potential Evaluation and Implementation Strategy for Pocket Park Construction in High-Density Urban Areas: A Case Study in Dalian, China. Front. Archit. Res. 2024, 13, 319–334. [Google Scholar] [CrossRef]
  16. Es-sakali, N.; Pfafferott, J.; Mghazli, M.O.; Cherkaoui, M. Towards Climate-Responsive Net Zero Energy Rural Schools: A Multi-Objective Passive Design Optimization with Bio-Based Insulations, Shading, and Roof Vegetation. Sustain. Cities Soc. 2025, 120, 106142. [Google Scholar] [CrossRef]
  17. He, X.; Zhou, Y. Urban Spatial Growth and Driving Mechanisms under Different Urban Morphologies: An Empirical Analysis of 287 Chinese Cities. Landsc. Urban Plan. 2024, 248, 105096. [Google Scholar] [CrossRef]
  18. Shi, B.; Yang, J. Scale, Distribution, and Pattern of Mixed Land Use in Central Districts: A Case Study of Nanjing, China. Habitat Int. 2015, 46, 166–177. [Google Scholar] [CrossRef]
  19. Zhang, C.; Ping, X.; Fan, Q.; Li, C. Measurement of 2D and 3D Fractal Features of Urban Morphology from an Architectural View and Its Influencing Factors. Fractal Fract. 2024, 8, 138. [Google Scholar] [CrossRef]
  20. Batty, M.; Longley, P. Fractal Cities—A Geometry of Form and Function; Academic Press Professional, Inc.: San Diego, CA, USA, 1994. [Google Scholar] [CrossRef]
  21. Batty, M. The Size, Scale, and Shape of Cities. Science 2008, 319, 769–771. [Google Scholar] [CrossRef]
  22. Tan, X.; Huang, B.; Batty, M.; Li, J. Urban Spatial Organization, Multifractals, and Evolutionary Patterns in Large Cities. Ann. Am. Assoc. Geogr. 2021, 111, 1539–1558. [Google Scholar] [CrossRef]
  23. Zhang, C.; Shao, D.; Yang, J.; Liu, X. A Multifractal Method Based on Spacematrix Type Units for Analysing Cross-Scale Characteristics of Urban Morphology. Front. Archit. Res. 2024; in press. [Google Scholar] [CrossRef]
  24. Chen, Y.; Wang, J. Multifractal Characterization of Urban Form and Growth: The Case of Beijing. Environ. Plan. B-Plan. Des. 2013, 40, 884–904. [Google Scholar] [CrossRef]
  25. Mandelbrot, B. How Long Is the Coast of Britain? Statistical Self-Similarity and Fractional Dimension. Science 1967, 156, 636–638. [Google Scholar] [CrossRef] [PubMed]
  26. Mandelbrot, B. The Fractal Geometry of Nature; W. H. Freeman and Company: New York, NY, USA, 1983. [Google Scholar]
  27. Viczek, T. Fractal Growth Phenomena, 1st ed.; World Scientific: Singapore, 1989; pp. 19–24. [Google Scholar]
  28. Ma, D.; Guo, R.; Zheng, Y.; Zhao, Z.; He, F.; Zhu, W. Understanding Chinese Urban Form: The Universal Fractal Pattern of Street Networks over 298 Cities. ISPRS Int. J. Geo-Inf. 2020, 9, 192. [Google Scholar] [CrossRef]
  29. Cao, W.; Dong, L.; Wu, L.; Liu, Y. Quantifying Urban Areas with Multi-Source Data Based on Percolation Theory. Remote Sens. Environ. 2020, 241, 111730. [Google Scholar] [CrossRef]
  30. Frankhauser, P.; Tannier, C.; Vuidel, G.; Houot, H. An Integrated Multifractal Modelling to Urban and Regional Planning. Comput. Environ. Urban Syst. 2018, 67, 132–146. [Google Scholar] [CrossRef]
  31. Murcio, R.; Masucci, A.P.; Arcaute, E.; Batty, M. Multifractal to Monofractal Evolution of the London Street Network. Phys. Rev. E 2015, 92, 062130. [Google Scholar] [CrossRef]
  32. Fan, Q.; Mei, X.; Zhang, C.; Yang, X. Research on Gridding of Urban Spatial Form Based on Fractal Theory. ISPRS Int. J. Geo-Inf. 2022, 11, 622. [Google Scholar] [CrossRef]
  33. Bruyns, G.J.; Higgins, C.D.; Nel, D.H. Urban Volumetrics: From Vertical to Volumetric Urbanisation and Its Extensions to Empirical Morphological Analysis. Urban Stud. 2021, 58, 922–940. [Google Scholar] [CrossRef]
  34. Zhao, F.; Liu, J.; Zhou, Y. Sandbox Edge-Based Algorithm for Multifractal Analysis of Complex Networks. Chaos Solitons Fractals 2023, 173, 113719. [Google Scholar] [CrossRef]
  35. Wang, J.; Lu, F.; Liu, S. A Classification-Based Multifractal Analysis Method for Identifying Urban Multifractal Structures Considering Geographic Mapping. Comput. Environ. Urban Syst. 2023, 101, 101952. [Google Scholar] [CrossRef]
  36. Man, X.; Chen, Y. Fractal-Based Modeling and Spatial Analysis of Urban Form and Growth: A Case Study of Shenzhen in China. ISPRS Int. J. Geo-Inf. 2020, 9, 672. [Google Scholar] [CrossRef]
  37. Whitehand, J.; Gu, K. Urban Fringe Belts: Evidence from China. Environ. Plan. B-Urban Anal. City Sci. 2017, 44, 80–99. [Google Scholar] [CrossRef]
  38. Cao, J.; Zhu, J.; Zhang, Q.; Wang, K.; Yang, J.; Wang, Q. Modeling Urban Intersection Form: Measurements, Patterns, and Distributions. Front. Archit. Res. 2021, 10, 33–49. [Google Scholar] [CrossRef]
  39. Niu, Y.; Mi, X.; Wang, Z. Vitality Evaluation of the Waterfront Space in the Ancient City of Suzhou. Front. Archit. Res. 2021, 10, 729–740. [Google Scholar] [CrossRef]
  40. Chen, Y.; Feng, J. Spatial Analysis of Cities Using Rényi Entropy and Fractal Parameters. Chaos Solitons Fractals 2017, 105, 279–287. [Google Scholar] [CrossRef]
  41. Saeedimoghaddam, M.; Stepinski, T.F.; Dmowska, A. Rényi’s Spectra of Urban Form for Different Modalities of Input Data. Chaos Solitons Fractals 2020, 139, 109995. [Google Scholar] [CrossRef]
  42. Chen, Y.; Wang, J.; Feng, J. Understanding the Fractal Dimensions of Urban Forms through Spatial Entropy. Entropy 2017, 19, 600. [Google Scholar] [CrossRef]
  43. Saeedimoghaddam, M.; Stepinski, T.F. Multiplicative Random Cascade Models of Multifractal Urban Structures. Physica A 2021, 569, 125767. [Google Scholar] [CrossRef]
  44. Long, Y.; Chen, Y. Multifractal Scaling Analyses of Urban Street Network Structure: The Cases of Twelve Megacities in China. PLoS ONE 2021, 16, e0246925. [Google Scholar] [CrossRef]
  45. Wang, P.; Gu, C.; Yang, H.; Wang, H. The Multi-Scale Structural Complexity of Urban Morphology in China. Chaos Solitons Fractals 2022, 164, 112721. [Google Scholar] [CrossRef]
  46. Witten, T.A.; Sander, L.M. Diffusion-Limited Aggregation, a Kinetic Critical Phenomenon. Phys. Rev. Lett. 1981, 47, 1400–1403. [Google Scholar] [CrossRef]
  47. Batty, M. Cities as Fractals: Simulating Growth and Form. In Fractals and Chaos; Crilly, A.J., Earnshow, R.A., Jones, H., Eds.; Springer: New York, NY, USA, 1991; pp. 43–69. [Google Scholar]
  48. Conzen, M.P. How Cities Internalize Their Former Urban Fringes: A Cross-Cultural Comparison. Urban Morphol. 2009, 13, 29–54. [Google Scholar] [CrossRef]
  49. Chen, Y.; Wu, M. Analyzing Recent Morphological Evolution in Central Beijing during Relocating Non-Capital Functions Based on POI Data and Digital Maps. Cities Assem. 2022, 3, 101–113. [Google Scholar] [CrossRef]
  50. Li, Z.; Xu, Y.; Bai, X.; Xu, Z.; Ma, H.; Yue, X.; Liu, J.; Lun, Y. Study on the Relationship between Urban Road Network Morphology and Spatial Distribution of Hotel Industry: A Case Study of Nanjing City. Environ. Dev. Sustain. 2025, 27, 2423–2447. [Google Scholar] [CrossRef]
  51. Li, J.; Li, C.; Zhu, F.; Song, C.; Wu, J. Spatiotemporal Pattern of Urbanization in Shanghai, China between 1989 and 2005. Landsc. Ecol. 2013, 28, 1545–1565. [Google Scholar] [CrossRef]
  52. Xiong, W.; Yang, J. Delineating and Characterizing the Metropolitan Fringe Area of Shanghai—A Spatial Morphology Perspective. Land 2023, 12, 2086. [Google Scholar] [CrossRef]
  53. Sharifi, A. Resilient Urban Forms: A Macro-Scale Analysis. Cities 2019, 85, 1–14. [Google Scholar] [CrossRef]
  54. Whitehand, J.W.R.; Gu, K.; Whitehand, S.M. Fringe Belts and Socioeconomic Change in China. Environ. Plan. B 2011, 38, 41–60. [Google Scholar] [CrossRef]
  55. Wang, S.; Gu, K. Pingyao: The Historic Urban Landscape and Planning for Heritage-Led Urban Changes. Cities 2020, 97, 102489. [Google Scholar] [CrossRef]
  56. Zhou, L.; Gong, Y.; López-Carr, D.; Huang, C. A Critical Role of the Capital Green Belt in Constraining Urban Sprawl and Its Fragmentation Measurement. Land Use Policy 2024, 141, 107148. [Google Scholar] [CrossRef]
  57. Zhou, L.; Wei, L.; López-Carr, D.; Dang, X.; Yuan, B.; Yuan, Z. Identification of Irregular Extension Features and Fragmented Spatial Governance within Urban Fringe Areas. Appl. Geogr. 2024, 162, 103172. [Google Scholar] [CrossRef]
  58. Wang, H. The Role of Informal Ruralization within China’s Rapid Urbanization. Nat. Cities 2024, 1, 205–215. [Google Scholar] [CrossRef]
  59. Zhu, Z.; Zhou, Y.; Seto, K.C.; Stokes, E.C.; Deng, C.; Pickett, S.T.A.; Taubenböck, H. Understanding an Urbanizing Planet: Strategic Directions for Remote Sensing. Remote Sens. Environ. 2019, 228, 164–182. [Google Scholar] [CrossRef]
Figure 1. Geometric comparison. (a) Regular fractal—a multifractal pattern. (b) Fractal city—building plan of the Nanjing Old City. (c) Irregular fractal—a simulation of coastlines.
Fractalfract 09 00195 g001
Figure 2. Morphological information of the Nanjing Old City: (a) Study scope and building plan. (b) Aerial view of the boundary (city wall). (c) Aerial view of the Xinjiekou commercial district. (d) Aerial view of the historic district. Aerial photo source: 720 yun.
Fractalfract 09 00195 g002
Figure 3. A 3D morphological diagram of the generalized dimension Dq.
Fractalfract 09 00195 g003
Figure 4. Diagram of the τq(h) values for the 3D units in the Nanjing Old City.
Fractalfract 09 00195 g004
Figure 5. Generalized dimension analysis based on the linear correlation of lnh-I30(h).
Fractalfract 09 00195 g005
Figure 6. Generalized dimension analysis based on the q-Dq spectrum.
Fractalfract 09 00195 g006
Figure 7. The 3D map matrix of the Nanjing Old City. Subfigures in the same row have the same h value, while subfigures in the same column have the same q value, with specific correspondences detailed for each subfigure’s τq(h).
Fractalfract 09 00195 g007
Figure 8. An illustration of the q-Dq spectrum of the 2D morphology.
Fractalfract 09 00195 g008
Figure 9. Calculation example.
Fractalfract 09 00195 g009
Figure 10. Diagram of the calculation comparison for 2D and 3D capacity dimensions.
Fractalfract 09 00195 g010
Table 1. The size and quantity of 3D units.
exyhNN
15567.6 m655.8 m24.0 m3375489
29293.6 m339.2 m12.0 m24,3892231
57149.4 m172.6 m6.0 m185,19311,086
11375.3 m87.1 m3.0 m1,442,89754,606
22637.7 m43.5 m1.511,543,176301,270
Disclaimer/Publisher’s Note: The statements, opinions and data contained in all publications are solely those of the individual author(s) and contributor(s) and not of MDPI and/or the editor(s). MDPI and/or the editor(s) disclaim responsibility for any injury to people or property resulting from any ideas, methods, instructions or products referred to in the content.

