Article

SafeWitness: Crowdsensing-Based Geofencing Approach for Dynamic Disaster Risk Detection

1
Department of Computer Science and Engineering, Chung-Ang University, Seoul 06974, Republic of Korea
2
School of Advanced Technology, Xi’an Jiaotong-Liverpool University, Suzhou 215123, China
*
Author to whom correspondence should be addressed.
Fractal Fract. 2025, 9(3), 156; https://doi.org/10.3390/fractalfract9030156
Submission received: 23 January 2025 / Revised: 25 February 2025 / Accepted: 26 February 2025 / Published: 3 March 2025
(This article belongs to the Section Engineering)

Abstract

As the frequency of disasters increases worldwide, it has become increasingly important to raise awareness of the risks and mitigate their effects through effective disaster management. Anticipating disaster risks and ensuring timely evacuations are crucial. This paper proposes SafeWitness, which dynamically captures the evolving characteristics of disasters by integrating crowdsensing and GIS-based geofencing. It not only enables real-time disaster awareness and evacuation support but also provides spatial context awareness by mapping the disaster area based on GIS road information and temporal context awareness by using crowdsensing to track the progress of the disaster. This approach increases the effectiveness of disaster management by providing explicit, data-driven insights for timely decision making and risk mitigation. The experimental results reveal that the proposed method improved the F1-scores in the hazard and warning zones compared to the domain-based approach. The result increased by 12% in the hazard zone and by 55% in the warning zone compared to the traditional technique. Through user sampling, we enhanced the SafeWitness F1-score in the hazard zone by 6 times and in the warning zone by 2.8 times compared to the method without user sampling. In conclusion, SafeWitness offers a more precise perception of disaster areas than traditional domain-based area definitions, and the experimental results demonstrate the effectiveness of user sampling. Decision-makers and disaster management professionals can use the proposed method in urban disaster scenarios.

1. Introduction

Disasters involve economic losses and human casualties, including both causative and natural events, such as fires, floods, earthquakes, hurricanes, chemical spills, terrorism, and nuclear explosions [1,2,3,4]. In particular, disasters in urban areas can destroy infrastructure and trigger population displacement, leading to the collapse of interdependent social systems. For example, a large-scale fire disaster can force numerous people to evacuate and causes damage to human and material resources by collapsing buildings. Consequently, it is critical to monitor and respond to disasters continuously [5,6]. Furthermore, disaster response systems that minimize the damage caused by disasters, such as the 9/11 attacks in 2001 and the London bombings in 2005, have gained global attention [7,8]. In particular, crowdsensing techniques that collect and process real-time sensor data to achieve disaster awareness and response have emerged as a novel approach [9,10,11].
The integration of fractals into disaster response systems facilitates the comprehension of complex disaster patterns [12,13]. Fractals, distinguished by self-similarity and scale invariance, offer a mathematical framework to model the irregular and fragmented nature of disaster areas [14]. The application of crowdsourced data to fractal analysis enables the identification of recurring patterns and more precise disaster spread predictions [15]. In addition, they exploit large-scale data sensing techniques through smartphones or Internet of Things (IoT) devices equipped with sensors, such as global positioning systems (GPSs), cameras, microphones, accelerometers, and gyroscopes, to gather structured insight about the environment or specific phenomena [16,17]. Notably, the increasing number of sensors embedded in smartphones and advancements in sensor technology have facilitated cost-effective sensing systems [18,19]. The integration of crowdsourcing and fractal analysis has the potential to enhance the efficacy of disaster management systems [20]. While crowdsourcing can collect vast amounts of data in real time, fractal analysis can analyze these data through the principles of self-similarity and scale invariance to accurately predict the spread pattern of a disaster [21].
In contrast, crowdsourcing refers to gathering unstructured collective intelligence to solve a common objective. It has also been applied in disaster management to mitigate disaster damage. For example, during the Haiti earthquake in 2010, crowdsourcing created a road map of the affected area, enabling the successful distribution of relief supplies. Since then, there has been an increasing effort to apply crowdsourcing in disaster management technology [5,22,23,24].
Notifying users about the risks before they are directly exposed to the dangers of the disaster can help mitigate losses from damage [25,26]. In modern cities, human and material resources are mobilized through the road infrastructure, and as society continues to develop around urban areas, we can combine GIS road information with geofencing to represent areas explicitly affected by disasters. The GIS tool enables geospatial data storage, manipulation, analysis, and visualization. It encompasses various data types, including terrain, road networks, administrative boundaries, and other spatially referenced information. Including the elements of disaster risk on maps allows users to clearly understand the disaster areas [27,28].
Geofencing is a technology that uses location-based technologies, such as GPS or radio frequency identification, to set up virtual fences and detect the movement of objects or entities within a defined area [29,30]. Geofencing can dynamically detect user access within a defined area, applying it for disaster management. Geofencing represents area boundaries and detects user movement, providing disaster properties. Therefore, it provides insight into user behavior in disaster situations by analyzing collective intelligence based on movement patterns [31,32,33].
Dynamically perceiving disaster areas over time is crucial for minimizing their effects. However, conventional methods rely on static representations of past disaster cases, which fail to capture evolving disaster dynamics. The extent of damage caused by disasters varies due to multiple factors, including the climate, cause, and environmental conditions [34,35,36]. Specifically, disaster-affected areas fluctuate based on elements such as the humidity, wind speed, fuel availability, terrain slope, and solar heat. A dynamic approach is essential for accurately modeling and responding to disasters in real time.
This paper proposes SafeWitness, a methodology that dynamically captures the evolving characteristics of disasters over time and provides explicit regional information, enabling users to recognize the disaster and evacuate the area effectively. SafeWitness offers explicit information about the evolving nature of disasters, assisting in effective disaster management and minimizing the effects. The proposed approach, using crowd intelligence from users who witness disasters and evacuate, captures the dynamic aspects of disasters and incorporates them into geofencing. Additionally, combining GIS road information establishes areas surrounding the disaster zone where the disaster could spread. To address these challenges, this study investigates the following research questions:
  • How can crowdsensing-based geofencing be effectively integrated to dynamically model disaster risk areas?
  • How can fractal analysis improve disaster risk detection by modeling the self-similar?
  • How can SafeWitness optimize geofencing expansion control?
The structure of this paper is organized as follows: Section 2 investigates disaster management, situational awareness, and risk detection. Section 3 introduces SafeWitness and combines crowdsourced collective intelligence with GIS road information to explicitly perceive disaster areas over time. Finally, the experiments, results, and future research are discussed in Section 4 and Section 5.

2. Related Work

Effective disaster response requires accurate situational awareness, real-time risk assessment, and adaptive decision making. Traditional geofencing methods rely on predefined hazard zones, which fail to capture the dynamic nature of disasters. Recent advances in crowdsensing, machine learning, and fractal-based spatial analysis have introduced more adaptive and scalable approaches for disaster modeling.
This section reviews three essential areas relevant to our research, which are geofencing applications in disaster management, theoretical foundations of adaptive disaster response, and fractal theory in spatial modeling. The discussion highlights limitations in the existing methods and explains how SafeWitness addresses these gaps by integrating real-time data, self-similar geofencing expansion, and machine learning-driven risk assessment.
Geofencing has emerged as a critical tool in disaster management, enabling real-time monitoring, hazard zone delineation, and emergency response coordination. By leveraging location-based services (LBSs) and sensor networks, geofencing allows authorities to define virtual boundaries around disaster-prone areas and automate alerts for affected populations. Previous studies have applied geofencing to situational awareness [37], real-time hazard mapping [38], and evacuation guidance [39]. However, these approaches primarily rely on static geofencing models, which struggle to adapt to rapidly evolving disaster conditions. Situational awareness, involving understanding the risk factors of a disaster, provides real-time information about the situation in disaster-affected areas to stakeholders, such as citizens, volunteers, and disaster management authorities [40]. Moreover, [41] suggests a smartphone-based system called Argus, which generates real-time 3D maps of disaster areas, including crowdsourced data. Users share data through smartphone sensors, such as cameras, microphones, GPSs, accelerometers, and gyroscopes, contributing to the 3D reconstruction. During disasters, ensuring the evacuation of users from hazardous areas and guiding them to safe locations is a crucial issue, and numerous studies have focused on mapping disaster areas using road networks. For example, ref. [42] illustrates the mapping of disaster areas using GPS data from Android smartphones after a disaster. Ref. [43] presents a system that uses mobile detection through Bluetooth signals to detect the pedestrian congestion, direction, and speed in real time to guide routes during disaster events. The research analyzes congestion based on detected nearby devices and detects the pedestrian direction and speed using the devices carried by pedestrians. Ref. [44] also introduces innovative approaches employing image-based measurements as input for a conceptual flood prediction system applicable to river environments. Furthermore, Ref. [45] suggests a distributed mapping service based on blockchain backends installed on smartphones. Users in disaster-affected areas can collect feasible routes for mobility using GPS sensors while moving, allowing all users to share the map.
Effective disaster response requires real-time adaptability, as disasters unfold in nonlinear and unpredictable ways. Traditional response models often rely on predefined hazard zones and rule-based decision making, limiting their ability to dynamically react to evolving situations. Disasters involve interdependent social, environmental, and technological factors, making them inherently complex systems. Ref. [12] highlights that disaster response efforts function as complex adaptive systems (CASs), where emergent behaviors, feedback loops, and self-organization influence decision making. CAS models suggest that disaster zones evolve dynamically, requiring flexible and decentralized risk assessment approaches. Recent advancements in machine learning (ML) and remote sensing have significantly enhanced the adaptability of disaster management systems. Ref. [13] provides a decadal review of ML applications in post-disaster building damage assessment, demonstrating how automated image recognition and predictive models improve the response efficiency. Geospatial data play a critical role in tracking the disaster evolution and guiding response efforts. Ref. [46] introduces deep graph convolutional networks for automatic road network selection, highlighting the importance of spatial connectivity in hazard zone modeling. Crowdsourcing has played a significant role in disaster response and situational awareness, enabling real-time data collection to support relief efforts. For example, during the Haiti earthquake in 2010, crowdsourcing efforts created a detailed road map of the affected area, facilitating the successful distribution of relief supplies [5]. Since then, researchers have explored the integration of crowdsourced data into disaster management technologies, enhancing hazard mapping and emergency communication systems [24].
Fractal theory provides a mathematical framework for understanding self-similar and irregular spatial patterns found in natural and urban environments. Ref. [47] introduced the concept of fractional dimensions, demonstrating that complex geographical structures, such as coastlines and mountain ranges, exhibit scalable, self-repeating patterns. Since then, researchers have applied fractal models to analyze geospatial phenomena, urban growth, and environmental changes [48].
In disaster modeling, fractal analysis has been used to describe irregular hazard expansion and dynamic risk assessment. Ref. [49] applies fractal geometry to analyze precipitation distribution, demonstrating how fractals can model nonlinear environmental changes. Similarly, Refs. [46,50] demonstrate that road networks and hazard zones exhibit fractal-like expansion, reinforcing the importance of scale-invariant spatial modeling in disaster response. Beyond geospatial applications, fractal theory has also been applied to emergency management and crisis communication. Ref. [51] introduces the concept of a fractal emergency response organization, arguing that disaster response efforts in coastal cities should be self-organizing and self-adaptive. Their model presents a hierarchical, fractal-based reconstruction of emergency units, ensuring that disaster response systems remain efficient and scalable under rapidly changing conditions. Similarly, ref. [52] applies stochastic evolutionary game theory to cross-regional emergency collaboration, demonstrating that fractal-like, self-organizing structures improve coordination across different government agencies during disaster response. Fractal principles have also been linked to chaos theory and crisis communication in disaster management. Ref. [53] applies chaos theory to analyze the crisis communication during the 1997 Red River Valley flood, demonstrating how self-organizing communication structures emerged to restore order in chaotic disaster conditions. They highlight the role of fractals in decision making, arguing that traditional, rigid communication frameworks fail in rapidly evolving disaster environments. This aligns with SafeWitness’s approach, which prioritizes real-time, adaptive geofencing updates based on dynamic risk assessments, rather than relying on predefined hazard boundaries.

3. Proposed Methodology

Section 3 explains the proposed SafeWitness method for perceiving the disaster through collective intelligence. SafeWitness incorporates the expertise of domain experts in the disaster domain to establish the initial disaster area and combines movement trajectories to perceive dynamic disaster aspects. Table 1 lists the notations for the SafeWitness method.

3.1. Overview

Swiftly and accurately understanding the risk areas associated with a disaster is crucial. This section proposes SafeWitness, a method employing collective intelligence in disaster situations to provide contextual awareness. SafeWitness combines GIS road networks and crowdsensing, leveraging collective intelligence to comprehend and perceive the dynamic nature of disasters. This method provides users with information about hazardous areas, enabling them to evacuate efficiently. By integrating the concept of fractals, SafeWitness can model complex, self-similar patterns of disaster risks, enhancing the accuracy and reliability of risk detection. Integrating GIS road networks and crowdsensing captures the dynamic characteristics of disasters and explicitly offers users information about the risk areas.
Figure 1 represents the three-phase process of SafeWitness. In the first phase, the initial geofencing is created based on the expertise of domain specialists. The second phase involves user-participatory disaster area perception, employing user sequence sampling to select relevant user movements to create geofencing. Finally, the proposed method dynamically establishes the area based on a combination of valid movement and the existing geofencing according to the disaster situation. This area undergoes time-series variations over time, providing users with temporal contextual awareness, and explicitly represents the changing disaster patterns, offering spatial contextual awareness. In addition, the proposed method leverages spatial contextual awareness to visualize the extent of the disaster.

3.2. Generalization of GIS Road Information

Cities develop and thrive around road infrastructures, enabling the movement of human and material resources. Disaster response also involves the movement of resources through road networks, making it essential to determine disaster areas. This section suggests the criteria and generalizes the GIS road information (Figure 2).
Disasters can gradually extend their scale and influence on the surrounding areas. Hence, the potential propagation to neighboring regions must be considered when defining the extent of disasters. SafeWitness incorporates GIS road information to account for the potential spread of disasters in hazardous areas. However, the criteria for defining roads can vary depending on the organization that generates the information and its intended use [46,50,54]. Hence, roads must be generalized according to a standard criterion for the integration of geofencing. The proposed method reconstructs road information by dividing it into standard criteria at the intersection level. SafeWitness perceives disaster areas based on the generalized road network, which provides a standard reference method.

3.3. Initialization of SafeWitness

The proposed method categorizes the disaster area into three zones, hazard, warning, and safety, enabling users to understand the risk level. The hazard zone represents the area directly affected by the disaster, and the warning zone encompasses the surrounding area of the hazard zone, where the disaster could spread. SafeWitness offers an alert about the risks of the disaster within the warning zone, enabling people to evacuate before becoming exposed to imminent danger. Finally, the safety zone refers to the areas outside the hazard and warning zones.
The extent of damage caused by a disaster can be difficult to perceive accurately due to various factors, such as the climate, causative agents, and surrounding environments. Therefore, we initialize the disaster area based on past disaster cases and the knowledge of domain experts regarding the surrounding conditions (humidity, fuel, wind speed, slope, solar radiation, etc.) [34,35,36]. However, due to the significant time involved in considering all the influencing factors of various disaster scenarios, the first area of SafeWitness is initialized as a typical circular shape. Subsequently, the proposed method dynamically changes the disaster area through crowdsensing.
In SafeWitness, the disaster area is dynamically generated by transforming user-reported movement sequences into vertices and applying convex hull operations [55]. Each vertex represents a specific location within the disaster zone, determined based on real-time user data and expert domain knowledge. The initialization process incorporates a hyperparameter (r), which defines the radius of influence from the disaster occurrence point. This parameter is empirically determined based on historical disaster patterns and expert recommendations.
The disaster area initialization follows Equation (1), where the convex hull operation is applied to a set of 360 vertices, each positioned at a radial distance of r from the disaster occurrence point. It allows for dynamic updates as new data are received, ensuring that the initialized disaster zone remains adaptable to changes in the disaster propagation:
hazard   zone   = convexhull x 1 , y 1 ,   x 2 , y 2 ,   ,   x 360 , y 360
Moreover, we combine the GIS road information with the hazard zone to generate the warning zone. Based on the hyperparameter, an area is created that is hop intersections away from the hazard zone (Equation (2)). However, the generalized GIS road information represents intersections as points; thus, it is difficult to perceive them as areas. To extend these intersected points to area units, SafeWitness polygonizes them through the convex hull operations of the intersection points, setting them as the warning zone. Figure 3 illustrates the initial hazard and warning zones for the simulation of a disaster, based on a scenario in Samdong-ro, Asan City, South Korea.
warning   zone   = convexhull hop

3.4. Crowdsensing-Based SafeWitness

RQ1. How can crowdsensing-based geofencing be effectively integrated to dynamically model disaster risk areas?
This section discusses the method for automatically detecting the expanding areas of disasters over time using collective intelligence. A prominent example of a disaster with an expanding nature is a fire disaster, which spreads to surrounding areas through humidity, fuel, wind speed, slope, and solar heat, expanding its influence [34]. To ensure continuous notifications, domain experts in disaster management must constantly monitor the evolving disaster situation, actively intervene, and manually make adjustments, considering the temporal and spatial changes. Additionally, people seek safety and an escape from dangerous situations when faced with risks [56]. Therefore, the proposed method uses the collective intelligence on evacuating from disasters to perceive the expanding risk area automatically.
In Section 3.4.1, we select candidates who are likely to witness a disaster. Then, we sample their trajectories to identify participants relevant to the changing disaster area and provide valuable information in Section 3.4.2.

3.4.1. User Information Sampling (Candidates)

SafeWitness determines the disaster area by incorporating the sequence vectors of users (Figure 4). We classify them within the geofencing area into the u h , u w , and u s categories. Among these, u h refers to users directly experiencing the disaster effects within the hazardous area, prompting them to evacuate. Therefore, we selected these users ( u h , u w , u s ) as candidates (Equation (3)) and computed the candidate sequence vector (svcandi) by comparing their previous and current locations (Equation (4)):
candi   =   intersect users ,   hazard   zone  
s v candi = l candi , after l candi , before
Based on their candidate sequence vector, candidates can move outside or remain within the hazard zone. Subsequently, similar to the user status, we classified the status of candidates based on location as c a n d i h , c a n d i w , and c a n d i s .

3.4.2. User Information Sampling (Participants)

RQ2. How can fractal analysis improve disaster risk detection by modeling the self-similar?
This section presents the proposed method to compute the participants and participant sequence vector influencing the method (Figure 5). In addition, c a n d i w and c a n d i s are users who left the hazard zone after witnessing the disaster. We considered the influence and propagation speed of the disaster by setting a threshold for the warning area, representing the potential spread of the disaster. The threshold allows SafeWitness to select valid candidates by filtering out those within the warning zone, and c a n d i s refers to users who have already left the disaster area. These users cause the geofencing to expand infinitely and at a rapid pace. Therefore, by excluding these users, SafeWitness prevents the area from expanding infinitely and rapidly increasing in size. Thus, c a n d i w represents users who evacuate after witnessing the disaster. The participants affecting geofencing are selected using Equation (5):
parti = intersect candi ,   warning   zone ,      
The participant sequence vector is then calculated based on the movement of the participants over time, as formulated in Equation (6):
s v parti = l parti ,   after l parti ,   before .        
SafeWitness dynamically models disaster spread patterns, restricts excessive geofencing expansion, and refines hazard zone boundaries in real time. This approach ensures the accurate tracking of the disaster influence while preventing the overestimation of the affected areas.

3.4.3. Dynamic SafeWitness

RQ3. How can SafeWitness optimize geofencing expansion control?
Finally, to ensure that SafeWitness dynamically adapts to the disaster evolution, we refine the hazard zone by incorporating real-time participant movement data (Figure 6). Unlike the initial hazard zone, which was constructed using static geofencing principles, this step updates the hazard boundary dynamically based on evacuee movements and disaster spread patterns. The hazard zone expansion is computed by integrating the participant sequence vector, which reflects the real-time movement patterns of affected individuals, into the convex hull operation. This ensures that SafeWitness captures the evolving disaster impact area in real time. The hazard zone is updated using Equation (7):
hazard   zone = convexhull hazard   zone ,   l parti , after .    
Similarly, the warning zone is regenerated by integrating GIS road information to reflect the real-world accessibility and infrastructure constraints. It ensures accurate modeling of the disaster zone. SafeWitness provides real-time monitoring of the propagation of a disaster by continuously updating these zones.

4. Experiments

This section presents a detailed scenario simulating a major fire disaster, covering all stages from the pre-disaster phase to the post-disaster response phase. The experiment evaluates the proposed method by comparing the actual disaster-affected area with SafeWitness’s predicted geofencing boundaries. The evaluation focuses on assessing the accuracy and adaptability of SafeWitness in dynamically modeling disaster risk areas. The comparison considers factors such as hazard zone delineation, geofencing expansion, and real-time responsiveness. The experiment also analyzes the impact of user participation and crowdsensing on the precision and recall of disaster zone detection.

4.1. Scenario: Major Fire in a Complex Facility

We evaluated the proposed method by focusing on a disaster in a densely populated urban area with open-road infrastructure. Specifically, this scenario is based on Asan in South Korea as the target for evaluation, which has a population of 336,700 residents and well-developed road infrastructure. It serves as the location of the fire incident, which is an open-space structure with 3 underground floors and 10 above-ground floors. With over 500,000 people moving through the terminal annually, it is a high-risk area where a major fire could result in significant casualties. Figure 7 illustrates various cases of user classification based on the situation during a major fire in a complex facility, based on a scenario in Mojong-ro, Asan, South Korea.
Figure 8 illustrates the scenario following a significant fire in a complex facility, illustrating the sequence of events from the initial disaster report to the attempts at disaster containment and the completion of the response. The fire originates in a restaurant within the terminal, and due to a malfunctioning fire alarm system, the automatic fire alarms fail to activate, resulting in an uncontrollable fire. Upon the arrival of the fire brigade, they establish a perimeter to restrict the influx of citizens, considering the risks associated with the disaster. Once they reach the disaster area, they set up a primary control line and commence disaster containment efforts. However, due to the initial failures in containing the disaster, a secondary control line is established to restrict the influx of citizens further, and more extensive measures are taken to bring the disaster under control.

4.2. Implementation

We evaluated the performance based on the minimum control scale, represented by the control lines installed around the disaster site in the event of a disaster. The primary control line is established to restrict public access to the immediate affected area, while the secondary control line is set up to ensure unimpeded access for rescue and emergency vehicles. Therefore, we evaluated the performance of SafeWitness by comparing the risk area of the primary control line with the hazard zone and the caution area of the secondary control line with the warning zone. The initial hazard zone covers a radius of 100 m around the disaster location, encompassing the complex facility and surrounding commercial areas where the disaster occurred.
In the experiment, we simulated the scenario of people moving away from the area when a fire disaster occurs. In the simulation, users moved at an average walking speed of 4.8 km/h, the baseline for human movement in Table 2 [57,58,59]. However, individuals may have different walking speeds; therefore, we set the speed for each user to between 4.0 and 5.0 km/h for the simulation. According to the scenario, the primary control line is established 10 min after the arrival of the firefighting team. Based on this, we executed the algorithm at intervals of 2 min a total of six times, following the occurrence of the disaster. We evaluated the method by comparing the final output, the SafeWitness after 10 min of the disaster (the sixth SafeWitness), with the installed control lines.

4.3. Experimental Analysis

To evaluate the effectiveness of SafeWitness, we compare its geofencing results with the control lines established by disaster response practitioners. The evaluation considers three key metrics: the precision, recall, and F1-score. The precision represents the ratio of the geofencing that overlaps with the actual control line, indicating how well the areas and the control line match. A higher precision value indicates a greater alignment between the proposed method and the control line. The recall represents the area ratio in the actual control line covered by the created area, indicating how much of the control line is captured by the method. A higher recall value indicates that SafeWitness covers more of the control line area. Last, the F1-score combines the precision and recall into a single value by taking their average. The precision, recall, and F1-score are calculated using Equations (8)–(10), respectively:
Precision = True   Positive True   Positive + False   Positive      
Recall = True   Positive True   Positive + False   Negative
F 1 score = 2 Precision   Recall Precision + Recall
RQ1. How can crowdsensing-based geofencing be effectively integrated to dynamically model disaster risk areas?
Figure 9 illustrates the control lines, geofencing, and area without user sampling, visualized on a map of Mojong-ro, Asan City, South Korea. Table 3 provides a quantitative evaluation of the proposed method. The results demonstrate that SafeWitness without user sampling leads to uncontrolled geofencing expansion, as it includes all user trajectories, resulting in a recall value of 100% but low precision values of 6.7% in the hazard zone and 16.3% in the warning zone, yielding low F1-scores of 0.125 and 0.280, respectively.
In contrast, SafeWitness dynamically models disaster risk areas by incorporating crowdsensing-based user sampling, preventing unnecessary geofencing expansion while maintaining high recall. By filtering relevant user movement data, SafeWitness achieves a recall value of 94.7% and an F1-score of 0.793 in the hazard zone, while improving the precision in the warning zone, reaching a recall of 96.5% and an F1-score of 0.796. These results confirm that crowdsensing-based geofencing can be effectively integrated to improve disaster zone modeling, as highlighted in RQ1. By ensuring that geofencing dynamically reflects real-time disaster progression while mitigating over-expansion, the crowdsensing approach enhances the accuracy and adaptability of SafeWitness.
RQ2. How can fractal analysis improve disaster risk detection by modeling the self-similar?
The geofencing expands in a self-similar manner, and the recall increases accordingly. Figure 10 shows the evolution of the geofencing over time. It illustrates how SafeWitness dynamically adapts over time. Initially, the F1-score of the hazard zone decreases until approximately 4 min after the disaster occurrence, primarily due to a temporary decrease in the precision as the geofencing area expands. After 6 min, however, the increase in the recall offsets the loss in precision, so that the F1-score gradually improves. This pattern aligns with the principles of fractal-based disaster propagation modeling, where the irregular spread of the affected area follows self-similar expansion patterns over time.
At the 10 min mark, both the recall and F1-score reach their peak values, confirming that SafeWitness effectively models the complex, evolving structure of the disaster zone. Additionally, in the warning zone, the F1-score remains stable at 2 and 4 min, indicating that SafeWitness maintains the spatial integrity of the geofencing boundaries based on intersection-by-intersection unit changes, a key characteristic of fractal-based modeling.
These findings validate RQ2 by demonstrating that fractal analysis enhances disaster risk detection. The self-similar expansion pattern captured by SafeWitness enables more accurate and adaptive geofencing, allowing for real-time disaster response adjustments while preserving structural consistency.
RQ3. How can SafeWitness optimize geofencing expansion control?
Figure 11 shows a quantitative comparison between SafeWitness and the traditional control line by disaster response practitioners. The results show that SafeWitness effectively controls geofencing expansion through dynamic user sampling and real-time adjustments. Traditional models often suffer from uncontrolled expansion because they include all user trajectories. In contrast, SafeWitness fine-tunes the geofencing by filtering relevant user movements to refine the disaster zone boundaries. Experiments have shown that SafeWitness strikes a balance between disaster coverage and containment accuracy: 10 min after the actual control line is established, SafeWitness reaches its maximum recall and F1-score values, consistent with the actual containment strategy. The system filters out irrelevant user trajectories and adjusts the risk and warning zones based on real-time user movement patterns to avoid unnecessary geofencing growth. This approach minimizes the overestimation of disaster-affected areas while maintaining high recall for effective risk detection. These results validate RQ3 by demonstrating that SafeWitness optimizes the control of geofencing expansion through an adaptive, user-centric mechanism. The system balances responsiveness and accuracy by expanding the disaster zone only when necessary. By leveraging crowdsourced data and geospatial intelligence, SafeWitness provides a scalable and reliable framework for urban disaster management.

4.4. Discussion

This section examines the experimental findings of SafeWitness, focusing on its effectiveness in dynamic geofencing for disaster management and identifying potential challenges that require further research.
SafeWitness enhances disaster response by adopting a user-centric approach instead of relying on expert-driven geofencing models. Traditional geofencing methods define static disaster zones, which remain unchanged despite real-time disaster progression. This limitation reduces adaptability and leads to inefficient resource allocation. Previous studies on geofencing in disaster management [29,30,32] have primarily focused on theoretical implementations and qualitative validation, without providing quantitative assessments of the geofencing effectiveness. These approaches lack empirical performance metrics, making it challenging to evaluate their precision and recall in hazard zone modeling. In contrast, SafeWitness incorporates real-time, crowdsensed user trajectories, enabling the continuous refinement of the hazard and warning zones. The experimental results show that SafeWitness improves the hazard zone accuracy, achieving a 12% increase in the F1-score, and enhances the warning zone precision, with a 55% improvement compared to static geofencing. These findings confirm that crowdsensing strengthens disaster risk modeling and evacuation planning through real-time data adaptation.
SafeWitness further integrates fractal analysis to capture self-similar disaster spread patterns. Unlike conventional models that assume uniform hazard expansion, fractal-based modeling accounts for irregular and evolving disaster dynamics. The experimental results indicate that SafeWitness achieves optimal recall and F1-scores at the 10 min mark, aligning with real-world containment measures. This result validates that SafeWitness accurately predicts disaster-affected areas and effectively addresses the limitations of prior research by offering a quantifiable and adaptive approach to geofencing in disaster response. SafeWitness depends on active user participation for accurate hazard zone detection. In emergency situations, users may be unable to report movement due to network failures, lack of engagement, or crisis priorities. This reliance on crowdsensing may reduce the system performance when data availability is low. Future research should explore hybrid approaches. Combining IoT sensor networks, mobile infrastructure, and expert-defined models may improve the system reliability. Filtering irrelevant user data also remains a challenge. Disaster scenarios create unstructured movement patterns that may distort geofencing boundaries. Without effective filtering, noisy data can affect hazard zone modeling. Future improvements should focus on machine learning-based anomaly detection. Identifying genuine evacuees and removing irrelevant movement patterns will improve the risk zone accuracy.
SafeWitness improves geofencing adaptability by integrating real-time user movement data with expert-defined scenarios. This approach shifts disaster response from static geofencing models to a dynamic, data-driven approach. Fractal analysis improves disaster spread prediction, ensuring that hazard and warning zones adjust to real-world conditions. The controlled expansion mechanism prevents the overestimation of disaster zones and maintains geofencing accuracy. Some challenges remain. The system must ensure sufficient user participation, filter noisy data, scale for large-scale disasters, and integrate with external emergency response systems.

5. Conclusions

Disasters cause severe economic losses and human casualties, especially in urban areas where infrastructure damage and population displacement disrupt social systems. Traditional disaster response methods, reliant on expert-driven domain knowledge, often struggle with complex and unpredictable disaster patterns. Recent advancements in collective intelligence and fractal analysis offer real-time monitoring solutions. This paper presents a crowdsensing-based disaster management approach that integrates behavioral dynamics and fractal analysis to enhance real-time disaster awareness and response. The proposed method generates sequence vectors to model movement patterns during a disaster, integrating real-time witness insights with expert domain knowledge through vector sampling. Leveraging fractal-based modeling, this approach effectively represents the irregular and fragmented nature of disaster-affected areas, enabling more precise disaster spread prediction and segmentation. SafeWitness enhances temporal contextual awareness through collective intelligence, integrating real-time crowdsourced data with road infrastructure to refine GIS-based disaster response. The experimental results validate the effectiveness of this approach, showing that the hazard zone achieved a 12% higher F1-score than traditional domain knowledge-based methods, while the warning zone improved by 55%. These findings underscore the advantages of integrating fractal-based disaster modeling with crowdsensing, providing a scalable, data-driven solution for smart city disaster management. The proposed method requires further potential improvement. In this research, we set the initial disaster area of the method as a single circular shape. However, real-world disasters, such as floods and earthquakes, have irregular shapes in multiple regions. In the future, we could further improve the performance of SafeWitness in nonstructured and simultaneous disasters (flooding, chemical spills, and earthquakes), allowing it to be employed for efficient disaster awareness and management in smart cities.

Author Contributions

Conceptualization, Y.C. and M.K.; Methodology, Y.C., M.S. and M.K.; Software, M.S.; Validation, M.S.; Writing—original draft, Y.C.; Writing—review & editing, K.L.M. and M.K.; Supervision, M.K.; Funding acquisition, M.K. All authors have read and agreed to the published version of the manuscript.

Funding

This research was supported in part by the MSIT (Ministry of Science and ICT), Korea, under the ITRC (Information Technology Research Center) support program (IITP-2024-RS-2024-00438056) supervised by the IITP (Institute for Information & Communications Technology Planning & Evaluation), and it was also supported in part by a Korea Institute for Advancement of Technology (KIAT) grant funded by the Korea Government (MOTIE) (P0012724, The Competency Development Program for Industry Specialist) and in part by a grant (2021-MOIS37-004) from the Intelligent Technology Development Program on Disaster Response and Emergency Management funded by the Ministry of Interior and Safety (MOIS, Korea).

Data Availability Statement

No new data were created or analyzed in this study. Data sharing is not applicable to this article.

Conflicts of Interest

The authors declare that there are no conflicts of interest.

References

  1. Alexander, D.E. Principles of Emergency Planning and Management; Oxford University Press: Oxford, UK, 2002; ISBN 0195218388. [Google Scholar]
  2. Aulov, O.; Halem, M. Human Sensor Networks for Improved Modeling of Natural Disasters. Proc. IEEE 2012, 100, 2812–2823. [Google Scholar] [CrossRef]
  3. Noji, E.K. The Public Health Consequences of Disasters. Prehosp. Disaster Med. 2000, 15, 21–31. [Google Scholar] [CrossRef]
  4. Rodríguez, H.; Quarantelli, E.L.; Dynes, R.R.; Quarantelli, E.L.; Lagadec, P.; Boin, A. A Heuristic Approach to Future Disasters and Crises: New, Old, and in-between Types. In Handbook of Disaster Research; Springer: New York, NY, USA, 2007; pp. 16–41. [Google Scholar]
  5. Besaleva, L.I.; Weaver, A.C. Applications of Social Networks and Crowdsourcing for Disaster Management Improvement. In Proceedings of the 2013 International Conference on Social Computing, Washington, DC, USA, 8–14 September 2013; IEEE: Piscataway, NJ, USA, 2013; pp. 213–219. [Google Scholar]
  6. Sajjad, M.; Chan, J.C.L.; Chopra, S.S. Rethinking Disaster Resilience in High-Density Cities: Towards an Urban Resilience Knowledge System. Sustain. Cities Soc. 2021, 69, 102850. [Google Scholar] [CrossRef]
  7. Alazawi, Z.; Alani, O.; Abdljabar, M.B.; Altowaijri, S.; Mehmood, R. A Smart Disaster Management System for Future Cities. In Proceedings of the 2014 ACM International Workshop on Wireless and Mobile Technologies for Smart Cities, Philadelphia, PA, USA, 11 August 2014; pp. 1–10. [Google Scholar]
  8. Public Safety Canada. Emergency Management Strategy for Canada: Toward a Resilient 2030; Public Safety Canada: Ottawa, ON, Canada, 2019. [Google Scholar]
  9. De Rolt, C.R.; Foschini, L.; Gauthier, F.; Hasse, D.; Montanari, R. Competence-Based Mobile Community Response Networks. In Proceedings of the 2017 IEEE Symposium on Computers and Communications (ISCC), Heraklion, Greece, 3–6 July 2017; IEEE: Piscataway, NJ, USA, 2017; pp. 994–1000. [Google Scholar]
  10. Liu, Z.; Maneekul, P.; Pendergrast, C.; Doubleday, A.; Miles, S.B.; Errett, N.A.; Choe, Y. Physical Activity Monitoring Data Following Disasters. Sustain. Cities Soc. 2022, 81, 103814. [Google Scholar] [CrossRef]
  11. Wei, Z.; Mukherjee, S. Examining Income Segregation within Activity Spaces under Natural Disaster Using Dynamic Mobility Network. Sustain. Cities Soc. 2023, 91, 104408. [Google Scholar] [CrossRef]
  12. Burger, A.; Kennedy, W.G.; Crooks, A. Organizing Theories for Disasters into a Complex Adaptive System Framework. Urban Sci. 2021, 5, 61. [Google Scholar] [CrossRef]
  13. Al Shafian, S.; Hu, D. Integrating Machine Learning and Remote Sensing in Disaster Management: A Decadal Review of Post-Disaster Building Damage Assessment. Buildings 2024, 14, 2344. [Google Scholar] [CrossRef]
  14. Yang, X.; Tang, L.; Ren, C.; Chen, Y.; Xie, Z.; Li, Q. Pedestrian Network Generation Based on Crowdsourced Tracking Data. Int. J. Geogr. Inf. Sci. 2020, 34, 1051–1074. [Google Scholar] [CrossRef]
  15. Gonzato, G.; Mulargia, F.; Marzocchi, W. Practical Application of Fractal Analysis: Problems and Solutions. Geophys. J. Int. 1998, 132, 275–282. [Google Scholar] [CrossRef]
  16. Kantarci, B.; Mouftah, H.T. Trustworthy Sensing for Public Safety in Cloud-Centric Internet of Things. IEEE Internet Things J. 2014, 1, 360–368. [Google Scholar] [CrossRef]
  17. Naik, N. Flooded Streets—A Crowdsourced Sensing System for Disaster Response: A Case Study. In Proceedings of the 2016 IEEE International Symposium on Systems Engineering (ISSE), Edinburgh, UK, 3–5 October 2016; IEEE: Piscataway, NJ, USA, 2016; pp. 1–3. [Google Scholar]
  18. Capponi, A.; Fiandrino, C.; Kantarci, B.; Foschini, L.; Kliazovich, D.; Bouvry, P. A Survey on Mobile Crowdsensing Systems: Challenges, Solutions, and Opportunities. IEEE Commun. Surv. Tutor. 2019, 21, 2419–2465. [Google Scholar] [CrossRef]
  19. Cicek, D.; Kantarci, B. Use of Mobile Crowdsensing in Disaster Management: A Systematic Review, Challenges, and Open Issues. Sensors 2023, 23, 1699. [Google Scholar] [CrossRef]
  20. Poblet, M.; García-Cuesta, E.; Casanovas, P. Crowdsourcing Roles, Methods and Tools for Data-Intensive Disaster Management. Inf. Syst. Front. 2018, 20, 1363–1379. [Google Scholar] [CrossRef]
  21. Falconer, K. Fractal Geometry: Mathematical Foundations and Applications; John Wiley & Sons: Hoboken, NJ, USA, 2013; ISBN 111876286X. [Google Scholar]
  22. Guntha, R.; Rao, S.N.; Ramesh, M. V Architectural Considerations for Building a Robust Crowdsourced Disaster Relief Application. In Proceedings of the 2020 International Conference on COMmunication Systems & NETworkS (COMSNETS), Bengaluru, India, 7–11 January 2020; IEEE: Piscataway, NJ, USA, 2020; pp. 638–641. [Google Scholar]
  23. Karimiziarani, M.; Jafarzadegan, K.; Abbaszadeh, P.; Shao, W.; Moradkhani, H. Hazard Risk Awareness and Disaster Management: Extracting the Information Content of Twitter Data. Sustain. Cities Soc. 2022, 77, 103577. [Google Scholar] [CrossRef]
  24. Xie, J.; Yang, T. Using Social Media Data to Enhance Disaster Response and Community Service. In Proceedings of the 2018 International Workshop on Big Geospatial Data and Data Science (BGDDS), Wuhan, China, 22–23 September 2018; IEEE: Piscataway, NJ, USA, 2018; pp. 1–4. [Google Scholar]
  25. Liu, Q.; Jian, W.; Nie, W. Rainstorm-Induced Landslides Early Warning System in Mountainous Cities Based on Groundwater Level Change Fast Prediction. Sustain. Cities Soc. 2021, 69, 102817. [Google Scholar] [CrossRef]
  26. Zhang, N.; Ni, X.Y.; Huang, H.; Zhao, J.L.; Duarte, M.; Zhang, J. The Impact of Interpersonal Pre-Warning Information Dissemination on Regional Emergency Evacuation. Nat. Hazards 2016, 80, 2081–2103. [Google Scholar] [CrossRef]
  27. Lyu, H.-M.; Yin, Z.-Y. An Improved MCDM Combined with GIS for Risk Assessment of Multi-Hazards in Hong Kong. Sustain. Cities Soc. 2023, 91, 104427. [Google Scholar] [CrossRef]
  28. Tran, P.; Shaw, R.; Chantry, G.; Norton, J. GIS and Local Knowledge in Disaster Management: A Case Study of Flood Risk Mapping in Viet Nam. Disasters 2009, 33, 152–169. [Google Scholar] [CrossRef] [PubMed]
  29. Rodriguez Garzon, S.; Deva, B. Geofencing 2.0: Taking Location-Based Notifications to the next Level. In Proceedings of the 2014 ACM International Joint Conference on Pervasive and Ubiquitous Computing, Seattle, WA, USA, 13–17 September 2014; pp. 921–932. [Google Scholar]
  30. Oliveira, R.R.; Cardoso, I.M.G.; Barbosa, J.L.V.; Da Costa, C.A.; Prado, M.P. An Intelligent Model for Logistics Management Based on Geofencing Algorithms and RFID Technology. Expert. Syst. Appl. 2015, 42, 6082–6097. [Google Scholar] [CrossRef]
  31. Asimakopoulou, E.; Bessis, N.; Sotiriadis, S.; Xhafa, F.; Barolli, L. A Collective Intelligence Resource Management Dynamic Approach for Disaster Management: A Density Survey of Disasters Occurrence. In Proceedings of the 2011 Third International Conference on Intelligent Networking and Collaborative Systems, Fukuoka, Japan, 30 November–2 December 2011; IEEE: Piscataway, NJ, USA, 2011; pp. 735–740. [Google Scholar]
  32. Suyama, A.; Inoue, U. Using Geofencing for a Disaster Information System. In Proceedings of the 2016 IEEE/ACIS 15th International Conference on Computer and Information Science (ICIS), Okayama, Japan, 26–29 June 2016; IEEE: Piscataway, NJ, USA, 2016; pp. 1–5. [Google Scholar]
  33. Vieweg, S.; Palen, L.; Liu, S.B.; Hughes, A.L.; Sutton, J.N. Collective Intelligence in Disaster: Examination of the Phenomenon in the Aftermath of the 2007 Virginia Tech Shooting; University of Colorado: Boulder, CO, USA, 2008. [Google Scholar]
  34. Papadopoulos, G.D.; Pavlidou, F.-N. A Comparative Review on Wildfire Simulators. IEEE Syst. J. 2011, 5, 233–243. [Google Scholar] [CrossRef]
  35. Perry, G.L.W. Current Approaches to Modelling the Spread of Wildland Fire: A Review. Prog. Phys. Geogr. 1998, 22, 222–245. [Google Scholar] [CrossRef]
  36. Weber, R.O. Modelling Fire Spread through Fuel Beds. Prog. Energy Combust. Sci. 1991, 17, 67–82. [Google Scholar] [CrossRef]
  37. Piscitello, A.; Paduano, F.; Nacci, A.A.; Noferi, D.; Santambrogio, M.D.; Sciuto, D. Danger-System: Exploring New Ways to Manage Occupants Safety in Smart Building. In Proceedings of the 2015 IEEE 2nd World Forum on Internet of Things (WF-IoT), Milan, Italy, 14–16 December 2015; IEEE: Piscataway, NJ, USA, 2015; pp. 675–680. [Google Scholar]
  38. Žabota, B.; Kobal, M. A New Methodology for Mapping Past Rockfall Events: From Mobile Crowdsourcing to Rockfall Simulation Validation. ISPRS Int. J. Geoinf. 2020, 9, 514. [Google Scholar] [CrossRef]
  39. Asiminidis, C.; Kokkonis, G.; Kontogiannis, S. BLE Sniffing for Crowd Sensing and Directionality Scanning of Mobile Devices inside Tunnels. In Proceedings of the 2020 3rd World Symposium on Communication Engineering (WSCE), Thessaloniki, Greece, 9–11 October 2020; IEEE: Piscataway, NJ, USA, 2020; pp. 54–58. [Google Scholar]
  40. Seppänen, H.; Virrantaus, K. Shared Situational Awareness and Information Quality in Disaster Management. Saf. Sci. 2015, 77, 112–122. [Google Scholar] [CrossRef]
  41. Sadhu, V.; Salles-Loustau, G.; Pompili, D.; Zonouz, S.; Sritapan, V. Argus: Smartphone-Enabled Human Cooperation for Disaster Situational Awareness via MARL. In Proceedings of the 2017 IEEE International Conference on Pervasive Computing and Communications Workshops (PerCom Workshops), Kona, HI, USA, 13–17 March 2017; IEEE: Piscataway, NJ, USA, 2017; pp. 79–81. [Google Scholar]
  42. Bhattacharjee, S.; Roy, S.; Bit, S. Das Post-Disaster Map Builder: Crowdsensed Digital Pedestrian Map Construction of the Disaster Affected Areas through Smartphone Based DTN. Comput. Commun. 2019, 134, 96–113. [Google Scholar] [CrossRef]
  43. Kitazato, T.; Hoshino, M.; Ito, M.; Sezaki, K. Detection of Pedestrian Flow Using Mobile Devices for Evacuation Guiding in Disaster. J. Disaster Res. 2018, 13, 303–312. [Google Scholar] [CrossRef]
  44. Burkard, S.; Fuchs-Kittowski, F.; de Bhroithe, A.O. Mobile Crowd Sensing of Water Level to Improve Flood Forecasting in Small Drainage Areas. In Environmental Software Systems. Computer Science for Environmental Protection, Proceedings of the 12th IFIP WG 5.11 International Symposium, ISESS 2017, Zadar, Croatia, 10–12 May 2017; Proceedings 12. Springer: Cham, Switzerland, 2017; pp. 124–138. [Google Scholar]
  45. Sarbajna, R.; Eick, C.F.; Laszka, A. DEIMOSBC: A Blockchain-Based System for Crowdsensing after Natural Disasters. In Proceedings of the 2021 3rd Conference on Blockchain Research & Applications for Innovative Networks and Services (BRAINS), Paris, France, 27–30 September 2021; IEEE: Piscataway, NJ, USA, 2021; pp. 17–20. [Google Scholar]
  46. Zheng, J.; Gao, Z.; Ma, J.; Shen, J.; Zhang, K. Deep Graph Convolutional Networks for Accurate Automatic Road Network Selection. ISPRS Int. J. Geoinf. 2021, 10, 768. [Google Scholar] [CrossRef]
  47. Mandelbrot, B. How Long Is the Coast of Britain? Statistical Self-Similarity and Fractional Dimension. Science 1967, 156, 636–638. [Google Scholar] [CrossRef]
  48. Frankhauser, P. The Fractal Approach. A New Tool for the Spatial Analysis of Urban Agglomerations. Population 1998, 53, 205–240. [Google Scholar] [CrossRef]
  49. Lovejoy, S. Area-Perimeter Relation for Rain and Cloud Areas. Science 1982, 216, 185–187. [Google Scholar] [CrossRef]
  50. Yu, W.; Zhang, Y.; Ai, T.; Guan, Q.; Chen, Z.; Li, H. Road Network Generalization Considering Traffic Flow Patterns. Int. J. Geogr. Inf. Sci. 2020, 34, 119–149. [Google Scholar] [CrossRef]
  51. Xing, H.; Jieru, H.; Jiang, Z. How to Build the Fractal Emergency Organization under the Disaster Response for Coastal Cities of China? Int. J. Disaster Risk Reduct. 2023, 89, 103628. [Google Scholar] [CrossRef]
  52. Liu, J.; Dong, C. Understanding the Complex Adaptive Characteristics of Cross-Regional Emergency Collaboration in China: A Stochastic Evolutionary Game Approach. Fractal Fract. 2024, 8, 98. [Google Scholar] [CrossRef]
  53. Sellnow, T.L.; Seeger, M.W.; Ulmer, R.R. Chaos Theory, Informational Needs, and Natural Disasters. J. Appl. Commun. Res. 2002, 30, 269–292. [Google Scholar] [CrossRef]
  54. Jiang, B.; Claramunt, C. Topological Analysis of Urban Street Networks. Environ. Plann B Plann Des. 2004, 31, 151–162. [Google Scholar] [CrossRef]
  55. Barber, C.B.; Dobkin, D.P.; Huhdanpaa, H. The Quickhull Algorithm for Convex Hulls. ACM Trans. Math. Softw. (TOMS) 1996, 22, 469–483. [Google Scholar] [CrossRef]
  56. Pan, X.; Han, C.S.; Dauber, K.; Law, K.H. A Multi-Agent Based Framework for the Simulation of Human and Social Behaviors during Emergency Evacuations. AI Soc. 2007, 22, 113–132. [Google Scholar] [CrossRef]
  57. Azmi, D.I.; Karim, H.A.; Amin, M.Z.M. Comparing the Walking Behaviour between Urban and Rural Residents. Procedia-Soc. Behav. Sci. 2012, 68, 406–416. [Google Scholar] [CrossRef]
  58. Barton, H.; Grant, M.; Guise, R. Shaping Neighbourhoods: A Guide for Health, Sustainability and Vitality; Spon: London, UK, 2003; ISBN 041527852X. [Google Scholar]
  59. Meenakshi, A. Neighborhood Unit and Its Conceptualization in the Contemporary Urban Context. Inst. Town Plan. India J. 2011, 8, 81–87. [Google Scholar]
Figure 1. Overall architecture of SafeWitness.
Fractalfract 09 00156 g001
Figure 2. (a) Physical road network. (b,c) Objectified and generalized GIS road information by intersection in Samdong-ro, Asan City, South Korea.
Fractalfract 09 00156 g002
Figure 3. Simulated hazard zone (red) and warning zone (orange) in Samdong-ro, Asan City, South Korea, used as the assumed site for disaster simulation.
Fractalfract 09 00156 g003
Figure 4. Candidate sequence vector.
Fractalfract 09 00156 g004
Figure 5. Participant sequence vector.
Fractalfract 09 00156 g005
Figure 6. SafeWitness updates based on participant sequence vectors in the assumed disaster simulation site, Samdong-ro, Asan City, South Korea.
Fractalfract 09 00156 g006
Figure 7. Spatial distribution of user classifications and building density for a simulated major fire in a complex facility at Mojong-ro, Asan, South Korea.
Fractalfract 09 00156 g007
Figure 8. Scenario of a simulated major fire in a complex facility at Mojong-ro, Asan, South Korea.
Fractalfract 09 00156 g008
Figure 9. Control lines and the final SafeWitness results over a satellite image of Mojong-ro, Asan, South Korea: (a) hazard zone with user sampling, (b) hazard zone without user sampling, (c) warning zone with user sampling, and (d) warning zone without user sampling.
Fractalfract 09 00156 g009
Figure 10. Temporal evolution of SafeWitness-based smart geofencing in Mojong-ro, Asan, South Korea, following a simulated disaster: (a) 2 min, (b) 4 min, (c) 6 min, and (d) 8 min after the disaster occurrence.
Fractalfract 09 00156 g010
Figure 11. Quantitative comparison of SafeWitness and the control lines.
Fractalfract 09 00156 g011
Table 1. Notations for SafeWitness.
NotationDescription
target x , y Point (x, y) where the disaster occurs
( x n , y n )nth points r distance away from disaster x , y
u h User in the hazard zone
u w User in the warning zone
u s User in the safety zone
candi Candidate
parti Participant
l u ,   before The position where the user (u) was located before
l u , after The position where the user (u) is located after
s v candi Line of the distance or direction of candidate movement
s v parti Line of the distance or direction of participant movement
r Radius
hop Units of intersection away from the hazard zone
Table 2. Comparison of a 400 M walk per 5 min of walking for various groups of residents.
Age GroupsAverage Walking Distance Per 5 min
Current Guidelines (Meters)
Barton, Grant & Guise (2003) [58]Green Neighborhood by JPBD (2011) [59]Azmi (2012) [57]
The elderly and preschoolers400 m400 m368 m
Primary school children400 m
Teenagers and adults393 m
Table 3. Experimental results comparing control lines and SafeWitness in mojong-ro, Asan, South Korea.
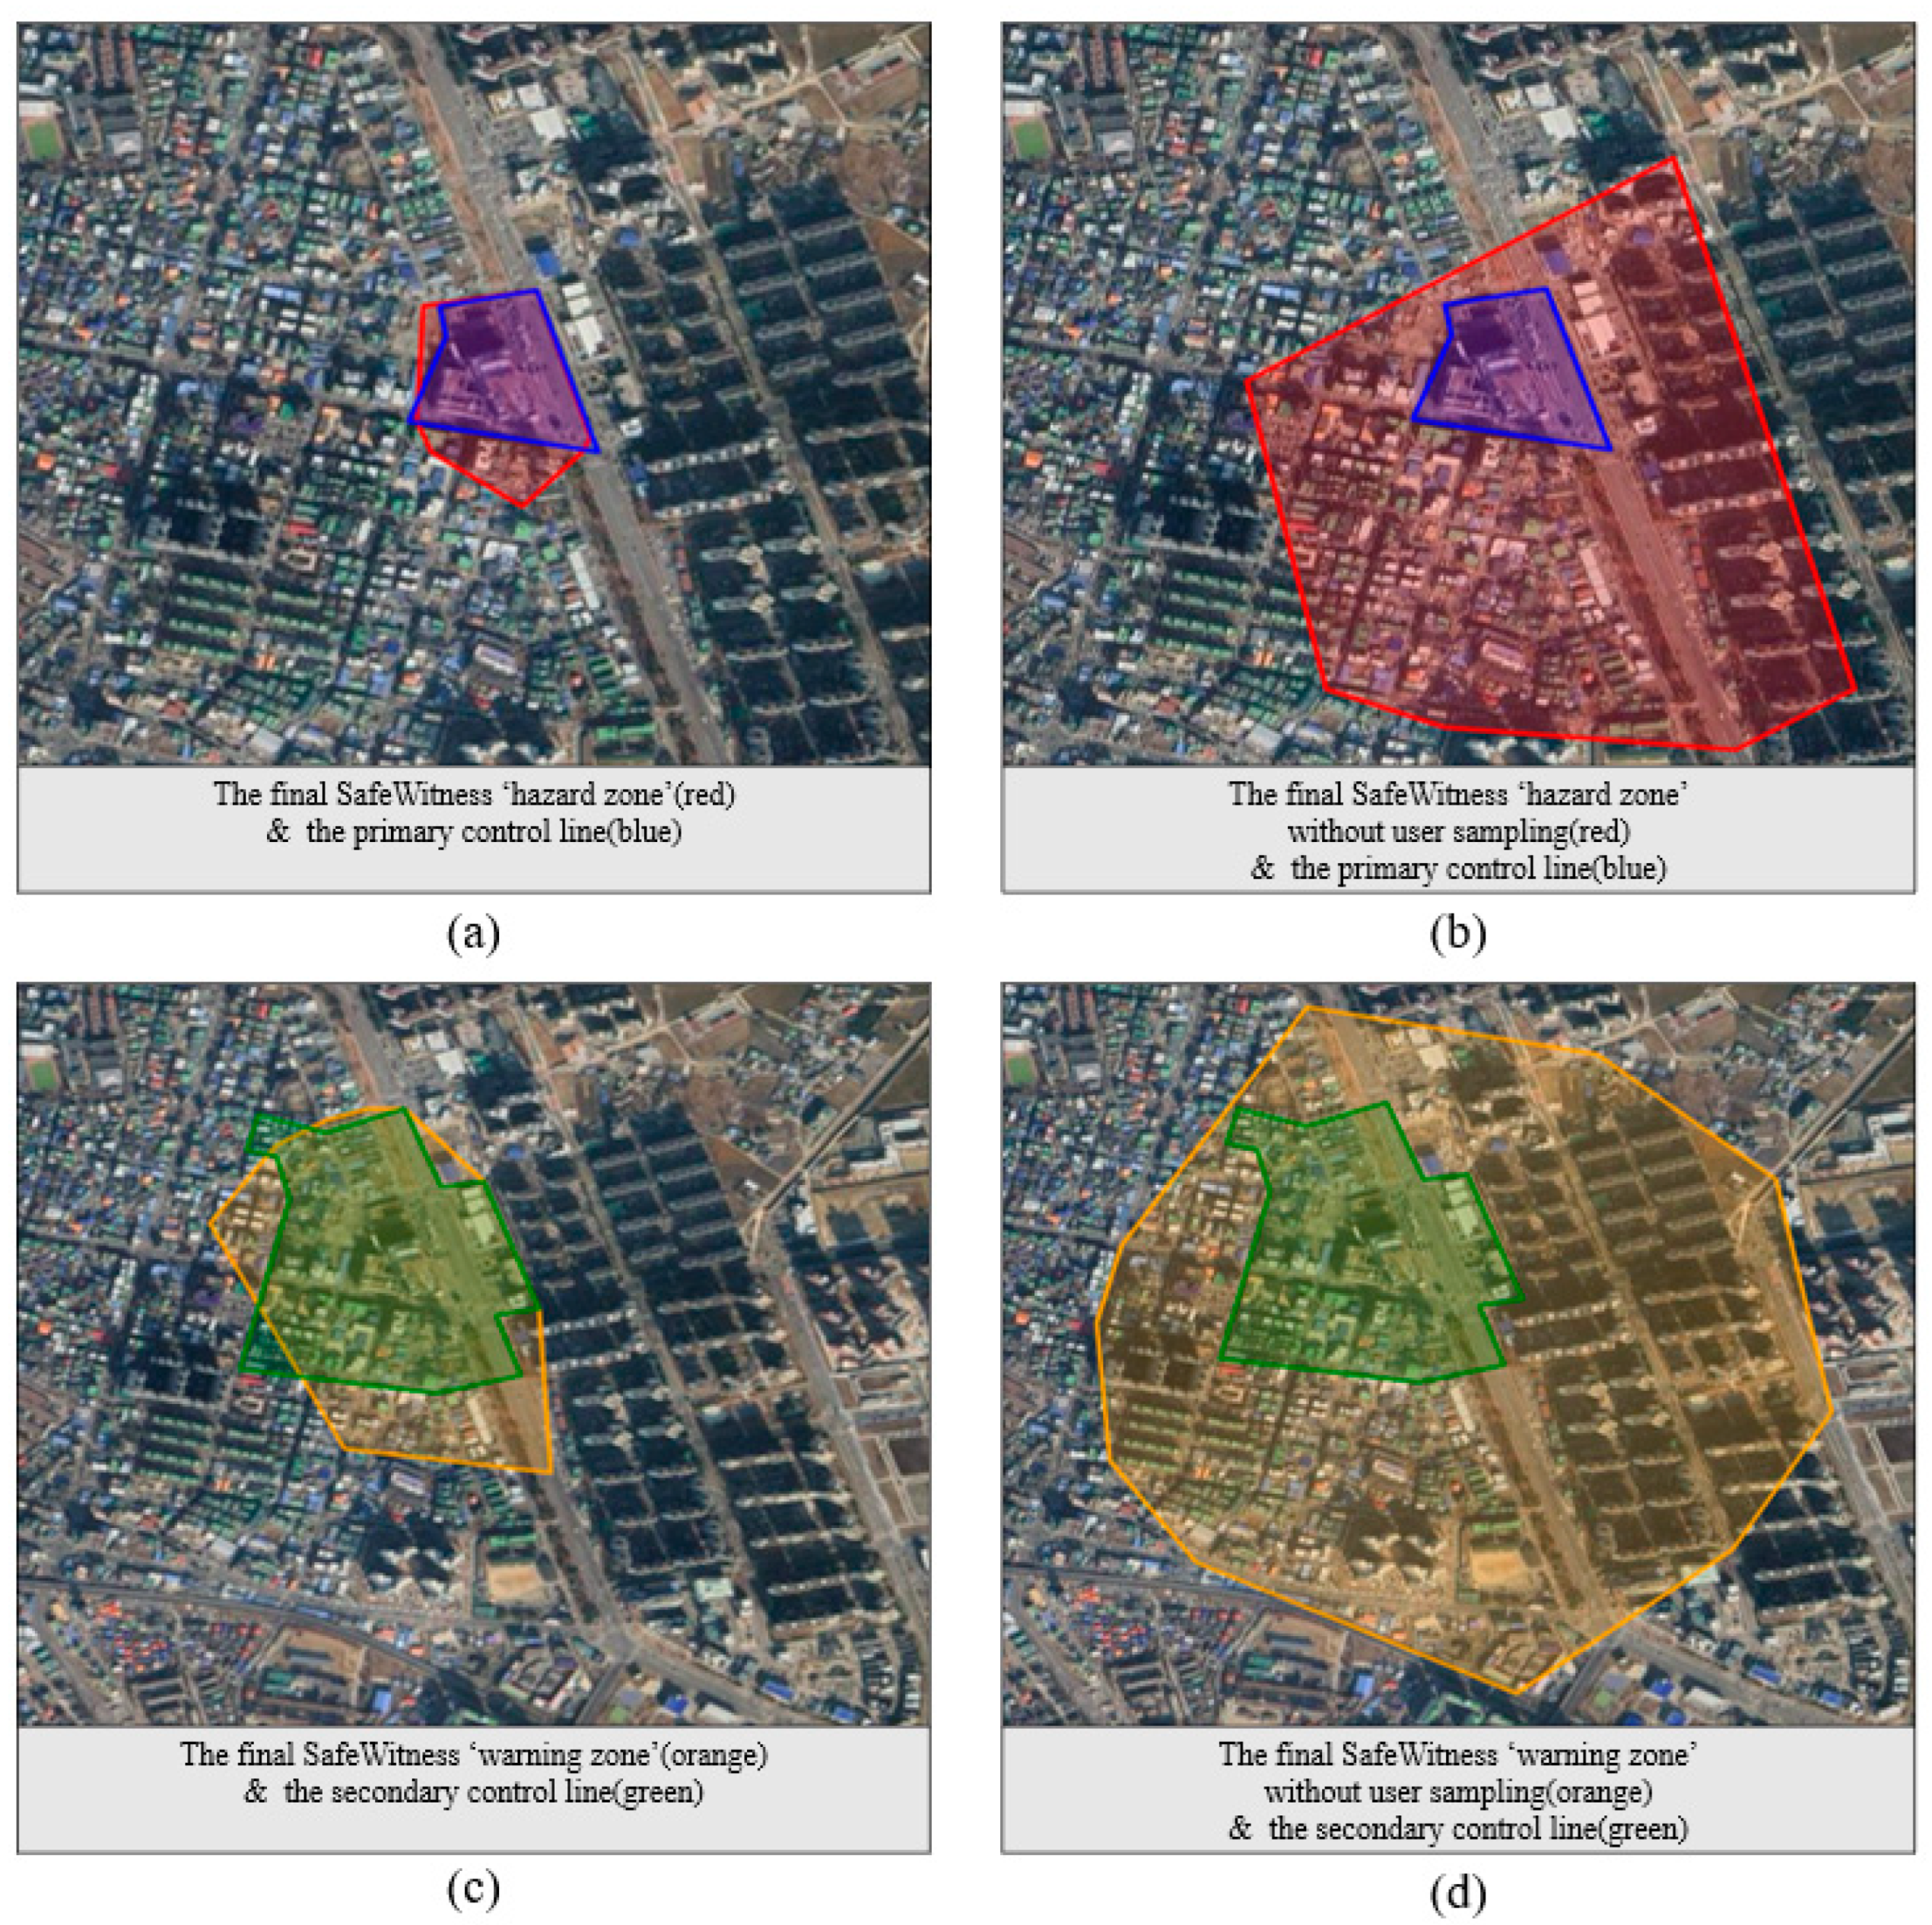
The Primary Control Line (m2)
32,144
Hazard Zone
Area (m2)Overlap (m2)PrecisionRecallF1-Score
SafeWitness without user sampling476,29532,1446.7%100%0.125
Final SafeWitness44,62530,45368.2%94.7%0.793
The Secondary Control Line (m2)
156,956
Warning Zone
Area (m2)Overlap (m2)PrecisionRecallF1-Score
SafeWitness without user sampling958,167156,95916.3%100%0.28
Final SafeWitness44,62530,45367.7%96.5%0.796
Disclaimer/Publisher’s Note: The statements, opinions and data contained in all publications are solely those of the individual author(s) and contributor(s) and not of MDPI and/or the editor(s). MDPI and/or the editor(s) disclaim responsibility for any injury to people or property resulting from any ideas, methods, instructions or products referred to in the content.

