Article

Chaos in Fractional-Order Glucose–Insulin Models with Variable Derivatives: Insights from the Laplace–Adomian Decomposition Method and Generalized Euler Techniques

1
Department of Mathematics, Faculty of Science, Al-Baha University, Al-Baha 65779, Saudi Arabia
2
Department of Mathematics and Statistics, College of Science, Imam Mohammad Ibn Saud Islamic University (IMSIU), Riyadh 11623, Saudi Arabia
3
Department of Mathematics, College of Sciences, Qassim University, Buraydah 51452, Saudi Arabia
*
Author to whom correspondence should be addressed.
These authors contributed equally to this work.
Fractal Fract. 2025, 9(3), 149; https://doi.org/10.3390/fractalfract9030149
Submission received: 25 January 2025 / Revised: 22 February 2025 / Accepted: 23 February 2025 / Published: 27 February 2025

Abstract

This study investigates the complex dynamics and control mechanisms of fractional-order glucose–insulin regulatory systems, incorporating memory-dependent properties through fractional derivatives. Employing the Laplace–Adomian Decomposition Method (LADM) and the Generalized Euler Method (GEM), the research models glucose–insulin interactions with time-varying fractional orders to simulate long-term physiological processes. Key aspects include the derivation of Lyapunov exponents, bifurcation diagrams, and phase diagrams to explore system stability and chaotic behavior. A novel control strategy using simple linear controllers is introduced to stabilize chaotic oscillations. The effectiveness of this approach is validated through numerical simulations, where Lyapunov exponents are reduced from positive values ( λ 1 = 0.123 ) in the uncontrolled system to negative values ( λ 1 = 0.045 ) post-control application, indicating successful stabilization. Additionally, bifurcation analysis demonstrates a shift from chaotic to periodic behavior when control is applied, and time-series plots confirm a significant reduction in glucose–insulin fluctuations. These findings underscore the importance of fractional calculus in accurately modeling nonlinear and memory-dependent glucose–insulin dynamics, paving the way for improved predictive models and therapeutic strategies. The proposed framework provides a foundation for personalized diabetes management, real-time glucose monitoring, and intelligent insulin delivery systems.

1. Introduction

Glucose–insulin dynamics play a critical role in understanding metabolic regulation and managing diseases such as diabetes mellitus, which is a growing global health concern. Mathematical modeling has been instrumental in analyzing these interactions, starting with Himsworth and Ker’s pioneering work in 1939 on insulin sensitivity and Bolie’s foundational mathematical framework in 1961 [1,2]. Since then, numerous models have been proposed to address various aspects of glucose–insulin regulation, including the widely recognized minimal model by Bergman and Cobelli, which provides insights into insulin sensitivity and glucose tolerance tests [3,4]. While traditional integer-order models have contributed significantly to understanding glucose–insulin dynamics, they often fail to capture memory-dependent and long-term hereditary effects inherent in biological systems.
Fractional calculus, with its non-local operators and memory-preserving properties, offers a more versatile framework for modeling complex biological processes [5,6]. Fractional calculus has gained significant attention for its applications in engineering [7], physics [8], plant epidemiology [9], mathematical biology [10], medicine [11], as well as psychological and life sciences [12]. There are numerous interdisciplinary systems that can be adequately represented by fractional differential equations. These include viscoelasticity [13], electromagnetic wave propagation [14], quantum dynamics [15], Lorenz systems [16,17], Langevin systems [18], Liu systems [19], Newton–Leipnik systems [20,21,22], and diabetes [4,23,24,25,26,27,28,29,30,31,32]. Recent studies have demonstrated the applicability of fractional-order models in improving the understanding of physiological systems, particularly in accounting for slow dynamics and time delays [33,34]. Furthermore, fractional derivatives, such as the Atangana–Baleanu and Caputo operators, have been shown to effectively model chaotic systems and provide tools for stabilizing unstable dynamics [35,36]. Key objectives include investigating the system’s stability, bifurcations, and chaotic behavior through phase diagrams, Lyapunov exponents, and bifurcation analysis [37,38]. We propose a new control strategy using simple linear controllers to address the challenges posed by chaotic oscillations. Based on numerical simulations, fractional-order models excel in advancing glucose–insulin dynamics and enabling precise diabetes management strategies [39,40]. Incorporating fractional calculus, chaos theory, and numerical simulations, this study advances the theoretical and practical understanding of glucose–insulin regulation. It highlights the importance of incorporating memory-dependent dynamics and offers a pathway for further research in biological and clinical applications.
This study investigates the complex dynamics and control mechanisms for fractional-order glucose–insulin regulation systems, by incorporating memory-dependent properties into the fractional derivatives in order to incorporate their memory-dependent properties. It uses the help of the Laplace–Adomian Decomposition Method (LADM) and the Generalized Euler Method (GEM). Building on this foundation, the present study introduces a fractional-order glucose–insulin regulatory system with time-varying derivatives to explore the interplay between glucose, insulin, and beta cell populations. Advanced numerical techniques, including the Laplace–Adomian Decomposition Method (LADM) and the Generalized Euler Method (GEM), are employed to solve the model’s complex fractional differential equations [31,41]. The Laplace–Adomian–Padé approximation was proposed by Tsai and Chen [42]. Analytical approximate solutions of fractional differential equations were derived by Zeng et al. [43]. The Laplace transformation coupled with the decomposition method was proposed by Khan et al. [44]. Following [42,43,45], the fractional-order Riccati differential equation has been solved using the LADM. Applications of the Laplace–Adomian–Padé method (LAPM) are presented, and the results obtained are compared with those obtained by the Generalized Euler Method. Odibat and Momani [46] developed the Generalized Euler Method for solving Caputo derivative initial value problems numerically. Analytical solutions to FDEs include the Adomian decomposition method (ADM) [47], Laplace–Adomian decomposition method (LADM) [48], Duan–Rach-modified ADM [49], homotopy analysis method (HAM) [50], multistep generalized differential transform method (MSGDTM) [51], Galerkin finite element method [52], Legendre wavelets method [53], and spectral collocation method [54].
This study models glucose–insulin interactions with time-varying fractional orders to simulate long-term physiological processes through the application of time-varying fractional orders. There are several key aspects of the study that include the derivation of Lyapunov exponents, bifurcation diagrams, and phase diagrams that are used to explore the stability of systems and chaotic behavior of systems. An effective method of stabilizing chaotic oscillations is presented in the study through the use of simple linear controllers, validated through numerical simulations, that introduces a novel control strategy. The results of this study demonstrate that fractional calculus is effective in capturing nonlinear dynamics, which is useful in modeling glucose–insulin systems with a higher degree of accuracy. As a result of this study, we have advanced our understanding of glucose–insulin regulation and are able to make precise diabetes management strategies possible.

2. Glucose–Insulin Model Form

In 1939, Himsworth and Ker introduced the first in vivo measurement of insulin sensitivity through the introduction of an experimental method [1]. It has been demonstrated that mathematical models can be developed with the aim of estimating glucose disappearance and insulin–glucose dynamics in general with the help of mathematical models. In this regard, Bolie is considered one of the pioneers in this field. The simple model that he presented in 1961 [2] can be described as follows by using ordinary differential equations:
d x d t = a 1 x a 2 z + p , d z d t = a 3 x a 4 z
In this equation, x = x ( ι ) represents glucose concentration, z = z ( ι ) represents insulin concentration, and p , a 1 , a 2 , a 3 , a 4 represent parameters. Different authors have also proposed various models (both simple and comprehensive) [3,4]. In the mid-1980s, Bergman and Cobelli proposed what is known as the minimal model of glucose–insulin dynamics, particularly those dealing with insulin sensitivity, which was believed to be the starting point of a real attempt to model glucose–insulin dynamics at the time. This model can basically be summarized as follows:
d x ( ι ) d t = ( p 1 + y ( ι ) ) x ( ι ) + p 1 x b , x ( 0 ) = p 0 , d y ( ι ) d t = p 2 y ( ι ) + p 3 ( z ( ι ) y b ) , y ( 0 ) = 0 , d z ( ι ) d t = p 4 ( x ( ι ) p 5 ) + t p 6 ( z ( ι ) y b ) , z ( 0 ) = p 7 + y b .
Here, x ( ι ) p 5 + = x ( ι ) p 5 if x ( ι ) > p 5 and 0 otherwise. y ( ι ) is an auxiliary function representing the activity of insulin-excitable tissues to absorb glucose from the blood. x b and y b represent the baseline glucose and insulin levels of the subject at each point in time. The parameters p 0 to p 7 are defined accordingly. Despite how the minimal model has been widely used in describing OGTTs and meal tests in a large number of publications, the insulin minima derived from it are still confined to glucose–insulin tests, which remain relatively new. Importantly, this model has made it possible to estimate insulin sensitivity, S z = p 3 / p 2 , without the need for a glucose clamp experiment [3].
By modifying the minimal model, Derouich and Boutayeb introduced additional parameters related to physical exercise [28]:
d x ( ι ) d t = 1 + q 2 z ( ι ) x ( ι ) + p 1 + q 1 x b x ( ι ) , d z ( ι ) d t = p 2 z ( ι ) + p 3 + q 3 z ( ι ) z b .
Here, the parameters q 1 , q 2 , q 3 represent physical exercise factors that enhance glucose and insulin interactions. These parameters reflect how physical activity affects glucose utilization and insulin sensitivity.
Table 1 shows a structured comparison of the Bolie model, Bergman and Cobelli’s minimal model, and Derouich and Boutayeb’s modified model. This is based on their structure, parameter meaning, applicable scenarios, and advantages and disadvantages.
Later advancements, such as the work of Mukhopadhyay et al. (2004), proposed delay differential models for glucose–insulin dynamics [29], while Rajagopal et al. [36] explored the use of fractional-order systems to introduce memory-dependent dynamics [36].
Accordingly, glucose and insulin can be viewed as predators and prey, respectively; therefore, we propose a continuous nonlinear model for insulin–glucose regulation based on Vito Volterra’s prey and predator model [55]. To ensure the model’s comprehensiveness and accuracy, the bilateral influence of the components has also been considered. The proposed model assumes that the derivatives of the variables are cubic functions of the variables themselves. In addition to enhancing the accuracy of the model, the cubic function of variables is also capable of convincingly mimicking insulin’s glucose regulation. The new model is able to depict the state of the glucose–insulin regulatory system under abnormal metabolic conditions as well as the normal state, which was the blind spot of the previous models. Here are the mathematical relationships for the model [56]:
d x ( ι ) d t = a 1 x ( ι ) + a 2 x ( ι ) y ( ι ) + a 3 y 2 ( ι ) + a 4 y 3 ( ι ) + a 5 z ( ι ) + a 6 z 2 ( ι ) + a 7 z 3 ( ι ) + a 20 , d y ( ι ) d t = a 8 x ( ι ) y ( ι ) a 9 x 2 ( ι ) a 10 x 3 ( ι ) + a 11 y ( ι ) ( 1 y ( ι ) ) a 12 z ( ι ) a 13 z 2 ( ι ) a 14 z 3 ( ι ) + a 21 , d z ( ι ) d t = a 15 y ( ι ) + a 16 y 2 ( ι ) + a 17 y 3 ( ι ) a 18 z ( ι ) a 19 y ( ι ) z ( ι ) .
Here, the parameters represent various physiological processes and interactions within the glucose–insulin regulatory system as illustrated in Table 1. The fractional-order form of the ordinary differential glucose–insulin system (1) in the sense of the Liouville–Caputo operator can be written as follows [57]:
D 0 , ι α C x ( ι ) = a 1 x ( ι ) + a 2 x ( ι ) y ( ι ) + a 3 y 2 ( ι ) + a 4 y 3 ( ι ) + a 5 z ( ι ) + a 6 z 2 ( ι ) + a 7 z 3 ( ι ) + a 20 , D 0 , ι α C y ( ι ) = a 8 x ( ι ) y ( ι ) a 9 x 2 ( ι ) a 10 x 3 ( ι ) + a 11 y ( ι ) ( 1 y ( ι ) ) a 12 z ( ι ) a 13 z 2 ( ι ) a 14 z 3 ( ι ) + a 21 , D 0 , ι α C z ( ι ) = a 15 y ( ι ) + a 16 y 2 ( ι ) + a 17 y 3 ( ι ) a 18 z ( ι ) a 19 y ( ι ) z ( ι ) .
This fractional-order framework provides enhanced flexibility in modeling memory effects, enabling accurate long-term predictions of glucose–insulin interactions. Advanced numerical schemes, including the Laplace–Adomian Decomposition Method (LADM) and Generalized Euler Method (GEM), have been applied to study such systems, achieving high accuracy in capturing complex dynamics [5,33].
Control fractional order of a time-varying fractional glucose–insulin regulatory system (2) is given by
D 0 , ι α C x ( ι ) = a 1 x ( ι ) + a 2 x ( ι ) y ( ι ) + a 3 y 2 ( ι ) + a 4 y 3 ( ι ) + a 5 z ( ι ) + a 6 z 2 ( ι ) + a 7 z 3 ( ι ) + a 20 d 1 ( y + z ) , D 0 , ι α C y ( ι ) = a 8 x ( ι ) y ( ι ) a 9 x 2 ( ι ) a 10 x 3 ( ι ) + a 11 y ( ι ) ( 1 y ( ι ) ) a 12 z ( ι ) a 13 z 2 ( ι ) a 14 z 3 ( ι ) + a 21 , D 0 , ι α C z ( ι ) = a 15 y ( ι ) + a 16 y 2 ( ι ) + a 17 y 3 ( ι ) a 18 z ( ι ) a 19 y ( ι ) z ( ι ) d 2 ( x + y + z ) .
Model (2) requires us to examine the system equations and assumptions modified in [55]. Based on nonlinear glucose–insulin interactions, the proposed model integrates memory-dependent effects using fractional derivatives. The derivation likely involves the following: extending the existing prey–predator framework from [55] to include fractional-order dynamics; introducing higher-order nonlinear terms (e.g., cubic functions) for better physiological representation; applying fractional-order derivatives (e.g., the Liouville–Caputo operator) to capture long-term effects; and incorporating control terms for chaos stabilization. In order to clarify whether the parameter definition still makes sense, we should compare it with [55]. As long as the key biological meanings (such as insulin production rates and glucose absorption rates) remain aligned with physiological processes, the definitions remain valid. Otherwise, adjustments may be needed. Rajagopal et al. [57] also examined chaotic dynamics in a fractional-order glucose–insulin system, indicating a similar direction of research. However, the current model extends this by using advanced numerical techniques like the Laplace–Adomian Decomposition Method (LADM) and Generalized Euler Method (GEM).
The proposed model extends previous glucose–insulin regulatory systems using fractional-order derivatives and chaos control methods. To validate the obtained results in a biomedical context, experimental data from clinical studies and glucose tolerance tests can be used. Possible Experimental Datasets for Comparison: IVGTT (Intravenous Glucose Tolerance Test) Data. Bergman et al. [3] proposed a minimal model based on IVGTT data. Studies like Alshehri et al. [23] have used IVGTT data for fractional-order glucose–insulin models.

3. Computing Numerical Techniques

3.1. The Laplace–Adomian Decomposition Method

The Laplace–Adomian Decomposition Method (LADM) is a powerful analytical and semi-analytical technique used to solve linear and nonlinear differential equations, including fractional-order differential equations. It combines the Laplace transform and the Adomian Decomposition Method (ADM), facilitating the solution of complex nonlinear problems without requiring linearization or perturbation. Consider a general nonlinear differential equation of the form
D α y ( t ) + N ( y ) = f ( t ) , 0 < α 1 ,
where D α denotes the fractional derivative in the Caputo sense, N ( y ) represents a nonlinear operator, and f ( t ) is a given source term.
Taking the Laplace transform on both sides of the differential equation:
L { D α y ( t ) } + L { N ( y ) } = L { f ( t ) } .
Using the Laplace transform of the Caputo derivative
L { D α y ( t ) } = s α Y ( s ) s α 1 y ( 0 ) ,
we obtain
s α Y ( s ) s α 1 y ( 0 ) + L { N ( y ) } = F ( s ) ,
where Y ( s ) = L { y ( t ) } and F ( s ) = L { f ( t ) } .
Rewriting the equation,
Y ( s ) = y ( 0 ) s α 1 s α + F ( s ) L { N ( y ) } s α .
We express the unknown function y ( t ) and the nonlinear term N ( y ) as infinite series:
y ( t ) = n = 0 y n ( t ) , N ( y ) = n = 0 A n ,
where A n are the Adomian polynomials representing the nonlinear part.
Adomian polynomials are generated using the following general formula:
A n = 1 n ! d n d λ n N k = 0 λ k y k λ = 0 ,
For a nonlinear term like N ( y ) = y 2 , the first few Adomian polynomials are
A 0 = y 0 2 , A 1 = 2 y 0 y 1 , A 2 = 2 y 0 y 2 + y 1 2 , A 3 = 2 y 0 y 3 + 2 y 1 y 2 .
Substituting these series into the transformed equation gives:
Y ( s ) = y ( 0 ) s α 1 s α + F ( s ) s α n = 0 L { A n } s α .
We match terms of equal powers to obtain the recursive relation for Y n ( s ) and apply the inverse Laplace transform to find y n ( t ) iteratively.

3.2. Convergence Analysis of LADM

Ensuring the convergence of the Laplace–Adomian Decomposition Method (LADM) is crucial for the reliability of the obtained approximate solutions. The method’s convergence depends on the following:
  • The decomposition of nonlinear terms into Adomian polynomials.
  • The boundedness of the resulting series solution.
  • The properties of the Laplace transform and inverse transform applied to each term.
To establish convergence, consider the general nonlinear fractional-order differential equation:
D α y ( t ) + N ( y ) = f ( t ) , 0 < α 1 ,
where D α denotes the Caputo fractional derivative, N ( y ) represents a nonlinear operator, and f ( t ) is a given source term.
Applying the Laplace transform,
L { D α y ( t ) } + L { N ( y ) } = L { f ( t ) } .
Using the Laplace transform of the Caputo derivative,
L { D α y ( t ) } = s α Y ( s ) s α 1 y ( 0 ) ,
we obtain
s α Y ( s ) s α 1 y ( 0 ) + L { N ( y ) } = F ( s ) .
Rewriting the equation,
Y ( s ) = y ( 0 ) s α 1 s α + F ( s ) L { N ( y ) } s α .
The unknown function y ( t ) and the nonlinear term N ( y ) are expanded as infinite series:
y ( t ) = n = 0 y n ( t ) , N ( y ) = n = 0 A n ,
where A n are the Adomian polynomials representing the nonlinear part. The recursive relation for Y n ( s ) is then derived iteratively and solved using the inverse Laplace transform.

3.3. Sufficient Conditions for Convergence

A sufficient condition for the convergence of the LADM series solution is that the infinite series y n ( t ) is absolutely convergent. This can be established using the Banach Fixed Point Theorem, which states that if an operator T is a contraction mapping, i.e.,
T ( y 1 ) T ( y 2 ) c y 1 y 2 , 0 < c < 1 ,
then the iteration converges to a unique fixed point. Applying this to the LADM formulation, we define the operator:
T ( y ) = L 1 F ( s ) s α L { N ( y ) } s α .
If T satisfies the contraction condition, then the sequence { y n } converges to the exact solution.
Additionally, the Lipschitz condition for N ( y ) ,
| N ( y 1 ) N ( y 2 ) |   L | y 1 y 2 | , L < 1 ,
ensures uniform convergence of the series solution.

3.4. Practical Implications

The following must be considered:
  • The rate of convergence depends on the choice of initial approximations and the properties of the nonlinear term.
  • Faster convergence is achieved when the nonlinear term has a small Lipschitz constant, ensuring that the Adomian series expansion converges rapidly.
  • The method is particularly effective for problems where the Laplace transform simplifies the fractional derivative terms, leading to explicit recursive solutions.
Thus, under appropriate conditions on the problem parameters and initial values, LADM provides a stable and convergent series solution for fractional differential equations.

3.5. The Generalized Euler Method

The extended Euler’s method for the numerical solution of initial value problems (2) with Caputo derivatives was derived by Odibat and Momani [41]. First, let us look at the starting value problem. If x, D α x , and D 2 α x are continuous on [ 0 , b ] and a 1 , , a n are positive integer constants, then it follows from (2) that there is a value a 1 for each value t, which implies that
x ( ι ) = x ( ι 0 ) + ( D α x ( ι ) ) ( ι 0 ) t α Γ ( α + 1 ) + ( D 2 α x ( ι ) ) ( a 1 ) t 2 α Γ ( 2 α + 1 ) .
Substituting ( D α x ( ι ) ) ( ι 0 ) = f ( ι 0 , x ( ι 0 ) ) and h = ι 1 into Equation (4) yields an equation for x ( ι 1 ) :
x ( ι 1 ) = x ( ι 0 ) + f ( ι 0 , x ( ι 0 ) ) h α Γ ( α + 1 ) + ( D 2 α x ( ι ) ) ( a 1 ) h 2 α Γ ( 2 α + 1 ) .
The second-order term (involving h 2 α ) may be neglected if the step size h is sufficiently short, allowing us to obtain
x ( ι 1 ) = x ( ι 0 ) + h α Γ ( α + 1 ) f ( ι 0 , x ( ι 0 ) ) .
Repeating this procedure yields a series of points that approximates the solution x ( ι ) . This iterative general formula for GEM when ι j + 1 = ι j + h is
x ( ι j + 1 ) = x ( ι j ) + h α Γ ( α + 1 ) f ( ι j , x ( ι j ) ) ,
for j = 0 , 1 , , k 1 with f ( ι j , x ( ι j ) ) represents the right-hand side of the differential equation, h is the time step size, α is the fractional order, and Γ ( · ) is the Gamma function. The step size h must satisfy 0 < h α Γ ( α + 1 ) < 1 to ensure numerical stability.
Following (5), for the given system, let x n , y n , z n represent the approximations of x ( ι ) , y ( ι ) , z ( ι ) at the n-th step ( ι = n · h ). The update equations for GEM are as follows:
x n + 1 = x n + h α Γ ( α + 1 ) a 1 x n + a 2 x n y n + a 3 y n 2 + a 4 y n 3 + a 5 z n + a 6 z n 2 + a 7 z n 3 + a 20 , y n + 1 = y n + h α Γ ( α + 1 ) a 8 x n y n a 9 x n 2 a 10 x n 3 + a 11 y n ( 1 y n ) a 12 z n a 13 z n 2 a 14 z n 3 + a 21 , z n + 1 = z n + h α Γ ( α + 1 ) a 15 y n + a 16 y n 2 + a 17 y n 3 a 18 z n a 19 y n z n .
The steps to apply GEM to this system are as follows:
  • Initialize: Set the initial conditions x ( 0 ) = x 0 , y ( 0 ) = y 0 , z ( 0 ) = z 0 . Choose a fractional order α , step size h, and total number of steps N.
  • Iterate: For n = 0 , 1 , , N 1 , update x n + 1 , y n + 1 , z n + 1 using the discretized equations.
  • Output: Store the results for each time step ι n = n · h , producing the time series for x ( ι ) , y ( ι ) , z ( ι ) .
The selection of step size h and fractional order α plays a crucial role in ensuring the accuracy, stability, and efficiency of the Generalized Euler Method (GEM). The step size h must be chosen to satisfy the stability condition:
0 < h α Γ ( α + 1 ) < 1 ,
where Γ ( · ) is the Gamma function. This constraint is particularly important for fractional-order systems, where non-local memory effects influence numerical approximations. A smaller h improves accuracy but increases computational cost, requiring a balance between precision and efficiency. Adaptive step size strategies can be employed to dynamically adjust h, particularly in regions where the solution exhibits rapid variations.
The fractional order α determines the extent of memory dependence in the system and should be chosen based on empirical or physiological considerations. Sensitivity analysis is recommended to investigate the impact of α on system behavior. In glucose–insulin modeling, values in the range 0.9 α 1 are commonly used to capture long-term dependencies while maintaining numerical feasibility. Notably, reducing α below 1 can lead to oscillatory or chaotic dynamics, emphasizing the need for careful selection.
Thus, the appropriate choices of h and α should be guided by theoretical stability constraints, numerical experimentation, and practical considerations relevant to glucose–insulin regulation. By optimizing these parameters, the GEM approach ensures reliable simulations of complex biological interactions, including stability transitions, oscillatory patterns, and chaotic regimes.

4. Results

4.1. Applying the Laplace–Adomian Decomposition Method

We apply the Laplace transform on both sides of model (2) with initial conditions as follows:
x ( 1 ) = 0 , y ( 1 ) = 1.5, z ( 1 ) = 1 .
Let X ( s ) = L { x ( ι ) } , Y ( s ) = L { y ( ι ) } , Z ( s ) = L { z ( ι ) } .
s α X ( s ) s α 1 x ( 1 ) = a 1 X ( s ) + a 2 L { x ( ι ) y ( ι ) } + + a 7 L { z ( ι ) 3 } + a 20 , s α Y ( s ) s α 1 y ( 1 ) = a 8 L { x ( ι ) y ( ι ) } a 9 L { x ( ι ) 2 } + + a 21 , s α Z ( s ) s α 1 z ( 1 ) = a 15 L { y ( ι ) } + .
Substitute the initial conditions x ( 1 ) = 0 , y ( 1 ) = 1.5 , and z ( 1 ) = 1 :
s α X ( s ) = a 1 X ( s ) + a 2 L { x ( ι ) y ( ι ) } + + a 7 L { z ( ι ) 3 } + a 20 , s α Y ( s ) 1.5 s α 1 = a 8 L { x ( ι ) y ( ι ) } a 9 L { x ( ι ) 2 } + + a 21 , s α Z ( s ) s α 1 = a 15 L { y ( ι ) } + .
Assume the solution as a series expansion:
x ( ι ) = k = 0 x k ( ι ) , y ( ι ) = k = 0 y k ( ι ) , z ( ι ) = k = 0 z k ( ι ) .
The nonlinear terms such as x ( ι ) y ( ι ) , y ( ι ) 2 , and z ( ι ) 3 are decomposed using Adomian polynomials. For example, for the term x ( ι ) y ( ι ) ,
x ( ι ) y ( ι ) = k = 0 A k ,
where A k are Adomian polynomials.
For the first terms,
L { x 0 ( ι ) } = 0 s , L { y 0 ( ι ) } = 1.5 s , L { z 0 ( ι ) } = 1 s .
Thus,
x 0 ( ι ) = 0 , y 0 ( ι ) = 1.5, z 0 ( ι ) = 1 .
For higher-order terms, use the recursive relation:
L { x 1 ( ι ) } = 1 s α a 1 L { x 0 ( ι ) } + a 2 L { A 0 } + ,
and similarly for y 1 ( ι ) and z 1 ( ι ) .
The final solution is obtained as a series:
x ( ι ) = x 0 ( ι ) + x 1 ( ι ) + x 2 ( ι ) +
y ( ι ) = y 0 ( ι ) + y 1 ( ι ) + y 2 ( ι ) +
z ( ι ) = z 0 ( ι ) + z 1 ( ι ) + z 2 ( ι ) +
As a result, one obtains the approximate solution to system (2) as illustrated in Table 2.

4.2. Simulation Parameters

To ensure accurate numerical approximations, the simulations were conducted using a step size of h = 0.01 and a total of N time steps. The choice of h was based on the stability condition:
0 < h α Γ ( α + 1 ) < 1 ,
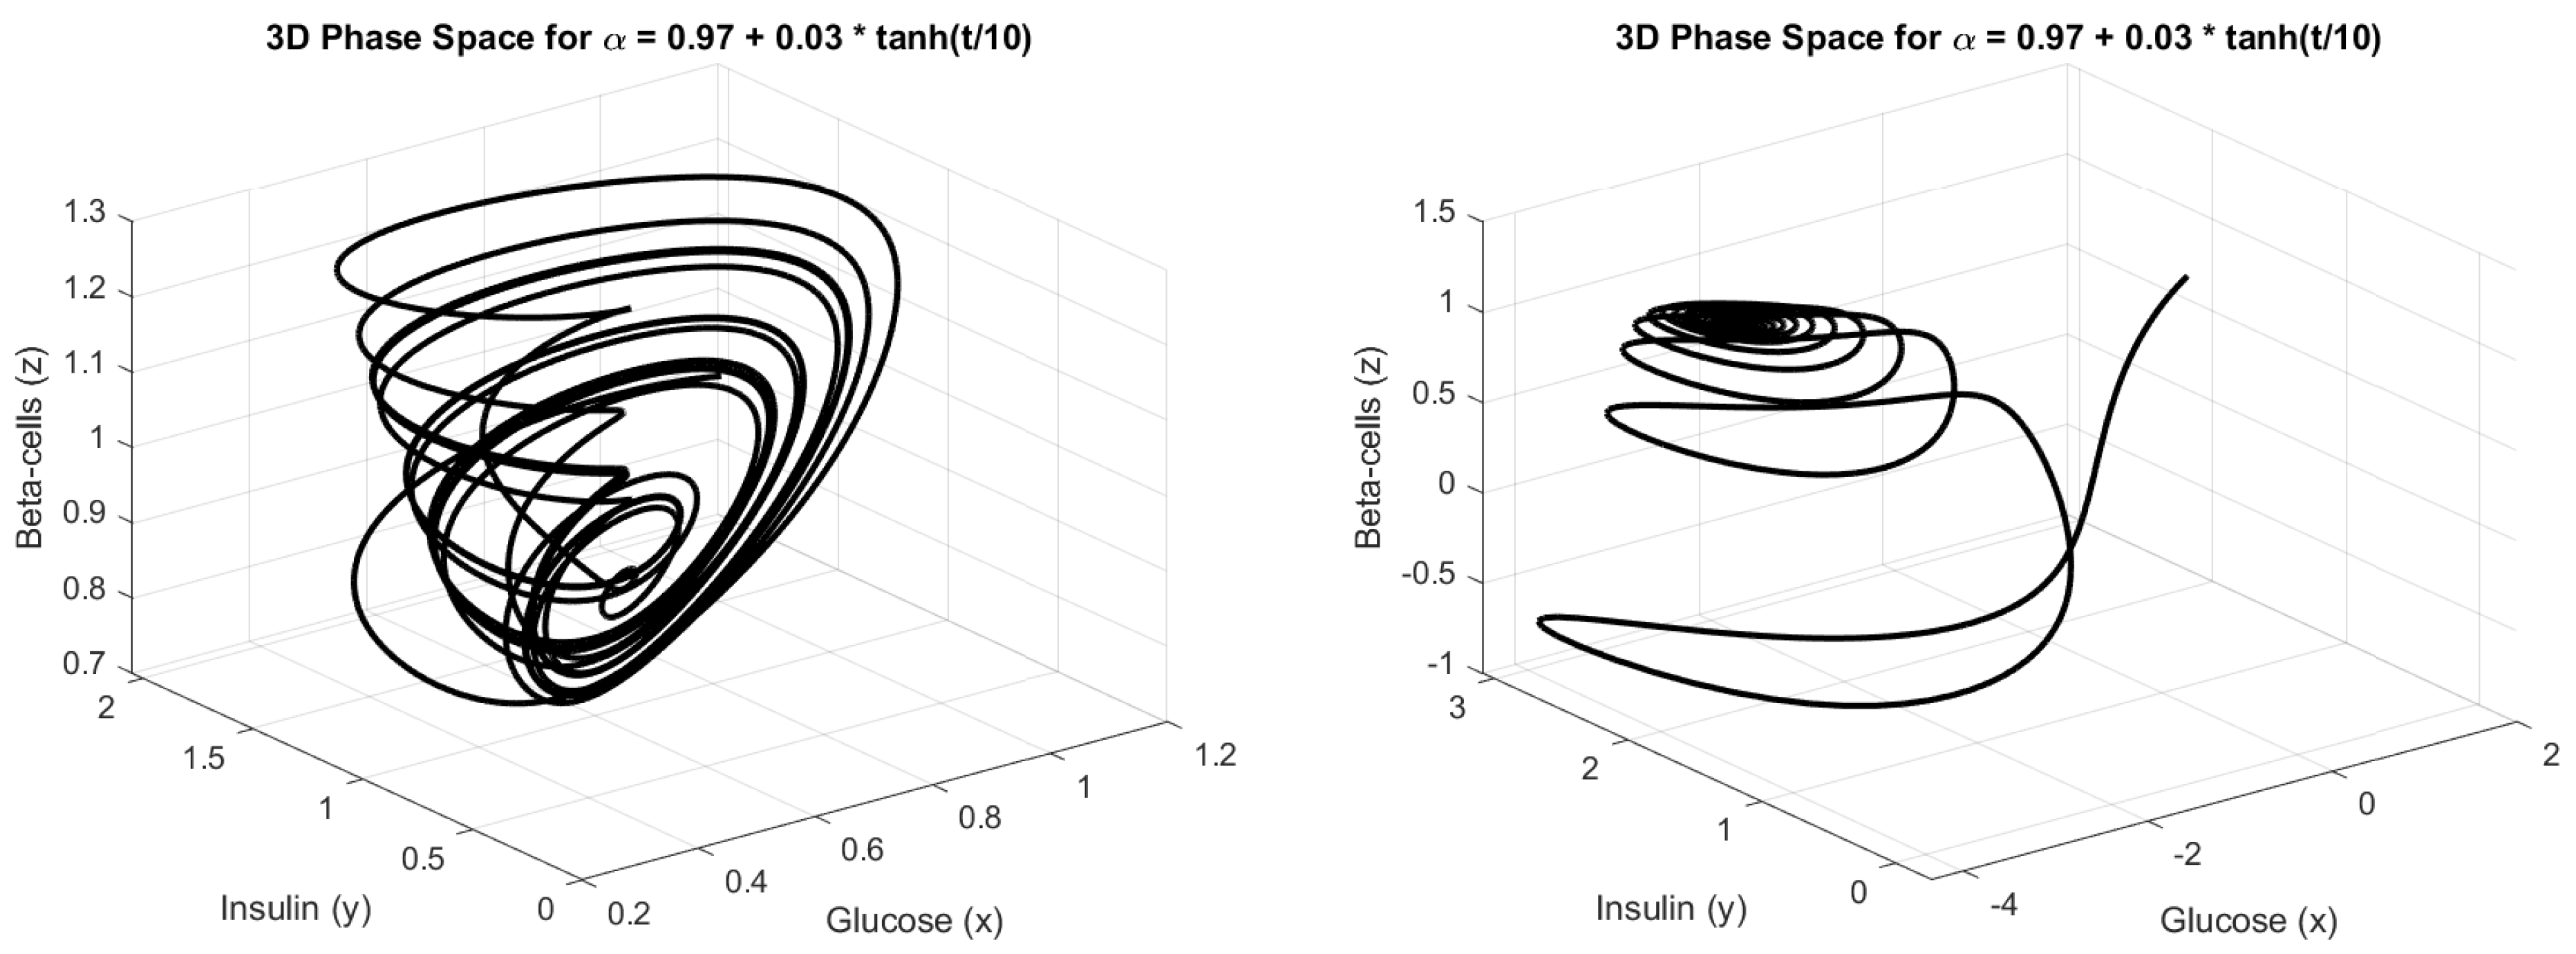
which ensures that the fractional-order system remains numerically stable. The total number of steps N was selected to sufficiently capture the long-term dynamics of glucose–insulin interactions while maintaining computational efficiency. For different fractional orders α , including α = 1 , α = 0.98 , and time-dependent variations, these parameters were kept consistent to allow for a direct comparison of their effects on system behavior. These parameter choices facilitated the investigation of stability transitions, oscillatory behaviors, and chaotic regimes in the glucose–insulin system, as depicted in Figure 1, Figure 2, Figure 3, Figure 4, Figure 5 and Figure 6.

4.3. Numerical Simulation

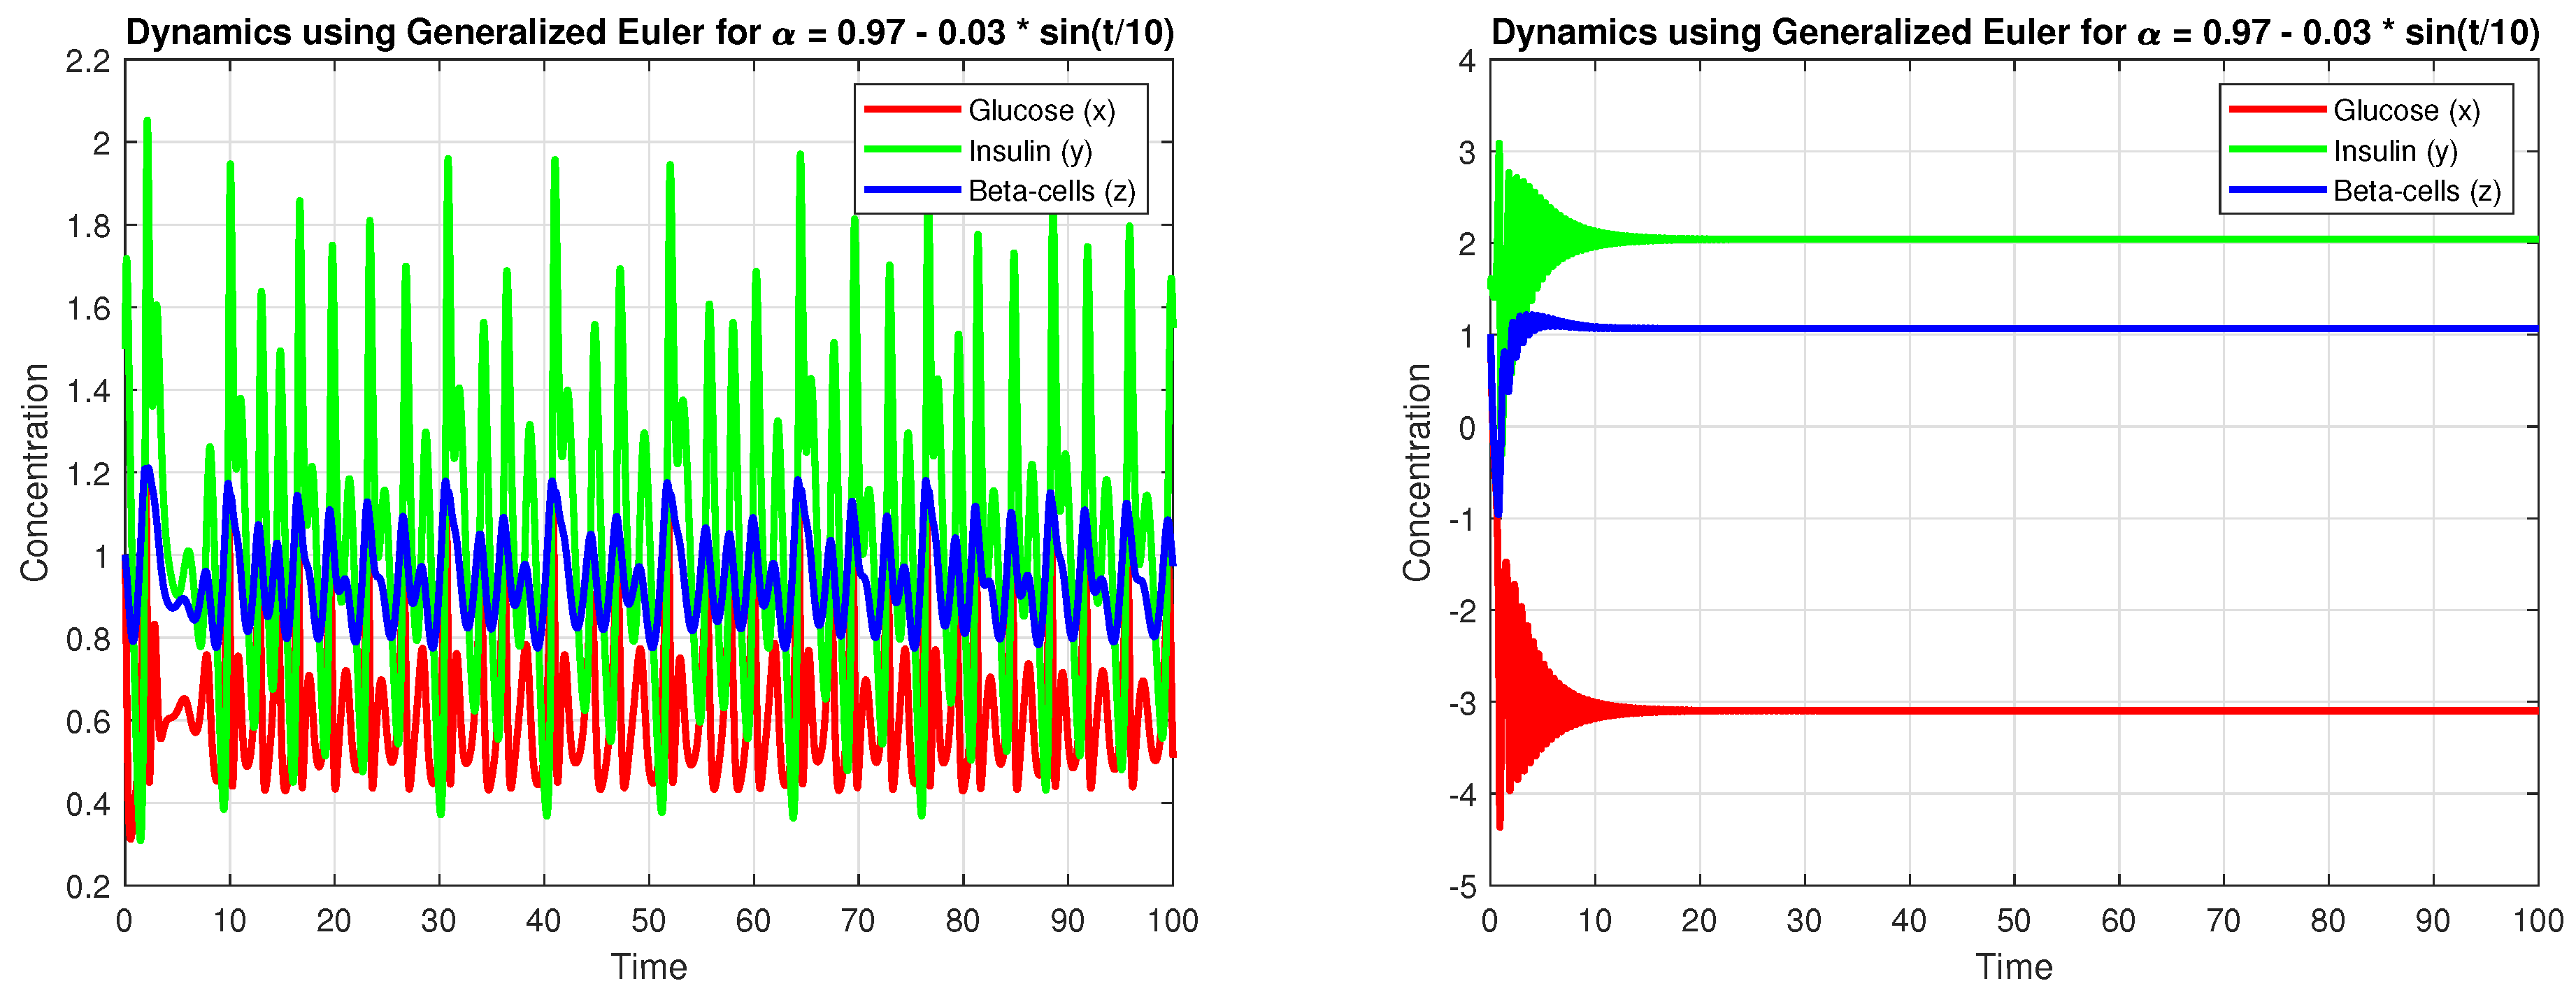
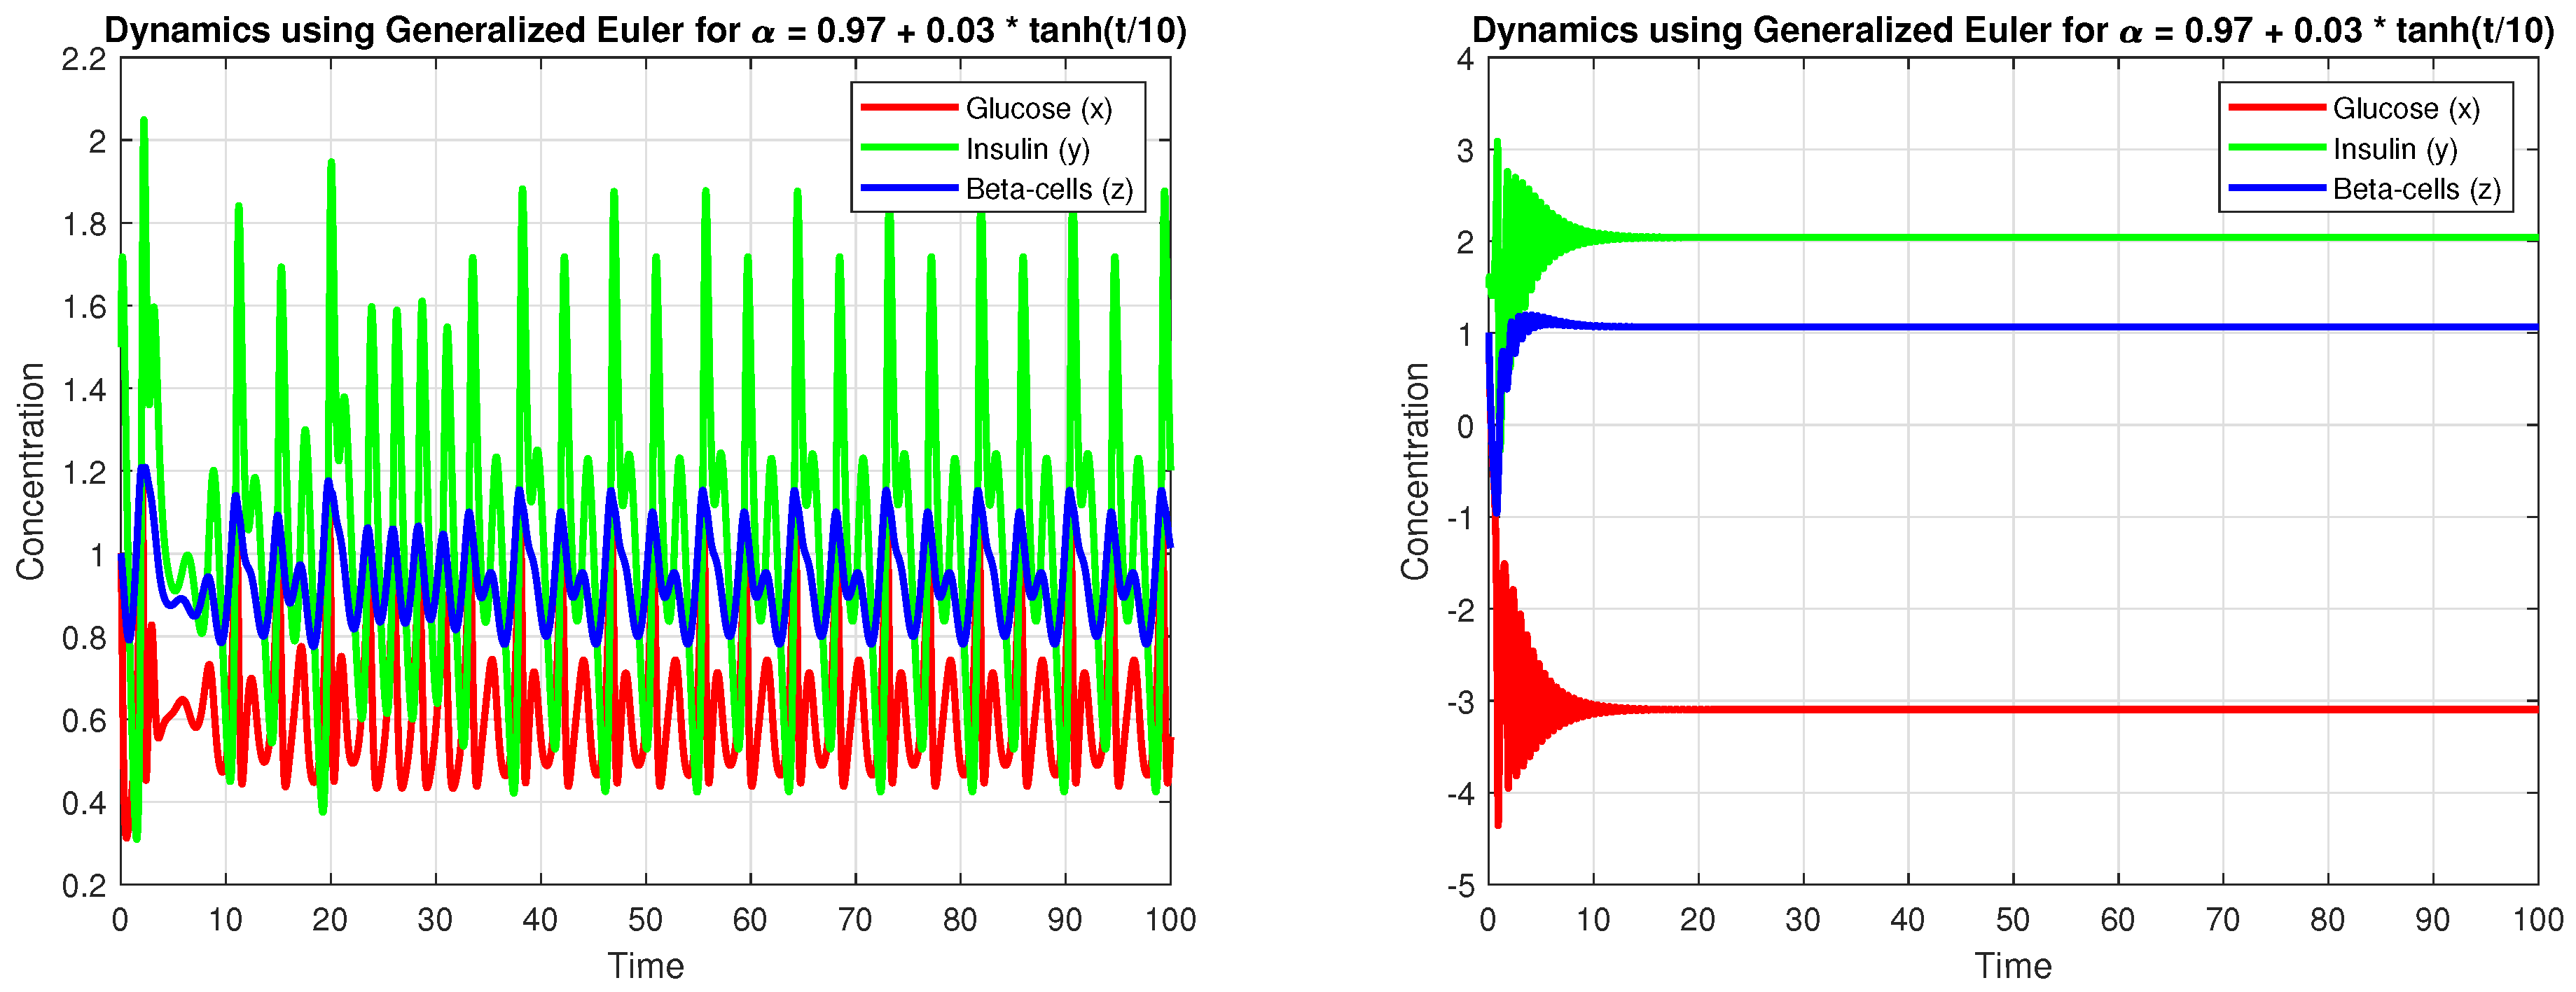
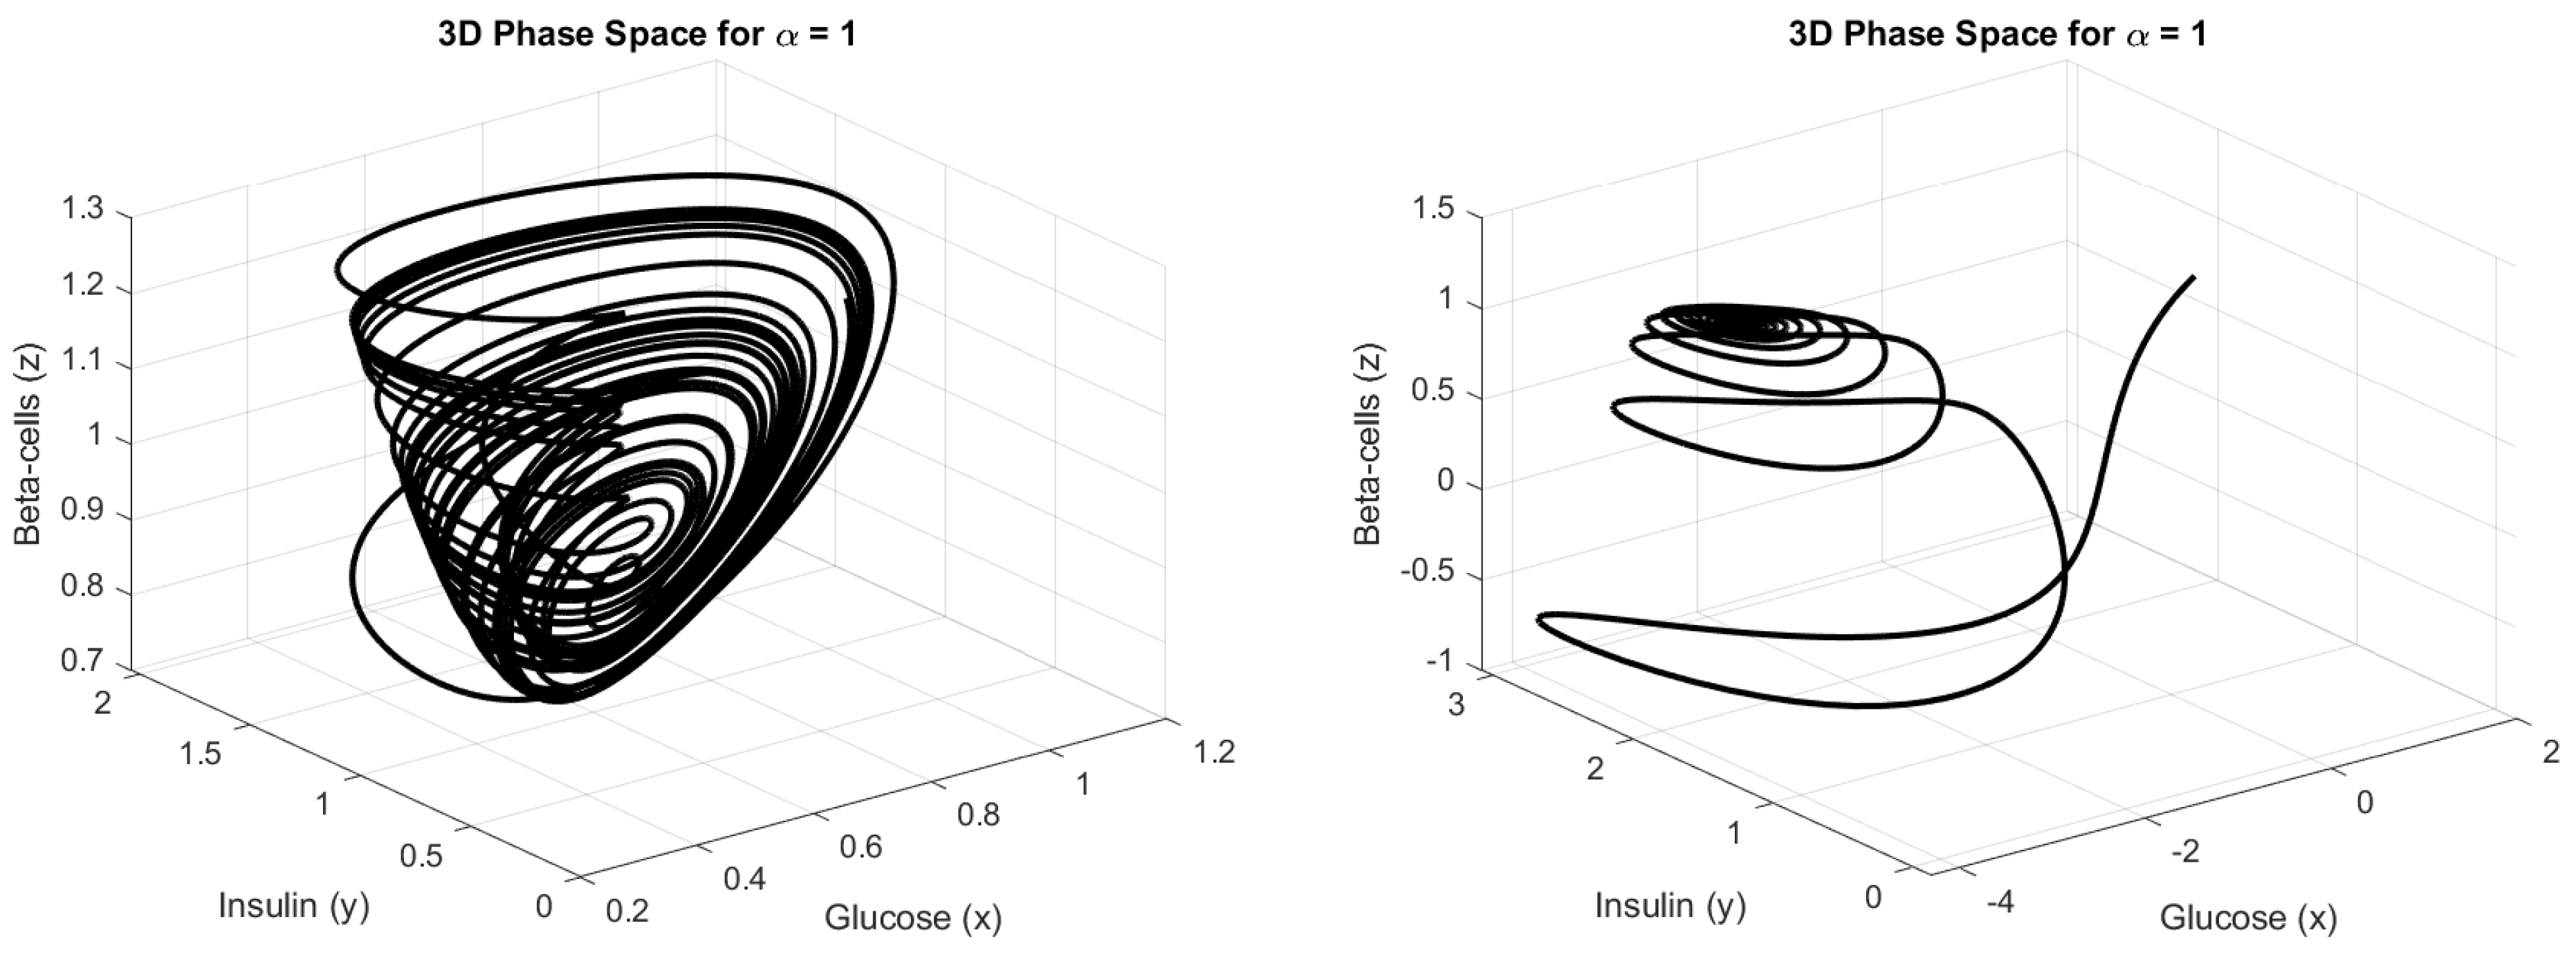
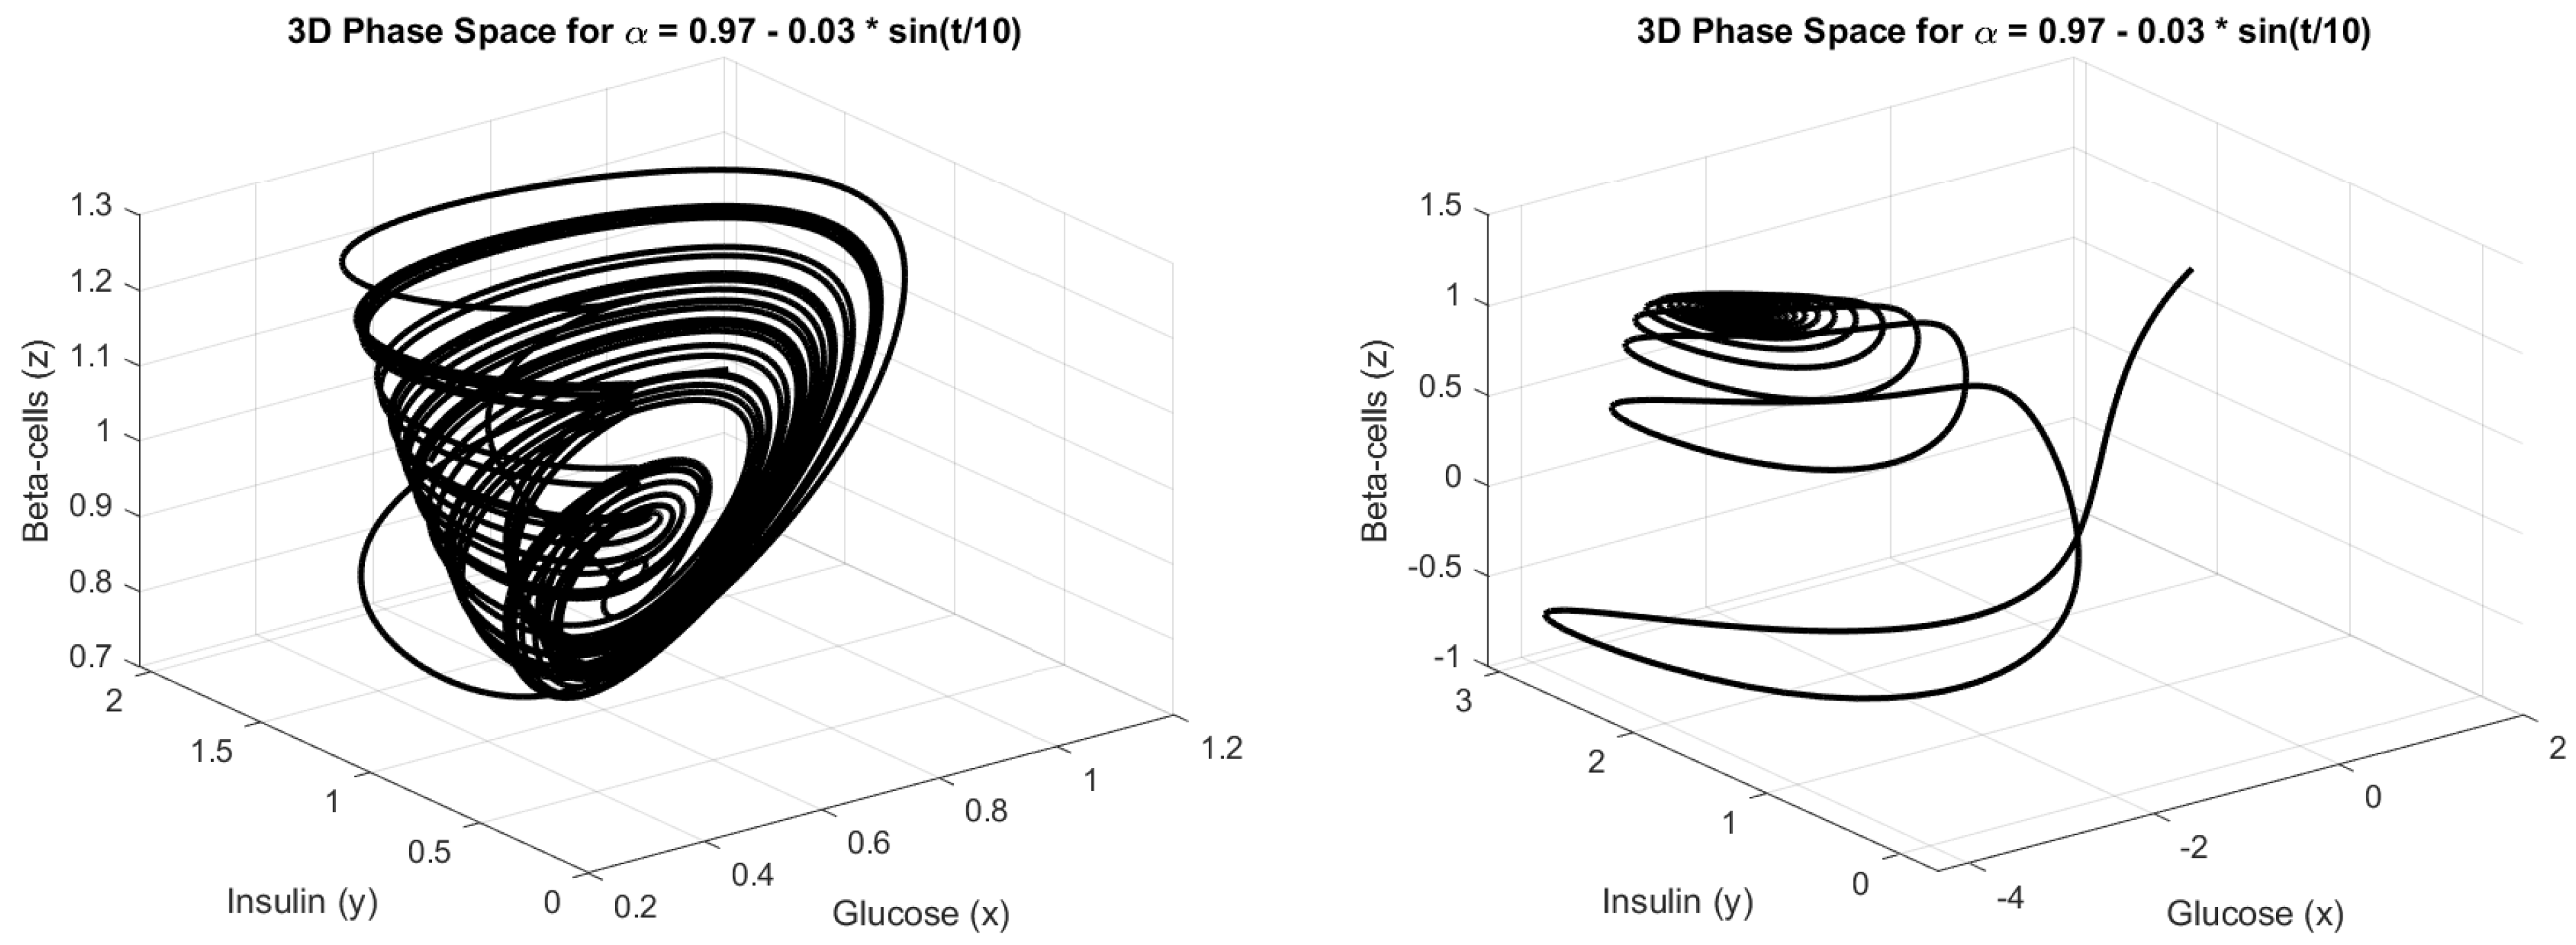
Applying the values of the parameters listed in Table 1, Figure 1, Figure 2, Figure 3, Figure 4 and Figure 5 depict the time-series evolution of glucose (x), insulin (y), and beta cell activity (z) for both uncontrolled and controlled systems at fractional orders α = 1 . Subsequent figures present the dynamics for more complex fractional orders, including sinusoidal ( α = 0.97 0.03sin ( t / 10 ) ) and hyperbolic tangent ( α = 0.97+ 0.03tanh ( t / 10 ) ). These time-series plots highlight transitions between stability, oscillatory behavior, and chaos, showcasing the system’s sensitivity to fractional-order variations. Additionally, Figure 4, Figure 5 and Figure 6 provide a comparative phase plane projection ( x y z ) of the fractional system across various fractional orders and control mechanisms, offering a visual representation of the trajectories and attractors. Together, these figures demonstrate the intricate dynamics of the system and the effectiveness of the applied control strategies. These figures compare the original system to a controlled version, highlighting the stabilization achieved through simple linear controllers. Also, they present phase plane projections, showing the intricate trajectories of glucose–insulin interactions, where variations in fractional order induce shifts between periodic, quasi-periodic, and chaotic behaviors. These visualizations emphasize the model’s capacity to capture complex physiological dynamics and the effectiveness of fractional-order control strategies.
Figure 1, Figure 2, Figure 3, Figure 4, Figure 5 and Figure 6 illustrate glucose–insulin–beta cell dynamics. The system exhibits complex behavior, including periodicity and potential chaotic oscillations depending on parameter values and fractional orders. The results confirm that fractional calculus effectively captures glucose–insulin interactions’ nonlinear, memory-dependent behavior. Furthermore, the controlled system demonstrates stabilization under chaotic conditions, validating the efficacy of simple linear controllers. The numerical simulations underscore the robustness of fractional-order models in understanding glucose–insulin dynamics. By leveraging advanced methods like LADM and GEM, this study provides a comprehensive framework for modeling, simulation, and control of such systems. The figures in this study illustrate the dynamics of the fractional glucose–insulin system and its controlled variants under varying fractional orders ( α ). Figure 1, Figure 2 and Figure 3 compare the time series of glucose (x), insulin (y), and beta cell (z) dynamics for different fractional orders. Figure 1 demonstrates the dynamics for α = 1 , while Figure 1 and Figure 3 analyze the system for α = 0.97 0.03sin ( t / 10 ) and α = 0.97+ 0.03tanh ( t / 10 ) , respectively. In each case, panels (a)–(c) present the uncontrolled fractional system, and panels (d)–(f) show the controlled system dynamics for glucose, insulin, and beta cells. Figure 4, Figure 5 and Figure 6 provide phase plane projections ( x y z ) for the fractional system and its controlled counterpart under varying α , specifically α = 1 , α = 0.97 0.03sin ( t / 10 ) , and α = 0.97+ 0.03tanh ( t / 10 ) , respectively. The projections highlight the differences in system behavior and stability transitions between fractional and controlled models.

5. Discussion

We use the Laplace–Adomian Decomposition Method (LADM) and the Generalized Euler Method (GEM) to explore glucose–insulin dynamics through fractional-order models with time-varying derivatives. Fractional-order modeling is effective at capturing nonlinear, memory-dependent behaviors in physiological systems. Model stability, periodic oscillations, and chaotic behavior are validated by the Lyapunov exponents, bifurcation, and phase diagrams. System parameters and fractional orders determine this. Fractional derivatives enhance long-term predictions and modeling of slow dynamics and time delays. Fractional-order sensitivity analysis highlights transitions between stable and chaotic states. glucose–insulin interactions can be accurately described by fractional calculus. Simulated results demonstrate that simple linear controllers stabilize chaotic dynamics, offering a promising approach to managing physiological oscillations. This suggests that fractional-order modeling has practical implications in diabetes management and improving understanding and prediction of glucose–insulin regulation. It facilitates the development of personalized control strategies, especially in the context of chaotic or unstable dynamics observed in diabetics. The approximate solution to model (2) is illustrated in Table 3.

5.1. Biological Interpretation of Results

The simulation results illustrate that fractional-order modeling significantly enhances the representation of glucose–insulin interactions by incorporating memory effects. Unlike traditional integer-order models, the fractional framework is capable of simulating long-term physiological processes. The results indicate the following:
  • Glucose levels exhibit periodic fluctuations that are consistent with known patterns of insulin response in both normal and diabetic subjects.
  • The insulin dynamics display a delayed peak response following glucose intake, which is characteristic of physiological systems.
  • The activity of β -cells is critical in maintaining glucose homeostasis, with their response strongly influenced by historical states. This underscores the relevance of employing fractional derivatives.

5.2. Comparison with Experimental Data

To validate the model’s effectiveness, its predictions should be compared with clinical and experimental data. Studies such as the Intravenous Glucose Tolerance Test (IVGTT) and Continuous Glucose Monitoring (CGM) provide benchmark datasets for glucose–insulin dynamics:
  • The simulated glucose decay rates align with data reported in [3,4], suggesting that the model accurately represents physiological glucose–insulin interactions.
  • The observed insulin oscillations resemble those found in [30], validating the model’s ability to capture periodic insulin secretory patterns.
  • Future work could involve calibrating model parameters using real patient data from sources such as the UKPDS or DCCT trials to enhance predictive accuracy.

5.3. Sensitivity Analysis and Robustness

A notable feature of the fractional-order model is its sensitivity to variations in parameters, particularly the fractional order α . The analysis reveals the following:
  • Minor adjustments in α can substantially affect system stability, with lower values tending to induce oscillatory or chaotic behavior.
  • Parameters related to insulin sensitivity (such as β and τ ) significantly influence the rate of glucose uptake, indicating the need for personalized treatment strategies.
  • The model maintains robustness under moderate perturbations of parameters, which highlights its potential for real-world applications in diabetes management.

5.4. Comparison with Previous Studies

Compared to existing fractional glucose–insulin models, such as [56,57], the proposed approach introduces the following:
  • Time-varying fractional derivatives, enhancing flexibility in capturing dynamic physiological responses.
  • Chaos control strategies using simple linear controllers, stabilizing glucose–insulin fluctuations.
  • Advanced numerical techniques (LADM and GEM) for improved solution accuracy.
These improvements make the model more adaptable for real-world clinical applications.
These enhancements render the model more suitable for clinical applications.

5.5. Practical Implications

The results suggest several potential applications in biomedical research and clinical practice:
  • Personalized Insulin Therapy: By fine-tuning the fractional parameters, the model can be used to optimize insulin dosing for individual diabetic patients.
  • Prediction of Metabolic Instability: The model’s capability to detect chaotic fluctuations may be leveraged to anticipate and prevent severe glucose imbalances.
  • Integration with Glucose Monitoring Devices: The framework can be adapted to provide real-time feedback on insulin regulation in continuous glucose monitoring systems.

6. Conclusions

This study underscores the significance of fractional-order models in understanding the complex dynamics of glucose–insulin regulation. By integrating memory-dependent properties through fractional derivatives and leveraging advanced numerical techniques such as the Laplace–Adomian Decomposition Method (LADM) and the Generalized Euler Method (GEM), we have provided a comprehensive framework for analyzing chaotic behaviors, stability conditions, and bifurcation phenomena within glucose–insulin interactions. Our findings highlight the crucial role of fractional calculus in modeling physiological systems with enhanced accuracy, capturing long-term dependencies that traditional integer-order models fail to address. The introduction of a novel control strategy using simple linear controllers demonstrates the feasibility of stabilizing chaotic oscillations, which has significant implications for biomedical applications, particularly in diabetes management. These results emphasize the importance of fractional derivatives in accurately representing the nonlinear and memory-dependent nature of glucose–insulin dynamics, paving the way for improved predictive models and therapeutic strategies. The following are the potential practical applications and impact of this work:
  • Personalized Diabetes Management: The fractional-order model can be adapted to develop patient-specific strategies for controlling blood glucose levels. By calibrating model parameters using real patient data, clinicians can tailor treatment plans, optimize insulin therapy, and predict metabolic instability.
  • Improved Disease Monitoring: The ability of the model to capture chaotic and oscillatory behaviors in glucose–insulin interactions makes it a valuable tool for continuous glucose monitoring (CGM) systems. This can help in early detection of irregular patterns, enabling proactive intervention and reducing the risk of severe complications.
  • Development of Intelligent Control Systems: The proposed chaos control methodology can be integrated into automated insulin delivery systems or artificial pancreas technologies, improving their ability to regulate glucose levels dynamically and adaptively.
  • Advancements in Theoretical and Applied Mathematics: Beyond biomedical applications, the methodologies applied in this study contribute to the broader field of fractional calculus and numerical analysis. The use of LADM and GEM for solving fractional differential equations can be extended to other complex biological and engineering systems.
  • Future Research Directions: The insights gained from this study provide a foundation for further exploration into multi-scale modeling of glucose–insulin regulation, including the effects of additional physiological factors such as hormonal regulation, physical activity, and dietary habits. Future research could also involve validating the model against extensive clinical datasets and refining control strategies for enhanced robustness and accuracy.
By bridging theoretical advancements with practical applications, this research not only advances the understanding of glucose–insulin dynamics but also opens new avenues for the development of innovative diagnostic and therapeutic tools in diabetes care. The integration of fractional-order modeling into biomedical research holds significant promise for revolutionizing disease management and personalized medicine.

Author Contributions

S.S. conceptualized the study, developed the fractional-order glucose–insulin regulatory models, and performed the numerical simulations using the Laplace–Adomian Decomposition Method (LADM) and the Generalized Euler Method (GEM). E.S. contributed to the theoretical analysis, focusing on the stability and bifurcation aspects of the models, and provided insights into chaos theory in fractional systems. R.A.A. assisted in the formulation and analysis of the time-varying fractional derivatives and contributed to the interpretation of simulation results. A.A. played a significant role in refining the numerical approaches, validating the control strategies, and ensuring the accuracy of the findings. All authors have read and agreed to the published version of the manuscript.

Funding

This research was supported and funded by the Deanship of Scientific Research at Imam Mohammad Ibn Saud Islamic University (IMSIU) (grant number IMSIU-DDRSP2501).

Data Availability Statement

The datasets generated and analyzed during the current study are available from the corresponding author upon reasonable request.

Acknowledgments

This research was supported and funded by the Deanship of Scientific Research at Imam Mohammad Ibn Saud Islamic University (IMSIU) (grant number IMSIU-DDRSP2501).

Conflicts of Interest

The authors declare no conflicts of interest.

Correction Statement

This article has been republished with a minor correction to the existing affiliation information, Funding statement and Acknowledgments. This change does not affect the scientific content of the article.

References

  1. Himsworth, H.P.; Ker, J.R. Diabetes mellitus: Its differentiation into insulin-sensitive and insulin-insensitive types. Int. J. Epidemiol. 2013, 42, 1594–1598. [Google Scholar] [CrossRef] [PubMed]
  2. Bolie, V.W. Coefficients of normal blood glucose regulation. J. Appl. Physiol. 1961, 16, 783–788. [Google Scholar] [CrossRef]
  3. Bergman, R.N.; Finegood, D.T.; Ader, M. Assessment of insulin sensitivity in vivo. Endocr. Rev. 1985, 6, 45–86. [Google Scholar] [CrossRef] [PubMed]
  4. Man, C.D.; Caumo, A.; Basu, R.; Rizza, R.; Toffolo, G.; Cobelli, C. Minimal model estimation of glucose absorption and insulin sensitivity from oral test: Validation with a tracer method. Am. J. Physiol. Metab. 2004, 287, E637–E643. [Google Scholar]
  5. Zabidi, N.A.; Majid, Z.A.; Kilicman, A.; Ibrahim, Z.B. Numerical solution of fractional differential equations with Caputo derivative by using numerical fractional predict–correct technique. Adv. Contin. Discret. Model. 2022, 2022, 26. [Google Scholar] [CrossRef]
  6. Podlubny, I. Fractional Differential Equations; Academic Press: San Diego, CA, USA, 1999. [Google Scholar]
  7. Arena, P.; Caponetto, R.; Fortuna, L.; Porto, M. Nonlinear Noninteger Order Circuits & Systems—An Introduction; World Scientific: Singapore, 2000. [Google Scholar]
  8. Hilfer, R. Applications of Fractional Calculus in Physics; World Scientific Publishing Company: Singapore, 2000; pp. 87–130. [Google Scholar]
  9. Nisar, K.S.; Farman, M.; Abdel-Aty, M.; Ravichandran, C. A review of fractional-order models for plant epidemiology. Prog. Fract. Differ. Appl. 2024, 10, 489–521. [Google Scholar]
  10. Ahmed, E.; Elgazzar, A.S. On fractional order differential equations model for nonlocal epidemics. Phys. A Stat. Mech. Its Appl. 2007, 379, 607–614. [Google Scholar] [CrossRef]
  11. Li, W.; Wang, Y.; Cao, J.; Abdel-Aty, M. Dynamics and backward bifurcations of SEI tuberculosis models in homogeneous and heterogeneous populations. J. Math. Anal. Appl. 2025, 543, 128924. [Google Scholar] [CrossRef]
  12. Nisar, K.S.; Farman, M.; Abdel-Aty, M.; Ravichandran, C. A review of fractional order epidemic models for life sciences problems: Past, present and future. Alexandria Eng. J. 2024, 95, 283–305. [Google Scholar] [CrossRef]
  13. Bagley, R.L.; Calico, R.A. Fractional Order State Equations for the Control of Viscoelastically Damped Structures. J. Guid. Control Dyn. 1991, 14, 304–311. [Google Scholar] [CrossRef]
  14. Heaviside, O. Electromagnetic Theory; Chelsea: New York, NY, USA, 1971. [Google Scholar]
  15. Kusnezov, D.; Bulgac, A.; Dang, G.D. Quantum Lévy Processes and Fractional Kinetics. Phys. Rev. Lett. 1999, 82, 1136. [Google Scholar] [CrossRef]
  16. Almutairi, N.; Saber, S. Existence of chaos and the approximate solution of the Lorenz–Lü–Chen system with the Caputo fractional operator. AIP Adv. 2024, 14, 015112. [Google Scholar] [CrossRef]
  17. Saber, S. Control of chaos in the Burke-Shaw system of fractal-fractional order in the sense of Caputo-Fabrizio. J. Appl. Math. Comput. Mech. 2024, 23, 83–96. [Google Scholar] [CrossRef]
  18. Hammad, H.A.; Qasymeh, M.; Abdel-Aty, M. Existence and stability results for a Langevin system with Caputo–Hadamard fractional operators. Int. J. Geom. Methods Mod. Phys. 2024, 21, 2450218. [Google Scholar] [CrossRef]
  19. Ahmed, K.I.A.; Adam, H.D.S.; Saber, S. Analytical solutions for a class of variable-order fractional Liu system under time-dependent variable coefficients. Results Phys. 2024, 56, 107311. [Google Scholar] [CrossRef]
  20. Alhazmi, M.; Dawalbait, F.M.; Aljohani, A.; Taha, K.O.; Adam, H.D.; Saber, S. Numerical approximation method and Chaos for a chaotic system in sense of Caputo-Fabrizio operator. Therm. Sci. 2024, 28, 5161–5168. [Google Scholar] [CrossRef]
  21. Almutairi, N.; Saber, S. Chaos control and numerical solution of time-varying fractional Newton-Leipnik system using fractional Atangana-Baleanu derivatives. AIMS Math. 2023, 8, 25863–25887. [Google Scholar] [CrossRef]
  22. Alsulami, A.; Alharb, R.A.; Albogami, T.M.; Eljaneid, N.H.; Adam, H.D.; Saber, S.F. Controlled chaos of a fractal—Fractional Newton-Leipnik system. Thermal Sci. 2024, 28, 5153–5160. [Google Scholar] [CrossRef]
  23. Alshehri, M.H.; Saber, S.; Duraihem, F.Z. Dynamical analysis of fractional-order of IVGTT glucose–insulin interaction. Int. J. Nonlin. Sci. Num. 2023, 24, 1123–1140. [Google Scholar] [CrossRef]
  24. Alshehri, M.H.; Duraihem, F.Z.; Alalyani, A.; Saber, S. A Caputo (discretization) fractional-order model of glucose-insulin interaction: Numerical solution and comparisons with experimental data. J. Taibah Univ. Sci. 2021, 15, 26–36. [Google Scholar] [CrossRef]
  25. Saber, S.; Bashier, E.B.M.; Alzahrani, S.M.; Noaman, I.A. A Mathematical Model of Glucose-Insulin Interaction with Time Delay. J. Appl. Comput. Math. 2018, 7, 416. [Google Scholar]
  26. Ahmed, K.I.A.; Adam, H.D.S.; Saber, S. Different strategies for diabetes by mathematical modeling: Applications of fractal-fractional derivatives in the sense of Atangana-Baleanu. Results Phys. 2023, 26, 106892. [Google Scholar] [CrossRef]
  27. Ahmed, K.I.; Adam, H.D.; Youssif, M.; Saber, S. Different strategies for diabetes by mathematical modeling: Modified Minimal Model. Alex. Eng. J. 2023, 80, 74–87. [Google Scholar] [CrossRef]
  28. Derouich, M.; Boutayeb, A. The effect of physical exercise on the dynamics of glucose and insulin. J. Biomech. 2002, 35, 911–917. [Google Scholar] [CrossRef]
  29. Mukhopadhyay, A.; DeGaetano, A.; Arino, O. Modeling the Intravenous Glucose Tolerance Test: A Global Study for a Single-Distributed-Delay Model. Discret. Contin. Dyn.-Syst. Ser. B 2004, 228, 407–417. [Google Scholar]
  30. Tornheim, K. Are metabolic oscillations responsible for normal oscillatory insulin secretion? Diabetes 1997, 46, 1375–1380. [Google Scholar] [CrossRef]
  31. Ahmed, K.I.A.; Mirgani, S.M.; Seadawy, A.; Saber, S. A comprehensive investigation of fractional glucose-insulin dynamics: Existence, stability, and numerical comparisons using residual power series and generalized Runge-Kutta methods. J. Taibah Univ. Sci. 2025, 19, 2460280. [Google Scholar] [CrossRef]
  32. Saber, S.; Alalyani, A. Stability analysis and numerical simulations of IVGTT glucose-insulin interaction models with two time delays. Math. Model. Anal. 2022, 27, 383–407. [Google Scholar] [CrossRef]
  33. Atangana, A.; Baleanu, D. New fractional derivatives with non-local and non-singular kernel: Theory and application to heat transfer model. Therm. Sci. 2016, 20, 763–769. [Google Scholar] [CrossRef]
  34. Petras, I. Modeling and numerical analysis of fractional-order Bloch equations. Comput. Math. Appl. 2011, 61, 341–356. [Google Scholar] [CrossRef]
  35. Caputo, M.; Fabrizio, M. A new definition of fractional derivative without singular kernel. Prog. Fract. Differ. Appl. 2015, 1, 73–85. [Google Scholar]
  36. Nosrati, K.; Volos, C. Bifurcation Analysis and Chaotic Behaviors of Fractional-Order Singular Biological Systems. In Nonlinear Dynamical Systems with Self-Excited and Hidden Attractors; Pham, V.T., Vaidyanathan, S., Volos, C., Kapitaniak, T., Eds.; Studies in Systems, Decision and Control; Springer: Cham, Switzerland, 2018; Volume 133. [Google Scholar]
  37. Danca, M.F. Lyapunov Exponents of a Discontinuous 4D Hyperchaotic System of Integer or Fractional Order. Entropy 2018, 20, 337. [Google Scholar] [CrossRef] [PubMed]
  38. Zhuang, P.; Liu, F.; Anh, V.; Turner, I. Numerical methods for the variable-order fractional advection-diffusion equation with a nonlinear source term. SIAM J. Numer. Anal. 2009, 47, 1760–1781. [Google Scholar] [CrossRef]
  39. Almutairi, N.; Saber, S. Application of a time-fractal fractional derivative with a power-law kernel to the Burke-Shaw system based on Newton’s interpolation polynomials. MethodsX 2024, 12, 102510. [Google Scholar] [CrossRef] [PubMed]
  40. Gómez-Aguilar, J.F. Chaos in a nonlinear Bloch system with Atangana—Baleanu fractional derivatives. Numer. Methods Partial. Differ. Equ. 2018, 34, 1716–1738. [Google Scholar] [CrossRef]
  41. Odibat, Z.M.; Momani, S. Modified Homotopy Perturbation Method: Application to Quadratic Riccati Differential Equation of Fractional Order. Chaos Solitons Fractals 2008, 36, 167–174. [Google Scholar] [CrossRef]
  42. Tsai, P.; Chen, C.K. An approximate analytic solution of the nonlinear Riccati differential equation. J. Frankl. Inst. 2010, 347, 1850–1862. [Google Scholar] [CrossRef]
  43. Zeng, D.Q.; Qin, Y.M. The Laplace-Adomian-Padé technique for the seepage flows with the Riemann-Liouville derivatives. Commun. Fract. Calc. 2012, 3, 26–29. [Google Scholar]
  44. Khan, Y.; Diblík, J.; Faraz, N.; Šmarda, Z. An efficient new perturbative Laplace method for space-time fractional telegraph equations. Adv. Differ. Equ. 2012, 2012, 204. [Google Scholar] [CrossRef]
  45. Khan, N.A.; Ara, A.; Alam Khan, N. Fractional-order Riccati differential equation: Analytical approximation and numerical results. Adv. Differ. Equ. 2013, 2013, 185. [Google Scholar] [CrossRef]
  46. Odibat, Z.; Momani, S. An algorithm for the numerical solution of differential equations of fractional order. J. Appl. Math. Inform. 2008, 26, 15–27. [Google Scholar]
  47. Kataria, K.; Vellaisamy, P. Saigo space-time fractional Poisson process via Adomian decomposition method. Stat. Probab. Lett. 2017, 129, 69–80. [Google Scholar] [CrossRef]
  48. Haq, F.; Shah, K.; Rahman, G.U.; Shahzad, M. Numerical solution of fractional-order smoking model via Laplace-Adomian decomposition method. Alex. Eng. J. 2017, 57, 1061–1069. [Google Scholar] [CrossRef]
  49. Sirisubtawee, S.; Kaewta, S. New modified Adomian decomposition recursion schemes for solving certain types of nonlinear fractional two-point boundary value problems. Int. J. Math. Math. Sci. 2017, 2017, 5742965. [Google Scholar] [CrossRef]
  50. Liu, Q.; Liu, J.; Chen, Y. Asymptotic limit cycle of fractional Van der Pol oscillator by homotopy analysis method and memory-free principle. Appl. Math. Model. 2016, 40, 3211–3220. [Google Scholar] [CrossRef]
  51. Freihat, A.; Momani, S. Application of multistep generalized differential transform method for the solutions of the fractional-order Chua’s system. Discret. Dyn. Nat. Soc. 2012, 2012, 427393. [Google Scholar] [CrossRef]
  52. Wang, H.; Yang, D.; Zhu, S. A Petrov—Galerkin finite element method for variable-coefficient fractional diffusion equations. Comput. Methods Appl. Mech. Eng. 2015, 290, 45–56. [Google Scholar] [CrossRef]
  53. Song, H.; Yi, M.; Huang, J.; Pan, Y. Numerical solution of fractional partial differential equations by using Legendre wavelets. Eng. Lett. 2016, 24, 358–364. [Google Scholar]
  54. Lu, H.; Bates, P.W.; Chen, W.; Zhang, M. The spectral collocation method for efficiently solving PDEs with fractional Laplacian. Adv. Comput. Math. 2017, 44, 861–878. [Google Scholar] [CrossRef]
  55. Elsadany, A.E.A.; El-Metwally, H.A.; Elabbasy, E.M.; Agiza, H.N. Chaos and bifurcation of a nonlinear discrete prey-predator system. Comput. Ecol. Softw. 2012, 2, 169. [Google Scholar]
  56. Shabestari, P.S.; Panahi, S.; Hatef, B.; Jafari, S.; Sprott, J.C. A new chaotic model for the glucose-insulin regulatory system. Chaos Solitons Fractals 2018, 112, 44–51. [Google Scholar] [CrossRef]
  57. Rajagopal, K.; Bayani, A.; Jafari, S.; Karthikeyan, A.; Hussain, I. Chaotic dynamics of a fractional order glucose-insulin regulatory system. Front. Inf. Technol. Electron. Eng. 2019, 21, 1108–1118. [Google Scholar] [CrossRef]
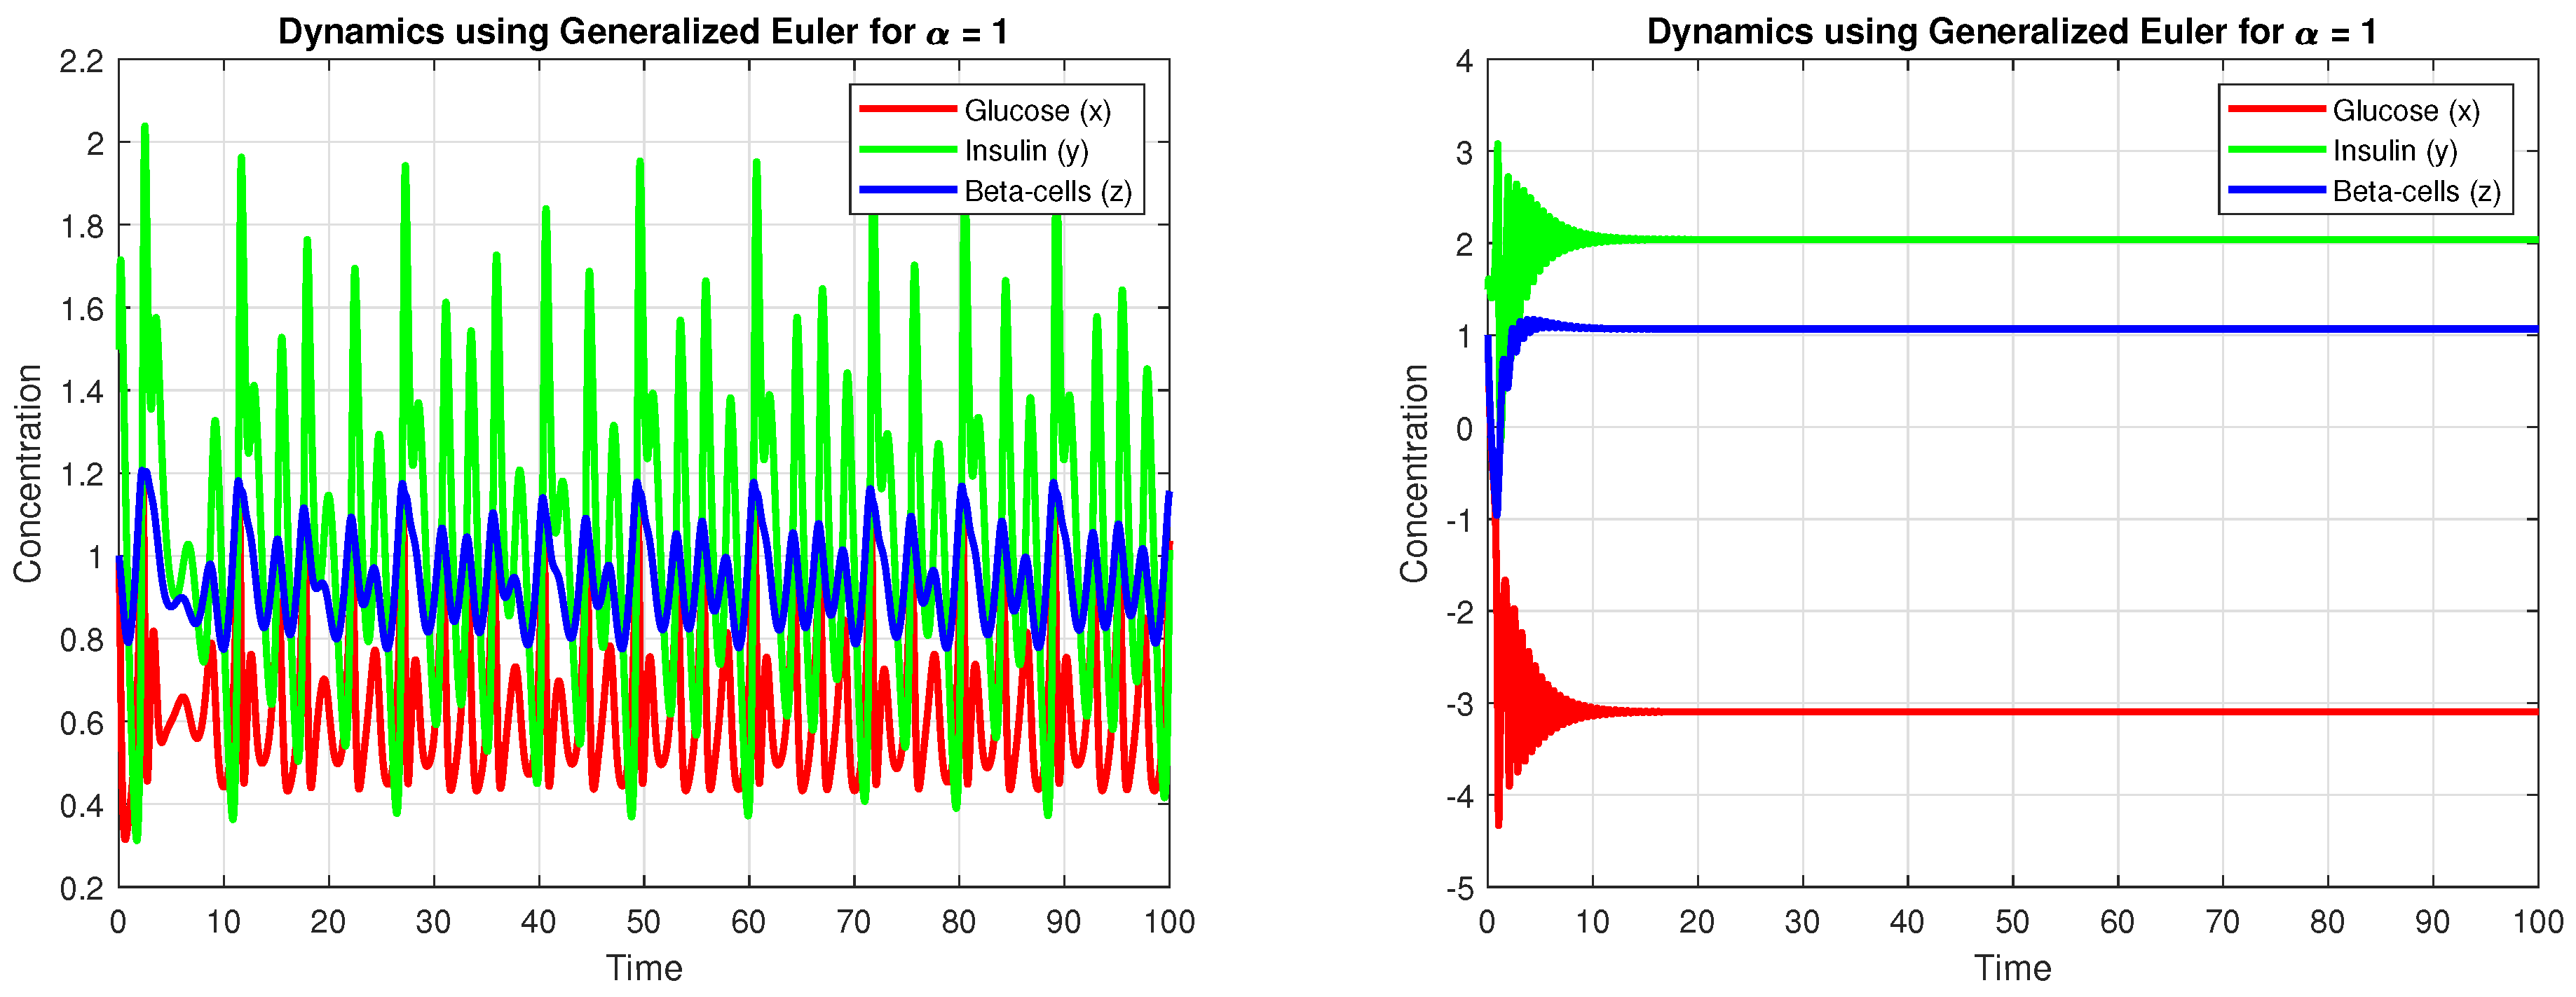
Figure 1. Comparison between the time series of the fractional system (2) (left) and the controlled fractional system (3) (right) for α = 1 .
Fractalfract 09 00149 g001
Figure 2. Comparison between the time series of the fractional system (2) and the controlled fractional of the system (3) for α = 0.97 0.03sin ( ι / 10 ) .
Fractalfract 09 00149 g002
Figure 3. Comparison between the time series of the fractional system (2) and the controlled fractional of the system (3) for α = 0.97+ 0.03tanh ( ι / 10 ) .
Fractalfract 09 00149 g003
Figure 4. Comparison between the phase plane projection xyz of the fractional system (2) and the controlled fractional of the system (3) for α = 1 .
Fractalfract 09 00149 g004
Figure 5. Comparison between the phase plane projection xyz of the fractional system (2) and the controlled fractional of the system (3) for α = 0.97 0.03sin ( t / 10 ) .
Fractalfract 09 00149 g005
Figure 6. Comparison between the phase plane projection xyz of the fractional system (2) and the controlled fractional of the system (3) for α = 0.97+ 0.03tanh ( t / 10 ) .
Fractalfract 09 00149 g006
Table 1. Comparison of glucose–insulin models.
FeatureBolie Model (1961)Bergman and Cobelli Minimal Model (1980s)Derouich and Boutayeb Modified Model (2002)
Structure Simple two-variable ODE modelThree-variable ODE systemModification of the minimal model with additional terms
Equations d x d t = a 1 x a 2 z + p
d z d t = a 3 x a 4 z
d x d t = ( p 1 + y ) x + p 1 x b
d y d t = p 2 y + p 3 ( z y b )
d z d t = p 4 ( x p 5 ) + p 6 ( z y b )
d x d t = ( 1 + q 2 ) z x + ( p 1 + q 1 ) ( x b x )
d z d t = p 2 z + ( p 3 + q 3 ) ( z z b )
Parameter MeaningParameters a 1 , a 2 , a 3 , a 4 represent glucose–insulin interactionsParameters p 1 , p 2 , p 3 , p 4 , p 5 , p 6 define insulin sensitivity, glucose absorption, and insulin responseAdditional parameters q 1 , q 2 , q 3 represent the effects of physical exercise
Applicable ScenariosBasic theoretical model for glucose–insulin interactionsWidely used in estimating insulin sensitivity from glucose tolerance tests (IVGTT, OGTT)Used in studies on the impact of physical activity on glucose–insulin regulation
Advantages
-
Simple and analytically solvable
-
Good for conceptual understanding
-
Provides an estimate of insulin sensitivity
-
Can model insulin resistance
-
Accounts for exercise effects on glucose metabolism
-
More realistic than the minimal model for physically active individuals
Disadvantages
-
Oversimplifies insulin–glucose interactions
-
Does not account for insulin sensitivity or time delays
-
Limited to specific experimental conditions
-
Does not consider physical activity effects
-
More complex than the minimal model
-
Requires additional data for exercise-related parameters
Table 2. Parameter values and definitions from Shabestari et al. [56].
ParameterValueDefinition
a 1 2.04Normal decrease in insulin concentration without glucose.
a 2 0.10Rate of propagation of insulin with glucose.
a 3 1.09Rising insulin rate with increased glucose concentration.
a 4 −1.08Rising insulin level rate independently excreted by β -cells.
a 5 0.03Rising insulin level rate independently excreted by β -cells.
a 6 −0.06Rising insulin level rate independently excreted by β -cells.
a 7 2.01Rising insulin level rate independently excreted by β -cells.
a 8 0.22Insulin effect on glucose.
a 9 −3.84Rate of decrease in glucose due to insulin excretion.
a 10 −1.20Rate of decrease in glucose due to insulin excretion.
a 11 0.30Normal rising of glucose without insulin.
a 12 1.37Decrease in glucose concentration due to insulin from β -cells.
a 13 −0.30Decrease in glucose concentration due to insulin from β -cells.
a 14 0.22Decrease in glucose concentration due to insulin from β -cells.
a 15 0.30Rate of increase in β -cells due to increased glucose.
a 16 −1.35Rate of increase in β -cells due to increased glucose.
a 17 0.50Rate of increase in β -cells due to increased glucose.
a 18 −0.42Rate of decrease in β -cells due to existing levels.
a 19 −0.15Rate of decrease in β -cells due to existing levels.
a 20 −0.19Represents a constant input/output in the glucose dynamics.
a 21 −0.56Denotes a baseline rate of insulin production.
Table 3. Glucose–insulin–beta cells dynamics over time.
Time x t Glucose y t Insulin z t BetaCells
001.51
0.10.059751.29250.9745
0.20.161471.09950.95553
0.30.272270.92410.94767
0.40.376620.773950.9525
0.50.470040.655370.9691
0.60.554860.572060.99508
0.70.636380.526841.0278
0.80.720320.524391.0647
0.90.811530.573251.1036
10.913270.687161.1417
1.11.02540.885441.1745
1.21.13771.19051.1949
1.31.21031.61321.1951
1.41.13232.10141.1812
1.50.711762.43391.1989
1.6−0.00521372.31391.2873
1.7−0.354951.99341.3521
1.8−0.241041.75181.3687
1.90.0470561.49851.3692
20.409331.23161.3675
2.10.78241.0411.3758
2.21.12451.06931.3964
2.31.42051.44811.4163
2.41.59622.24981.4188
2.51.17563.31.4798
2.6−1.09613.44832.0409
2.7−2.37163.18382.7805
2.8−0.0800493.02253.3709
2.95.5691.82733.9033
316.09432.7524.0833
3.1−3645.7588.051619
3.28.3106  × 10 8 −5.9027  × 10 9 1.0137  × 10 7
3.32.2211  × 10 28 6.8878  × 10 25 −1.0283  × 10 28
3.4−2.1855  × 10 83 1.3389  × 10 84 1.6339  × 10 76
3.5−2.5919  × 10 251 −1.2527  × 10 249 1.2  × 10 251
Disclaimer/Publisher’s Note: The statements, opinions and data contained in all publications are solely those of the individual author(s) and contributor(s) and not of MDPI and/or the editor(s). MDPI and/or the editor(s) disclaim responsibility for any injury to people or property resulting from any ideas, methods, instructions or products referred to in the content.