Abstract
Coal resource extraction and utilization are essential for sustainable development and economic growth. This study integrates a pseudo-triaxial mechanical loading system with low-field nuclear magnetic resonance (NMR) to enable the preliminary visualization of coal’s pore-fracture structure (PFS) under mechanical stress. Pseudo-triaxial and cyclic loading–unloading tests were combined with real-time NMR monitoring to model porosity recovery, pore size evolution, and energy dissipation, while also calculating the fractal dimensions of pores in relation to stress. The results show that during the compaction phase, primary pores are compressed with limited recovery after unloading. In the elastic phase, both adsorption and seepage pores transform significantly, with most recovering post-unloading. After yield stress, new fractures and pores form, and unloading enhances fracture connectivity. Seepage pore porosity shows a negative exponential relationship with axial strain before yielding, and a logarithmic relationship afterward. The fractal dimension of adsorption pores decreases during compaction and increases afterward, while the fractal dimension of seepage pores decreases before yielding and increases post-yielding. These findings provide new insights into the flow patterns of methane in coal seams.
1. Introduction
With the rapid pace of global industrialization, the increasing energy demand has positioned coal as a vital resource for sustainable economic and social development worldwide [1]. The pore-fracture structure (PFS) in coal provides storage space and flow channels for gas, directly affecting the gas flow characteristics [2,3,4,5,6]. During the coal mining process, as the working face advances, the pressure continuously changes, typically increasing and then decreasing. This change in stress can alter the internal PFS of coal, which in turn impacts mining production and safety [7,8,9,10]. Therefore, simulating the stress variation patterns during the mining process, conducting pseudo-triaxial loading and cyclic loading and unloading experiments, and monitoring the PFS evolution throughout the full stress–strain process online can offer new insights into the study of gas flow patterns within coal seams.
There are many methods for characterizing the PFS of coal, including using a mercury intrusion porosimeter [11] and gas adsorption porosimeter [12]. However, these methods cannot be performed concurrently with the loading process and can only capture the PFS characteristics at discrete stages of loading. A helium porosimeter measures porosity and permeability simultaneously but cannot provide pore size distribution (PSD) and only applies confining pressure [13]. X-ray computed tomography (CT) enables real-time testing during triaxial loading and provides three-dimensional reconstruction of the PFS, though its in situ accuracy is relatively low, only detecting large pores [14,15]. Scanning electron microscopy (SEM) excels in observing local samples but lacks comprehensive characterization capabilities [16,17]. Acoustic emission (AE) testing is efficient but prone to interference from external noise [18,19].
Several researchers have utilized various visualizing techniques to investigate the PFS evolution in coal during loading deformation. For example, Ju et al. [14] combined a servo-controlled triaxial loading system with CT imaging to observe the dynamic evolution of coal’s PFS under varying pressures. Xu et al. [16] used SEM to obtain 2D images of coal’s microstructure and applied image processing to differentiate its organic components, minerals, and pores, which influenced its mechanical behaviour. Huang et al. [20] studied AE characteristics of sandstone under compression, finding a strong correlation between acoustic emission signals and confining pressure. However, this technique is limited by its spatial resolution, which is insufficient to capture the finer details of the PFS.
Compared to other methods, nuclear magnetic resonance (NMR) technology offers advantages like speed, non-destructiveness, and comprehensive characterization. In recent years, many studies have utilized NMR to investigate the PFS evolution of coal during loading [21,22,23]. Among them, Li et al. [24] combined NMR with permeability testing under different confining pressures to reveal key pore sizes controlling permeability and discussed the impact of PFS on stress sensitivity. Cheng et al. [25] used NMR and micro-CT to investigate pore and fracture compressibility in low-rank coal, showing that fractures and seepage pores enhance compressibility, while minerals reduce it. Zhou et al. [26] achieved in situ NMR testing under triaxial loading and monitored the evolution of spatial distribution, PSD, and PFS heterogeneity in coal. However, research on the PFS evolution during triaxial cyclic loading and unloading remains limited.
In theoretical research on the PFS of coal, fractal theory and related methods are currently widely used [27,28,29]. Scholars have conducted in-depth studies and found that many rocks exhibit fractal characteristics in their pores. By analyzing changes in fractal dimensions, they study PSD, the complexity of the PFS, and surface roughness [30,31,32,33,34]. Zhou et al. [35] established a random fractal model to describe the spatial distribution of pore spaces in porous media and established relationships between porosity, specific surface area, and volumetric fractal dimension. Peng et al. [36] proposed a method for predicting rock-bound water saturation and permeability based on fractal theory, with good predictive results. Chen et al. [37] calculated the fractal dimensions of pores in coal under diverse confining pressures and studied the evolution characteristics of the complexity of the PFS. Fractal theory can be used to establish the characterization relationship between PFS and stress state.
Since ferromagnetic materials cannot be used in NMR equipment, we employed ceramics and pure titanium as the loading head and chamber, successfully integrating the mechanical loading system with NMR equipment. This enabled online NMR testing of coal samples under pseudo-triaxial loading and triaxial cyclic loading and unloading conditions. Through this setup, we achieved preliminary visualization and multi-scale quantitative characterization of the PFS under varying stress states. We captured the evolution patterns of porosity recovery, residual deformation, and dissipation energy ratio at each loading stage. Furthermore, we established a fractal-based model to describe the relationship between the PFS and stress states. These findings contribute to a deeper understanding of permeability and gas flow mechanisms within coal seams, providing valuable insights for optimizing coal extraction and promoting the sustainable management of coal resources.
2. Experimental Approach
2.1. Sample Collection and Preparation
Coal samples were sourced from the Ningtiaota Coal Mine in Yulin, Shaanxi Province. Blocks of coal, approximately 500 mm in size, were selected, sealed to preserve moisture, and sent for further processing. Upon arrival at the lab, the blocks were processed into cylindrical specimens using a precision cutting machine. Both ends of each sample were carefully polished to ensure flat and parallel surfaces, which is critical for achieving uniform stress distribution during mechanical testing. The final dimensions of the specimens were 50 mm in height and 25 mm in diameter, following the standard requirements for pseudo-triaxial loading experiments. Six specimens were prepared for the subsequent tests to ensure repeatability and reliability of the results.
2.2. Testing Equipment
To monitor the evolution of the PFS in coal samples online, we directly integrated the mechanical loading system into a high-precision, visualizable low-field NMR device for in situ testing. The entire online experimental system consists of a gradient device, a spectrometer device, a permanent magnet, a core holder, a protective device, a confining pressure device, a water supply device, and an axial pressure device (Figure 1).

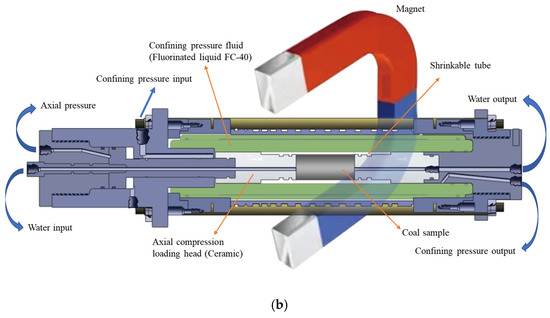
Figure 1.
Online pseudo-triaxial loading experimental system with nuclear magnetic resonance: (a) image of the main devices; (b) schematic representation of core holder. (Reproduced with permission from [38]. Copyright 2023 Elsevier).
The NMR device model is MacroMR12-150H, was sourced from Niumag in Suzhou, China. It can apply gradient magnetic fields in three directions for NMR imaging (NMRI) testing. The maximum applicable axial pressure is 100 MPa, the maximum confining pressure is 25 MPa, and the maximum hydraulic pressure is 25 MPa. The core holder (Figure 1b) is composed of titanium metal and ceramic, with FC-40 fluorinated fluid used as the confining pressure fluid. The samples are wrapped with heat-shrink tubing to prevent the confining fluid from penetrating the samples. The main NMR testing parameters include 32 scans, a waiting time of 3 s, 15,000 echoes, and an echo time interval of 0.1 ms.
2.3. Experimental Procedure
During coal mining operations, the working face undergoes cyclic loading due to both upward and downward extraction (Figure 2). This leads to changes in the PFS and permeability within the coal. Therefore, this study conducted in situ NMR experiments under pseudo-triaxial loading and triaxial loading–unloading conditions with constant confining pressure. NMRI and transverse relaxation time (T2) tests were performed on coal samples under different stress states.
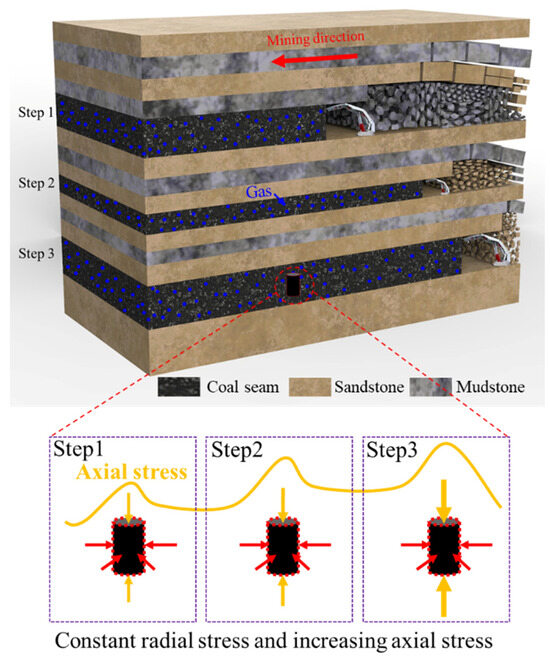
Figure 2.
Schematic view of stress redistribution during coal mining operations.
The detailed experimental procedures followed were as outlined below:
- The samples were first dried at a constant temperature of 80 °C for 24 h to remove any moisture. After drying, the samples were weighed to establish their baseline dry mass. The samples were then vacuumed for 2 h and saturated with water at 15 MPa pressure for 24 h. Afterward, the samples were weighed again to determine the change in mass.
- The saturated samples were wrapped in heat-shrink tubing and placed into the loading chamber. Axial pressure and confining pressure of 3 MPa were applied, followed by a hydraulic pressure of 2 MPa. Once water was observed flowing from the outlet, T2 and NMRI tests were conducted under hydrostatic pressure conditions.
- The in situ NMR experiment under pseudo-triaxial loading was conducted, maintaining a constant confining pressure of 3 MPa and hydraulic pressure of 2 MPa, while the axial pressure was incrementally increased. Before reaching peak strength, stress-controlled loading was applied, with T2 and NMRI tests conducted at every 5 MPa increment. After peak strength was reached, strain-controlled loading was applied, with T2 and NMRI tests conducted at regular intervals.
- After replacing the sample, the in situ NMR experiment under pseudo-triaxial loading–unloading was conducted. The confining pressure was maintained at 3 MPa and the hydraulic pressure at 2 MPa, while the axial pressure was applied and unloaded. Before reaching peak strength, stress-controlled loading was applied, with the maximum axial pressure of each cycle being 5 MPa higher than the previous one. After reaching peak strength, strain-controlled loading was applied, and the pressure was unloaded to hydrostatic pressure at regular intervals. T2 and NMRI tests were conducted at the maximum axial pressure of each cycle and after unloading to hydrostatic pressure.
- After replacing the sample, steps (2) to (4) were repeated twice, completing three sets of repeat experiments.
2.4. Experimental Principles
NMR is a process in which low-energy hydrogen nuclei 1H absorb energy and transition to a higher energy state. When placed in a uniform magnetic field, the 1H nuclei align, creating a maximum longitudinal magnetization vector. A radiofrequency pulse perturbs their rotation, generating a maximum transverse magnetization vector. After the pulse, the transverse magnetization decays gradually to zero [39], with the time required for this process being the transverse relaxation time T2 [40].
In water-saturated natural cores, 1H atoms are primarily located in the water within the pores. The T2 relaxation times of these protons vary with pore size (Figure 3). In this study, the Carr–Purcell–Meiboom–Gill (CPMG) sequence was employed to measure T2 [31]. The relaxation characteristics of different pore sizes are described by the following equation:
where ρ2 is the transverse surface relativity, μm/s; S is the pore surface area, μm2; V is the pore volume, μm3; and Fs is a constant depending on the pore geometry, with a value of 2 for cylindrical pores and 3 for spherical pores [28].
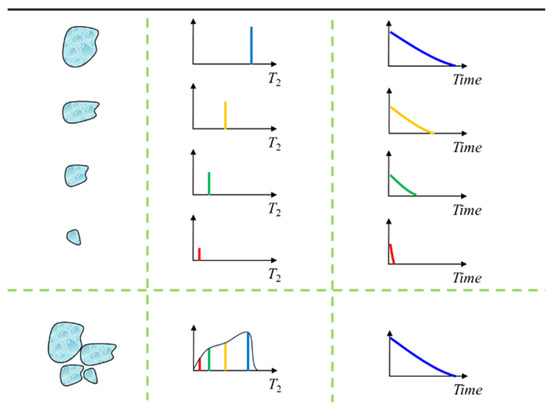
Figure 3.
Schematic diagram of T2 spectrum.
As shown in Equation (1) and Figure 3, T2 is proportional to pore size: larger T2 values correspond to larger pore sizes [41]. However, in rocks, there is no single characteristic pore size; rather, pore sizes follow a distribution. Thus, the wall relaxation signal, M(t), represents the sum of the decaying signals from all pore sizes:
where Ai is the number of protons in pores of the ith size, and T2i is the corresponding decay time constant, given by Equation (1). The amplitude of the T2 distribution, which is the sum of the individual amplitudes, is proportional to the liquid-filled porosity (volume fraction of pore space) of the material:
where is the porosity of the material. The total amplitude of the T2 distribution, represented by the peak area (i.e., the area under the T2 spectrum), is proportional to the liquid-filled porosity of the material [41]. Therefore, the T2 spectrum can be used to quantitatively characterize the PFS of porous media [42].
3. Evolution Characteristics of the Pore and Fracture Structure in Coal
Due to the difficulty in controlling the loading and unloading after the peak intensity, only one set of experiments successfully obtained a larger number of test points after the peak. However, all repeated experiments exhibited consistent evolutionary patterns [26]. Therefore, this section will use the experimental results from one set with the most test points after the peak as an example for analysis. This section will comprehensively analyze the evolution process of the PFS in coal from four perspectives: spatial distribution, PSD, mean pore size, and complexity. The analysis will be based on NMRI, the peak area of the T2 spectrum, the geometric mean value of the T2 spectrum (T2g), and fractal theory.
3.1. Evolution Characteristics of Spatial Distribution
Figure 4 presents the NMRI test results from the experiment, along with the corresponding stress–strain curves. The peak strength of the pseudo-triaxial loading sample reached 40.2 MPa, while the peak strength during the loading–unloading process reached 39.8 MPa. The NMRI data illustrate the spatial distribution of the PFS, with cooler colours representing areas of lower water content in the pores and fractures, and warmer colours indicating higher water content. Due to the limitations of NMRI, only the distribution of larger pores can be effectively observed.
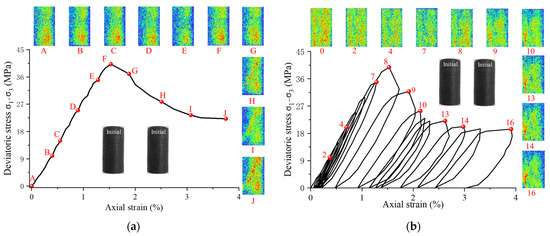
Figure 4.
Spatial distribution evolution of pores in coal: (a) triaxial loading; (b) triaxial loading and unloading.
The evolution of the PFS during loading can be roughly divided into four stages [26,43]:
- Stage I (Compaction of Initial PFS):
From point A to point C in Figure 4a, and Cycles 1–2 in Figure 4b, which end at 37% and 25% of the peak strength, respectively: In this phase, the NMRI response decreases, and residual deformation becomes significant, indicating that primary pores and fractures close under deviatoric stress and cannot recover upon unloading. This stage represents the initial compaction of the PFS, where pore volume is significantly reduced.
- 2.
- Stage II (Elastic Stage):
From point C to point E in Figure 4a, and Cycles 3–7 in Figure 4b, which end at 87% of the peak strength: During this phase, the NMRI response decreases but residual deformation is minimal. This suggests that while some pores and fractures close under deviatoric stress, they can recover upon unloading. Furthermore, new pores and fractures begin to form, gradually expanding and connecting, which contributes to the elasticity of the PFS.
- 3.
- Stage III (Unstable Growth and Failure of PFS):
From point E to point G in Figure 4a, and Cycles 8–9 in Figure 4b: During this phase, the NMRI response increases rapidly, and substantial residual deformation occurs. This indicates the rapid growth and interconnection of newly formed pores and fractures, which ultimately leads to through-going fractures and shear failure of the sample. The PFS becomes highly complex as fractures propagate and interconnect.
- 4.
- Stage IV (Residual Strength Stage):
From point G to point J in Figure 4a, and Cycles 10–16 in Figure 4b: In this phase, both the NMRI response and residual deformation continue to increase. This suggests that after the sample re-consolidates, shear-slip failure occurs, generating secondary fractures. These fractures further contribute to the overall degradation of the PFS, which leads to a residual strength stage where the material’s ability to withstand additional loading is significantly reduced.
3.2. Evolution Characteristics of Pore Size Distribution
3.2.1. Pore Classification
Figure 5 illustrates the T2 spectra under initial hydrostatic stress, displaying a characteristic three-peak distribution. Based on the traditional pore classification method [26,44], the left peak (T2 < 2.5 ms) corresponds to micropores and transition pores, categorized as adsorption pores (AP), which mainly influence the gas adsorption capacity. The middle peak (2.5 < T2 < 100 ms) represents mesopores, while the right peak (T2 > 100 ms) reflects macropores and microfractures, known as seepage pores and fractures (SP), which affect coal permeability. Under hydrostatic pressure, AP content is significantly higher than SP content. Throughout the experiment, the T2 peak shapes remained stable, while AP and SP peak areas shifted with deviatoric stress.
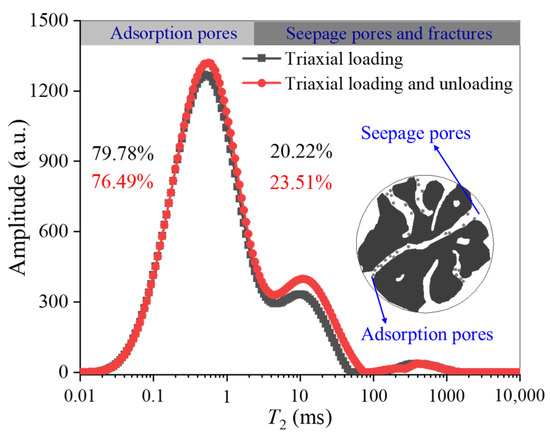
Figure 5.
Pore size distribution in coal under initial hydrostatic stress.
3.2.2. Triaxial Loading
To investigate the stress sensitivity of APs and SPs and assess the impact of deviatoric stress on the PFS, the following dimensionless coefficients were defined:
where SA, SS, and ST are dimensionless parameters representing the pore volumes of AP, SP, and total pores, respectively. SA0, SS0, and ST0 represent peak areas of the T2 spectrum under initial hydrostatic pressure, while SAi, SSi, and STi correspond to peak areas under deviatoric stress Pi.
Figure 6 shows that the AP porosity in the coal sample drops quickly in Stage I, then stabilizes, displaying minimal stress sensitivity with a maximum variation of under 3% throughout loading. This occurs because smaller pores are harder to compress [24]. Additionally, some SPs may be compacted into APs. The porosity of the SPs exhibits a distinct “V-shaped” evolution, gradually decreasing before yielding and then gradually increasing after yielding as deviatoric stress increases, which is consistent with the evolution trend of permeability [45]. The total porosity of the coal sample decreases rapidly in Stage I, remains relatively stable in Stage II, and gradually increases after yielding. This indicates that under pseudo-triaxial loading conditions, the coal sample’s compaction stage is mainly characterized by the compaction of primary FPS; the elastic stage is dominated by the compaction of SPs into APs; and the last two stages are primarily characterized by the gradual development of new SPs.
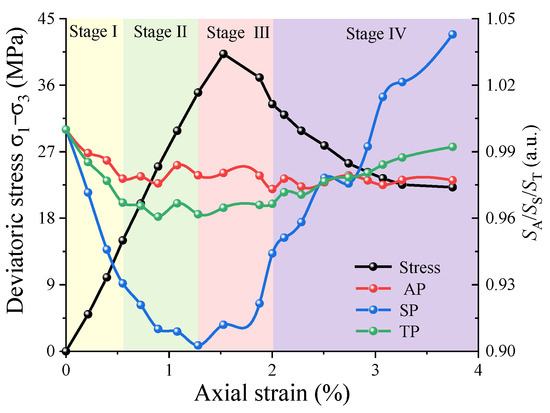
Figure 6.
Dimensionless content ratios of various pore types under varying axial strains.
3.2.3. Triaxial Loading and Unloading
This study evaluates the variations in adsorption, seepage, and total pore porosities using the absolute and relative porosity recovery rates. The absolute porosity recovery rate is the ratio of the post-unloading porosity under hydrostatic pressure in each cycle to the initial porosity:
where λa denotes the absolute porosity recovery rate, φ2n represents the post-unloading porosity under hydrostatic pressure in the nth cycle, and φ0 is the initial porosity, and the porosities are determined based on Equations (2) and (3), using the peak area of the T2 spectrum. The relative porosity recovery rate is the ratio of porosity after unloading to hydrostatic pressure in each cycle to the porosity under deviatoric stress in the same cycle:
where λr represents the relative porosity recovery rate, and φ2n-1 is the porosity under deviatoric stress in the nth cycle.
Figure 7 shows the evolution of the absolute porosity recovery rate and the relative porosity recovery rate of the coal sample under triaxial loading–unloading conditions. The relative and absolute recovery rates of AP show similar trends, with a significant increase in stages II and III. This is due to the gradual accumulation of damage and the gradual development of new APs. The absolute recovery rate of total porosity decreases rapidly in stage I, remains relatively stable in stage II, and increases rapidly after yielding. The relative recovery rate of total porosity gradually increases before yielding and remains relatively unchanged after yielding. This indicates that in the compaction stage, the primary compaction of original pores dominates, with compressed pores being difficult to recover after unloading. In the elastic stage, the conversion between SP and AP dominates, and most of the compressed pores can recover after unloading. After yielding, the generation of new pores dominates, with unloading enhancing their connectivity and opening. The absolute recovery rate of SP gradually decreases before yielding and increases rapidly after yielding, while the relative recovery rate of SP gradually increases before yielding and remains relatively stable after yielding. This is because, before yielding, the compaction of SP is dominant, and some SP can recover after unloading; after yielding, the generation of new SP is dominant, and unloading facilitates the connectivity and opening of pores.
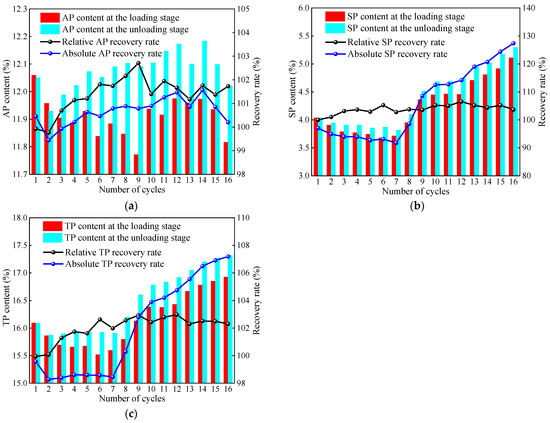
Figure 7.
Evolution of porosity recovery rates during triaxial cyclic loading–unloading: (a) adsorption pores; (b) seepage pores and fractures; (c) total pores.
The absolute recovery rate of total porosity decreases rapidly in Stage I, remains relatively stable in Stage II, and increases rapidly after yielding. The relative recovery rate of total porosity gradually increases before yielding and remains relatively unchanged after yielding. This suggests that during the compaction stage, original pores dominate, while compressed pores are difficult to recover after unloading. In the elastic stage, the conversion between SPs and APs dominates, and most of the compressed pores and fractures can recover after unloading. After yielding, the formation of new PFS becomes dominant, with unloading enhancing their connectivity and opening.
3.3. Evolution Characteristics of Average Pore Size
Variations in external mechanical conditions cause the pore size in the coal sample to change. According to Equation (1), for the same coal, the T2g is proportional to the geometric mean of the pore size and serves as a representative parameter to quantify pore size evolution. The calculation for T2g is given as follows:
Figure 8 illustrates the evolution of T2g across different stages of the triaxial loading process. The overall evolutionary trend of T2g is similar to that of porosity: it decreases initially and then increases as axial strain increases. During the early loading phase, as the deviatoric stress increases, some large pores are compressed into smaller ones, causing T2g to decrease gradually. However, the minimum value of T2g does not occur at peak stress but at the first test point after the peak. This is related to the evolution of the spatial distribution of the PFS mentioned in Section 3.1. When the sample first fails, not only does it generate a macro-crack, but a large number of new pores also form. These new pores are relatively small and have not yet connected to form larger pores, resulting in a decrease in T2g. As axial strain further increases, these newly formed pores and cracks gradually connect to form secondary fractures, causing T2g to increase.
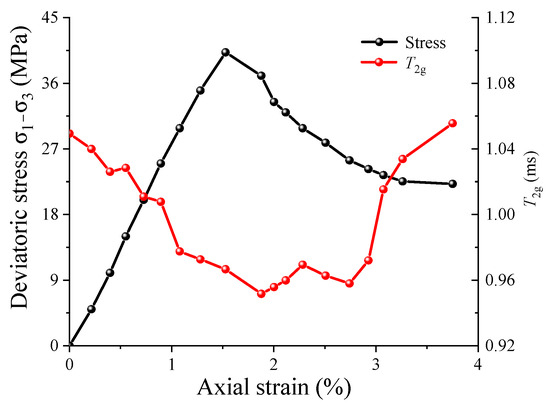
Figure 8.
T2g in coal samples under different axial strains.
To evaluate pore size changes in the coal sample under triaxial loading–unloading conditions, this section defines the absolute and relative recovery rates of T2g. The absolute recovery rate of T2g is the ratio of T2g after unloading to hydrostatic pressure at each cycling level compared to T2g at the initial hydrostatic pressure:
where γa denotes the absolute porosity recovery rate, (T2g)2n represents T2g after unloading to hydrostatic pressure at the nth cycling level, and (T2g)0 refers to T2g at initial hydrostatic pressure.
The relative recovery rate of T2g is the ratio of T2g after unloading to hydrostatic pressure at each cycling level to T2g at the specified deviatoric stress during that loading level:
where γr represents the relative recovery rate of T2g, and (T2g)2n−1 is the T2g at the nth cycling level under specified deviatoric stress.
Figure 9 illustrates the evolution of absolute and relative T2g recovery rates during triaxial loading–unloading conditions. Before entering the residual stage, the relative T2g recovery rate fluctuates within the range of 100–102%. This, combined with the evolution of pore size distribution, indicates that during these stages, although most flow pores can recover after unloading to hydrostatic pressure, a large number of new APs also form, making the T2g after unloading very close to that during loading. After entering the residual stage, the relative T2g recovery rate fluctuates within the range of 103–105%. This is because, during this stage, the connectivity and expansion of the PFS dominate, and some secondary fractures gradually form, causing the T2g after unloading to be higher than during loading.
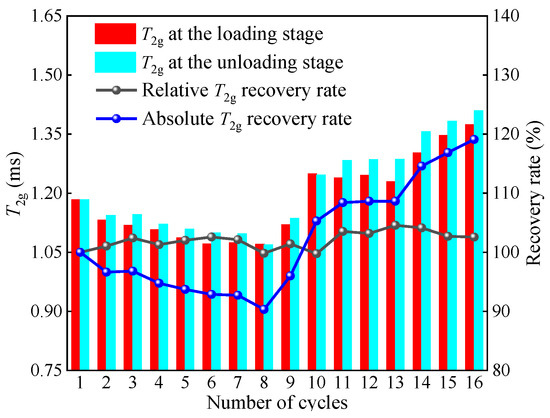
Figure 9.
Evolution of T2g recovery rates during cyclic loading–unloading.
The absolute T2g recovery rate initially decreases, then increases with cycling, ranging from 90% to 120%, which is greater than the range of change in the total porosity absolute recovery rate. Particularly during the decreasing phase, the absolute recovery rate of total porosity fluctuates around 98%, indicating that while the total porosity can recover after unloading, many of these are newly formed small pores with poor connectivity; some flow pores do not recover after being compressed.
3.4. Evolution Characteristics of Complexity
In recent years, the calculation of the fractal dimension of PFS based on T2 spectra has gained widespread application. The fundamental theories related to this and their relationship with PFS can be referenced in [35,36,37]. The calculation formula for the fractal dimension of PFS is as follows:
where SV represents the percentage of cumulative pore volume with transverse relaxation times less than T2 relative to the total pore volume; T2max refers to the maximum transverse relaxation time in milliseconds; and D denotes the fractal dimension of PFS. The PFS of coal samples generally exhibits multifractal characteristics, with APs and SPs each displaying their own fractal characteristics [26]. Specifically, the fractal dimension of APs, DA, reflects the structural characteristics of the APs in the coal sample. A higher DA indicates a more complex structure of the APs, resulting in a larger specific surface area and a stronger adsorption capacity [35,36,37]. Conversely, the fractal dimension of SPs, DS, represents the structural characteristics of the SPs. A higher DS suggests a more complex structure with poorer connectivity and lower permeability. Previous studies, such as that in reference [36], which involved extensive NMR and permeability tests on sandstone, have demonstrated a significant negative correlation between DS and permeability, establishing DS as a viable parameter for characterizing the seepage capacity of different samples.
Under varying stress conditions, both the SPs and APs in coal samples exhibit distinct fractal characteristics. Figure 10 illustrates the evolution of DA and DS in coal samples. Throughout the experiment, the range of DA varies from 1.68 to 1.76, while DS ranges from 2.964 to 2.980. The complexity of the APs in the coal samples decreases during the compaction phase and subsequently increases. In contrast, the complexity of the SPs increases prior to yielding and decreases thereafter; within the same cycle, the values of DS after loading and unloading are relatively close. It can be inferred that the seepage capacity of coal samples decreases before yielding and increases after yielding. This trend aligns with the evolution of permeability observed in conventional mechanical experiments on coal samples [45], suggesting that DS not only characterizes the seepage capacity of different samples [36] but also effectively represents the seepage capacity of the same sample under different stress conditions.
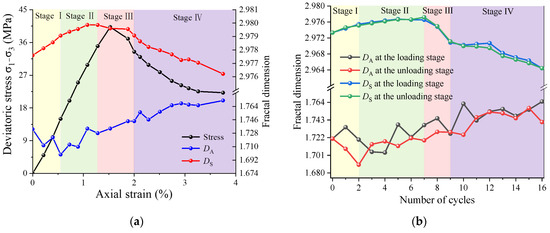
Figure 10.
Evolution in the fractal dimension: (a) triaxial loading; (b) triaxial loading and unloading.
It is noteworthy that the evolution patterns of porosity and fractal dimension for APs are similar, whereas for SPs, the evolution patterns of porosity and fractal dimension are opposite. This indicates that the complexity of the PFS in coal samples is not solely determined by porosity but also depends on the underlying causes of changes in porosity. Given that APs inherently have poor connectivity, their complexity is primarily influenced by the quantity of APs: fewer pores result in a simpler structure, while a greater number of pores leads to a more complex structure. After the compaction phase, the increase in the quantity of APs originates both from the emergence of new small pores and the compaction of larger pores, inevitably increasing the complexity of the AP structure. In contrast, SPs exhibit better connectivity than APs, and their complexity is mainly governed by connectivity: better connectivity results in a simpler structure, while poorer connectivity leads to increased complexity. Before yielding, as large pores are compressed and their diameters decrease, the original seepage channels are disrupted, reducing connectivity and increasing the complexity of the SPs. After yielding, newly formed fractures gradually connect, improving connectivity, and new seepage channels begin to form, thereby reducing the complexity of the SPs.
Based on the above analysis, we can deduce the microscopic mechanism underlying the evolution of coal sample permeability under triaxial loading conditions: prior to yielding, the porosity of SPs in coal samples decreases, connectivity worsens, complexity increases, and the average pore diameter reduces, all of which contribute to a decrease in permeability. After yielding, the porosity of SPs increases, connectivity improves, complexity decreases, and the average pore diameter enlarges, leading to an increase in permeability.
As demonstrated by Wang et al. [45], during cyclic loading and unloading, permeability does not fully recover upon unloading, and its recovery is notably less than that of strain. In fact, the recovery of permeability is even smaller than the restoration of the flow pore porosity. Although porosity can recover to some degree, connectivity and complexity remain irreversibly altered. Therefore, understanding the evolution of the pore-fracture structure during cyclic loading and unloading is essential for uncovering the microscopic mechanisms driving permeability evolution. This highlights the unique aspect of our study—emphasizing the complex and irreversible nature of permeability recovery, which is less commonly addressed in previous research.
4. Evolution Characteristics of Energy in Coal
The energy dissipation ratio is frequently employed to analyze deformation and failure behaviours. Throughout the process of deformation and failure, energy is both accumulated and dissipated. During loading, the coal sample undergoes deformation due to external forces, absorbing energy. A portion of this energy is retained as elastic energy within the sample, while the remainder is dissipated. The total energy can be expressed as follows:
where W represents the total external work input, Ue is the elastic energy, and Ud is the energy dissipated due to closure, generation, and the expansion of Aps and SPs. The relevant fundamental theories and detailed calculation methods can be referenced in [45,46]. In this study, energy transformation during different stages of triaxial loading and unloading was examined through the energy dissipation ratio, which is defined as follows:
In the equation, η denotes the energy dissipation ratio. As illustrated in Figure 11, the dissipation ratio decreases gradually before yielding, stabilizes, and then increases prior to failure, and it remains stable during the residual strength stage. This behaviour shows a strong correlation with the evolution of the sample’s porosity:
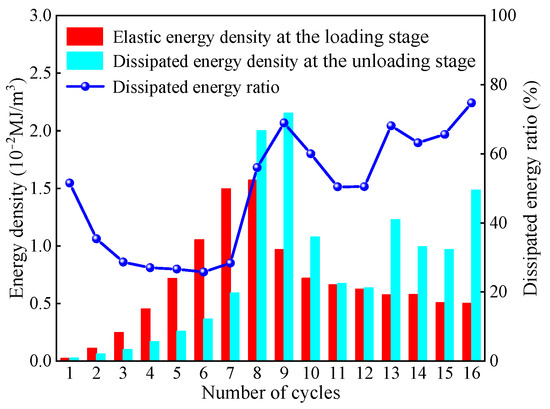
Figure 11.
Evolution in the total energy, dissipated energy, and dissipated energy ratio under cyclic loading–unloading.
- In Stage I, some pores and fractures are compacted, most of which are irrecoverable. The closure of these pores and fractures results in plastic deformation, leading to a higher energy dissipation ratio.
- In Stage II, some pores and fractures are compacted but can recover after unloading, and most pores undergo elastic deformation. This results in a lower and stable energy dissipation ratio.
- In Stage III, a large number of pores and fractures gradually form and interconnect. The coal sample can no longer bear the entire load, leading to extensive plastic deformation. Consequently, its energy storage capacity gradually decreases, the stored elastic energy is reduced, and both the energy dissipation and the energy dissipation ratio increase sharply.
- In Stage IV, the coal sample’s energy storage capacity diminishes, and the generation of secondary pores and fractures consumes a large amount of energy, causing the energy dissipation ratio to remain at a high level.
5. Correlation Between Porosity of Seepage Pores and Axial Strain in Coal
The permeability can essentially be regarded as a function of factors such as porosity and tortuosity, with a high correlation between seepage porosity and coal sample permeability [28,47]. Therefore, investigating the correlation between seepage porosity and axial strain in coal samples is crucial for fundamentally understanding the evolution of permeability. In this study, the seepage porosity and axial strain under triaxial loading and unloading conditions are plotted in Figure 12.
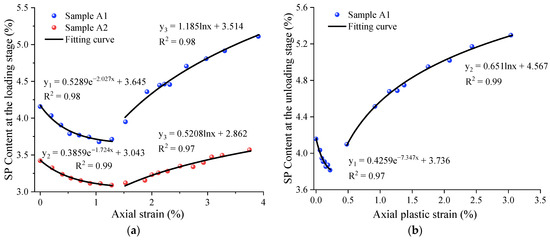
Figure 12.
Relationship between porosity and axial strain: (a) at the loading stage; (b) at the unloading stage.
From Figure 12, it can be observed that the relationship between seepage porosity and axial strain in coal samples before yielding can be simply described using a negative exponential function:
where a, b, and c are the fitting parameters, and ε represents the axial strain. After yielding, the relationship between seepage porosity and axial strain in coal samples can be simply described using a logarithmic function:
where m and n are the fitting parameters. The fitting results are presented in Figure 12, with all fitting accuracies R2 exceeding 0.97, indicating a strong correlation between seepage porosity and axial strain throughout the entire loading process. It can also be observed that although the residual axial strain before yielding is relatively small, the reduction in seepage porosity after unloading to hydrostatic pressure remains significant. This is because the pores and fractures compressed during the compaction stage are difficult to recover after unloading.
6. Conclusions
This study employs NMR technology to conduct pseudo-triaxial loading and triaxial loading–unloading experiments on coal samples, with the real-time monitoring of T2 relaxation times and nuclear magnetic resonance imaging of the coal samples. By defining porosity recovery rate, residual deformation, and dissipation energy ratio, the fractal dimensions of pores and fissures were calculated, leading to the following conclusions:
- During the compaction phase of pseudo-triaxial loading and unloading, the primary mechanism is the compaction of the original pores and fractures, which are difficult to recover after unloading. In the elastic phase, the main mechanism involves the mutual transformation between SPs and APs, most of which can recover after unloading. After yielding, new pores and fissures are mainly generated, and unloading promotes the connectivity and opening of these pores and fractures.
- With the increase in loading cycles, the porosity of SPs in coal samples decreases with increasing axial strain before yielding, exhibiting a good negative exponential function relationship. After yielding, the porosity increases with increasing axial strain, showing a good logarithmic function relationship.
- Under different stress conditions, both APs and SPs exhibit distinct fractal characteristics. The fractal dimension of APs decreases during the compaction phase and gradually increases afterward, while the fractal dimension of SPs decreases before yielding and increases after yielding, reflecting changes in pore complexity and permeability.
- Before yielding, the energy dissipation ratio is high due to irreversible compaction and plastic deformation. After yielding, the energy dissipation ratio increases sharply as a result of extensive plastic deformation and pore-fracture generation, with the ratio remaining elevated during the residual strength stage. These findings indicate that energy dissipation and permeability are closely linked to pore structure evolution.
- However, this study primarily focused on mechanical loading effects. Future work should consider the combined influence of temperature, chemical factors, and more complex stress paths that reflect real-world mining scenarios. Expanding this research to include different coal types and deeper strata conditions would help improve the generalizability of the findings.
Author Contributions
Conceptualization, T.S. and Z.L.; methodology, Z.L. and S.X.; software, Z.L.; validation, Z.L., Y.Y. and T.S.; formal analysis, Z.L.; investigation, Z.L.; resources, Y.Y.; data curation, Z.L.; writing—original draft preparation, Z.L.; writing—review and editing, S.X. and T.S.; visualization, Z.L.; supervision, T.S.; project administration, Y.Y.; funding acquisition, Y.Y. All authors have read and agreed to the published version of the manuscript.
Funding
This research was partially supported by the National Natural Science Foundation of China (Grant: No. 12050001).
Data Availability Statement
Data are contained within the article.
Acknowledgments
We thank Lei Song for the helpful discussion on this topic.
Conflicts of Interest
The authors declare no conflicts of interest.
Abbreviations
The following abbreviations are used in this manuscript:
| PFS | Pore-Fracture Structure |
| PSD | Pore Size Distribution |
| CT | X-Ray Computed Tomography |
| SEM | Scanning Electron Microscopy |
| AE | Acoustic Emission |
| NMR | Nuclear Magnetic Resonance |
| NMRI | Nuclear Magnetic Resonance Imaging |
| CPMG | Carr–Purcell–Meiboom–Gill |
| AP | Adsorption Pores |
| SP | Seepage Pores and Fractures |
References
- Flores, R.M. Coalbed Methane: From Hazard to Resource. Int. J. Coal Geol. 1998, 35, 3–26. [Google Scholar] [CrossRef]
- Cai, J.; Perfect, E.; Cheng, C.-L.; Hu, X. Generalized Modeling of Spontaneous Imbibition Based on Hagen–Poiseuille Flow in Tortuous Capillaries with Variably Shaped Apertures. Langmuir 2014, 30, 5142–5151. [Google Scholar] [CrossRef] [PubMed]
- Kozhevnikov, E.; Turbakov, M.; Riabokon, E.; Gladkikh, E.; Guzev, M.; Qi, C.; Li, X. The Mechanism of Porous Reservoir Permeability Deterioration Due to Pore Pressure Decrease. Adv. Geo-Energy Res. 2024, 13, 96–105. [Google Scholar] [CrossRef]
- Zou, M.J.; Wei, C.T.; Huang, Z.Q.; Wei, S. Porosity Type Analysis and Permeability Model for Micro-Trans-Pores, Meso-Macro-Pores and Cleats of Coal Samples. J. Nat. Gas Sci. Eng. 2015, 27, 776–784. [Google Scholar] [CrossRef]
- Jia, Q.; Liu, D.; Cai, Y.; Yao, Y.; Lu, Y.; Zhou, Y. Variation of Adsorption Effects in Coals with Different Particle Sizes Induced by Differences in Microscopic Adhesion. Chem. Eng. J. 2023, 452, 139511. [Google Scholar] [CrossRef]
- Liu, D.; Zhao, Z.; Cai, Y.; Sun, F. Characterizing Coal Gas Reservoirs: A Multiparametric Evaluation Based on Geological and Geophysical Methods. Gondwana Res. 2024, 133, 91–107. [Google Scholar] [CrossRef]
- Cai, Y.; Liu, D.; Pan, Z.; Yao, Y.; Li, J.; Qiu, Y. Pore Structure and Its Impact on CH4 Adsorption Capacity and Flow Capability of Bituminous and Subbituminous Coals from Northeast China. Fuel 2013, 103, 258–268. [Google Scholar] [CrossRef]
- Qin, X.; Wu, J.; Xia, Y.; Wang, H.; Cai, J. Multicomponent Image-Based Modeling of Water Flow in Heterogeneous Wet Shale Nanopores. Energy 2024, 298, 131367. [Google Scholar] [CrossRef]
- Wu, R.; Wei, B.; Li, S.; Zhang, Y.; Luo, Q. Enhanced Oil Recovery in Complex Reservoirs: Challenges and Methods. Adv. Geo-Energy Res. 2023, 10, 208–212. [Google Scholar] [CrossRef]
- Zhao, Y.; Wang, Y.; Wang, W.; Tang, L.; Liu, Q.; Cheng, G. Modeling of Rheological Fracture Behavior of Rock Cracks Subjected to Hydraulic Pressure and Far Field Stresses. Theor. Appl. Fract. Mech. 2019, 101, 59–66. [Google Scholar] [CrossRef]
- Zhang, M.; Duan, C.C.; Li, G.F.; Fu, X.; Zhong, Q.; Liu, H.; Dong, Z. Determinations of the Multifractal Characteristics of the Pore Structures of Low-, Middle-, and High-Rank Coal Using High-Pressure Mercury Injection. J. Pet. Sci. Eng. 2021, 203, 108656. [Google Scholar] [CrossRef]
- Zhang, B.; Chen, Y.L. Particle Size Effect on Pore Structure Characteristics of Lignite Determined via Low-Temperature Nitrogen Adsorption. J. Nat. Gas Sci. Eng. 2020, 84, 103633. [Google Scholar] [CrossRef]
- Meng, Y.; Li, Z.P.; Lai, F.P. Experimental Study on Porosity and Permeability of Anthracite Coal under Different Stresses. J. Pet. Sci. Eng. 2015, 133, 810–817. [Google Scholar] [CrossRef]
- Ju, Y.; Xi, C.D.; Zhang, Y.; Mao, L.; Gao, F.; Xie, H. Laboratory In Situ CT Observation of the Evolution of 3D Fracture Networks in Coal Subjected to Confining Pressures and Axial Compressive Loads: A Novel Approach. Rock Mech. Rock Eng. 2018, 51, 3361–3375. [Google Scholar] [CrossRef]
- Tan, L.; Ren, T.; Dou, L.; Sun, J.; Yang, X.; Qiao, M. Moisture Penetration and Distribution Characterization of Hard Coal: A µ-CT Study. Int. J. Coal Sci. Technol. 2024, 11, 55. [Google Scholar] [CrossRef]
- Xu, H.; Wang, G.; Fan, C.; Liu, X.; Wu, M. Grain-Scale Reconstruction and Simulation of Coal Mechanical Deformation and Failure Behaviors Using Combined SEM Digital Rock Data and DEM Simulator. Powder Technol. 2020, 360, 1305–1320. [Google Scholar] [CrossRef]
- Chalmers, G.R.; Bustin, R.M.; Power, I.M. Characterization of Gas Shale Pore Systems by Porosimetry, Pycnometry, Surface Area, and Field Emission Scanning Electron Microscopy/Transmission Electron Microscopy Image Analyses: Examples from the Barnett, Woodford, Haynesville, Marcellus, and Doig Units. Bulletin 2012, 96, 1099–1119. [Google Scholar] [CrossRef]
- Wang, T.; Liu, Z.; Liu, L. Investigating a Three-Dimensional Convolution Recognition Model for Acoustic Emission Signal Analysis during Uniaxial Compression Failure of Coal. Geomat. Nat. Hazards Risk 2024, 15, 2322483. [Google Scholar] [CrossRef]
- He, M.C.; Miao, J.L.; Feng, J.L. Rock Burst Process of Limestone and Its Acoustic Emission Characteristics under True-Triaxial Unloading Conditions. Int. J. Rock Mech. Min. Sci. 2010, 47, 286–298. [Google Scholar] [CrossRef]
- Huang, Z.; Gu, Q.X.; Wu, Y.F.; Wu, Y.; Li, S.; Zhao, K.; Zhang, R. Effects of Confining Pressure on Acoustic Emission and Failure Characteristics of Sandstone. Int. J. Coal Sci. Technol. 2021, 31, 963–974. [Google Scholar] [CrossRef]
- Zhao, Y.; Wang, C.; Ning, L.; Zhao, H.; Bi, J. Pore and Fracture Development in Coal under Stress Conditions Based on Nuclear Magnetic Resonance and Fractal Theory. Fuel 2022, 309, 122112. [Google Scholar] [CrossRef]
- Bi, J.; Ning, L.; Zhao, Y.; Wu, Z.; Wang, C. Analysis of the Microscopic Evolution of Rock Damage Based on Real-Time Nuclear Magnetic Resonance. Rock Mech. Rock Eng. 2023, 56, 3399–3411. [Google Scholar] [CrossRef]
- Lian, S.; Wan, W.; Zhao, Y.; Peng, W.; Du, C.; Hu, H. Study on the Damage Mechanism and Evolution Model of Preloaded Sandstone Subjected to Freezing–Thawing Action Based on the NMR Technology. Rev. Adv. Mater. Sci. 2024, 63, 20240034. [Google Scholar] [CrossRef]
- Li, X.; Fu, X.H.; Ranjith, P.G.; Xu, J. Stress Sensitivity of Medium- and High Volatile Bituminous Coal: An Experimental Study Based on Nuclear Magnetic Resonance and Permeability-Porosity Tests. J. Pet. Sci. Eng. 2019, 172, 889–910. [Google Scholar] [CrossRef]
- Cheng, M.; Fu, X.H.; Kang, J.Q. Compressibility of Different Pore and Fracture Structures and Its Relationship with Heterogeneity and Minerals in Low-Rank Coal Reservoirs: An Experimental Study Based on Nuclear Magnetic Resonance and Micro-CT. Energy Fuels 2020, 34, 10894–10903. [Google Scholar] [CrossRef]
- Zhou, H.W.; Liu, Z.L.; Zhong, J.C.; Chen, B.C.; Zhao, J.W.; Xue, D.J. NMRI Online Observation of Coal Fracture and Pore Structure Evolution under Confining Pressure and Axial Compressive Loads: A Novel Approach. Energy 2022, 261, 125297. [Google Scholar] [CrossRef]
- Zhao, Y.; Zhu, G.; Dong, Y.; Danesh, N.N.; Chen, Z.; Zhang, T. Comparison of Low-Field NMR and Microfocus X-Ray Computed Tomography in Fractal Characterization of Pores in Artificial Cores. Fuel 2017, 210, 217–226. [Google Scholar] [CrossRef]
- Yao, Y.B.; Liu, D.M.; Che, Y.; Tang, D.; Tang, S.; Huang, W. Petrophysical Characterization of Coals by Low-Field Nuclear Magnetic Resonance (NMR). Fuel 2010, 89, 1371–1380. [Google Scholar] [CrossRef]
- Cai, J.; Yu, B.; Zou, M.; Luo, L. Fractal Characterization of Spontaneous Co-Current Imbibition in Porous Media. Energy Fuels 2010, 24, 1860–1867. [Google Scholar] [CrossRef]
- Li, Z.T.; Liu, D.M.; Cai, Y.D.; Wang, Y.; Si, G. Evaluation of Coal Petrophysics Incorporating Fractal Characteristics by Mercury Intrusion Porosimetry and Low-Field NMR. Fuel 2020, 263, 116802. [Google Scholar] [CrossRef]
- Ouyang, Z.Q.; Liu, D.M.; Cai, Y.D.; Yao, Y. Fractal Analysis on Heterogeneity of Pore–Fractures in Middle–High Rank Coals with NMR. Energy Fuels 2016, 30, 5449–5458. [Google Scholar] [CrossRef]
- Zhou, S.D.; Liu, D.M.; Cai, Y.D.; Yao, Y. Fractal Characterization of Pore–Fracture in Low-Rank Coals Using a Low-Field NMR Relaxation Method. Fuel 2016, 181, 218–226. [Google Scholar] [CrossRef]
- Zheng, S.J.; Yao, Y.B.; Liu, D.M.; Cai, Y.; Liu, Y. Characterizations of Full-Scale Pore Size Distribution, Porosity and Permeability of Coals: A Novel Methodology by Nuclear Magnetic Resonance and Fractal Analysis Theory. Int. J. Coal Geol. 2018, 196, 148–158. [Google Scholar] [CrossRef]
- Cai, J.; Hu, X.; Standnes, D.C.; You, L. An Analytical Model for Spontaneous Imbibition in Fractal Porous Media Including Gravity. Colloids Surf. A Physicochem. Eng. Asp. 2012, 414, 228–233. [Google Scholar] [CrossRef]
- Zhou, H.; Xie, H. Fractal Description of Porosity and Specific Surface Area of Porous Media. J. Xi’an Inst. Min. Technol. 1997, 17, 97–102. [Google Scholar]
- Peng, L.; Zhang, C.; Ma, H.L.; Pan, H. Estimating Irreducible Water Saturation and Permeability of Sandstones from Nuclear Magnetic Resonance Measurements by Fractal Analysis. Mar. Pet. Geol. 2019, 110, 565–574. [Google Scholar] [CrossRef]
- Chen, H.; Tang, D.Z.; Li, S.; Xu, H.; Tao, S.; Wang, J.; Liu, Y. Dynamic Evaluation of Heterogeneity in Pore-Fracture System of Different Rank Coals under Different Confining Pressure Based on Low-Field NMR. Energy Sources Part A Recovery Util. Environ. Eff. 2021, 43, 1620–1634. [Google Scholar] [CrossRef]
- Zhou, H.W.; Liu, Z.L.; Zhao, J.W.; Chen, B.C.; Li, X.N.; Zhong, J.C. In-Situ Observation and Modeling Approach to Evolution of Pore-Fracture Structure in Coal. Int. J. Coal Sci. Technol. 2023, 33, 265–274. [Google Scholar] [CrossRef]
- Mitra, P.P.; Sen, P.N. Effects of Microgeometry and Surface Relaxation on NMR Pulsed-Field-Gradient Experiments: Simple Pore Geometries. Phys. Rev. B 1992, 45, 143–156. [Google Scholar] [CrossRef]
- Kenyon, W.E. Nuclear Magnetic Resonance as a Petrophysical Measurement. Int. J. Radiat. Appl. Instrumentation. Part E. Nucl. Geophys. 1992, 6, 153–171. [Google Scholar] [CrossRef]
- Xu, H.; Tang, D.Z.; Chen, Y.P.; Ming, Y.; Chen, X.; Qu, H.; Yuan, Y.; Li, S.; Tao, S. Effective Porosity in Lignite Using Kerosene with Low-Field Nuclear Magnetic Resonance. Fuel 2018, 213, 158–163. [Google Scholar] [CrossRef]
- Kleinberg, R.L.; Vinegar, H.J. NMR Properties of Reservoir Fluids. Log Anal. 1996, 37, 20–32. [Google Scholar]
- Cai, M.; Zhao, X.; Kaiser, P.K. On Field Strength of Massive Rocks. Chin. J. Rock Mech. Eng. 2014, 33, 1–13. [Google Scholar]
- Xu, L.; Li, Q.; Myers, M.; Tan, Y.; Chen, Q.; Li, X. Flow Behavior Characteristics and Residual Trapping of Supercritical Carbon Dioxide in Tight Glutenite by MRI Experiments. J. Nat. Gas Sci. Eng. 2020, 83, 103540. [Google Scholar] [CrossRef]
- Zhou, H.W.; Wang, X.Y.; Zhang, L.; Zhong, J.C.; Wang, Z.H.; Rong, T.L. Permeability Evolution of Deep Coal Samples Subjected to Energy-Based Damage Variable. J. Nat. Gas Sci. Eng. 2020, 73, 103070. [Google Scholar] [CrossRef]
- Dai, B.; Zhao, G.; Konietzky, H.; Wasantha, P.L.P. Experimental Investigation on Damage Evolution Behaviour of a Granitic Rock under Loading and Unloading. J. Cent. S. Univ. 2018, 25, 1213–1225. [Google Scholar] [CrossRef]
- Li, Y.; Xu, T.; Xin, X.; Xia, Y.; Zhu, H.; Yuan, Y. Multi-Scale Comprehensive Study of the Dynamic Evolution of Permeability during Hydrate Dissociation in Clayey Silt Hydrate-Bearing Sediments. Adv. Geo-Energy Res. 2024, 12, 127–140. [Google Scholar] [CrossRef]
Disclaimer/Publisher’s Note: The statements, opinions and data contained in all publications are solely those of the individual author(s) and contributor(s) and not of MDPI and/or the editor(s). MDPI and/or the editor(s) disclaim responsibility for any injury to people or property resulting from any ideas, methods, instructions or products referred to in the content. |
© 2025 by the authors. Licensee MDPI, Basel, Switzerland. This article is an open access article distributed under the terms and conditions of the Creative Commons Attribution (CC BY) license (https://creativecommons.org/licenses/by/4.0/).